Review

Principles, Applications, and Future Evolution of Agricultural Nondestructive Testing Based on Microwaves

School of Electrical and Information Engineering, Jiangsu University, Zhenjiang 212013, China
*
Author to whom correspondence should be addressed.
Sensors 2025, 25(15), 4783; https://doi.org/10.3390/s25154783
Submission received: 1 July 2025 / Revised: 29 July 2025 / Accepted: 1 August 2025 / Published: 3 August 2025
(This article belongs to the Section Smart Agriculture)

Abstract

Agricultural nondestructive testing technology is pivotal in safeguarding food quality assurance, safety monitoring, and supply chain transparency. While conventional optical methods such as near-infrared spectroscopy and hyperspectral imaging demonstrate proficiency in surface composition analysis, their constrained penetration depth and environmental sensitivity limit effectiveness in dynamic agricultural inspections. This review highlights the transformative potential of microwave technologies, systematically examining their operational principles, current implementations, and developmental trajectories for agricultural quality control. Microwave technology leverages dielectric response mechanisms to overcome traditional limitations, such as low-frequency penetration for grain silo moisture testing and high-frequency multi-parameter analysis, enabling simultaneous detection of moisture gradients, density variations, and foreign contaminants. Established applications span moisture quantification in cereal grains, oilseed crops, and plant tissues, while emerging implementations address storage condition monitoring, mycotoxin detection, and adulteration screening. The high-frequency branch of the microwave–millimeter wave systems enhances analytical precision through molecular resonance effects and sub-millimeter spatial resolution, achieving trace-level contaminant identification. Current challenges focus on three areas: excessive absorption of low-frequency microwaves by high-moisture agricultural products, significant path loss of microwave high-frequency signals in complex environments, and the lack of a standardized dielectric database. In the future, it is essential to develop low-cost, highly sensitive, and portable systems based on solid-state microelectronics and metamaterials, and to utilize IoT and 6G communications to enable dynamic monitoring. This review not only consolidates the state-of-the-art but also identifies future innovation pathways, providing a roadmap for scalable deployment of next-generation agricultural NDT systems.

1. Introduction

1.1. Comparison of Microwave Technology with Traditional Technology and New Needs for Agricultural Testing

The quality and safety of agricultural products has always been the cornerstone of the sustainability of the global food system and public health [1,2], and the innovation of its detection technology will play a key role in guaranteeing the traceability of the supply chain, reducing the risk of foodborne diseases [3,4] and enhancing the competitiveness of international trade. According to the statistics of the Food and Agriculture Organization of the United Nations (FAO), the global economic loss due to food contamination exceeds hundreds of billions of dollars every year, which highlights the urgent need for efficient nondestructive testing technology for agricultural products [5].
In recent years, techniques such as near-infrared spectroscopy (NIR) [6,7], hyperspectral imaging (HSI) [8,9] and terahertz time domain spectroscopy (THz-TDS) have been mostly used in nondestructive testing of agricultural products, but the boundaries of their application are more limited, and they are mostly used for the analysis of surface components, which need to be considered in conjunction with the specific content of agricultural product testing. As shown in Figure 1, the above techniques mainly cover the optical band of the electromagnetic spectrum. The microwave (300 MHz–30 GHz) and millimeter wave (30–300 GHz) techniques highlighted in this paper are located in the low frequency band of the electromagnetic spectrum, and due to their unique physical properties, they can penetrate the shell of agricultural products and detect the internal properties of agricultural products through the dielectric response mechanism.
The following section briefly describes the application scenarios of conventional technologies and compares them with microwave and millimeter wave technologies to clarify the different application directions of each technology and to highlight the superiority of microwave technologies.
Near-infrared (NIR) and mid-infrared (MIR) spectroscopic techniques [10,11] based on molecular vibrations with rotational energy level jumps [12,13], utilizing electromagnetic waves in the 780–2500 nm band with generalized or combined-frequency vibrations of chemical bonds [14], combined with improved clustering algorithms, have been implemented to analyze the compositions of the surface of agricultural products (e.g., apple varieties [15], tea varieties [16,17,18,19], and edible oils [20]). The Fourier transform infrared spectroscopy (FTIR) technique, based on the reconstruction of time domain spectra by the Meikle Sun interferometer [21,22], can support the analysis of trace samples [23,24,25]. However, the NIR technique is limited by the depth of penetration and is mostly used for quantitative analysis of surface composition in a laboratory setting [26,27,28]; it is dependent on the surface finish of the samples [29]; the spectral covariance of high-complexity samples [30,31] also requires complex preprocessing preprocessing steps [32]; and it usually requires long acquisition times [33,34], which restricts it from operating robustly in dynamic agricultural environments in the field [35,36]. Therefore, microwave technology with deep penetration capability is needed to complement it.
Hyperspectral imaging (HSI) is a technology that simultaneously acquires multi-band high-resolution images [37] through fusion of imaging and spectral analysis [38,39,40], and constructs three-dimensional data containing spectral–spatial information [41]. HSI is useful in monitoring crop diseases and visualizing compositional distributions [42,43] (classification of white star disease in tea [44], identification of wolfberries [45]), quantification of food components and quality analysis (e.g., soluble solids [46], degree of lipid oxidation [47,48], and detection of fruit sugars [49]), as well as in the assessment of crop storage conditions and authenticity verification (seed viability detection [50,51,52], meat freshness assessment [53,54,55], and tea species identification), etc. However, HSI often needs to [56] incorporate complex deep learning algorithms [57], and the processing of high-dimensional data leads to a lack of real-time measurement [58]; moreover, its complex optical system equipment limits deployment flexibility [59,60]. In contrast, microwave technology can achieve rapid detection of multiple parameters such as moisture and density through multi-frequency synergy and lightweight algorithms.
In addition, terahertz time domain spectroscopy (THz-TDS) is based on the interaction (absorption, scattering, and phase change) of electromagnetic waves in the 0.1–10 THz band with matter, and resolves the vibrational and rotational energy level jump characteristics of polar molecules through the dipole moment resonance effect to achieve quantitative and qualitative compositional analysis [61,62]. Although THz-TDS is excellent for crop health monitoring (e.g., tomato moisture prediction [63], apple blight diagnosis [64]), food safety screening (e.g., metal contaminant localization [65], pesticide residue identification [66]), and analysis of high-value-added agricultural commodities [67,68], the high-frequency signal attenuation, complex and expensive hardware (femtosecond lasers, cryo-detectors) [69], and the scattering effect due to the heterogeneous samples (e.g., soil–crop mixtures) make it difficult for field applicability. The effects in heterogeneous samples (e.g., soil–crop mixtures) result in limited field applicability. In contrast, microwave technology provides a cost-effective solution for grain storage detection by balancing low-frequency penetration with high-frequency resolution, combined with low-cost hardware and metamaterial enhancement.
A detailed technology comparison of the previous technology in different dimensions can be seen in Table 1. For agricultural products, nondestructive testing provides a solution; however, for agricultural scenarios, there is an urgent need to solve the difficulties of grain silo real-time monitoring, dynamic anti-interference, and field deployment [70]. This study, which contributes to the microwave and millimeter wave technology field, shows a stronger suitability [71]. The core advantage of the technology is that, based on the dielectric response characteristics, it can synchronize moisture, density, and foreign matter and other parameters of the integrated detection, significantly improving detection efficiency. The deep penetration ability of the low-frequency band breaks through the bottleneck of the existing technology that is limited to surface analysis, and it can non-invasively analyze the internal information of the material [72], while the high-frequency band can realize sub-millimeter defect identification [73]; this technology demonstrates strong environmental adaptability, and can be stably applied to dust, temperature and humidity fluctuations in complex field scenes [74]. In recent years, microwave sensors based on planar circuits—such as microstrip lines and coplanar waveguides—have advanced significantly. For example, metamaterial-enhanced coupling designs have markedly improved sensitivity, enabling the reliable identification of subtle quality changes [75]. These planar microwave sensors are compact, readily integrable, highly tailorable, and fully compatible with CMOS processes, thereby providing critical technological support for the development of low-cost, portable microwave systems for agricultural nondestructive testing [76]. The future of hardware innovation and process integration will significantly reduce the cost of the equipment and the size of the device, so as to make it more portable and potentially suitable for large-scale applications [77].

1.2. Objectives of the Review

This review aims to systematically analyze the principle, application progress, and future development direction of microwave and millimeter wave technology in agricultural nondestructive testing, and to provide a technical route reference for the construction of an intelligent and high-precision agricultural nondestructive testing system [79].

2. Core Mechanisms and Agricultural Adaptability of Microwave Technology

2.1. The Physical Basis of Microwave Detection

In the application of microwave technology to the nondestructive testing of agricultural products, the complex dielectric constant ( ε   =   ε j ε ) of agricultural products is used as the core physical parameter, where the real part ε reflects the energy storage capacity of the medium, and the imaginary part ε characterizes the dielectric loss factor, which together characterize the electromagnetic response properties of the material. In the low-frequency band (1–10 GHz), dielectric loss ( ε ) is dominated by ionic conductivity ( σ ω ε 0 ) and dipolar relaxation described by the Debye model ( ( ε s ε ) ω τ 1 + ω 2 τ 2 ). In contrast, high-frequency millimeter waves (>30 GHz) excite quantized molecular rotational transitions via the photon energy E   =   h ν , producing frequency-selective dielectric fingerprints (e.g., the 24 GHz resonance peak of water and the 240 GHz characteristic absorption of AFB1) [80]. Typically, moisture content is the dominant factor governing the dielectric properties of paddy rice. As moisture increases, both the real ( ε ) and imaginary ( ε ) parts of the permittivity rise, leading to stronger microwave energy absorption [81]. The energy dissipation therein is mostly characterized by the loss tangent t a n δ   =   ε ε , which is higher in moisture-rich agricultural products, which undoubtedly exacerbates the microwave attenuation [82,83,84]. In addition, the ε and ε of a material determine its reflection coefficient (S11) and transmission coefficient (S21), and the electrical characteristics can also be inversely characterized by measuring these parameters [85]. Alternatively, when a microwave sensor (e.g., microstrip patch antenna, resonant cavity) is in contact with a sample, the dielectric properties of the sample change its resonant frequency, thereby resolving the dielectric constant and flow parameters of the liquid [86].
Many factors influence the dielectric properties of agricultural products; we detail them below. Firstly, water molecules are strongly polar. Free water exhibits pronounced dielectric relaxation loss at higher frequencies [87]. In peanuts, barley, walnuts, and other agricultural products, the dielectric constant rises markedly with increasing moisture content. Secondly, protein content also influences dielectric behavior [88]. Proteins contain polar groups and form hydrogen bonds with water, thereby altering the state and relaxation dynamics of bound water. The interaction between protein components in surimi seafood and microwave processing is a representative example [89]. Temperature further modifies dielectric properties by changing molecular thermal motion and the relaxation time of water. Frequency is another key factor, because both permittivity and loss factor are frequency-dependent, and the dominant loss mechanism may vary with frequency [90]. Density and packing state determine the number and arrangement of polar molecules per unit volume, affecting the overall dielectric response; these parameters must therefore be considered as potential interference factors in microwave sensing. Finally, the material’s physical structure—particle size, shape, and porosity—affects the propagation path and scattering of electromagnetic waves, and consequently the meas A Modified Formula for Calculating Dielectric Properties of Granular Agricultural Products in the Microwave Band [91].
In terms of penetration properties, microwaves can penetrate through non-conductive shells to the interior. It is worth mentioning that there is a close relationship between the microwave penetration rate and the frequency of use and the complex permittivity of the medium, which forms the theoretical basis of the detection method [92]. When microwave radiation passes through an agricultural medium, the penetration depth δ p represents the distance traveled when the microwave energy is attenuated to 1 e (about 36.8%) of its surface value, and is mainly determined by the operating frequency and the dielectric loss, which can be described by a simplified equation: penetration depth δ p 1 f ε t a n δ [93]. In NDT practice, this limits the choice of operating frequencies. The essence of frequency selection lies in balancing three factors: penetration depth, spatial resolution, and molecular specificity. The microwave photon energy ( E   =   h ν , where h is Planck’s constant and ν is the photon frequency) must match the rotational energy-level spacing E of a molecule to trigger a quantum transition; for example, the rotational level spacing of a water molecule ( E 10 3 eV ) corresponds to the millimeter wave band [94]. Low-frequency microwaves (1–10 GHz) drive ion migration and dipole relaxation through an alternating electric field (relaxation time τ 1 / ( 2 π f ) ), whereas high-frequency millimeter waves (>30 GHz) possess photon energies E > k B T ( k B is the Boltzmann constant) and therefore directly excite molecular rotational quantum states [95]. Lower frequencies (e.g., 1–3 GHz) deliver greater penetration—on the centimeter scale—making them well-suited for internal monitoring within grain silos. Mid-range frequencies (e.g., 5–10 GHz) provide higher spatial resolution—down to millimeters or sub-millimeters—and elevated sensitivity to grain moisture, which is ideal for near-surface analysis and compositional discrimination. Millimeter waves (30–300 GHz) align with rotational energy levels of molecules, enabling molecular-specific resonance detection, such as the identification of toxins [96,97,98]. Together, these core parameters determine the distribution of microwave signals within the product, affecting the measurement sensitivity of the reflection and transmission coefficients, thus providing a physical basis for defect identification [99].
Due to the multi-physical field coupling characteristics of the interaction between microwave and agricultural products, the density of grains also affects the overall dielectric response through the number of active molecules per unit body [100], and the temperature alters the polarization relaxation time through the molecular thermal motion; the law of synergistic variation in the dielectric spectrum with moisture–temperature provides the basis for optimizing the drying parameters in the monitoring of the drying process [101]. The dual-frequency measurement method can eliminate the density interference through the frequency difference and realize moisture detection [82]. Time domain reflection technology can also realize real-time moisture monitoring of potato starch through waveform resolution [102,103,104]. In microwave dynamic detection, the resonance effect can significantly enhance the sensitivity: when the microwave frequency matches the characteristic frequency of the target, the small change in the quality factor of the resonant cavity can also detect metallic foreign objects or pest activities [104,105,106]. It is thus possible to synchronize the inversion of moisture, density, and maturity indicators based on the transfer function of dielectric properties and physicochemical parameters [107].
Finally, selective heating properties give microwaves a unique application advantage: through dielectric differences, microwaves can target moisture in the pest to achieve inactivation while reducing the thermal impact on agricultural products [108].
In conclusion, the energy coupling between electromagnetic waves and agricultural products is the core physical basis of microwave nondestructive testing [109], and this mechanism provides nondestructive, time-sensitive technical support for agricultural nondestructive testing and lays the theoretical cornerstone for the expansion of subsequent application scenarios.

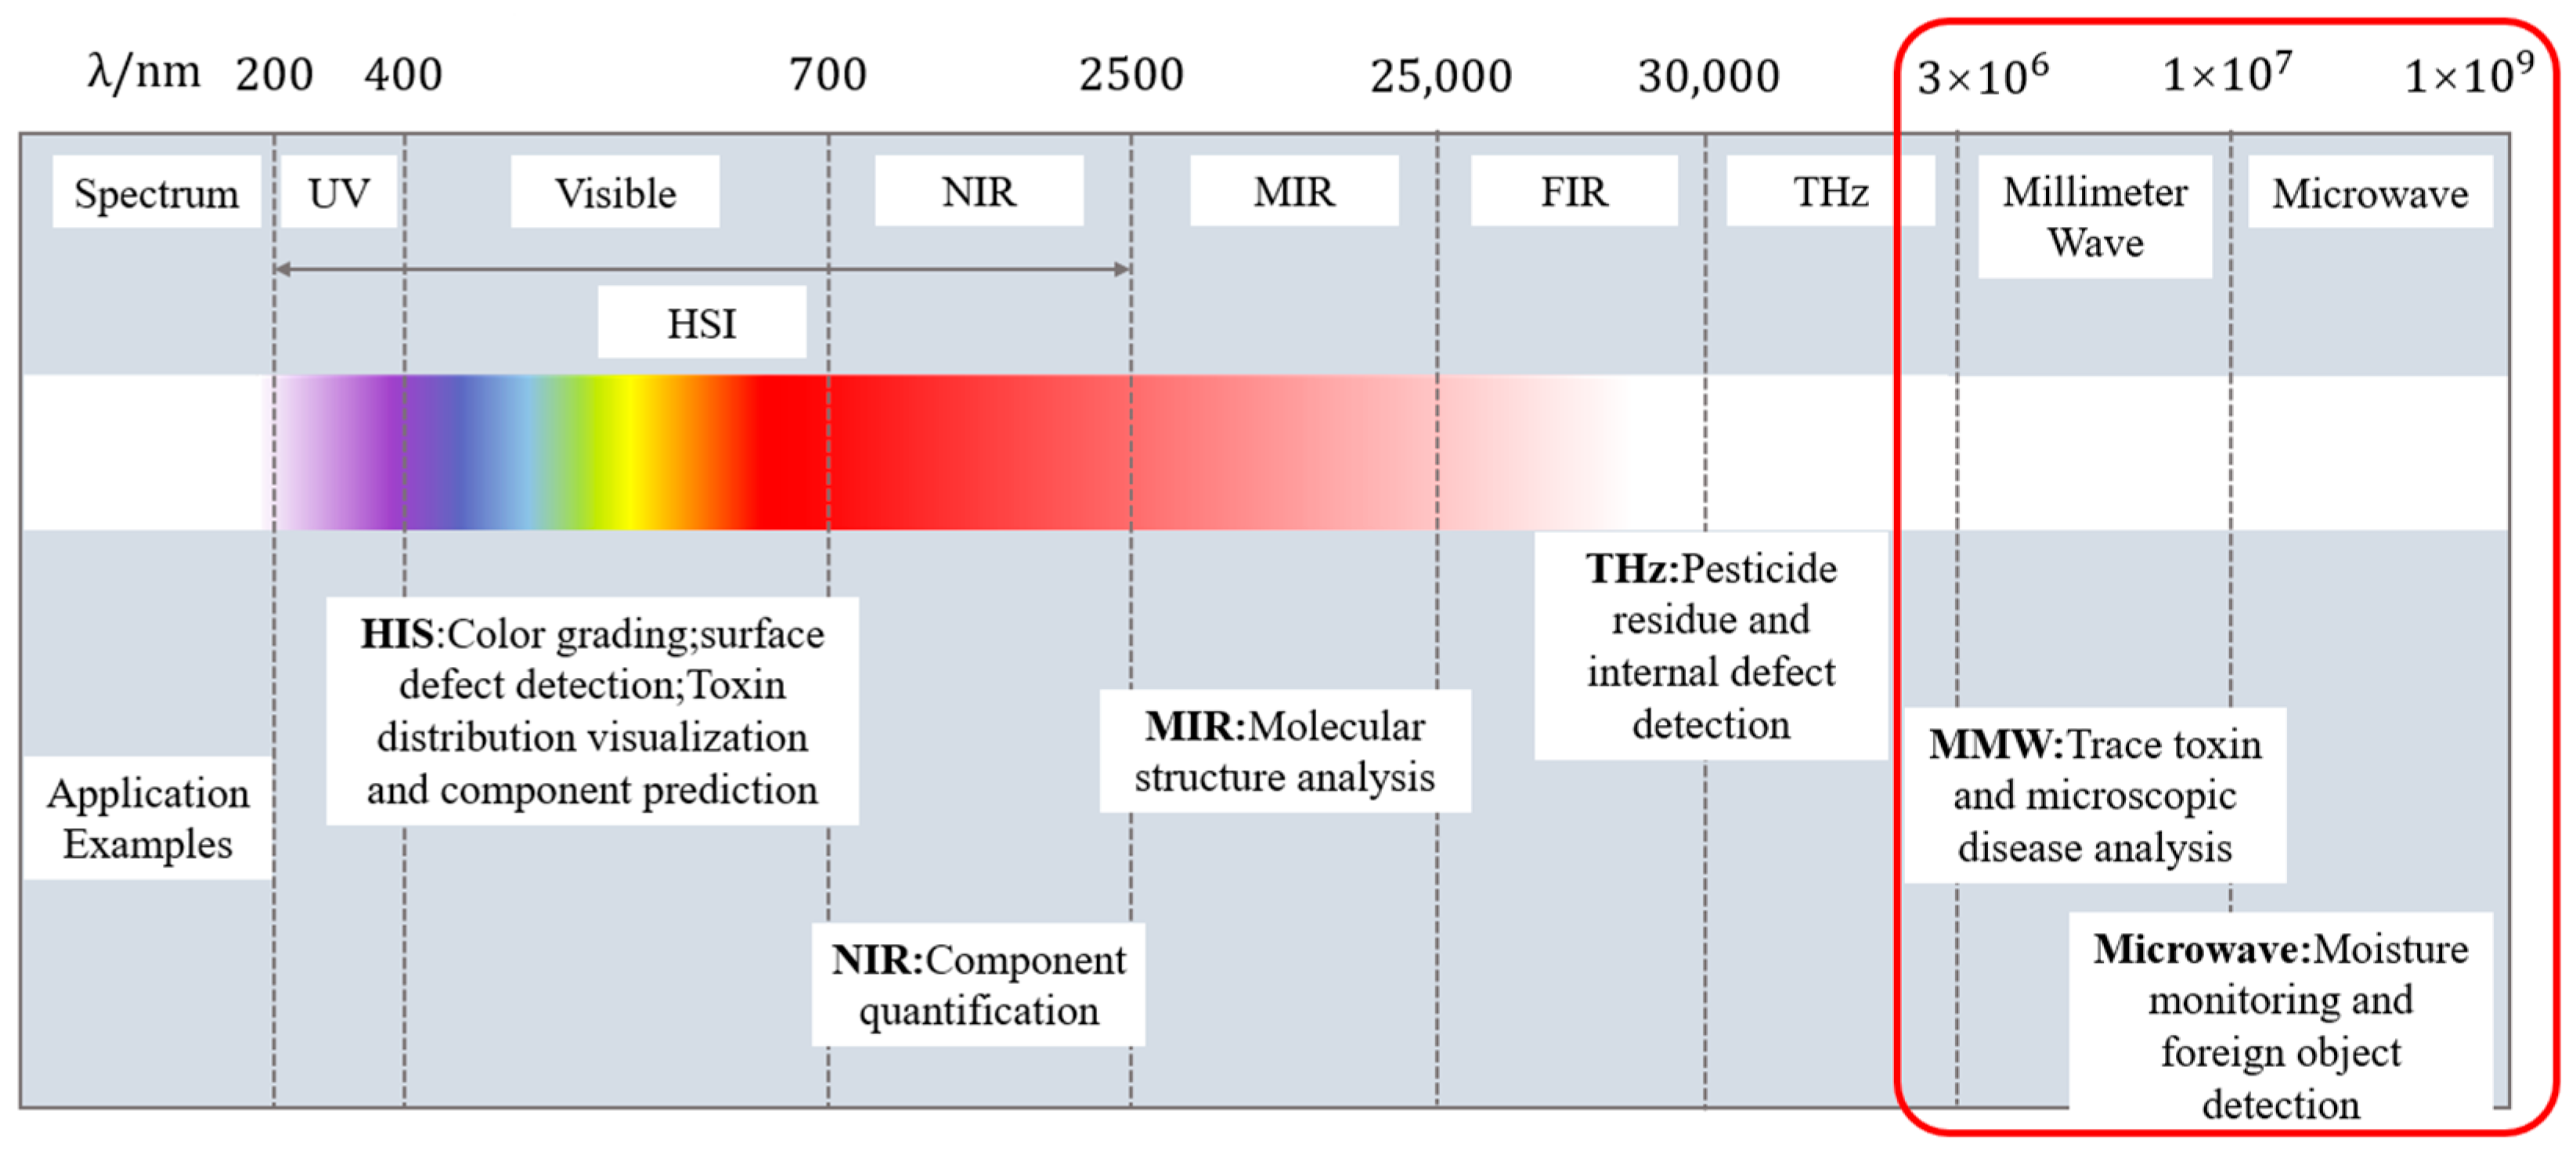
2.2. Band Selection and Agricultural Scenario Adaptation

The suitability of microwave technology in the nondestructive testing of agricultural products is based on the interaction between microwave technology and substances, in which the selection of frequency bands is the core element that determines the detection efficiency. Different frequency bands of microwaves have differentiated propagation characteristics and material response mechanisms, which need to be adapted according to the physical properties of agricultural products (such as water content, density, and structural complexity) and detection goals (internal defect identification, composition analysis, or dynamic monitoring).
Microwave frequencies below 1 GHz offer a unique advantage: exceptional penetration depth. This capability makes them ideal for large-scale whole-grain moisture monitoring in silos [110,111]. In soil moisture sensing, Time Domain Reflectometry (TDR) and Frequency Domain Reflectometry (FDR) sensors routinely operate at a few hundred megahertz. These signals can penetrate the soil to a usable depth, providing actionable data for precision irrigation [112,113]. Moreover, the sub-1 GHz band is relatively insensitive to density variations. This property benefits from online moisture monitoring of flowing grain and enables preliminary screening of internal moisture in thick-skinned fruits.
In low-frequency band (1–3 GHz) applications, the deep penetration property of microwaves makes them the first choice for internal inspection of granular agricultural products. Trabelsi et al. confirmed through a series of studies that electromagnetic waves in this band can penetrate the grain stacking structure and achieve simultaneous determination of moisture content and density under single-frequency conditions through dielectric spectroscopy [114], a property that can be expanded for applications in warehouse monitoring. In addition, Reimer’s team found that microwave signal perturbations caused by insect activities can be effectively captured in the 2.4 GHz band, providing a new method for nondestructive monitoring of pests in grain silos [104]. Moreover, Xie’s team further optimized the low-frequency application scenarios and developed a Doppler effect-based seed counting system, which achieves an identification accuracy of 98.3% of single/double seeds in the 1.8–2.5 GHz range [115].
The higher frequency bands (5–10 GHz and above) exhibit high sensitivity to moisture content, and Kraszewski’s classic study showed that the sensitivity of 10 GHz microwaves for detecting the distribution of moisture in the skin of fruits and vegetables was more than three times higher compared to the lower frequency bands [81]. This property has been deepened in food quality testing, where Zainal Abidin’s team found that the dielectric signature peaks at 7.43 GHz and 31.19 GHz specifically distinguish pork from other meats [116]. Xu’s latest research pushes high-frequency detection to the molecular level, with the construction of a quantitative model for aflatoxin B1 in wheat through transmission spectroscopy at 2.5–11.5 GHz (R2 = 0.96) [98]. Matsuo’s team broke through the bottleneck of detection in high-humidity environments by utilizing a 5.8 GHz transmission line sensor to achieve a silage moisture prediction error of <1.8% [103].
The proposal of a multi-frequency cooperative detection strategy marks the frequency band adaptation into the system optimization stage. The system developed by Lei’s team can synchronously obtain the information of shell structure strength and kernel moisture in a single measurement, avoiding the time loss of traditional step-by-step detection [117]. In addition, the Metasurface Plane Wave Antenna developed by Li’s team supports multi-frequency dielectric scanning and can be used as an extension of the technology [118]. Kumar’s review points out that the fusion of multi-frequency data can compensate for the blind spot of a single frequency band, e.g., in the assessment of seed vigor, the combination modeling of the dielectric loss factor at 2.45 GHz and phase angle at 5.8 GHz improved the prediction accuracy. Combined modeling improved prediction accuracy to 92.7% [119].

2.3. Advantages and Limitations

Microwave technology shows significant advantages in nondestructive testing of agricultural products. Its non-contact nature avoids the damage to samples caused by traditional destructive methods [120,121]; it is especially suitable for materials that need to maintain their physiological activity and supports the need for continuous online monitoring [122]. The technology has high sensitivity to the moisture content of grain, in the 300 MHz–1 GHz frequency band, by analyzing the microwave signal amplitude attenuation, phase shift, and resonance frequency change and other multi-dimensional parameters, combined with machine learning algorithms to achieve multi-dimensional quality assessment of moisture, density, composition, and other multi-dimensional qualities, which perform better than near-infrared and other surface technologies. The capability of low-frequency microwave penetration can detect the internal moisture content of an entire bag of material using gradient distribution visualization analysis [123]. The development of portable devices (miniaturized antennas, low-power circuits) in the last five years has further reduced the cost of field deployment and enhanced the potential for technology penetration [124,125,126].
However, the technique faces some limitations. The detection signal is susceptible to interference from ambient temperature, humidity, electromagnetic noise, and the sample’s own physical properties (e.g., shape, surface roughness), and needs to be compensated for errors through dynamic calibration. Dynamic changes in the dielectric constant due to the growth period or storage conditions may also lead to model prediction bias [127], requiring the establishment of multi-scenario calibration databases (e.g., the microwave imaging repository at the University of Manitoba) [128,129]. Another core challenge lies in the trade-off between penetration depth and resolution: at too high a frequency, the effect of inter-particle voids is not negligible according to the equivalent medium theory; at too low a frequency, the coupling efficiency between the electromagnetic wave and the material particles decreases, leading to a reduction in sensitivity [78,130].
In conclusion, with the advantages of nondestructive, high penetrability, high sensitivity to moisture, and fast response, microwave technology has become one of the mainstream methods for nondestructive testing of agricultural product storage [131]. However, its wide application still needs to overcome the limitations of environmental interference, sample dependence, the contradiction between penetration depth and resolution, hardware cost, and data processing complexity.

3. Extended Application Scenarios of Microwave Technology

3.1. Typical Application Scenarios: Moisture Content Detection

3.1.1. Cereal Crop Moisture Testing

Wheat: As a major global food crop, wheat moisture detection technology presents a mature solution with multi-frequency band synergy. For example, Bai et al. achieved moisture prediction accuracy significantly better than traditional methods through double-mixed-frequency microwave transmission (2.5–11.5 GHz) combined with support vector regression (SVR) modeling [132]. Kuang et al. further utilized the L/S-band frequency modulated continuous wave system to establish a full-frequency SVR model, which verified the superiority of multi-frequency data fusion [107]. Li et al. developed a dielectric hypersurface lens antenna system (23.6–24 GHz) to achieve density-independent high-precision detection through an error calibration algorithm [133].
Corn and Soybean: Zhang et al. developed a multi-frequency scanning combined with a deep neural network online sensing system for real-time monitoring of the corn drying process [72]. Nelson et al. proposed a microwave density-independent technique for the simultaneous detection of moisture in corn, soybean, and other flowable grains through attenuation and phase-shift measurements [134]. Li et al., based on the density-independent square of the traveling-wave standing-wave method, further verified the suitability of microwave technology for a wide range of grains [135].

3.1.2. Oil-Bearing Crop

Peanuts: Trabelsi and Nelson achieved simultaneous determination of moisture and bulk weight of shelled peanuts by complex dielectric constant analysis [136]. Ma et al.’s team constructed a fully connected deep neural network model based on microwave scattering parameters, which significantly improved the detection efficiency [137]. For peanut shell particles, Trabelsi’s team also proposed a multi-band (5–15 GHz) density-independent calibration function, which can be used to predict moisture and bulk weight in milliseconds [138].
Unshelled tea seeds: A microwave detection system based on multi-frequency scanning (2.00–10.00 GHz), combining artificial neural network (ANN) modeling and raw moisture calibration function, was developed by Zhou et al. to achieve high-precision prediction of the internal moisture of tea seeds in the unshelled state [139].

3.1.3. Other Materials

Tea leaves: Wu et al. developed a moisture prediction model for the withering process using a fusion strategy of 2–10 GHz multi-frequency signal optimization and machine learning, providing a new paradigm for quality control in tea processing [140].
Plant leaves: Yan et al. designed a 3.4 GHz split-ring resonator sensor to monitor leaf moisture through frequency shifts for non-invasive real-time detection [141]. Menzel et al. successfully tracked the moisture dynamics of tomato and tobacco leaves based on the linear relationship between the frequency shift of the center of the microwave resonator cavity and the fresh weight of the plant [100,142].
Silage: For high-moisture forage crops, Matsuo et al. proposed a phase-amplitude ratio method (3.6 GHz) based on a microstrip transmission line to solve the problem of nondestructive inspection of packaging films [82].
The key metrics of the case are shown in Table 2, which indicates that microwave technology has achieved the full chain of moisture detection coverage from stored grains to field crops through frequency band adaptation, algorithm optimization, and multi-physical quantity synergy.

3.2. Emerging Application Directions

3.2.1. Agricultural Storage and Processing Monitoring

As shown in Table 3, taking biofilm monitoring in dairy pipelines as an example, Bhattacharya’s team found through numerical simulation of electromagnetic fields that a biofilm with a thickness of 1 μm can cause significant changes in reflection coefficients in the 1.52 GHz band. This sensitivity is more than five times that of conventional optical methods, providing a new paradigm for continuous online monitoring [143]. Similar principles can be extended to the identification of stored grains: Wang et al. established a rapid nondestructive detection method for new/old rice grain adulteration utilizing broadband microwave transmission (8–12 GHz). By analyzing the transmission coefficient (S21) spectral features and employing a Support Vector Machine (SVM) classifier, the method achieved high identification accuracy, significantly outperforming traditional sensory evaluation in both speed and objectivity [144].

3.2.2. Mycotoxin Detection

Microwave and millimeter wave technologies provide innovative solutions for on-site screening of mycotoxins due to their high sensitivity to the dielectric properties of materials. The underlying principle is that polar molecules (e.g., the carbonyl groups of aflatoxins) exhibit the Stark effect E   =   μ E in an intense microwave electric field, where μ is the dipole moment. This interaction splits rotational energy levels and enhances resonant absorption [145]. Aflatoxin B1 (AFB1) contains a strongly polar lactone ring (C–O–C=O) and furan ring (C4H4O) with a dipole moment μ 3.5 D e b y e . The reduced rotational barrier of the molecule shifts its characteristic relaxation peak to 31 GHz ( ε m a x μ 2 / T ), clearly distinguishing it from the broad absorption spectrum of the cereal matrix [146]. In AFB1-contaminated wheat, the ε peak at 31 GHz rises to 0.85 , which is significantly higher than that of uncontaminated samples ( 0.15 ). A secondary peak at 11.5 GHz ( ε   =   0.32 ) provides an additional discrimination dimension, forming a dual-band dielectric fingerprint [78].
In recent years, researchers have built an integrated monitoring system for the grain storage environment by combining microwave sensing technology with thermodynamic parameter analysis through a multimodal data fusion strategy. For example, to address the bottleneck of highly toxic aflatoxin B1 (AFB1) detection, Xu et al. developed a miniaturized microwave sensing system (2.5–11.5 GHz), which was optimized by the transmission exponential (S21 phase-to-amplitude ratio) and the Support Vector Machine regression (SVR) model, and the root-mean-square error (RMSEP) of the quantitative detection of AFB1 was reduced to 2.8 μg/kg [98]. To further break through the challenge of synergistic optimization of qualitative–quantitative detection, Deng’s team proposed a multi-task deep learning framework to synchronously invert wheat mildew grade and AFB1 content by using the frequency domain features of microwave transmission coefficients, which provides a full-dimensional technological support for the quality grading of warehouse monitoring [123]. It is also worth noting that, in high-moisture samples (>15%), the strong frequency-dispersive absorption of free water ( ε w a t e r f c ω , where c ω is the grain moisture content) across 1–20 GHz masks the toxin signal. Therefore, pre-drying or a dual-frequency differential method is required to suppress the water-induced background noise [147]. In the field of plant pathogen detection, microwave technology has demonstrated the ability to specifically identify fungal types through the analysis of dielectric fingerprints. Hussein et al. found, using open coaxial probe technology, that soil-borne fungi have a higher value of dielectric loss factor ( ε ≈ 0.15) in the low-frequency band (<5 GHz) compared to air-borne fungi (e.g., powdery mildew, ε ≈ 0.03) by two to three orders of magnitude, which is a significant improvement in the value of the loss tangent. This difference provides a physical basis for rapid typing and targeted control of pathogens in the field [148]. Expanding to the safety monitoring of edible oils, the combination of microwave spectral data and deep neural networks further breaks through the sensitivity limit of trace contaminant detection. Deng et al. achieved ppb-level detection of lead residues in edible oils (LOD = 0.5 ppb) through broadband dielectric spectral (1–20 GHz) feature extraction and convolutional neural network (CNN) modeling, and the generalization of their model for heterogeneous oil samples error is less than 8% [123]. These advances have not only verified the technical advantages of microwave technology in toxin detection, but also laid a methodological foundation for the construction of a whole chain food safety prevention and control system from field to table.

3.2.3. Food Adulteration Identification

Compared with optical technology that relies on surface features, microwave technology provides a unique solution for accurate identification of heterogeneous components in powder products by virtue of its deep penetration capability and dielectric response characteristics. Taking wheat flour adulteration detection as an example, the microwave detection system (2.5–11.5 GHz) independently developed by Xu’s team constructs an XGBoost bimodal detection model for talcum powder adulteration through wide-band dielectric spectrum acquisition, combined with adaptive feature selection algorithms (e.g., improved ant colony optimization) and population intelligent optimization strategies. The model realized the classification discrimination and quantitative prediction of the adulteration ratio through the nonlinear mapping of frequency domain dielectric loss factor (ε″) and phase offset, which was significantly better than that of the traditional chemical analysis method, and the detection time was shortened to 30 s/sample [149].
Table 3. Summary of representative cases for emerging applications.
ApplicationsSystem SchematicMeasurement
Technique
FrequencySignal Processing MethodsRef.
Milk biofilm
detection
Sensors 25 04783 i016Reflection coefficient (S11) and resonance frequency shift analysis1.52 GHzFrequency offsets and amplitude changes[142]
Storage grain
identification
Sensors 25 04783 i017Reflection spectrum measurement (free-space method)7.11–7.52 GHzFull-wave simulation and measurement results analysis; multi-reflection interference theory[144]
Wheat aflatoxin B1 (AFB1)
quantification
Sensors 25 04783 i018Dual-heterodyne mixing technology, broadband free-space transmission2.5–11.5 GHzLeast squares filtering preprocessing, bootstrap soft shrinkage (BOSS) algorithm for feature optimization, and Support Vector Machine (SVM) ion (R2) = 0.97[98]
AFB1 and mold co-detectionSensors 25 04783 i019A miniaturized microwave detection device with a double heterodyne mixing structure4.5–11.5 GHzA multi-task CNN model for feature self-learning and model
calibration
[123]
Phytopathogenic fungi
differentiation
Sensors 25 04783 i020Open-ended coaxial probe technique200 MHz–13.6 GHzThe DAK 3.5 software extracts the dielectric parameters of the material by measuring the complex reflection coefficient at the probe end[146]
Lead (Pb) residue in edible oil Employing the penetrating, absorbing, and reflecting properties of microwaves to detect and analyze sample properties300 MHz–300 GHzConvolutional neural networks (CNNs), residual neural networks, and attention mechanisms[147]
Talc adulteration in wheat flour
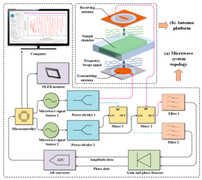
Sensors 25 04783 i021Amplitude attenuation and phase changes2.5–11.5 GHzFeature selection strategies (such as BOSS, CARS, and MEF-LASSO) are employed to reduce data dimensions and extract key features[148]
Animal-derived biological tissues (beef, pork, chicken, liver, and skin)Sensors 25 04783 i022
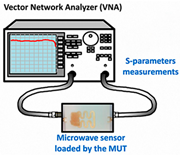
Improved ring resonator (CPW-fed, meander-miniaturized), ex vivo biological tissue capacitive perturbation measurement0.5–5 GHzMeasure resonance shift and Q-factor change; fit S-parameters via EM simulation to extract complex permittivity[150]

3.2.4. Biometric Identification

Based on the resonant dielectric characterization mechanism, microwave sensing technology extends its application frontier to in situ tissue biometrics by resolving dielectric “fingerprints” linked to macromolecular composition. The miniaturized CPW-fed meander resonator (1 GHz) developed by Tilii et al. achieves high-sensitivity extraction of tissue-specific complex permittivity ( ε and ε ) through gap-coupled partial overlay, effectively capturing polarization differences in protein-bound water and cellular structures. For instance, ex vivo measurements revealed distinct permittivity ranges between muscular (e.g., beef ε = 52.9, ε = 15.4) and parenchymal tissues (e.g., pork liver ε = 45, ε = 14.2), correlating with histological variations in collagen density and hydration states (validation error < 5% vs. coaxial probe). This approach offers real-time, non-ionizing tissue discrimination, surpassing invasive DNA-based methods in operational simplicity for clinical diagnostics [123].
The above progress indicates that microwave agricultural detection technology is rapidly advancing from laboratory research to industrialized applications. With the deep combination of miniaturized sensors and intelligent algorithms, the technology is expected to achieve a wider penetration in the scenarios of agricultural product quality tracing, intelligent monitoring of processing, etc., and provide core technical support for the construction of an intelligent agricultural inspection system.

3.3. The Forward-Looking Potential of Millimeter Wave Technology

As a high-frequency extension of microwaves, the quantization energy of millimeter wave technology (30–300 GHz) matches the rotational energy level jumps of molecules, and is able to interact resonantly with water molecules, proteins, fats, and toxins in grains to stimulate changes in their rotational energy levels. Such interactions result in significant amplitude attenuation and phase changes in the millimeter wave signal as it penetrates the grain, and these changes are closely related to the compositional content and structural state of the grain. Therefore, by accurately measuring the transmission characteristics of millimeter waves, rapid and nondestructive detection of the internal qualities of grains, such as moisture content and quantitative analysis of harmful substances such as aflatoxin, can be realized.
For example, a millimeter wave system based on graphene–metal composite metamaterials achieved trace detection of aflatoxin B1 in the 120 GHz band with a sensitivity enhancement of 20 dB compared with the conventional optical method [74]. Similarly, Xu et al. achieved accurate quantitative analysis of aflatoxin B1 in peanuts by the localization of molecular characteristic absorption peaks in the 240 GHz band combined with principal component analysis and a support vector regression model [78]. All these studies show that millimeter wave technology can break through the sensitivity bottleneck of optical methods in the detection of toxins at low concentrations and provide efficient solutions for the safety of agricultural products.
In addition, the maturity and scalability of the CMOS process enable it to adapt to the high-frequency requirements of the millimeter wave band and support large-scale mass production, which provides a technological basis for the widespread application of millimeter wave grain quality sensing chips [151]. By adopting the CMOS process, it can not only realize the miniaturization and high performance of grain quality instruments, but also promote their popularity in the agricultural field, help the process of agricultural modernization, and provide a stronger technical guarantee for food security.
For example, Liu et al. designed a 5 GHz and 240 GHz dual-band synergistic system, in which the low-frequency band can globally monitor the moisture distribution of grains, while the high-frequency band can locate the local toxins through molecular resonance, thus forming a macro–micro multi-dimensional detection framework, which significantly improves the detection efficiency [152].

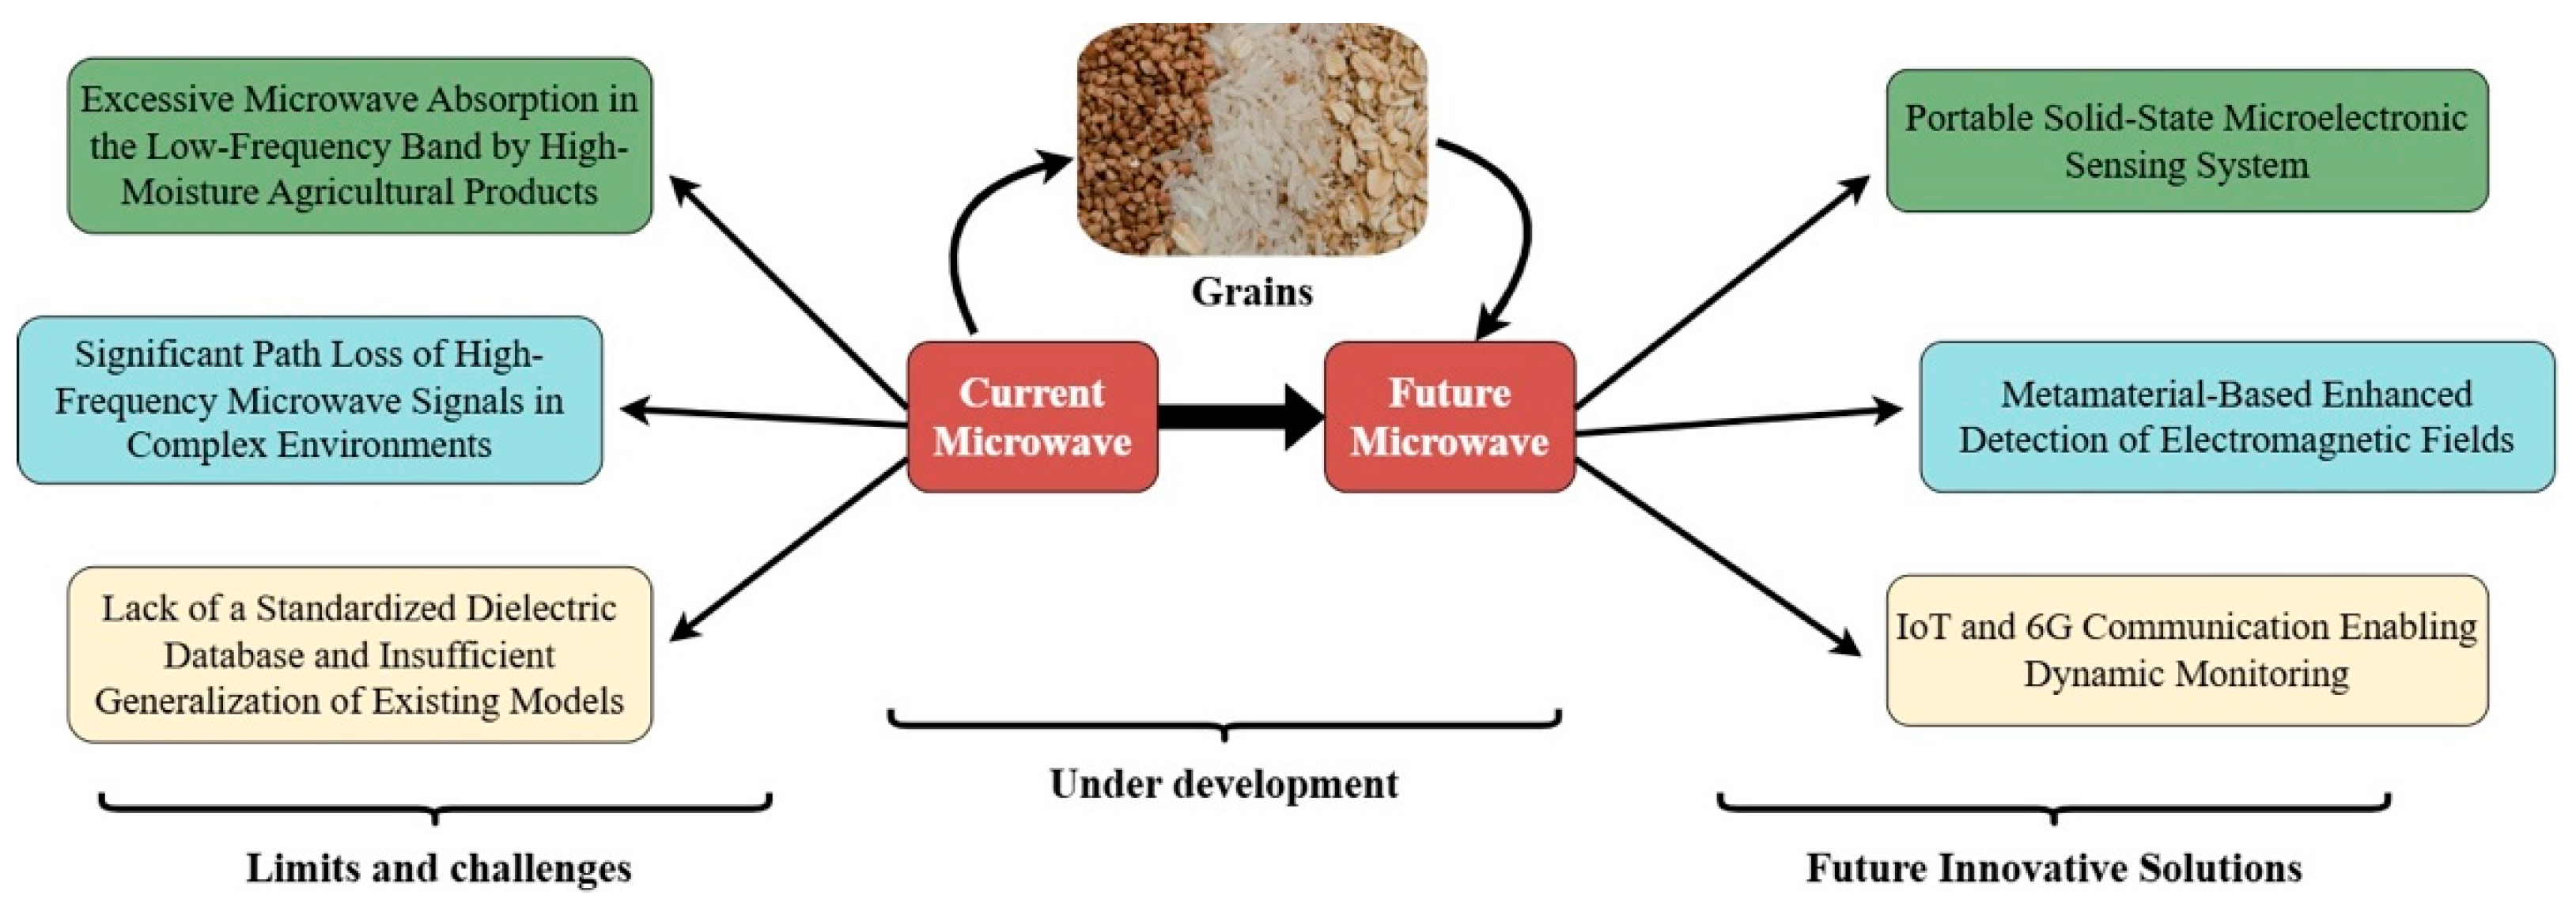
4. Challenges and Future Perspectives

4.1. Current Technology: Three Technical Bottlenecks

Although microwave technology shows unique advantages in nondestructive testing of agricultural products, its large-scale application still faces three major technical bottlenecks, as shown in Figure 2.
Firstly, the absorption effect of high-moisture agricultural products on specific frequency bands of microwaves interferes with the measurement accuracy. High-moisture grains (such as corn, fruits, and vegetables) in the microwave low-frequency band (1–10 GHz) on electromagnetic wave absorption are significantly enhanced, resulting in a weak reflection signal, making it difficult to accurately measure the local moisture distribution through the reflection method or transmission method. For example, the dynamic moisture measurement of corn kernels with bracts, due to signal absorption, leads to increased error [153]. In addition, Jones’ team noted that the dielectric loss factor ( ε ) of grains with >20% moisture content rises sharply, reducing the depth of penetration and invalidating transmission-based detection [126]. Finally, research by Min and colleagues also demonstrated that moisture-induced signal attenuation can mask the identification of target features such as mold [154].
Secondly, millimeter wave high-frequency signals in microwaves have significant path loss in complex environments. Although the millimeter wave frequency band can improve the resolution, in the crop canopy and other complex environments, the path loss is significant. Path loss of millimeter waves in crop canopies follows the Friis-modified formula L p   =   ( 4 π f d ) 2 c 2 σ s c a t t e r , where the scattering cross-section is σ s c a t t e r r 3 ( r = cellulose particle radius). This explains the 25 dB loss at 60 GHz in maize fields, arising from stem scattering with r 0.5 m m [155]. For high-moisture grain (>20%), microwave attenuation obeys the Beer–Lambert law: I I 0   =   e α d , with attenuation coefficient α   =   2 π f c ε t a n δ reaching 8.2   m 1 at 2.45 GHz ( t a n δ c ω ), yielding a penetration depth δ p < 5   c m [156]. As mentioned earlier, Xu et al.’s team validated aflatoxin detection in peanuts and found that the 40 GHz signal had a 42% signal-to-noise ratio degradation due to particle scattering and relied on complex compensation algorithms to calibrate the data [78]. At the same time, Pattanayak further noted that cellulose structures in crop residues can enhance millimeter wave scattering and exacerbate signal distortion [157]. Dielectric variability arises from variety-dependent differences in hydrogen-bond networks; for example, the increased β-sheet content in high-gluten wheat gliadin strengthens dipolar orientational polarization [158].
Finally, the microwave method is relatively new, and the dielectric properties of agricultural products are affected by the coupling of multiple factors such as variety, temperature, and density, resulting in a lack of standardized dielectric databases and a lack of generalizability of the existing models. Zhong’s team emphasized that the traditional dielectric model has an error of 12% for wheat with varying gluten content, and the Modified Model for Agricultural Productivity and Moisture Measurement (MGAPEM) is still limited to a specific range of densities [91]. Jones also pointed out that existing commercial moisture meters need to be individually calibrated for different grains (e.g., soybean vs. chickpea) because of the 3–5 times difference in dielectric constants (at 10 GHz), further highlighting the lack of a standardized database for multiple scenarios as a bottleneck [125].

4.2. Innovative Solutions: Future Evolution Paths

With the evolution of agricultural inspection needs to intelligence and high precision, the future development of micro-technology needs to break through single-modal limitations and build a multi-dimensional synergistic inspection system through the integration of cross-field technologies. Therefore, in view of the existing bottlenecks in microwave nondestructive testing technology for agricultural products, the future evolution path should focus on the following directions:

4.2.1. Portable Sensing System Based on Solid-State Microelectronics

At present, there are relatively few studies in the field of solid-state electronics applied to grain quality inspection at home and abroad, and most of them still rely on general-purpose measuring instruments such as vector network analyzers [159,160], which makes it difficult to realize truly portable inspection. In grain quality nondestructive testing equipment, the performance of the signal source [161,162,163] and detector [164], as the core components, directly determines the accuracy and reliability of the detection results. However, if the CMOS process is used to achieve a high degree of integration of the microwave detection chip, it will directly solve the problem of equipment portability and detection sensitivity.
In addition, since the selection of semiconductor technologies—CMOS, SiGe BiCMOS, and GaN—in the field of agricultural microwave sensing requires a comprehensive trade-off among power consumption, cost, performance, and portability, we will next delve deeply into these factors and reveal the reasons behind our prioritization of CMOS technology.
CMOS (complementary metal–oxide–semiconductor) stands out for portable instrumentation because it delivers very-large-scale integration, the lowest cost, and modest power draw [151,165,166]. Its mature design ecosystem makes it ideal for battery-powered handheld moisture meters or densely integrated sensor nodes [167]. Nevertheless, CMOS is generally limited to applications below about 100 GHz [168], and its high-frequency figures of merit ( F T / F M A X ) and output power are comparatively modest [152].
SiGe BiCMOS technology merges the digital integration capability of CMOS with the superior high-frequency performance, high linearity, and low phase noise of SiGe HBTs, thereby delivering output power levels that surpass those of pure CMOS while achieving F T / F M A X figures that already reach 150/200 GHz in production and 350 GHz in research [169,170]. Operating effectively in the multi-gigahertz and multi-gigabit-per-second regimes, SiGe BiCMOS is well-suited for both wireless and wireline circuits and networks [171]. Its balanced energy efficiency, which is better than that of III–V semiconductors, makes it particularly attractive for millimeter wave and high-performance applications such as high-resolution radar and precision spectroscopic analysis, although its process complexity and cost remain higher than those of CMOS [172].
GaN and other III–V compound semiconductors such as InP deliver extremely high output power, power density, efficiency, and breakdown voltage, together with outstanding high-frequency performance [173]. GaN devices can operate up to roughly 1000 GHz and deliver kilowatts of power, far surpassing both Si and SiC. However, GaN remains the most expensive option and offers lower integration density, making complex system-on-chip solutions difficult to realize. Its process maturity and ecosystem also lag behind those of silicon-based technologies [174,175]. Consequently, GaN is mainly reserved for high-power transmission tasks, such as penetrating very thick materials or enabling long-range detection, and is seldom adopted in portable agricultural equipment.
In summary, for the mainstream portable, low-cost, mid-/low-frequency or millimeter wave frontend sensing systems envisioned in this paper, CMOS technology—thanks to its unmatched level of integration, lowest cost, and lowest power consumption—emerges as the most feasible and promising choice.

4.2.2. Metamaterial-Based Electromagnetic Field Enhancement Detection

The rise of metamaterial technology in recent years has provided new ideas for grain quality testing. According to the Maxwell–Garnett effective-medium theory, the effective permittivity is ε e f f   =   [ 1 + 3 ϕ ( ε d ε m ) ε d + 2 ε m ϕ ( ε d ε m ) ] , and the local field-enhancement factor is β ω   =   3 ε m 2 ε m + ε d , where ε m is the permittivity of the grain matrix and ε d is the permittivity of the other material [176]. In addition, metamaterials use nanoscale surface plasmon resonance periodic structures with strong absorption and modulation of electromagnetic waves. This property can be utilized to improve the sensitivity of grain quality detection [74]. In the field of microwave-based nondestructive testing of agricultural products, application-specific metamaterial structures can be selected for different scenarios. For moisture content determination in grains, an apolarization-insensitive wheel-shaped resonator exhibits ultra-high water absorption and adapts well to irregularly shaped kernels, making it suitable for moisture measurement in nuts such as almonds [177]. For grain quality assessment, a cross-resonator array detects shifts in resonant frequency to identify food adulteration or varietal differences [144]. In addition, Tian et al. used a metamaterial lens to modulate the wavefront phase, combined with an adaptive source localization algorithm to solve the resolution limitation of conventional microwave imaging. Experiments show that the detection size of insect defects inside the grain is reduced to 0.5 mm (three times higher than conventional methods) [178]. In pH measurement of aqueous solutions or dielectric characterization of solid materials, metamaterial unit cells formed by coupled open square-ring resonators exploit negative magnetic permeability (MNG) supported by transmission-line and stopband-shift techniques, enabling high-precision sensing [179]. Moreover, a compact, transmission-line-based absorber that incorporates negative permittivity elements significantly enhances broadband sensitivity and suits diverse agricultural environments [180]. Finally, Chen’s team mimics the structure of plant microtubules to design gradient dielectric constant materials, realizing the directional aggregation of electromagnetic waves to increase the depth of penetration of microwaves inside the grain by 40%, which effectively improves the detection ability of deep contaminants [181].
These examples illustrate that metamaterial architectures can enhance field localization and resonant response. Nevertheless, practical deployment must account for both the physical state of the agricultural product and environmental factors. Future integration with intelligent algorithms promises to deliver high-sensitivity detection [182].

4.2.3. IoT and 6G Communications-Enabled Dynamic Monitoring

The popularization of the Internet of Things (IoT) in agriculture provides a physical vehicle for multi-technology integration. Drones equipped with agricultural sensors can acquire environmental parameters (temperature, humidity, and soil pH) in real time, combined with aerial images from drones to collect pest and disease data [183]. The development of room temperature detectors for 6G IoT applications can focus on solving the problem of high signal loss in air, and their high sensitivity characteristics can meet the needs of environmental monitoring, 6G signal reception, and other scenarios [184]. As for the 6G-IoT-based smart irrigation system constructed by Sitharthan et al., its network layer design draws on millimeter wave beamforming technology, which can reduce signal attenuation in the complex environment of farmland through directional transmission [185].
In remote, low-power agricultural scenarios, the optimal data-transmission protocol is Low-Power Wide-Area Network (LPWAN) technology, supported by lightweight data-compression algorithms to guarantee efficient and reliable delivery. The entire solution will ultimately be integrated into the 6G-IoT smart irrigation framework proposed by Sitharthan [186]. Prediction errors caused by moisture, shape variability, and dielectric heterogeneity can be overcome through online adaptive calibration. A transfer-learning-based convolutional neural network (CNN) continuously fuses multi-band dielectric spectra— ε f 1 f 2 ,   ε f 1 f 2 —with temperature and humidity sensor data in real time, dynamically adjusting the weight parameters ε   =   f ( T , c ω , v a r i e t y ) to minimize field errors [187].
For protocol selection, LPWAN is the field-ready choice because of its ultra-long coverage and extremely low power consumption. LoRa/LoRaWAN is ideal for periodic sensor uploads, such as soil moisture and temperature. Its spread-spectrum modulation delivers kilometers of range in rural areas while drawing minimal current, making it suitable for moderate data rates [188,189,190]. NB-IoT and LTE-M, based on cellular infrastructure, offer broader coverage and lower latency with higher data rates, serving real-time applications like pest alerts [191]. Looking ahead, 6G’s massive Machine-Type Communication (mMTC) will evolve these technologies further. Reconfigurable intelligent surfaces (RISs) will dynamically optimize beamforming to mitigate the high path loss of millimeter waves in farmland, effectively relaying signals to expand coverage [192,193].
On the compression side, strict bandwidth and energy budgets demand lightweight techniques that maximize efficiency. The preferred strategy is on-node feature extraction, transmitting only critical features instead of raw voluminous data. This “intelligent compression” slashes both data volume and energy draw [194]. For spectral data, lightweight lossless or near-lossless algorithms—such as differential coding followed by Huffman coding—remove redundancy with low computational cost, fitting resource-constrained nodes [195]. For imaging data, predictive schemes like JPEG-LS preserve accuracy while saving bandwidth. When a controlled loss of fidelity is acceptable, lossy methods such as WebP provide higher compression ratios, provided the trade-off between algorithmic complexity and information loss is carefully managed [196].

4.3. Discussion on Limitations and Future Perspectives

Beyond the fundamental hurdles of signal attenuation in high-moisture products, millimeter wave path loss, and the absence of standardized dielectric databases, broader challenges impede practical deployment: limited model generalizability across crop varieties and environmental conditions; rising system complexity and costs from multi-technology integration; insufficient standardization for regulatory compliance; vulnerabilities in field robustness (temperature, humidity, and vibration); stringent energy constraints for remote operations; and edge-computing bottlenecks for real-time data processing.
Future advancements require focused efforts on multimodal sensor fusion (e.g., microwave–optical synergy) for comprehensive analysis [197,198]; AI-optimized hardware/software co-design to enhance adaptability; dynamically tunable and low-cost metamaterials; open-access dielectric repositories with cloud-based calibration; dedicated CMOS-integrated circuits for miniaturized low-power systems; accelerated environmental stress testing; rigorous cost–benefit assessments of deployment models; and expansion into novel applications like root-zone hydration mapping and physiological stress early-warning systems. Overcoming these multifaceted barriers is essential to transition microwave NDT from laboratory validation to scalable agricultural intelligence platforms.

5. Conclusions

Microwave technologies have shown significant technical advantages and wide application prospects in the field of agricultural nondestructive testing (NDT) by virtue of their nondestructive detection characteristics and deep penetration ability. Through the penetration of the low-frequency band (300 MHz–4 GHz) and the molecular resonance effect of millimeter waves (30–300 GHz), the complementary detection framework of “macro-screening–micro-diagnosis” has been constructed by the two technologies, which can be realized from the monitoring of moisture to the identification of trace toxins in stored grains. In terms of hardware innovation, CMOS multimode oscillators significantly reduce device size and power consumption. When coupled with metamaterial-enhanced techniques, microwave technology gains the capability for high-precision, low-cost, nondestructive testing. This combination improves signal stability in complex environments and provides robust hardware support for real-time, on-site detection. The ability to detect synergistic multi-dimensional physical quantities (e.g., moisture, density, and foreign matter) allows it to demonstrate unique advantages over traditional optical methods in dynamic agricultural environments and complex sample analysis.
Despite the outstanding advantages of microwave technology, its large-scale application still faces three major technical bottlenecks: excessive absorption of microwaves in specific frequency bands by high-moisture agricultural products, significant path loss of millimeter wave high-frequency signals in complex environments, and the lack of a standardized dielectric database. Future breakthroughs will focus on portable sensing systems based on solid-state microelectronics to enhance field adaptability; electromagnetic field-enhanced detection technologies utilizing metamaterials to improve sensitivity and penetration depth; and the combination of Internet of Things (IoT) and 6G communication-enabled dynamic monitoring networks to realize the whole process of intelligent management from field to storage. Through the in-depth integration of interdisciplinary technologies and full scene coverage, microwave technology not only builds a highly reliable technology system for the quality and safety of agricultural products and supply chain management, but also provides both prospective and practical solutions for the sustainable development of global food security, and will promote agricultural testing towards a new paradigm of intelligence and high precision.

Author Contributions

Conceptualization, L.X.; methodology, L.X.; software, X.B.; validation, R.T.; formal analysis, X.B.; investigation, J.C.; re-sources, X.B.; data curation, R.T.; writing—original draft preparation, R.T.; writing—review and editing, R.T.; visualization, R.T.; supervision, X.B.; project administration, J.C.; funding acquisition, L.X. All authors have read and agreed to the published version of the manuscript.

Funding

This research received no external funding.

Conflicts of Interest

The authors declare no conflict of interest.

References

  1. Wang, L.; Sun, D.-W.; Pu, H.; Cheng, J.-H. Quality Analysis, Classification, and Authentication of Liquid Foods by near-Infrared Spectroscopy: A Review of Recent Research Developments. Crit. Rev. Food Sci. Nutr. 2017, 57, 1524–1538. [Google Scholar] [CrossRef]
  2. Ferreira, D.S.; Galão, O.F.; Pallone, J.A.L.; Poppi, R.J. Comparison and Application of Near-Infrared (NIR) and Mid-Infrared (MIR) Spectroscopy for Determination of Quality Parameters in Soybean Samples. Food Control 2014, 35, 227–232. [Google Scholar] [CrossRef]
  3. He, H.-J.; Sun, D.-W. Hyperspectral Imaging Technology for Rapid Detection of Various Microbial Contaminants in Agricultural and Food Products. Trends Food Sci. Technol. 2015, 46, 99–109. [Google Scholar] [CrossRef]
  4. Hussain, N.; Sun, D.-W.; Pu, H. Classical and Emerging Non-Destructive Technologies for Safety and Quality Evaluation of Cereals: A Review of Recent Applications. Trends Food Sci. Technol. 2019, 91, 598–608. [Google Scholar] [CrossRef]
  5. Qi, H.; Luo, J.; Wu, X.; Zhang, C. Application of Nondestructive Techniques for Peach (Prunus persica) Quality Inspection: A Review. J. Food Sci. 2024, 89, 6863–6887. [Google Scholar] [CrossRef]
  6. Lapchareonsuk, R.; Sirisomboon, P. Sensory Quality Evaluation of Rice Using Visible and Shortwave Near-Infrared Spectroscopy. Int. J. Food Prop. 2015, 18, 1128–1138. [Google Scholar] [CrossRef]
  7. Manley, M. Near-Infrared Spectroscopy and Hyperspectral Imaging: Non-Destructive Analysis of Biological Materials. Chem. Soc. Rev. 2014, 43, 8200–8214. [Google Scholar] [CrossRef]
  8. Jo, K.; Lee, S.; Jeong, S.-K.-C.; Lee, D.-H.; Jeon, H.; Jung, S. Hyperspectral Imaging–Based Assessment of Fresh Meat Quality: Progress and Applications. Microchem. J. 2024, 197, 109785. [Google Scholar] [CrossRef]
  9. Cheng, J.-H.; Nicolai, B.; Sun, D.-W. Hyperspectral Imaging with Multivariate Analysis for Technological Parameters Prediction and Classification of Muscle Foods: A Review. Meat Sci. 2017, 123, 182–191. [Google Scholar] [CrossRef]
  10. Whitfield, M.B.; Chinn, M.S. Near Infrared Spectroscopic Data Handling and Chemometric Analysis with the R Statistical Programming Language: A Practical Tutorial. J. Near Infrared Spectrosc. 2017, 25, 363–380. [Google Scholar] [CrossRef]
  11. Wu, X.; Zhang, T.; Wu, B.; Zhou, H. Identification of Lambda-Cyhalothrin Residues on Chinese Cabbage Using Fuzzy Uncorrelated Discriminant Vector Analysis and MIR Spectroscopy. Int. J. Agric. Biol. Eng. 2022, 15, 217–224. [Google Scholar] [CrossRef]
  12. Wang, K.; Sun, D.-W.; Pu, H.; Wei, Q. Principles and Applications of Spectroscopic Techniques for Evaluating Food Protein Conformational Changes: A Review. Trends Food Sci. Technol. 2017, 67, 207–219. [Google Scholar] [CrossRef]
  13. Xu, M.; Sun, J.; Yao, K.; Wu, X.; Shen, J.; Cao, Y.; Zhou, X. Nondestructive Detection of Total Soluble Solids in Grapes Using VMD-RC and Hyperspectral Imaging. J. Food Sci. 2022, 87, 326–338. [Google Scholar] [CrossRef]
  14. Orina, I.; Manley, M.; Williams, P.J. Non-Destructive Techniques for the Detection of Fungal Infection in Cereal Grains. Food Res. Int. 2017, 100, 74–86. [Google Scholar] [CrossRef] [PubMed]
  15. Wu, X.; Zhou, H.; Wu, B.; Fu, H. Determination of Apple Varieties by near Infrared Reflectance Spectroscopy Coupled with Improved Possibilistic Gath–Geva Clustering Algorithm. J. Food Process. Preserv. 2020, 44, e14561. [Google Scholar] [CrossRef]
  16. He, F.; Wu, X.; Wu, B.; Zeng, S.; Zhu, X. Green Tea Grades Identification via Fourier Transform Near-infrared Spectroscopy and Weighted Global Fuzzy Uncorrelated Discriminant Transform. J. Food Process Eng. 2022, 45, e14109. [Google Scholar] [CrossRef]
  17. Ding, Y.; Yan, Y.; Li, J.; Chen, X.; Jiang, H. Classification of Tea Quality Levels Using Near-Infrared Spectroscopy Based on CLPSO-SVM. Foods 2022, 11, 1658. [Google Scholar] [CrossRef]
  18. Zhang, J.; Wu, X.; He, C.; Wu, B.; Zhang, S.; Sun, J. Near-Infrared Spectroscopy Combined with Fuzzy Improved Direct Linear Discriminant Analysis for Nondestructive Discrimination of Chrysanthemum Tea Varieties. Foods 2024, 13, 1439. [Google Scholar] [CrossRef]
  19. Wu, X.; He, F.; Wu, B.; Zeng, S.; He, C. Accurate Classification of Chunmee Tea Grade Using NIR Spectroscopy and Fuzzy Maximum Uncertainty Linear Discriminant Analysis. Foods 2023, 12, 541. [Google Scholar] [CrossRef]
  20. Deng, J.; Chen, Z.; Jiang, H.; Chen, Q. High-Precision Detection of Dibutyl Hydroxytoluene in Edible Oil via Convolutional Autoencoder Compressed Fourier-Transform near-Infrared Spectroscopy. Food Control 2025, 167, 110808. [Google Scholar] [CrossRef]
  21. Rodriguez-Saona, L.E.; Allendorf, M.E. Use of FTIR for Rapid Authentication and Detection of Adulteration of Food. Annu. Rev. Food Sci. Technol. 2011, 2, 467–483. [Google Scholar] [CrossRef] [PubMed]
  22. Amir, R.M.; Anjum, F.M.; Khan, M.I.; Khan, M.R.; Pasha, I.; Nadeem, M. Application of Fourier Transform Infrared (FTIR) Spectroscopy for the Identification of Wheat Varieties. J. Food Sci. Technol. 2013, 50, 1018–1023. [Google Scholar] [CrossRef] [PubMed]
  23. Deng, J.; Jiang, H.; Chen, Q. Characteristic Wavelengths Optimization Improved the Predictive Performance of Near-Infrared Spectroscopy Models for Determination of Aflatoxin B1 in Maize. J. Cereal Sci. 2022, 105, 103474. [Google Scholar] [CrossRef]
  24. Wang, B.; Deng, J.; Jiang, H. Markov Transition Field Combined with Convolutional Neural Network Improved the Predictive Performance of Near-Infrared Spectroscopy Models for Determination of Aflatoxin B1 in Maize. Foods 2022, 11, 2210. [Google Scholar] [CrossRef]
  25. Liu, T.; He, J.; Yao, W.; Jiang, H.; Chen, Q. Determination of Aflatoxin B1 Value in Corn Based on Fourier Transform Near-Infrared Spectroscopy: Comparison of Optimization Effect of Characteristic Wavelengths. LWT 2022, 164, 113657. [Google Scholar] [CrossRef]
  26. Shahin, M.A.; Symons, S.J.; Hatcher, D.W. Quantification of Mildew Damage in Soft Red Winter Wheat Based on Spectral Characteristics of Bulk Samples: A Comparison of Visible-Near-Infrared Imaging and Near-Infrared Spectroscopy. Food Bioprocess Technol. 2014, 7, 224–234. [Google Scholar] [CrossRef]
  27. Luo, W.; Deng, J.; Li, C.; Jiang, H. Quantitative Analysis of Peanut Skin Adulterants by Fourier Transform Near-Infrared Spectroscopy Combined with Chemometrics. Foods 2025, 14, 466. [Google Scholar] [CrossRef]
  28. Zhou, H.; Fu, H.; Wu, X.; Wu, B.; Dai, C. Discrimination of Tea Varieties Based on FTIR Spectroscopy and an Adaptive Improved Possibilistic C-means Clustering. J. Food Process. Preserv. 2020, 44, e14795. [Google Scholar] [CrossRef]
  29. Wu, X.; Wang, Y.; Wu, B.; Sun, J. Classification of Fritillaria Using a Portable Near-Infrared Spectrometer and Fuzzy Generalized Singular Value Decomposition. Ind. Crops Prod. 2024, 218, 119032. [Google Scholar] [CrossRef]
  30. Malavi, D.; Nikkhah, A.; Alighaleh, P.; Einafshar, S.; Raes, K.; Van Haute, S. Detection of Saffron Adulteration with Crocus Sativus Style Using NIR-Hyperspectral Imaging and Chemometrics. Food Control 2024, 157, 110189. [Google Scholar] [CrossRef]
  31. Zhao, M.; Peng, Y.; Li, L. A Robot System for the Autodetection and Classification of Apple Internal Quality Attributes. Postharvest Biol. Technol. 2021, 180, 111615. [Google Scholar] [CrossRef]
  32. Wu, X.; Wang, Y.; He, C.; Wu, B.; Zhang, T.; Sun, J. Several Feature Extraction Methods Combined with Near-Infrared Spectroscopy for Identifying the Geographical Origins of Milk. Foods 2024, 13, 1783. [Google Scholar] [CrossRef]
  33. Ieong, H.F.; Yuan, Z. Abnormal Resting-State Functional Connectivity in the Orbitofrontal Cortex of Heroin Users and Its Relationship with Anxiety: A Pilot fNIRS Study. Sci. Rep. 2017, 7, 4652. [Google Scholar] [CrossRef] [PubMed]
  34. Sun, J.; Cheng, J.; Xu, M.; Yao, K. A Method for Freshness Detection of Pork Using Two-Dimensional Correlation Spectroscopy Images Combined with Dual-Branch Deep Learning. J. Food Compos. Anal. 2024, 129, 106144. [Google Scholar] [CrossRef]
  35. Yasmin, J.; Ahmed, M.R.; Wakholi, C.; Lohumi, S.; Mukasa, P.; Kim, G.; Kim, J.; Lee, H.; Cho, B.-K. Near-Infrared Hyperspectral Imaging for Online Measurement of the Viability Detection of Naturally Aged Watermelon Seeds. Front. Plant Sci. 2022, 13, 98675. [Google Scholar] [CrossRef]
  36. Xin, P.; Liu, Y.; Yang, L.; Yan, H.; Feng, S.; Zheng, D. Nutritional Quality Analysis and Classification Detection of Buckwheat in Different Harvest Periods. Foods 2024, 13, 2576. [Google Scholar] [CrossRef]
  37. Wu, D.; Sun, D.-W. Advanced Applications of Hyperspectral Imaging Technology for Food Quality and Safety Analysis and Assessment: A Review—Part II: Applications. Innov. Food Sci. Emerg. Technol. 2013, 19, 15–28. [Google Scholar] [CrossRef]
  38. Feng, Y.-Z.; Sun, D.-W. Determination of Total Viable Count (TVC) in Chicken Breast Fillets by near-Infrared Hyperspectral Imaging and Spectroscopic Transforms. Talanta 2013, 105, 244–249. [Google Scholar] [CrossRef]
  39. Kamruzzaman, M.; Makino, Y.; Oshita, S. Non-Invasive Analytical Technology for the Detection of Contamination, Adulteration, and Authenticity of Meat, Poultry, and Fish: A Review. Anal. Chim. Acta 2015, 853, 19–29. [Google Scholar] [CrossRef]
  40. Jin, S.; Liu, X.; Wang, J.; Pan, L.; Zhang, Y.; Zhou, G.; Tang, C. Hyperspectral Imaging Combined with Fluorescence for the Prediction of Microbial Growth in Chicken Breasts under Different Packaging Conditions. LWT 2023, 181, 114727. [Google Scholar] [CrossRef]
  41. Mishra, G.; Panda, B.K.; Ramirez, W.A.; Jung, H.; Singh, C.B.; Lee, S.; Lee, I. Research Advancements in Optical Imaging and Spectroscopic Techniques for Nondestructive Detection of Mold Infection and Mycotoxins in Cereal Grains and Nuts. Comp. Rev. Food Sci. Food Safe 2021, 20, 4612–4651. [Google Scholar] [CrossRef]
  42. Dai, C.; Sun, J.; Huang, X.; Zhang, X.; Tian, X.; Wang, W.; Sun, J.; Luan, Y. Application of Hyperspectral Imaging as a Nondestructive Technology for Identifying Tomato Maturity and Quantitatively Predicting Lycopene Content. Foods 2023, 12, 2957. [Google Scholar] [CrossRef]
  43. Cao, Y.; Li, H.; Sun, J.; Zhou, X.; Yao, K.; Nirere, A. Nondestructive Determination of the Total Mold Colony Count in Green Tea by Hyperspectral Imaging Technology. J. Food Process Eng. 2020, 43, e13570. [Google Scholar] [CrossRef]
  44. Lu, B.; Jun, S.; Ning, Y.; Xiaohong, W.; Xin, Z. Identification of Tea White Star Disease and Anthrax Based on Hyperspectral Image Information. J. Food Process Eng. 2021, 44, e13584. [Google Scholar] [CrossRef]
  45. Ningqiu, T.; Jun, S.; Min, X.; Kunshan, Y.; Yan, C.; Dengjie, L. Identification of Fumigated and Dyed Lycium Barbarum by Hyperspectral Imaging Technology. J. Food Process Eng. 2022, 45, e13950. [Google Scholar] [CrossRef]
  46. Xu, M.; Sun, J.; Cheng, J.; Yao, K.; Wu, X.; Zhou, X. Non-destructive Prediction of Total Soluble Solids and Titratable Acidity in Kyoho Grape Using Hyperspectral Imaging and Deep Learning Algorithm. Int. J. Food Sci. Technol. 2023, 58, 9–21. [Google Scholar] [CrossRef]
  47. Zhou, X.; Sun, J.; Zhang, Y.; Tian, Y.; Yao, K.; Xu, M. Visualization of Heavy Metal Cadmium in Lettuce Leaves Based on Wavelet Support Vector Machine Regression Model and Visible-near Infrared Hyperspectral Imaging. J. Food Process Eng. 2021, 44, e13897. [Google Scholar] [CrossRef]
  48. Cheng, J.; Sun, J.; Yao, K.; Dai, C. Generalized and Hetero Two-Dimensional Correlation Analysis of Hyperspectral Imaging Combined with Three-Dimensional Convolutional Neural Network for Evaluating Lipid Oxidation in Pork. Food Control 2023, 153, 10994. [Google Scholar] [CrossRef]
  49. Tian, Y.; Sun, J.; Zhou, X.; Yao, K.; Tang, N. Detection of Soluble Solid Content in Apples Based on Hyperspectral Technology Combined with Deep Learning Algorithm. Food Process. Preserv. 2022, 46, e16414. [Google Scholar] [CrossRef]
  50. Shi, L.; Sun, J.; Zhang, B.; Wu, Z.; Jia, Y.; Yao, K.; Zhou, X. Simultaneous Detection for Storage Condition and Storage Time of Yellow Peach under Different Storage Conditions Using Hyperspectral Imaging with Multi-Target Characteristic Selection and Multi-Task Model. J. Food Compos. Anal. 2024, 135, 106647. [Google Scholar] [CrossRef]
  51. Tian, Y.; Sun, J.; Zhou, X.; Wu, X.; Lu, B.; Dai, C. Research on Apple Origin Classification Based on Variable Iterative Space Shrinkage Approach with Stepwise Regression—Support Vector Machine Algorithm and Visible-near Infrared Hyperspectral Imaging. J. Food Process Eng. 2020, 43, e13432. [Google Scholar] [CrossRef]
  52. Sun, J.; Nirere, A.; Dusabe, K.D.; Yuhao, Z.; Adrien, G. Rapid and Nondestructive Watermelon (Citrullus lanatus) Seed Viability Detection Based on Visible Near-infrared Hyperspectral Imaging Technology and Machine Learning Algorithms. J. Food Sci. 2024, 89, 4403–4441. [Google Scholar] [CrossRef]
  53. Cheng, J.; Sun, J.; Xu, M.; Zhou, X. Nondestructive Detection of Lipid Oxidation in Frozen Pork Using Hyperspectral Imaging Technology. J. Food Compos. Anal. 2023, 123, 105497. [Google Scholar] [CrossRef]
  54. Cheng, J.; Sun, J.; Yao, K.; Xu, M.; Dai, C. Multi-Task Convolutional Neural Network for Simultaneous Monitoring of Lipid and Protein Oxidative Damage in Frozen-Thawed Pork Using Hyperspectral Imaging. Meat Sci. 2023, 201, 109196. [Google Scholar] [CrossRef] [PubMed]
  55. Sun, J.; Yang, F.; Cheng, J.; Wang, S.; Fu, L. Nondestructive Identification of Soybean Protein in Minced Chicken Meat Based on Hyperspectral Imaging and VGG16-SVM. J. Food Compos. Anal. 2024, 125, 10571. [Google Scholar] [CrossRef]
  56. Ahmad, H.; Sun, J.; Nirere, A.; Shaheen, N.; Zhou, X.; Yao, K. Classification of Tea Varieties Based on Fluorescence Hyperspectral Image Technology and ABC-SVM Algorithm. J. Food Process. Preserv. 2021, 45, e15241. [Google Scholar] [CrossRef]
  57. Yao, K.; Sun, J.; Zhou, X.; Nirere, A.; Tian, Y.; Wu, X. Nondestructive Detection for Egg Freshness Grade Based on Hyperspectral Imaging Technology. J. Food Process Eng. 2020, 43, e13422. [Google Scholar] [CrossRef]
  58. Kim, M.-J.; Yu, W.-H.; Song, D.-J.; Chun, S.-W.; Kim, M.S.; Lee, A.; Kim, G.; Shin, B.-S.; Mo, C. Prediction of Soluble-Solid Content in Citrus Fruit Using Visible–Near-Infrared Hyperspectral Imaging Based on Effective-Wavelength Selection Algorithm. Sensors 2024, 24, 1512. [Google Scholar] [CrossRef]
  59. Zhou, X.; Sun, J.; Tian, Y.; Lu, B.; Hang, Y.; Chen, Q. Hyperspectral Technique Combined with Deep Learning Algorithm for Detection of Compound Heavy Metals in Lettuce. Food Chem. 2020, 321, 126503. [Google Scholar] [CrossRef]
  60. Wang, S.; Sun, J.; Fu, L.; Xu, M.; Tang, N.; Cao, Y.; Yao, K.; Jing, J. Identification of Red Jujube Varieties Based on Hyperspectral Imaging Technology Combined with CARS-IRIV and SSA-SVM. J. Food Process Eng. 2022, 45, e14137. [Google Scholar] [CrossRef]
  61. Afsah-Hejri, L.; Akbari, E.; Toudeshki, A.; Homayouni, T.; Alizadeh, A.; Ehsani, R. Terahertz Spectroscopy and Imaging: A Review on Agricultural Applications. Comput. Electron. Agric. 2020, 177, 105628. [Google Scholar] [CrossRef]
  62. Ma, S.; Li, Y.; Peng, Y. Spectroscopy and Computer Vision Techniques for Noninvasive Analysis of Legumes: A Review. Comput. Electron. Agric. 2023, 206, 10769. [Google Scholar] [CrossRef]
  63. Zhang, Y.; Wang, X.; Wang, Y.; Hu, L.; Wang, P. Detection of Tomato Water Stress Based on Terahertz Spectroscopy. Front. Plant Sci. 2023, 14, 109543. [Google Scholar] [CrossRef] [PubMed]
  64. Zhou, Y.; Wang, X.; Chen, K.; Han, C.; Guan, H.; Wang, Y.; Zhao, Y. Feasibility and Potential of Terahertz Spectral and Imaging Technology for Apple Valsa Canker Detection: A Preliminary Investigation. Spectrochim. Acta Part A Mol. Biomol. Spectrosc. 2025, 327, 12530. [Google Scholar] [CrossRef]
  65. Wang, C.; Zhou, R.; Huang, Y.; Xie, L.; Ying, Y. Terahertz Spectroscopic Imaging with Discriminant Analysis for Detecting Foreign Materials among Sausages. Food Control 2019, 97, 100–104. [Google Scholar] [CrossRef]
  66. Nie, P.; Qu, F.; Lin, L.; He, Y.; Feng, X.; Yang, L.; Gao, H.; Zhao, L.; Huang, L. Trace Identification and Visualization of Multiple Benzimidazole Pesticide Residues on Toona Sinensis Leaves Using Terahertz Imaging Combined with Deep Learning. Int. J. Mol. Sci. 2021, 22, 3425. [Google Scholar] [CrossRef]
  67. Kou, T.; Ye, J.; Wang, J.; Peng, Y.; Wang, Z.; Shi, C.; Wu, X.; Hu, X.; Chen, H.; Zhang, L.; et al. Terahertz Spectroscopy for Accurate Identification of Panax Quinquefolium Basing on Nonconjugated 24(R)-Pseudoginsenoside F11. Plant Phenomics 2021, 2021, 6793457. [Google Scholar] [CrossRef]
  68. Wei, X.; Li, S.; Zhu, S.; Zheng, W.; Zhou, S.; Wu, W.; Xie, Z. Quantitative Analysis of Soybean Protein Content by Terahertz Spectroscopy and Chemometrics. Chemom. Intell. Lab. Syst. 2021, 208, 104199. [Google Scholar] [CrossRef]
  69. Shen, Y.; Yin, Y.; Li, B.; Zhao, C.; Li, G. Detection of Impurities in Wheat Using Terahertz Spectral Imaging and Convolutional Neural Networks. Comput. Electron. Agric. 2021, 181, 105931. [Google Scholar] [CrossRef]
  70. Jay, S.; Baret, F.; Thomas, S.; Weiss, M. Registration of Close-Range, Multi-Lens Multispectral Imagery by Retrieving the Scene 3D Structure. ISPRS J. Photogramm. Remote Sens. 2025, 227, 125–144. [Google Scholar] [CrossRef]
  71. Trabelsi, S.; Nelson, S.O. Free-Space Measurement of Dielectric Properties of Cereal Grain and Oilseed at Microwave Frequencies. Meas. Sci. Technol. 2003, 14, 589–600. [Google Scholar]
  72. Zhang, J.; Bao, Y.; Du, D.; Wang, J.; Wei, Z. OM2S2: On-Line Moisture-Sensing System Using Multifrequency Microwave Signals Optimized by a Two-Stage Frequency Selection Framework. IEEE Trans. Ind. Electron. 2021, 68, 11501–11510. [Google Scholar] [CrossRef]
  73. Li, C.; Zhao, C.; Ren, Y.; He, X.; Yu, X.; Song, Q. Microwave Traveling-Standing Wave Method for Density-Independent Detection of Grain Moisture Content. Measurement 2022, 198, 111373. [Google Scholar] [CrossRef]
  74. Hu, J.; Zhan, C.; Wang, Q.; Shi, H.; He, Y.; Ouyang, A. Research on Highly Sensitive Quantitative Detection of Aflatoxin B2 Solution Based on THz Metamaterial Enhancement. Spectrochim. Acta Part A Mol. Biomol. Spectrosc. 2023, 300, 122809. [Google Scholar] [CrossRef]
  75. Abdolrazzaghi, M.; Daneshmand, M.; Iyer, A.K. Strongly Enhanced Sensitivity in Planar Microwave Sensors Based on Metamaterial Coupling. IEEE Trans. Microw. Theory Tech. 2018, 66, 1843–1855. [Google Scholar] [CrossRef]
  76. Abdolrazzaghi, M.; Nayyeri, V.; Martin, F. Techniques to Improve the Performance of Planar Microwave Sensors: A Review and Recent Developments. Sensors 2022, 22, 6946. [Google Scholar] [CrossRef]
  77. Guzik, P.; Kulawik, P.; Zając, M.; Migdał, W. Microwave Applications in the Food Industry: An Overview of Recent Developments. Crit. Rev. Food Sci. Nutr. 2022, 62, 7989–8008. [Google Scholar] [CrossRef]
  78. Xu, L.; Chen, Z.; Bai, X.; Deng, J.; Zhao, X.; Jiang, H. Determination of Aflatoxin B1 in Peanuts Based on Millimetre Wave. Food Chem. 2025, 464, 141867. [Google Scholar] [CrossRef]
  79. Xu, J.; Riccioli, C.; Sun, D. An Overview on Nondestructive Spectroscopic Techniques for Lipid and Lipid Oxidation Analysis in Fish and Fish Products. Comp. Rev. Food Sci. Food Safe 2015, 14, 466–477. [Google Scholar] [CrossRef]
  80. Richert, R. On Revealing Structural Relaxation of Ionic Liquids by High-Field Dielectric Techniques. J. Non-Cryst. Solids 2023, 616, 122483. [Google Scholar] [CrossRef]
  81. Kraszewski, W.; Nelson, S.O. Microwave resonator for sensing moisture. Can. Agric. Eng. 1994, 36, 231–238. [Google Scholar]
  82. Nelson, S.O.; Kraszewski, A.W.; Trabelsi, S.; Lawrence, K.C. Using Cereal Grain Permittivity for Sensing Moisture Content. IEEE Trans. Instrum. Meas. 2000, 49, 470–475. [Google Scholar] [CrossRef]
  83. Zhong, R.; Xiang, T.; Zheng, Q.; Xu, B. Measurement and Analysis of Dielectric Properties of Agricultural By-Product Powders in Microwave Frequency Range. E3S Web Conf. 2019, 78, 02012. [Google Scholar] [CrossRef]
  84. El-Mesery, H.S.; Mao, H.; Abomohra, A.E.-F. Applications of Non-Destructive Technologies for Agricultural and Food Products Quality Inspection. Sensors 2019, 19, 846. [Google Scholar] [CrossRef] [PubMed]
  85. Nitika; Kaur, J.; Khanna, R. Exploration of Adulteration in Common Raw Spices Using Antenna-Based Sensor. Int. J. Microw. Wirel. Technol. 2023, 15, 1117–1129. [Google Scholar] [CrossRef]
  86. Abduljabar, A.A.; Porch, A.; Barrow, D.A. Real-Time Measurements of Size, Speed, and Dielectric Property of Liquid Segments Using a Microwave Microfluidic Sensor. In Proceedings of the 2014 IEEE MTT-S International Microwave Symposium (IMS2014), Tampa, FL, USA, 1–6 June 2014; pp. 1–4. [Google Scholar]
  87. Wang, J.; Wang, H.; Cheng, L.; Fang, W.; Zhang, X.; Tao, B.; Liao, R. Terahertz Relaxation Polarization Modeling of Micro-Water inside Nano-Modified Dielectrics and Imaging Distribution of Free/Bound Water. Polym. Test. 2023, 122, 108031. [Google Scholar] [CrossRef]
  88. Chen, Y.; Fanourakis, D.; Tsaniklidis, G.; Aliniaeifard, S.; Yang, Q.; Li, T. Low UVA Intensity during Cultivation Improves the Lettuce Shelf-Life, an Effect That Is Not Sustained at Higher Intensity. Postharvest Biol. Technol. 2021, 172, 111376. [Google Scholar] [CrossRef]
  89. Jiao, X.; Yang, H.; Li, X.; Cao, H.; Zhang, N.; Yan, B.; Hu, B.; Huang, J.; Zhao, J.; Zhang, H.; et al. Green and Sustainable Microwave Processing of Surimi Seafood: A Review of Protein Component Interactions, Mechanisms, and Industrial Applications. Trends Food Sci. Technol. 2024, 143, 104266. [Google Scholar] [CrossRef]
  90. Chen, Y.-F.; Zheng, Y.-T.; Zhang, F.-Y.; Liu, Z.-G.; Zhang, L.-Y.; Yang, L.; Sun, X.-D.; Deng, Y.; Wang, Y. High-Temperature Polymer-Based Nanocomposites for High Energy Storage Performance with Robust Cycling Stability. Rare Met. 2023, 42, 3682–3691. [Google Scholar] [CrossRef]
  91. Zhong, R.; Zheng, Q.; Yao, B.; Xiang, T. A Modified Formula for Calculating Dielectric Properties of Granular Agricultural Products in the Microwave Band. E3S Web Conf. 2021, 245, 01002. [Google Scholar] [CrossRef]
  92. Trabelsi, S.; Paz, A.M.; Nelson, S.O. Microwave Dielectric Method for the Rapid, Non-Destructive Determination of Bulk Density and Moisture Content of Peanut Hull Pellets. Biosyst. Eng. 2013, 115, 332–338. [Google Scholar] [CrossRef]
  93. Yoshikawa, N.; Kawahira, K.; Saito, Y.; Todoroki, H.; Taniguchi, S. Estimation of Microwave Penetration Distance and Complex Permittivity of Graphite by Measurement of Permittivity and Direct Current Conductivity of Graphite Powder Mixtures. J. Appl. Phys. 2015, 117, 084105. [Google Scholar] [CrossRef]
  94. Tang, S.-Y.; Xia, Z.-N.; Fu, Y.-J.; Gou, Q. Advances and Applications of Microwave Spectroscopy. Chin. J. Anal. Chem. 2008, 36, 1145–1151. [Google Scholar] [CrossRef]
  95. Jang, J.; Park, J.; Shin, H.J. Terahertz Spectral Analysis: An in-Depth Exploration of Spectroscopy Approaches for Ultrafast Dynamics. Curr. Appl Phys. 2024, 59, 197–207. [Google Scholar] [CrossRef]
  96. Zeng, S.; Zhang, H.; Wang, B.; Zhang, Q.; Lv, H.; Yang, L.; Zhao, D.; Lv, W.; Xiao, H. Advancements in Green and Innovative Low Frequency Microwaves for Agricultural Product Processing: A Comprehensive Review. Food Rev. Int. 2025, 1–21. [Google Scholar] [CrossRef]
  97. Krupka, J.; Derzakowski, K.; Hartnett, J.G. Measurements of the Complex Permittivity and the Complex Permeability of Low and Medium Loss Isotropic and Uniaxially Anisotropic Metamaterials at Microwave Frequencies. Meas. Sci. Technol. 2009, 20, 10570. [Google Scholar] [CrossRef]
  98. Xu, L.; Ni, L.; Deng, J.; Bai, X.; Jiang, H. Feasibility Study on Rapid Determination of Aflatoxin B1 in Wheat by Self-Made Microwave Detection Device. Microchem. J. 2022, 182, 107869. [Google Scholar] [CrossRef]
  99. Gao, Z.; Nanayakkara, O. Application Research of Microwave Non-Destructive Testing Technology in Detecting Reinforcement Corrosion in Concrete. MATEC Web Conf. 2025, 409, 03004. [Google Scholar] [CrossRef]
  100. Menzel, M.I.; Tittmann, S.; Bühler, J.; Preis, S.; Wolters, N.; Jahnke, S.; Walter, A.; Chlubek, A.; Leon, A.; Hermes, N.; et al. Non-invasive Determination of Plant Biomass with Microwave Resonators. Plant Cell Environ. 2009, 32, 368–379. [Google Scholar] [CrossRef]
  101. Zhu, Z.; Guo, W. Frequency, Moisture Content, and Temperature Dependent Dielectric Properties of Potato Starch Related to Drying with Radio-Frequency/Microwave Energy. Sci. Rep. 2017, 7, 9311. [Google Scholar] [CrossRef]
  102. Matsuo, M.; Osada, A.; Kon, S. Non-destructive Prediction of Forage Crop Moisture Contents Using Microwave Transmitted Signals with a Microstrip Transmission Line Sensor. Grassl. Sci. 2020, 66, 225–230. [Google Scholar] [CrossRef]
  103. Li, Z.; Meng, Z.; Soutis, C.; Wang, P.; Gibson, A. Detection and Analysis of Metallic Contaminants in Dry Foods Using a Microwave Resonator Sensor. Food Control 2022, 133, 108634. [Google Scholar] [CrossRef]
  104. Reimer, A.; Wiebe, K.; Rao, J.; Yao, B.; Gui, Y.; Jian, F.; Fields, P.; Jayas, D.S.; Hu, C.-M. A Compact Microwave Device for Monitoring Insect Activity in Grain Samples. Biosyst. Eng. 2018, 175, 27–35. [Google Scholar] [CrossRef]
  105. Xie, J.; Chen, J.; Li, Z.; Yuan, W. Flexible Microwave Sensor Films Based on Nested-Complementary Split Ring Resonator for Liquid Dielectric Constant Detection. Sens. Actuators A 2023, 359, 114461. [Google Scholar] [CrossRef]
  106. Kuang, X.; Zhu, Z.; Guo, J.; Xiang, S. Non-Destructive Detection of Wheat Moisture Content with Frequency Modulated Continuous Wave System under L and S Bands. Comput. Electron. Agric. 2024, 227, 109644. [Google Scholar] [CrossRef]
  107. Yadav, D.N.; Anand, T.; Sharma, M.; Gupta, R.K. Microwave Technology for Disinfestation of Cereals and Pulses: An Overview. J. Food Sci. Technol. 2014, 51, 3568–3576. [Google Scholar] [CrossRef] [PubMed]
  108. Varzakas, T. Quality and Safety Aspects of Cereals (Wheat) and Their Products. Crit. Rev. Food Sci. Nutr. 2016, 56, 2495–2510. [Google Scholar] [CrossRef] [PubMed]
  109. LeBlanc, A.P.; Trabelsi, S.; Rasheed, K.; Miller, J.A. Machine Learning Algorithms for Nondestructive Sensing of Moisture Content in Grain and Seed. IEEE Open J. Instrum. Meas. 2025, 4, 2500214. [Google Scholar] [CrossRef]
  110. Slima, M.B.; Morawski, R.Z.; Kraszewski, A.W.; Barwicz, A.; Nelson, S.O. Calibration of a Microwave System for Measuring Grain Moisture Content. IEEE Trans. Instrum. Meas. 1999, 48, 778–783. [Google Scholar] [CrossRef]
  111. Koyama, C.N.; Liu, H.; Takahashi, K.; Shimada, M.; Watanabe, M.; Khuut, T.; Sato, M. In-Situ Measurement of Soil Permittivity at Various Depths for the Calibration and Validation of Low-Frequency SAR Soil Moisture Models by Using GPR. Remote Sens. 2017, 9, 580. [Google Scholar] [CrossRef]
  112. Muzalevskiy, K.; Fomin, S.; Karavayskiy, A. Optimum Frequency Range for Remote Sensing of Soil Moisture with Various Texture, Density and Organic Matter Content. In Proceedings of the 2022 IEEE International Multi-Conference on Engineering, Computer and Information Sciences (SIBIRCON), Yekaterinburg, Russia, 11 November 2022; pp. 1130–1133. [Google Scholar]
  113. Trabelsi, S.; Nelson, S.O. Microwave Sensing of Quality Attributes of Agricultural and Food Products. IEEE Instrum. Meas. Mag. 2016, 19, 37–41. [Google Scholar] [CrossRef]
  114. Xie, C.; Yang, L.; Zhang, D.; Cui, T.; Zhang, K.; He, X.; Du, Z. Design of Smart Seed Sensor Based on Microwave Detection Method and Signal Calculation Model. Comput. Electron. Agric. 2022, 199, 107178. [Google Scholar] [CrossRef]
  115. Zainal Abidin, Z.; Omar, F.N.; Biak, D.R.A.; Man, Y.C. Alternative for Rapid Detection and Screening of Pork, Chicken, and Beef Using Dielectric Properties in the Frequency of 0.5 to 50 GHz. Int. J. Food Prop. 2016, 19, 1127–1138. [Google Scholar] [CrossRef]
  116. Lei, D.; Xie, Y.; Jia, Z.; Sun, W.; Peng, Z.; Liu, Y. Dielectric Properties of In-Shell Peanuts with Radio Frequency and Microwave Heating Treatment and RF Heating Performance. Postharvest Biol. Technol. 2024, 211, 112800. [Google Scholar] [CrossRef]
  117. Li, M.; Hou, T.; Cai, C.; Lv, Z.; Wu, Y.; Qin, Y. Nondestructive Wheat Moisture Detection System with Metasurface Plane Wave Antenna and De-Embedding Algorithm. IEEE Trans. Instrum. Meas. 2023, 72, 1–9. [Google Scholar] [CrossRef]
  118. Kumar, S.V.; Peters-Lidard, C.D.; Arsenault, K.R.; Getirana, A.; Mocko, D.; Liu, Y. Quantifying the Added Value of Snow Cover Area Observations in Passive Microwave Snow Depth Data Assimilation. J. Hydrometeorol. 2015, 16, 1736–1741. [Google Scholar] [CrossRef]
  119. Jawad, H.; Lanteri, J.; Migliaccio, C.; Pichot, C.; Platt, I.G.; Tan, A.E.-C.; Eccleston, K.W.; Woodhead, I.M. Microwave Modeling and Experiments for Non Destructive Control Improved Quality of Fruit. In Proceedings of the 2017 IEEE Conference on Antenna Measurements & Applications (CAMA), Tsukuba, Japan, 4–6 December 2017; pp. 124–127. [Google Scholar]
  120. Wahab, A.; Aziz, M.M.A.; Sam, A.R.M.; You, K.Y.; Bhatti, A.Q.; Kassim, K.A. Review on Microwave Nondestructive Testing Techniques and Its Applications in Concrete Technology. Constr. Build. Mater. 2019, 209, 135–146. [Google Scholar] [CrossRef]
  121. Nelson, S.O.; Trabelsi, S. Principles for Microwave Moisture and Density Measurement in Grain and Seed. J. Microw. Power Electromagn. Energy 2004, 39, 107–117. [Google Scholar] [CrossRef]
  122. Ramli, N.A.M.; Rahiman, M.H.F.; Kamarudin, L.M.; Zakaria, A.; Mohamed, L. A Review on Frequency Selection in Grain Moisture Content Detection. IOP Conf. Ser. Mater. Sci. Eng. 2019, 705, 012002. [Google Scholar] [CrossRef]
  123. Deng, J.; Ni, L.; Bai, X.; Jiang, H.; Xu, L. Simultaneous Analysis of Mildew Degree and Aflatoxin B1 of Wheat by a Multi-Task Deep Learning Strategy Based on Microwave Detection Technology. LWT 2023, 184, 115047. [Google Scholar] [CrossRef]
  124. Liu, J.; Qiu, S.; Wei, Z. Real-Time Measurement of Moisture Content of Paddy Rice Based on Microstrip Microwave Sensor Assisted by Machine Learning Strategies. Chemosensors 2022, 10, 37. [Google Scholar] [CrossRef]
  125. Tlili, M.; Deshours, F.; Alquié, G.; Kokabi, H.; Hardinata, S.; Koskas, F. Microwave Resonant Sensor for Non-Invasive Characterization of Biological Tissues. IRBM 2018, 39, 445–450. [Google Scholar] [CrossRef]
  126. Zhang, J.; Li, M.; Cheng, J.; Wang, J.; Ding, Z.; Yuan, X.; Zhou, S.; Liu, X. Effects of Moisture, Temperature, and Salt Content on the Dielectric Properties of Pecan Kernels during Microwave and Radio Frequency Drying Processes. Foods 2019, 8, 385. [Google Scholar] [CrossRef]
  127. Jones, S.B.; Sheng, W.; Or, D. Dielectric Measurement of Agricultural Grain Moisture—Theory and Applications. Sensors 2022, 22, 2083. [Google Scholar] [CrossRef] [PubMed]
  128. Tripathi, M.; Sahu, J.N.; Ganesan, P.; Monash, P.; Dey, T.K. Effect of Microwave Frequency on Dielectric Properties of Oil Palm Shell (OPS) and OPS Char Synthesized by Microwave Pyrolysis of OPS. J. Anal. Appl. Pyrolysis 2015, 112, 306–312. [Google Scholar] [CrossRef]
  129. Bai, X.; Ni, L.; Deng, J.; Zhao, X.; Xu, L.; Jiang, H. Quantitative Determination of Wheat Moisture Content Based on Microwave Detection Technique Combined with Multivariate Data Analysis. J. Stored Prod. Res. 2024, 105, 102237. [Google Scholar] [CrossRef]
  130. Dong, J.; Shen, F.; Dong, Y.; Wang, Y.; Fu, W.; Li, H.; Ye, D.; Zhang, B.; Huangfu, J.; Qiao, S.; et al. Noncontact Measurement of Complex Permittivity of Electrically Small Samples at Microwave Frequencies. IEEE Trans. Microw. Theory Techn. 2016, 64, 2883–2893. [Google Scholar] [CrossRef]
  131. Gilmore, C.; Zakaria, A.; Mojabi, P.; Ostadrahimi, M.; Pistorius, S.; Vetri, J.L. The University of Manitoba microwave imaging repository: A two-dimensional microwave scattering database for testing inversion and calibration algorithms [measurements corner]. IEEE Antennas Propag. Mag. 2011, 535, 126–133. [Google Scholar] [CrossRef]
  132. Li, M.; Ma, Y.; Pan, Q.; Qin, Y.; Yuan, M.; Wu, Y.; Cai, C. Density-Independent Wheat Moisture Content Detection Based on DMLA. J. Food Eng. 2025, 388, 112390. [Google Scholar] [CrossRef]
  133. McKeown, M.S.; Trabelsi, S.; Nelson, S.O.; Tollner, E.W. Microwave Sensing of Moisture in Flowing Biomass Pellets. Biosyst. Eng. 2017, 155, 152–160. [Google Scholar] [CrossRef]
  134. Li, C.; Yu, X.; Chen, Z.; Song, Q.; Xu, Y. Free Space Traveling–Standing Wave Attenuation Method for Microwave Sensing of Grain Moisture Content. Meas. Control. 2021, 54, 336–345. [Google Scholar] [CrossRef]
  135. Trabelsi, S.; Nelson, S.O. Microwave Sensing Technique for Nondestructive Determination of Bulk Density and Moisture Content in Unshelled and Shelled Peanuts. Trans. ASABE 2006, 49, 1563–1568. [Google Scholar] [CrossRef]
  136. Ma, F.; Wang, D.; Yin, Y.; Yin, H.; Song, C.; Xu, X.; Sun, Y.; Xue, Y.; Zhao, L. Determining Peanut Moisture Content by Scattering Coefficient. J. Food Eng. 2023, 344, 111398. [Google Scholar] [CrossRef]
  137. Julrat, S.; Trabelsi, S. Influence of Peanut Orientation on Microwave Sensing of Moisture Content in Cleaned Unshelled Peanuts. IEEE Sensors J. 2022, 22, 10515–10523. [Google Scholar] [CrossRef]
  138. Zhou, B.; Yuan, Y.; Wei, Z.; Li, S. A Non-Destructive Moisture Detection System for Unshelled Green Tea Seed Kernels Based on Microwave Technology with Multi-Frequency Scanning Signals. Sensors 2025, 25, 1324. [Google Scholar] [CrossRef] [PubMed]
  139. Wu, C.; Qian, J.; Zhang, J.; Wang, J.; Li, B.; Wei, Z. Moisture Measurement of Tea Leaves during Withering Using Multifrequency Microwave Signals Optimized by Ant Colony Optimization. J. Food Eng. 2022, 335, 111174. [Google Scholar] [CrossRef]
  140. Yan, Y.; Lin, X.; Chen, Z.; Cai, Y.; Chen, Z. A Microwave Sensor for Leaf Moisture Detection Based on Split-Ring Resonator. In Proceedings of the 2020 IEEE Asia-Pacific Microwave Conference (APMC), Hong Kong, China, 8 December 2020; pp. 427–429. [Google Scholar]
  141. Dadshani, S.; Kurakin, A.; Amanov, S.; Hein, B.; Rongen, H.; Cranstone, S.; Blievernicht, U.; Menzel, E.; Léon, J.; Klein, N.; et al. Non-Invasive Assessment of Leaf Water Status Using a Dual-Mode Microwave Resonator. Plant Methods 2015, 11, 8. [Google Scholar] [CrossRef]
  142. Bhattacharya, R.; Cornell, K.; Browning, J. Simulation of a Radio-Frequency Wave Based Bacterial Biofilm Detection Method in Dairy Processing Facilities. Appl. Sci. 2024, 14, 4342. [Google Scholar] [CrossRef]
  143. Lewis, M.A.; Trabelsi, S.; Bennett, R.S.; Chamberlin, K.D. Utilization of a Resonant Cavity for Characterization of Single In-Shell Peanuts. Food Anal. Methods 2024, 17, 855–866. [Google Scholar] [CrossRef]
  144. Zhang, Y.; Zhao, J.; Cao, J.; Mao, B. Microwave Metamaterial Absorber for Non-Destructive Sensing Applications of Grain. Sensors 2018, 18, 1912. [Google Scholar] [CrossRef]
  145. Dyroff, C.; Weibring, P.; Fried, A.; Richter, D.; Walega, J.G.; Zahn, A.; Freude, W.; Werle, P. Stark-Enhanced Diode-Laser Spectroscopy of Formaldehyde Using a Modified Herriott-Type Multipass Cell. Appl. Phys. B Lasers Opt. 2007, 88, 117–123. [Google Scholar] [CrossRef]
  146. Feng, L.; Zhang, M.; Dong, Z.; Guo, J.; Zhang, H.; Liu, Z. Electrical Impedance Spectroscopy: Potential Non-Destructive Method for Aflatoxin B1 in Peanut. J. Food Meas. Charact. 2024, 18, 9353–9363. [Google Scholar] [CrossRef]
  147. Soulier, M.; Maho, T.; Lo, J.; Guillot, P.; Muja, C. Bread Wheat (Triticum aestivum L.) Fungal and Mycotoxin Contamination Control Enhanced by a Dual-Frequency Cold Plasma. Food Control 2024, 163, 110477. [Google Scholar] [CrossRef]
  148. Hussein, M.I.; Jithin, D.; Rajmohan, I.J.; Sham, A.; Saeed, E.E.M.A.; AbuQamar, S.F. Microwave Characterization of Hydrophilic and Hydrophobic Plant Pathogenic Fungi Using Open-Ended Coaxial Probe. IEEE Access 2019, 7, 45841–45849. [Google Scholar] [CrossRef]
  149. Deng, J.; Zhao, X.; Luo, W.; Bai, X.; Xu, L.; Jiang, H. Microwave Detection Technique Combined with Deep Learning Algorithm Facilitates Quantitative Analysis of Heavy Metal Pb Residues in Edible Oils. J. Food Sci. 2024, 89, 6005–6015. [Google Scholar] [CrossRef] [PubMed]
  150. Xu, L.; Chen, Z.; Deng, J.; Bai, X.; Gao, Y.; Jiang, H. Rapid Quantitative and Qualitative Analysis of Talcum Powder in Wheat Flour by Microwave Detection Combined with Multivariate Analysis. Microchem. J. 2024, 204, 111125. [Google Scholar] [CrossRef]
  151. Anjaneyulu, B.; Reddy, N.S.S. Design of Low Power High-Speed Full, Swing 11T CNTFET Adder. e-Prime Adv. Electr. Eng. Electron. Energy 2024, 8, 100516. [Google Scholar] [CrossRef]
  152. Voinigescu, S.P.; Dickson, T.O.; Beerkens, R.; Khalid, I.; Westgaard, P. A Comparison of Si CMOS, SiGe BiCMOS, and InP HBT Technologies for High-Speed and Millimeter-Wave ICs. In Proceedings of the Digest of Papers. 2004 Topical Meeting on Silicon Monolithic Integrated Circuits in RF Systems, Atlanta, GA, USA, 8–10 September 2004; pp. 111–114. [Google Scholar]
  153. Wan, J.; Fei, Z.; Liu, Z.; Qi, Q.; Han, F.; Li, X.; Chen, Z. A 20.65-to-40.55 GHz Dual-Core Quad-Mode VCO with Mode-Independent Transformer-Switching Technique in 65-Nm CMOS. IEEE Trans. Circuits Syst. II 2023, 70, 4073–4077. [Google Scholar] [CrossRef]
  154. Liu, X.; Chao, Y.; Luong, H.C. A 59-to-276-GHz CMOS Signal Generator Using Varactor-Less VCO and Dual-Mode ILFD. IEEE J. Solid-State Circuits 2021, 56, 2324–2334. [Google Scholar] [CrossRef]
  155. Fan, L.-F.; Chai, Z.-Q.; Zhao, P.-F.; Tian, Z.-F.; Wen, S.-Q.; Li, S.-M.; Wang, Z.-Y.; Huang, L. Nondestructive Measurement of Husk-Covered Corn Kernel Layer Dynamic Moisture Content in the Field. Comput. Electron. Agric. 2021, 182, 106034. [Google Scholar] [CrossRef]
  156. Min, H.; Cho, B.-K. Spectroscopic Techniques for Nondestructive Detection of Fungi and Mycotoxins in Agricultural Materials: A Review. J. Biosyst. Eng. 2015, 40, 67–77. [Google Scholar] [CrossRef]
  157. Vuran, M.C.; Lunar, M.M.; Nie, S.; Ge, Y.; Pitla, S.; Bai, G.; Koksal, C.E. Millimeter-Wave Agricultural Channel Measurements in Corn and Soybean Fields at Different Growth Stages. In Proceedings of the 2022 IEEE International Symposium on Antennas and Propagation and USNC-URSI Radio Science Meeting (AP-S/URSI), Denver, CO, USA, 10 July 2022; pp. 1686–1687. [Google Scholar]
  158. Cui, F.; Dong, G.; Chen, B.; Yong, P.; Peng, S. Application of Ground Penetrating Radar Technology in Moisture Content Detection of Stored Grain. J. Agric. Eng. 2023, 54, 1472. [Google Scholar]
  159. Pattanayak, S.S.; Laskar, S.H.; Sahoo, S. Progress on Agricultural Residue-Based Microwave Absorber: A Review and Prospects. J. Mater. Sci. 2021, 56, 4097–4119. [Google Scholar] [CrossRef]
  160. Geisslitz, S.; Longin, C.F.H.; Scherf, K.A.; Koehler, P. Comparative Study on Gluten Protein Composition of Ancient (Einkorn, Emmer and Spelt) and Modern Wheat Species (Durum and Common Wheat). Foods 2019, 8, 409. [Google Scholar] [CrossRef] [PubMed]
  161. Wu, K.; Lambot, S. Effect of Radar Incident Angle on Full-Wave Inversion for the Retrieval of Medium Surface Permittivity for Drone-Borne Applications. IEEE Trans. Geosci. Remote Sens. 2022, 60, 1–10. [Google Scholar] [CrossRef]
  162. Xu, Z.; Li, H.; Jin, X.; Su, F.; Xu, G.; Lambot, S. A Synergistic GPR Approach of Back Projection Algorithm and Full-Wave Inversion for Reconstruction in Unknown Multilayered Environments. IEEE Trans. Geosci. Remote Sens. 2024, 62, 1–18. [Google Scholar] [CrossRef]
  163. El-Aassar, O.; Rebeiz, G.M. Octave-Tuning Dual-Core Folded VCO Leveraging a Triple-Mode Switch-Less Tertiary Magnetic Loop. IEEE J. Solid-State Circuits 2021, 56, 1475–1486. [Google Scholar] [CrossRef]
  164. Liao, Y.; Wang, K.; Zhu, H.; Ji, X. Crosstalk in CMOS Terahertz Detector Array with On-Chip SPR Antenna. IEEE Photonics J. 2022, 14, 1–6. [Google Scholar] [CrossRef]
  165. Zhong, S.; Su, L.; Xu, M.; Loke, D.; Yu, B.; Zhang, Y.; Zhao, R. Recent Advances in Artificial Sensory Neurons: Biological Fundamentals, Devices, Applications, and Challenges. Nano Micro Lett. 2024, 17, 61. [Google Scholar] [CrossRef]
  166. Rogdakis, K.; Psaltakis, G.; Fagas, G.; Quinn, A.; Martins, R.; Kymakis, E. Hybrid Chips to Enable a Sustainable Internet of Things Technology: Opportunities and Challenges. Discov. Mater. 2024, 4, 4. [Google Scholar] [CrossRef]
  167. Hasler, J.; Hao, C. Programmable Analog System Benchmarks Leading to Efficient Analog Computation Synthesis. ACM Trans. Reconfig. Technol. Syst. 2024, 17, 1–25. [Google Scholar] [CrossRef]
  168. Fujishima, M. Key Technologies for THz Wireless Link by Silicon CMOS Integrated Circuits. Photonics 2018, 5, 50. [Google Scholar] [CrossRef]
  169. Joseph, A.; Dahlstrom, M.; Liu, Q.; Orner, B.; Liu, X.; Sheridan, D.; Rassel, R.; Dunn, J.; Ahlgren, D. SiGe HBT BiCMOS Technology for Millimeter-wave Applications. Phys. Status Solidi C 2006, 3, 448–451. [Google Scholar] [CrossRef]
  170. Racanelli, M.; Kempf, P. SiGe BiCMOS Technology for RF Circuit Applications. IEEE Trans. Electron Devices 2005, 52, 1259–1270. [Google Scholar] [CrossRef]
  171. Soyuer, M.; Ainspan, H.A.; Meghelli, M.; Plouchart, J.-O. Low-Power Multi-GHz and Multi-Gb/s SiGe BiCMOS Circuits. Proc. IEEE 2000, 88, 1572–1582. [Google Scholar] [CrossRef]
  172. Preisler, E. A Commercial Foundry Perspective of SiGe BiCMOS Process Technologies. In Proceedings of the 2020 IEEE BiCMOS and Compound Semiconductor Integrated Circuits and Technology Symposium (BCICTS), Monterey, CA, USA, 16 November 2020; pp. 1–5. [Google Scholar]
  173. Ghosh, S.; Sarkar, M.; Frentrup, M.; Kappers, M.J.; Oliver, R.A. Microstructure and Reflectance of Porous GaN Distributed Bragg Reflectors on Silicon Substrates. J. Appl. Phys. 2024, 136, 043105. [Google Scholar] [CrossRef]
  174. Kazior, T.E.; LaRoche, J.R.; Hoke, W.E. More Than Moore: GaN HEMTs and Si CMOS Get It Together. In Proceedings of the 2013 IEEE Compound Semiconductor Integrated Circuit Symposium (CSICS), Monterey, CA, USA, 13–16 October 2013; pp. 1–4. [Google Scholar]
  175. Yang, X.; Zhao, Z.; Wang, C.; Xu, J.; Liu, K.; Qiu, J. Analysis and Parameter Design of SiC-Based Current Source Inverter (CSI). World Electr. Veh. J. 2022, 13, 187. [Google Scholar] [CrossRef]
  176. Hamouche, H.; Shabat, M.M.; Zoppi, G. Field Enhancement in Hydrogen Storage by Periodic Layered Structures. Surf. Interfaces 2022, 32, 102085. [Google Scholar] [CrossRef]
  177. Singh, H.; Sharma, A.; Gupta, A.; Singhal, A. A Polarization-insensitive Metamaterial Absorber for Moisture-sensing Applications of Agriculture Products. Microw. Opt. Technol. Lett. 2023, 66, e33907. [Google Scholar] [CrossRef]
  178. Tian, S.; Yang, X.; Peng, H.; Zhang, T.; Gao, F.; Wu, J. Frequency Domain Time Reversal Adaptive Focusing on Nondestructive Testing Imaging Method for Composite Materials. J. Nondestruct. Eval. 2025, 44, 82. [Google Scholar] [CrossRef]
  179. Musa, A.; Hakim, M.L.; Alam, T.; Islam, M.T.; Alamri, S.; Alshammari, A.S.; Soliman, M.S. Permeability Negative Split Square Resonator for Solid Materials Dielectric Constant and Aqueous Solution pH Sensing Applications. Sens. Actuators A 2024, 369, 115107. [Google Scholar] [CrossRef]
  180. Kazemi, N.; Abdolrazzaghi, M.; Musilek, P.; Baladi, E. A Planar Compact Absorber for Microwave Sensing Based on Transmission-Line Metamaterials. IEEE Sens. J. 2024, 24, 41864–41874. [Google Scholar] [CrossRef]
  181. Chen, L.; Yu, X.; Gao, M.; Xu, C.; Zhang, J.; Zhang, X.; Zhu, M.; Cheng, Y. Renewable Biomass-Based Aerogels: From Structural Design to Functional Regulation. Chem. Soc. Rev. 2024, 53, 7489–7530. [Google Scholar] [CrossRef]
  182. Chen, T.; Li, S.; Sun, H. Metamaterials Application in Sensing. Sensors 2012, 12, 2742–2765. [Google Scholar] [CrossRef]
  183. Prasath, B.; Akila, M. AETC: An Automated Pest Detection and Classification Model Using Optimal Integration of Yolo + SSD and Adaptive Ensemble Transfer CNN with IoT-Assisted Pest Images. Knowl. Inf. Syst. 2024, 66, 7077–7108. [Google Scholar] [CrossRef]
  184. Song, Q.; Zhou, Y.; Jia, E.; Wang, J.; Zhang, M.; Zhang, B. Large Area Crystalline Weyl Semimetal with Nano Au Film Based Micro-Fold Line Array for THz Detector. Sci. China Technol. Sci. 2023, 66, 3267–3275. [Google Scholar] [CrossRef]
  185. Sitharthan, R.; Rajesh, M.; Vimal, S.; Saravana Kumar, E.; Yuvaraj, S.; Jacob Raglend, I.; Vengatesan, K. A Novel Autonomous Irrigation System for Smart Agriculture Using AI and 6G Enabled IoT Network. Microprocess. Microsyst. 2023, 101, 104905. [Google Scholar]
  186. Adamou Ismael, H.; Laguidi, A.; Mejdoub, Y. A Comparative Study on LPWAN Standards: Nb-IoT and LTE-M. ITM Web Conf. 2023, 52, 01007. [Google Scholar] [CrossRef]
  187. Palta, P.; Kaur, P.; Mann, K.S. Dielectric Behavior of Soil as a Function of Frequency, Temperature, Moisture Content and Soil Texture: A Deep Neural Networks Based Regression Model. J. Microw. Power Electromagn. Energy 2022, 56, 145–167. [Google Scholar] [CrossRef]
  188. Zhang, H.; He, L.; Gioia, F.D.; Choi, D.; Elia, A.; Heinemann, P. LoRaWAN Based Internet of Things (IoT) System for Precision Irrigation in Plasticulture Fresh-Market Tomato. Smart Agric. Technol. 2022, 2, 100053. [Google Scholar] [CrossRef]
  189. Marini, R.; Mikhaylov, K.; Pasolini, G.; Buratti, C. Low-Power Wide-Area Networks: Comparison of LoRaWAN and NB-IoT Performance. IEEE Internet Things J. 2022, 9, 21051–21063. [Google Scholar] [CrossRef]
  190. Xiong, R.; Liang, C.; Zhang, H.; Xu, X.; Luo, J. FlyingLoRa: Towards Energy Efficient Data Collection in UAV-Assisted LoRa Networks. Comput. Netw. 2023, 220, 109511. [Google Scholar] [CrossRef]
  191. Dangana, M.; Ansari, S.; Abbasi, Q.H.; Hussain, S.; Imran, M.A. Suitability of NB-IoT for Indoor Industrial Environment: A Survey and Insights. Sensors 2021, 21, 5284. [Google Scholar] [CrossRef] [PubMed]
  192. Nauman, A.; Jamshed, M.A.; Ahmad, Y.; Saad, M.; Bilal, M.; Shanmuganathan, V.; Kim, S.W. Injecting Cognitive Intelligence into Beyond-5G Networks: A MAC Layer Perspective. Comput. Electr. Eng. 2023, 108, 108717. [Google Scholar] [CrossRef]
  193. Sneha; Malik, P.; Sharma, R.; Ghosh, U.; Alnumay, W.S. Internet of Things and Long-Range Antenna’s; Challenges, Solutions and Comparison in next Generation Systems. Microprocess. Microsyst. 2023, 103, 104934. [Google Scholar] [CrossRef]
  194. Liu, X.; An, P.; Chen, Y.; Huang, X. An Improved Lossless Image Compression Algorithm Based on Huffman Coding. Multimed. Tools Appl. 2021, 81, 4781–4795. [Google Scholar] [CrossRef]
  195. Jang, Y.S.; Usman, M.R.; Usman, M.A.; Shin, S.Y. Swapped Huffman Tree Coding Application for Low-Power Wide-Area Network (LPWAN). In Proceedings of the 2016 International Conference on Smart Green Technology in Electrical and Information Systems (ICSGTEIS), Denpasar, Indonesia, 6–8 October 2016; pp. 53–58. [Google Scholar]
  196. Shahra, E.Q.; Wu, W.; Basurra, S.; Aneiba, A. Intelligent Edge-Cloud Framework for Water Quality Monitoring in Water Distribution System. Water 2024, 16, 196. [Google Scholar] [CrossRef]
  197. Pu, H.; Yu, J.; Sun, D.-W.; Wei, Q.; Wang, Z. Feature Construction Methods for Processing and Analysing Spectral Images and Their Applications in Food Quality Inspection. Trends Food Sci. Technol. 2023, 138, 726–737. [Google Scholar] [CrossRef]
  198. Srivastava, S.; Sadistap, S. Non-Destructive Sensing Methods for Quality Assessment of on-Tree Fruits: A Review. J. Food Meas. Charact. 2017, 12, 497–526. [Google Scholar] [CrossRef]
Figure 1. Location of microwave millimeter waves in the electromagnetic spectrum.
Sensors 25 04783 g001
Figure 2. Microwave NDT in agriculture: challenges and roadmap for future evolution.
Sensors 25 04783 g002
Table 1. Comparison table of nondestructive testing techniques.
Technical
Dimension
NIR and FTIRHISTHz-TDSMicrowaveMillimeter Wave
Frequency range [3]700–2500 nm400–2500 nm0.1–10 THz300 MHz–3000 GHz30–300 GHz
2.5–25 μm
Major applications [66]Surface composition analysisVisualization of toxin distributionPesticide residue detectionMoisture detectionTrace toxin detection
Detecting
sensitivity [66]
Tolerance ± 0.3–2.1 μg/kgTolerance 6.65 mg/kSensitivity
94.51–100%
Tolerance < 0.5%Limit of detection 0.1 μg/kg
Scope of
application
[23]
Laboratory precision composition analysisImaging of toxin distribution in surface homogeneous samplesHigh-precision molecular fingerprinting in the laboratoryReal-time field testing High value-added scenarios
Equipment cost
[7,63]
Medium (tungsten halogen lamp + silicon-based detector)High (high-precision spectrometer + imaging system)Very high (cryogenic detector + precision optics)Low (portable antenna + CMOS chip)Medium (CMOS integrated design)
Field suitability [3]Requires shading and is susceptible to dust disturbanceDependent on a stable light source, with weak outdoor adaptabilityRequires a dry nitrogen environment, complicated pre-treatmentStrong adaptability (stable operation in rain and fog)Highly resistant to interference (supports real-time detection of dynamic environments)
Penetration [78]Low (surface micron level)Low (surface detection)Medium (millimeters, suppressed by moisture)High (centimeters, penetrating non-metallic materials)High (millimeters to support package integrity testing)
Data dimensions and processing efficiency [49]One-dimensional spectra with simple processingThree-dimensional data cube, requiring dimensionality reductionTime domain spectroscopy + imaging with terabytes of data1D/2D imaging with real-time processingMulti-dimensional signal fusion with support for edge computing
Table 2. Microwave-based moisture detection in agricultural products: representative applications.
MaterialSystemDetection PrincipleKey MetricsRef.
WheatSensors 25 04783 i001Combining Competitive Adaptive Re-weighted Sampling (CARS), Genetic Algorithm (GA), and Support Vector Regression (SVR) feature selection and modeling.R2 = 0.976[129]
WheatSensors 25 04783 i002Multi-band (L/S) dielectric response; Partial Least Squares (PLS)/SVR/Extreme Learning Machine (ELM) modelingR2 = 0.984[104]
WheatSensors 25 04783 i003Dielectric Hypersurface Lens Antenna; density-independent calibrationRMSE = 0.178%[132]
Peanut-hull pellets and pine-sawdust pelletsSensors 25 04783 i004Single-frequency (5.8 GHz) density-independent calibration via permittivity functionMoisture Root mean square deviation (RMSD) < 0.5% (flowing vs. static) at 0.2–3.2 kg/s flow rates[133]
Rice and
maize
Sensors 25 04783 i005Traveling–standing wave attenuationRice: R2 = 0.988,
SEP = 0.59%
Maize: R2 = 0.991,
SEP = 0.34%
[133]
Wheat and soybeanSensors 25 04783 i006Traveling–standing wave nodes; density-independent calibrationSoybean: R2 = 0.995, SEP = 0.56%
Wheat: R2 = 0.975, SEP = 0.98%
[73]
Single in-shell peanuts Sensors 25 04783 i007Resonant cavity perturbation at 3.7–4.1 GHz (measuring Δf, Q factor, S21); dielectric property calculationAI classification accuracy: 86.3% (89.5% training)
Intact/Empty ID accuracy: 91%/100%
[143]
Peanut (shelled)Sensors 25 04783 i008Scattering parameters (S-parameters); Fully Connected Deep Neural Network (FC-DNN) modelingSEP = 0.56%[136]
PeanutSensors 25 04783 i009Dielectric method (pellets)R2 = 1.000,
RMSE = 0.159%
[92]
Unshelled tea seedsSensors 25 04783 i010Multi-frequency (2–10 GHz) microwave scanning (attenuation and phase shift spectra) with ANN modeling and moisture calibration functionANN R2 = 0.988–0.996 for seed MC; calibrated kernel MC R2 = 0.989; and MC range: 6.94–26.88% wet basis[138]
Tea leavesSensors 25 04783 i011Multi-frequency optimization (Ant Colony Optimization), stacked ensemble modelingR2 = 0.994[139]
Oil–water mixturesSensors 25 04783 i012Nested-Complementary Split Ring Resonator (NCSRR); resonance frequency shiftAn increase in the dielectric constant of the liquid to be measured leads to a linear decrease in the resonant frequency of the sensor[105]
Tomato and tobaccoSensors 25 04783 i013Microwave resonator; dielectric shift vs. fresh weightTomato: R2 = 0.93
Tobacco: R2 = 0.81
[100]
Plant leavesSensors 25 04783 i014Dual-frequency resonator (2.4 GHz/150 MHz); water content and ionic conductivityCorrelation (p < 0.05)[141]
SilageSensors 25 04783 i015Microstrip transmission line; phase-amplitude ratio (Δφ/ΔA)Barley: R2 = 0.962
Maize: R2 = 0.808
[142]
Disclaimer/Publisher’s Note: The statements, opinions and data contained in all publications are solely those of the individual author(s) and contributor(s) and not of MDPI and/or the editor(s). MDPI and/or the editor(s) disclaim responsibility for any injury to people or property resulting from any ideas, methods, instructions or products referred to in the content.

