


Shock Wave Pressure Measurement and Calibration Method Based on Bar Pressure Sensor

Abstract
1. Introduction
2. Materials and Methods
2.1. Bar Pressure Sensor Design
2.1.1. Selection of the Pressure Bar Materials
2.1.2. Design of the Pressure Bar Diameter
2.1.3. Design of the Pressure Bar Length
2.2. Shock Wave Pressure Measurement System Based on the Bar Pressure Sensor
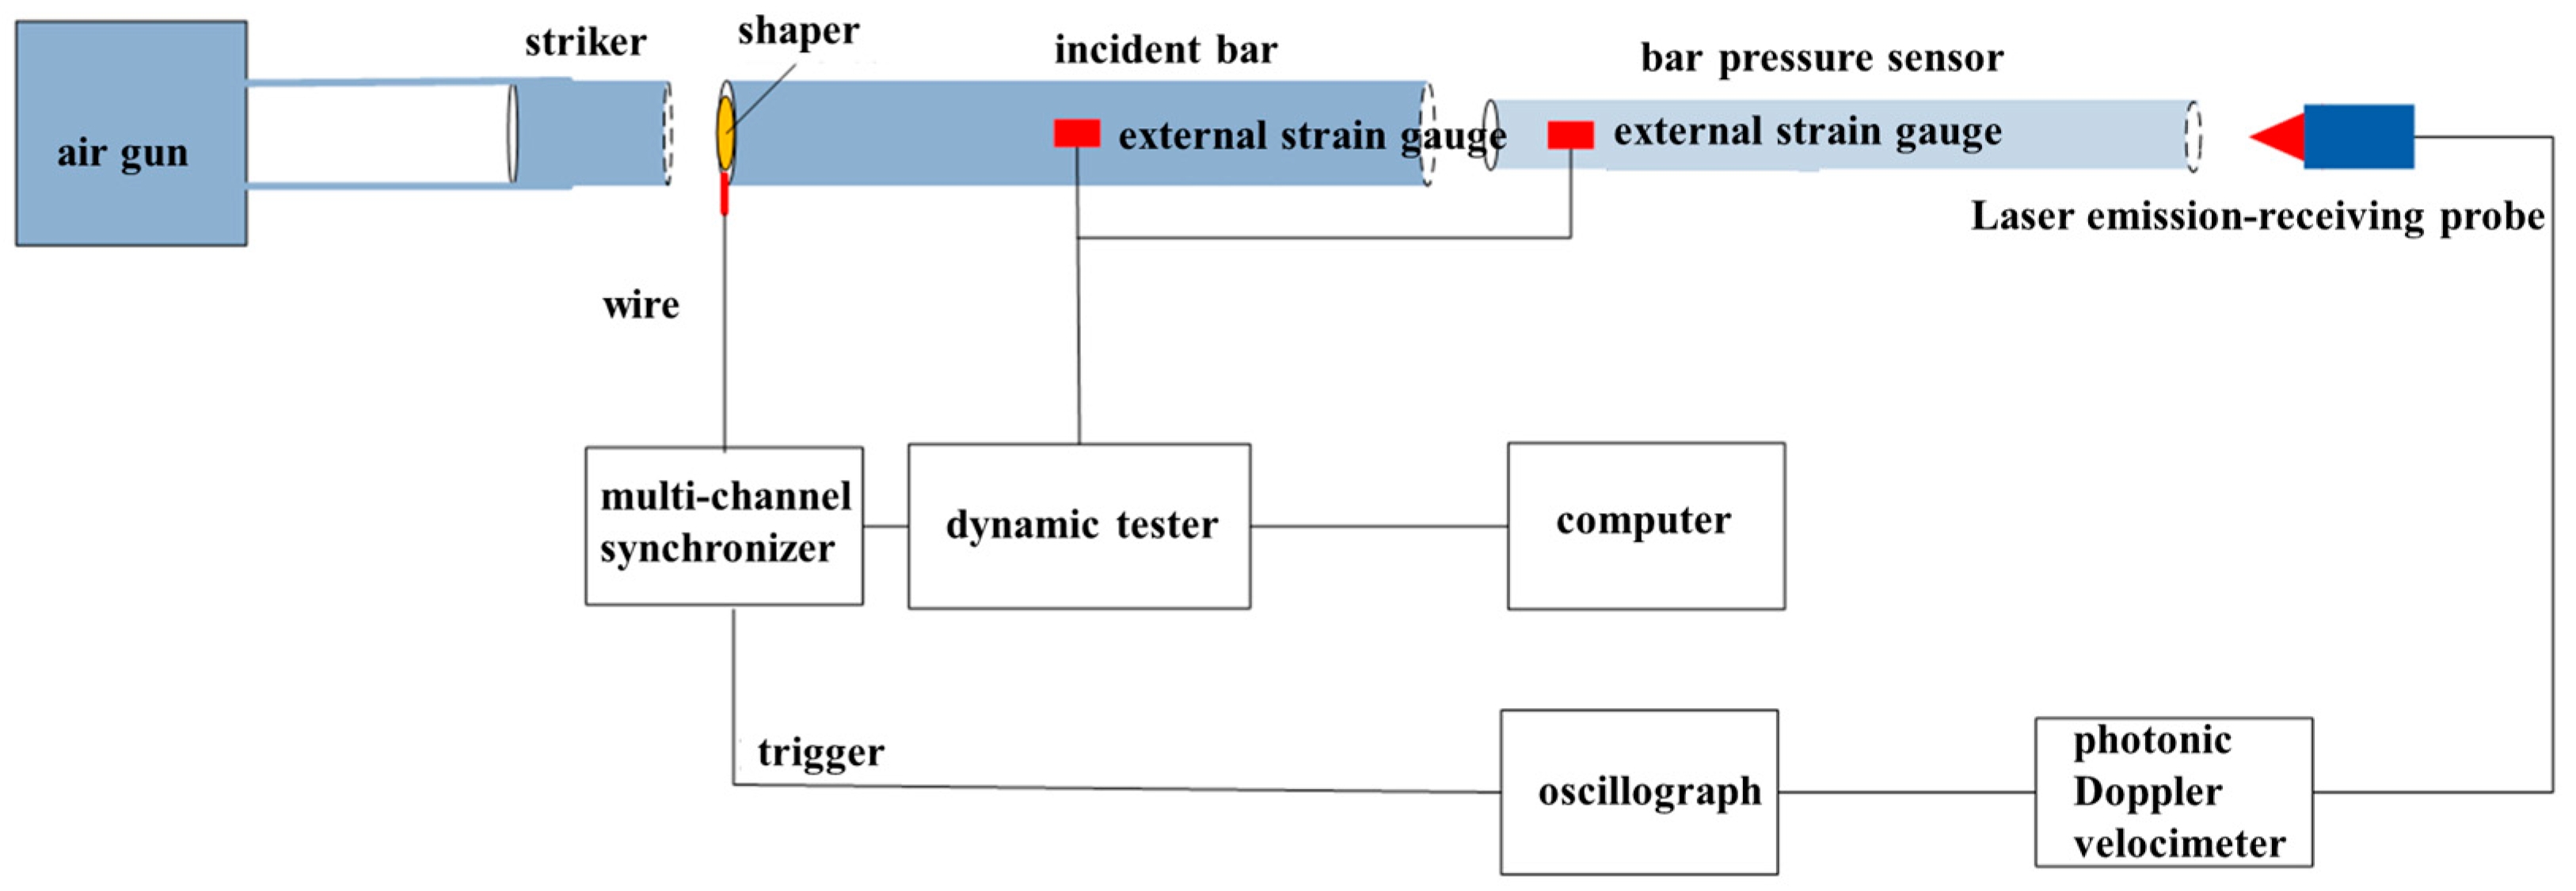
2.3. Calibration Test System
3. Results and Discussion
3.1. Experimental Overview
3.2. Experimental Results and Analysis
4. Conclusions
Author Contributions
Funding
Informed Consent Statement
Data Availability Statement
Conflicts of Interest
References
- Zhang, Y.P.; Chi, J.C.; Gong, Y.Q.; Wang, G.J. Explosion shock wave pressure test technology and its complex signal processing method. In China Instrumentation Society Youth Academic Conference; Youth Committee of China Instrument and Control Society: Beijing, China, 2007. [Google Scholar]
- Zhang, T. Explosion Shock Wave Measurement Technology: Electrical Measurement; National Defense Industry Press: Beijing, China, 1984. [Google Scholar]
- Hu, Y.F.; Liu, J.Q.; Gu, W.B.; Jin, J.F. PVDF Stress test technology and its application in explosion shock test of porous materials. Explos. Shock. Waves 2016, 36, 655–662. [Google Scholar]
- Hopkinson, B. A method of measuring the pressure produced in the detonation of high explosives or by the impact of bullets. Philos. Trans. R. Soc. London. Ser. A Contain. Pap. A Math. Phys. Character 1914, 213, 437–456. [Google Scholar]
- Davies, R.M. A critical study of the Hopkinson compression sensor. Philosophical Transactions of the Royal Society of London. Ser. A Contain. Pap. A Math. Phys. Character 1948, 240, 375–457. [Google Scholar]
- Hauser, F.E. Techniques for measuring stress-strain relations at high strain rates. Exp. Mech. 1966, 6, 395–402. [Google Scholar] [CrossRef]
- Edwards, D.H.; Davies, L.; Lawrence, T.R. The application of a piezoelectric bar gauge to shock tube studies. J. Sci. Instrum. 1964, 64, 609–613. [Google Scholar] [CrossRef]
- Ragland, K.W.; Cullen, R.E. Piezoelectric pressure transducer with acoustic absorbing rod. Rev. Sci. Instrum. 1967, 38, 740–742. [Google Scholar] [CrossRef]
- Dick, R.D.; Williams, J.D.; Wang, X.J.; Young, C.I. Measurement of Pressure from Explosives in a Closed Chamber and the Free Field; Defense Technical Information Center: Ft. Belvoir, VA, USA, 1996; pp. 36–42.
- Hu, Y.L.; Lin, J.D.; Jin, F.H.; Shi, P.J.; Hu, H. Application of strain bar pressure sensor in shock wave load test. Exp. Mech. 2006, 26, 547–552. [Google Scholar]
- Shi, P.J.; Ye, X.B.; Hu, Y.L. Application of compression sensor strain gauge pressure sensor in explosion shock wave load test. Vib. Shock. 2007, 21, 126–128. [Google Scholar]
- Zhang, D.Z.; Li, Y.; Zhong, F.P.; Lin, J.D.; Wang, D.W.; Wang, C.L. Influence of strut material on reflected overpressure measurement. J. Dalian Univ. Technol. 2014, 54, 488–490. [Google Scholar]
- Yi, C.H.; Hu, M.E.; Yu, J.Q.; Gu, Y. Compression sensor test method of shock wave wall reflection pressure. J. Ordnance 2007, 28, 1257–1260. [Google Scholar]
- Yang, J. Research on Shock Wave Reflection Pressure Test Technology Based on Compression Sensor and PDV. Ph.D. Thesis, Xi’an Institute of Optics and Precision Mechanics, Chinese Academy of Sciences, Xi’an, China, 2021. [Google Scholar]
- Kolsky, H. An investigation of the mechanical properties of materials at very high rates of loading. Proc. Phys. Soc. Sect. B 1949, 62, 676. [Google Scholar] [CrossRef]
- Davis, H.J.; Curchack, H.D. Shock Tube Techniques and Instrumentation; Defense Technical Information Center: Ft. Belvoir, VA, USA, 1969.
- Gaydon, A.G.; Hurle, I.R. The Shock Tube in High-Temperature Chemical Physics; Chapman and Hall: London, UK, 1963. [Google Scholar]
- Li, G.; Ukai, T.; Kontis, K. Characterization of a novel open-ended shock tube facility based on detonation transmission tubing. Aerosp. Sci. Technol. 2019, 94, 105388. [Google Scholar] [CrossRef]
- Pain, H.J.; Rogers, E.W.E. Shock waves in gases. Rep. Prog. Phys. 1962, 25, 287. [Google Scholar] [CrossRef]
- Svete, A.; Amer, E.; Jönsson, G.; Arrhén, F. A method for correcting the high-frequency mechanical vibration effects in the dynamic calibration of pressure measurement systems using a shock tube. Mech. Syst. Signal Process. 2023, 193, 110246. [Google Scholar] [CrossRef]
- Svete, A.; Castro, F.J.H.; Kutin, J. Effect of the dynamic response of a side-wall pressure measurement system on determining the pressure step signal in a shock tube using a time-of-flight method. Sensors 2022, 22, 2103. [Google Scholar] [CrossRef] [PubMed]
- Zhao, H.; Gary, G. On the use of SHPB techniques to determine the dynamic behavior of materials in the range of small strains. Int. J. Solids Struct. 1996, 33, 3363–3375. [Google Scholar] [CrossRef]
- Dolan, D.H. Technology and times scales in Photonic Doppler Velocimetry (PDV). Meas. Sci. Technol. 2024, 35, 061001. [Google Scholar] [CrossRef]
- Huang, Z.P.; He, Y.H. Explosion Measurement Techniques; Beijing Institute of Technology Press: Beijing, China, 2005; pp. 147–150. [Google Scholar]
- Lu, F.Y.; Chen, R.; Lin, Y.L.; Zhao, P.D.; Zhang, D. Hopkinson Bar Techniques; Science Press: Beijing, China, 2013; pp. 23–27. [Google Scholar]


| Material | Diameter (mm) | Length (mm) | Elastic Modulus (GPa) | Poisson’s Ratio σ | Density (g/cm3) | Wave Velocity (m/s) | Rise Time (μs) | Measurement Time (μs) | Measuring Range (MPa) |
|---|---|---|---|---|---|---|---|---|---|
| SKH51 | 4 | 1000 | 207.35 | 0.274 | 7.8 | 5170 | 2.1 | 387 | 785 |
| 6 | 1500 | 3.1 | 580 |
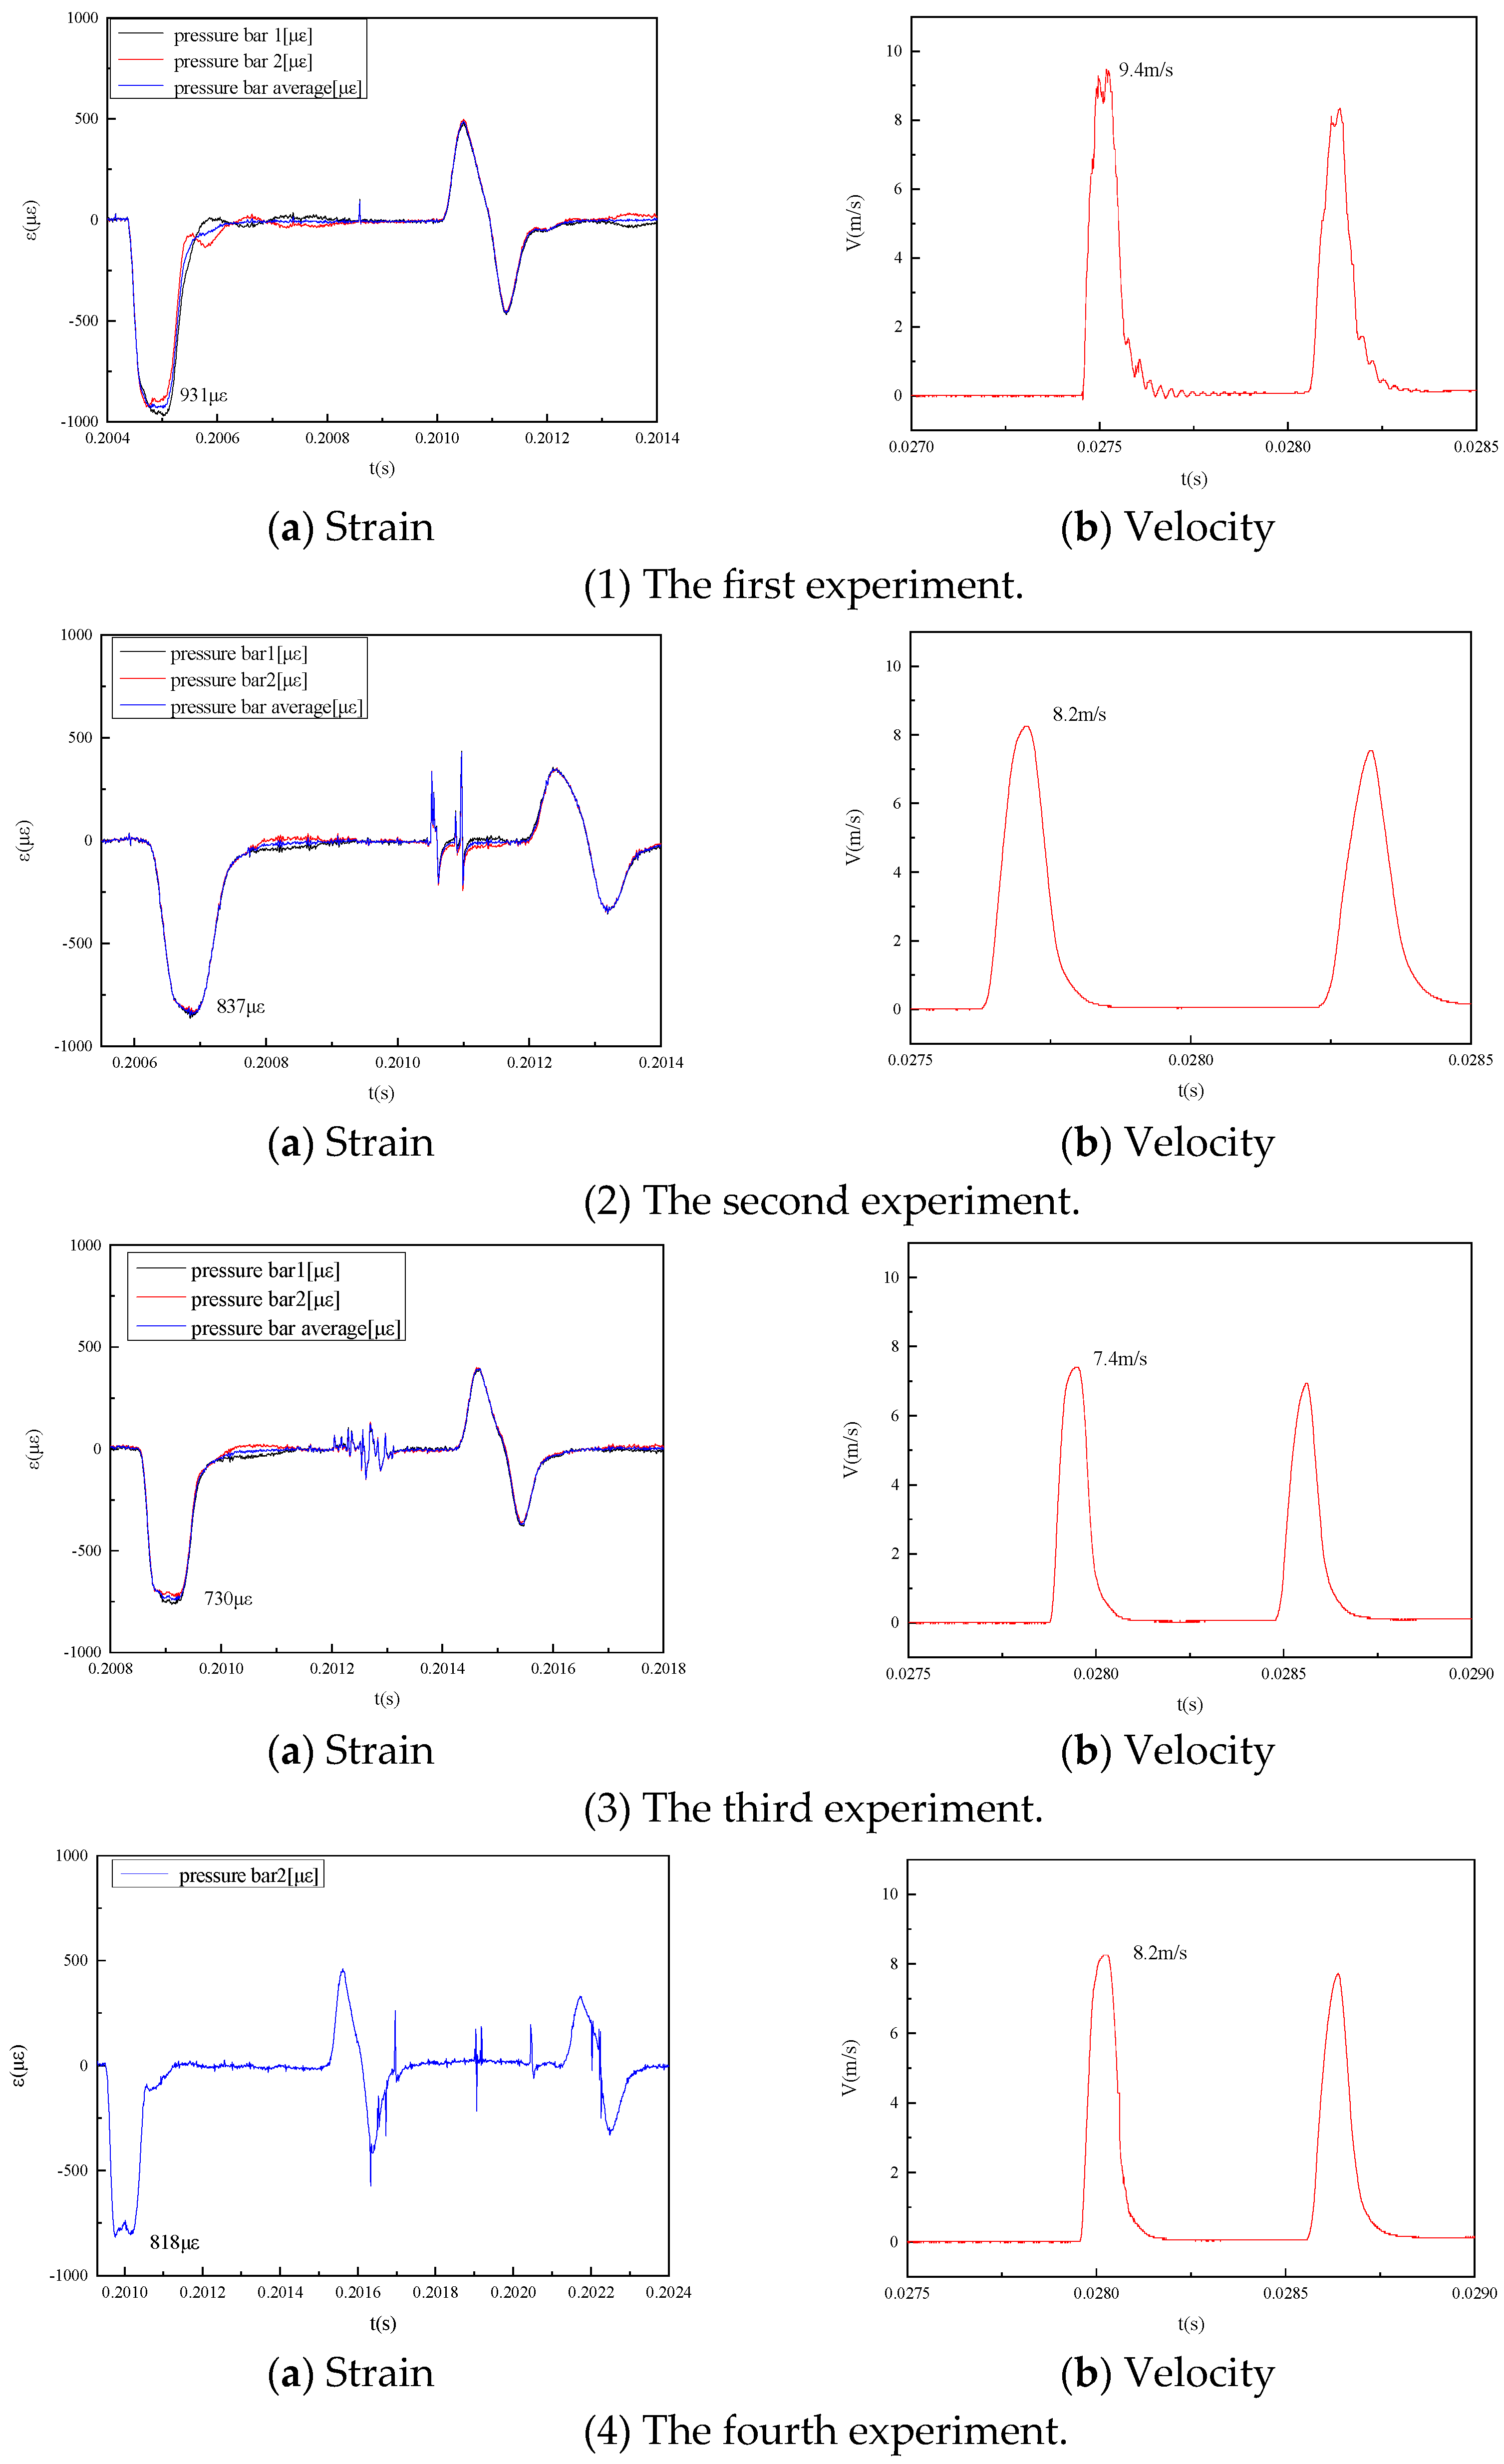
| Experimental Number | Mean Strain (με) | Reduced Velocity (m/s) | Calculated Pressure (MPa) | Measured Velocity (m/s) | Relative Deviation (%) |
|---|---|---|---|---|---|
| 1 | 931 | 9.3 | 179.8 | 9.4 | 1.07 |
| 2 | 837 | 8.3 | 161.7 | 8.2 | 1.20 |
| 3 | 730 | 7.3 | 141.0 | 7.4 | 1.37 |
| 4 | 818 | 8.1 | 158.0 | 8.2 | 1.23 |
Disclaimer/Publisher’s Note: The statements, opinions and data contained in all publications are solely those of the individual author(s) and contributor(s) and not of MDPI and/or the editor(s). MDPI and/or the editor(s) disclaim responsibility for any injury to people or property resulting from any ideas, methods, instructions or products referred to in the content. |
© 2025 by the authors. Licensee MDPI, Basel, Switzerland. This article is an open access article distributed under the terms and conditions of the Creative Commons Attribution (CC BY) license (https://creativecommons.org/licenses/by/4.0/).
Share and Cite
Shi, Y.-X.; Peng, Y.-C.; Xing, Y.-D.; Jiao, X.-J.; Huang, X.-F.; Ba, Z.-Q. Shock Wave Pressure Measurement and Calibration Method Based on Bar Pressure Sensor. Sensors 2025, 25, 4743. https://doi.org/10.3390/s25154743
Shi Y-X, Peng Y-C, Xing Y-D, Jiao X-J, Huang X-F, Ba Z-Q. Shock Wave Pressure Measurement and Calibration Method Based on Bar Pressure Sensor. Sensors. 2025; 25(15):4743. https://doi.org/10.3390/s25154743
Chicago/Turabian StyleShi, Yong-Xiang, Ying-Cheng Peng, Yuan-Ding Xing, Xue-Jie Jiao, Xiao-Fei Huang, and Ze-Qun Ba. 2025. "Shock Wave Pressure Measurement and Calibration Method Based on Bar Pressure Sensor" Sensors 25, no. 15: 4743. https://doi.org/10.3390/s25154743
APA StyleShi, Y.-X., Peng, Y.-C., Xing, Y.-D., Jiao, X.-J., Huang, X.-F., & Ba, Z.-Q. (2025). Shock Wave Pressure Measurement and Calibration Method Based on Bar Pressure Sensor. Sensors, 25(15), 4743. https://doi.org/10.3390/s25154743