
Validity of IMUs in Comparison to a Marker-Based-Motion Capture System for Spatio-Temporal Parameters During Wheelchair Propulsion


Abstract
1. Introduction
2. Materials and Methods
2.1. Subjects
2.2. Protocol
2.3. Data Collection
2.4. Data Processing
2.5. Statistical Analysis
3. Results
4. Discussion
5. Conclusions
Author Contributions
Funding
Institutional Review Board Statement
Informed Consent Statement
Data Availability Statement
Acknowledgments
Conflicts of Interest
References
- Aljure, J.; Eltorai, I.; Bradley, W.E.; Lin, J.E.; Johnson, B. Carpal tunnel syndrome in paraplegic patients. Spinal Cord 1985, 23, 182–186. [Google Scholar] [CrossRef]
- Gellman, H.; Chandler, D.R.; Petrasek, J.; Sie, I.; Adkins, R.; Waters, R.L. Carpal tunnel syndrome in paraplegic patients. J. Bone Jt. Surg. 1988, 70, 517–519. [Google Scholar] [CrossRef]
- Tun, C.G.; Upton, J. The paraplegic hand: Electrodiagnostic studies and clinical findings. J. Hand Surg. 1988, 13, 716–719. [Google Scholar] [CrossRef]
- Davidoff, G.; Werner, R.; Waring, W. Compressive mononeuropathies of the upper extremity in chronic paraplegia. Spinal Cord 1991, 29, 17–24. [Google Scholar] [CrossRef]
- Wylie, E.J.; Chakera, T.M. Degenerative joint abnormalities in patients with paraplegia of duration greater than 20 years. Spinal Cord 1988, 26, 101–106. [Google Scholar] [CrossRef]
- Curtis, K.A.; Drysdale, G.A.; Lanza, R.D.; Kolber, M.; Vitolo, R.S.; West, R. Shoulder pain in wheelchair users with tetraplegia and paraplegia. Arch. Phys. Med. Rehabil. 1999, 80, 453–457. [Google Scholar] [CrossRef]
- Pentland, W.E.; Twomey, L.T. The weight-bearing upper extremity in women with long term paraplegia. Spinal Cord 1991, 29, 521–530. [Google Scholar] [CrossRef]
- Boninger, M.L.; Impink, B.G.; Cooper, R.A.; Koontz, A.M. Relation between median and ulnar nerve function and wrist kinematics during wheelchair propulsion. Arch. Phys. Med. Rehabil. 2004, 85, 1141–1145. [Google Scholar] [CrossRef]
- Mercer, J.L.; Boninger, M.; Koontz, A.; Ren, D.; Dyson-Hudson, T.; Cooper, R. Shoulder joint kinetics and pathology in manual wheelchair users. Clin. Biomech. 2006, 21, 781–789. [Google Scholar] [CrossRef]
- Collinger, J.L.; Boninger, M.L.; Koontz, A.M.; Price, R.; Sisto, S.A.; Tolerico, M.L.; Cooper, R.A. Shoulder biomechanics during the push phase of wheelchair propulsion: A multisite study of persons with paraplegia. Arch. Phys. Med. Rehabil. 2008, 89, 667–676. [Google Scholar] [CrossRef]
- Boninger, M.L.; Souza, A.L.; Cooper, R.A.; Fitzgerald, S.G.; Koontz, A.M.; Fay, B.T. Propulsion patterns and pushrim biomechanics in manual wheelchair propulsion. Arch. Phys. Med. Rehabil. 2002, 83, 718–723. [Google Scholar] [CrossRef]
- Paralyzed Veterans of America Consortium for Spinal Cord Medicine. Preservation of Upper Limb Function Following Spinal Cord Injury: A Clinical Practice Guideline for Health-Care Professionals. J. Spinal Cord Med. 2005, 28, 434–470. [Google Scholar] [CrossRef]
- Cooper, R.A. SMARTWheel: From concept to clinical practice. Prosthet. Orthot. Int. 2009, 33, 198–209. [Google Scholar] [CrossRef]
- Hiremath, S.; Ding, D.; Koontz, A.M. Estimating Temporal Parameters of Wheelchair Propulsion based on Hand Acceleration. In Proceedings of the RESNA 2008 Annual Conference, Pittsburgh, PA, USA, 29 June 2008. [Google Scholar]
- Morgan, K.A.; Tucker, S.M.; Klaesner, J.W.; Engsberg, J.R. A motor learning approach to training wheelchair propulsion biomechanics for new manual wheelchair users: A pilot study. J. Spinal Cord Med. 2017, 40, 304–315. [Google Scholar] [CrossRef]
- Salm, L.; Schreff, L.; Benker, C.; Abel, R.; Müller, R. The effect of a cognitive dual-task on the control of wheelchair propulsion. PLoS ONE 2025, 20, e0317504. [Google Scholar] [CrossRef]
- Weizman, Y.; Bäumker, L.; Fuss, F.K. Application of Sensor Technology in Wheelchair Sports for Real-Time Data Collection during Training and Competition and for Assessment of Performance Parameters: A Systematic Review and Future Directions. Sensors 2024, 24, 6343. [Google Scholar] [CrossRef]
- Aissaoui, R.; de Lutiis, A.; Feghoul, A.; Chénier, F. Handrim Reaction Force and Moment Assessment Using a Minimal IMU Configuration and Non-Linear Modeling Approach during Manual Wheelchair Propulsion. Sensors 2024, 24, 6307. [Google Scholar] [CrossRef]
- Fasipe, G.; Goršič, M.; Zabre, E.V.; Rammer, J.R. Inertial Measurement Unit and Heart Rate Monitoring to Assess Cardiovascular Fitness of Manual Wheelchair Users during the Six-Minute Push Test. Sensors 2024, 24, 4172. [Google Scholar] [CrossRef]
- Fathian, R.; Khandan, A.; Rahmanifar, N.; Ho, C.; Rouhani, H. Feasibility and Validity of Wearable Sensors for Monitoring Temporal Parameters in Manual Wheelchair Propulsion. IEEE J. Biomed. Health Inform. 2024, 28, 5239–5246. [Google Scholar] [CrossRef]
- Ojeda, M.; Ding, D. Temporal parameters estimation for wheelchair propulsion using wearable sensors. BioMed Res. Int. 2014, 2014, 645284. [Google Scholar] [CrossRef]
- de Vries, W.; van der Slikke, R.; van Dijk, M.P.; Arnet, U. Real-Life Wheelchair Mobility Metrics from IMUs. J. Sens. 2023, 23, 7174. [Google Scholar] [CrossRef]
- de Vries, W.; Eriks-Hoogland, I.; Hertig-Godeschalk, A.; Koch-Borner, S.; Perret, C.; Arnet, U. Variation in Daily Wheelchair Mobility Metrics of Persons with Spinal Cord Injury: The Need for Individual Monitoring. Appl. Sci. 2024, 14, 11087. [Google Scholar] [CrossRef]
- Robertson, R.N.; Boninger, M.L.; Cooper, R.A.; Shimada, S.D. Pushrim forces and joint kinetics during wheelchair propulsion. Arch. Phys. Med. Rehabil. 1996, 77, 856–864. [Google Scholar] [CrossRef]
- Cooper, R.A.; DiGiovine, C.P.; Boninger, M.L.; Shimada, S.D.; Koontz, A.M.; Baldwin, M.A. Filter frequency selection for manual wheelchair biomechanics. J. Rehabil. Res. Dev. 2002, 39, 323–336. [Google Scholar]
- van Dijk, M.P.; van der Slikke, R.; Berger, M.; Hoozemans, M.; Veeger, H. Look mummy, no hands! The effect of trunk motion on forward wheelchair propulsion. ISBS Proc. Arch. 2021, 39, 80. [Google Scholar]
- Fuss, F.; Tan, A.; Weizman, Y. The Effect of Arm Movements on the Dynamics of the Wheelchair Frame during Manual Wheelchair Actuation and Propulsion. Actuators 2024, 13, 183. [Google Scholar] [CrossRef]
- Zahn, A.; Koch, V.; Schreff, L.; Oschmann, P.; Winkler, J.; Gaßner, H.; Müller, R. Validity of an inertial sensor-based system for the assessment of spatio-temporal parameters in people with multiple sclerosis. Front. Neurol. 2023, 14, 1164001. [Google Scholar] [CrossRef]
- Kluge, F.; Gaßner, H.; Hannink, J.; Pasluosta, C.; Klucken, J.; Eskofier, B.M. Towards Mobile Gait Analysis: Concurrent Validity and Test-Retest Reliability of an Inertial Measurement System for the Assessment of Spatio-Temporal Gait Parameters. Sensors 2017, 17, 1522. [Google Scholar] [CrossRef]

| Mean ± SD | |
|---|---|
| Age [years] | 46.78 ± 14.98 |
| Sex [f/m] | 2/25 |
| Weight [kg] | 82.37 ± 19.08 |
| Arm length [cm] | 55.48 ± 4.25 |
| Duration of wheelchair dependency [years] | 16.10 ± 13.90 |
| Parameter | Description |
|---|---|
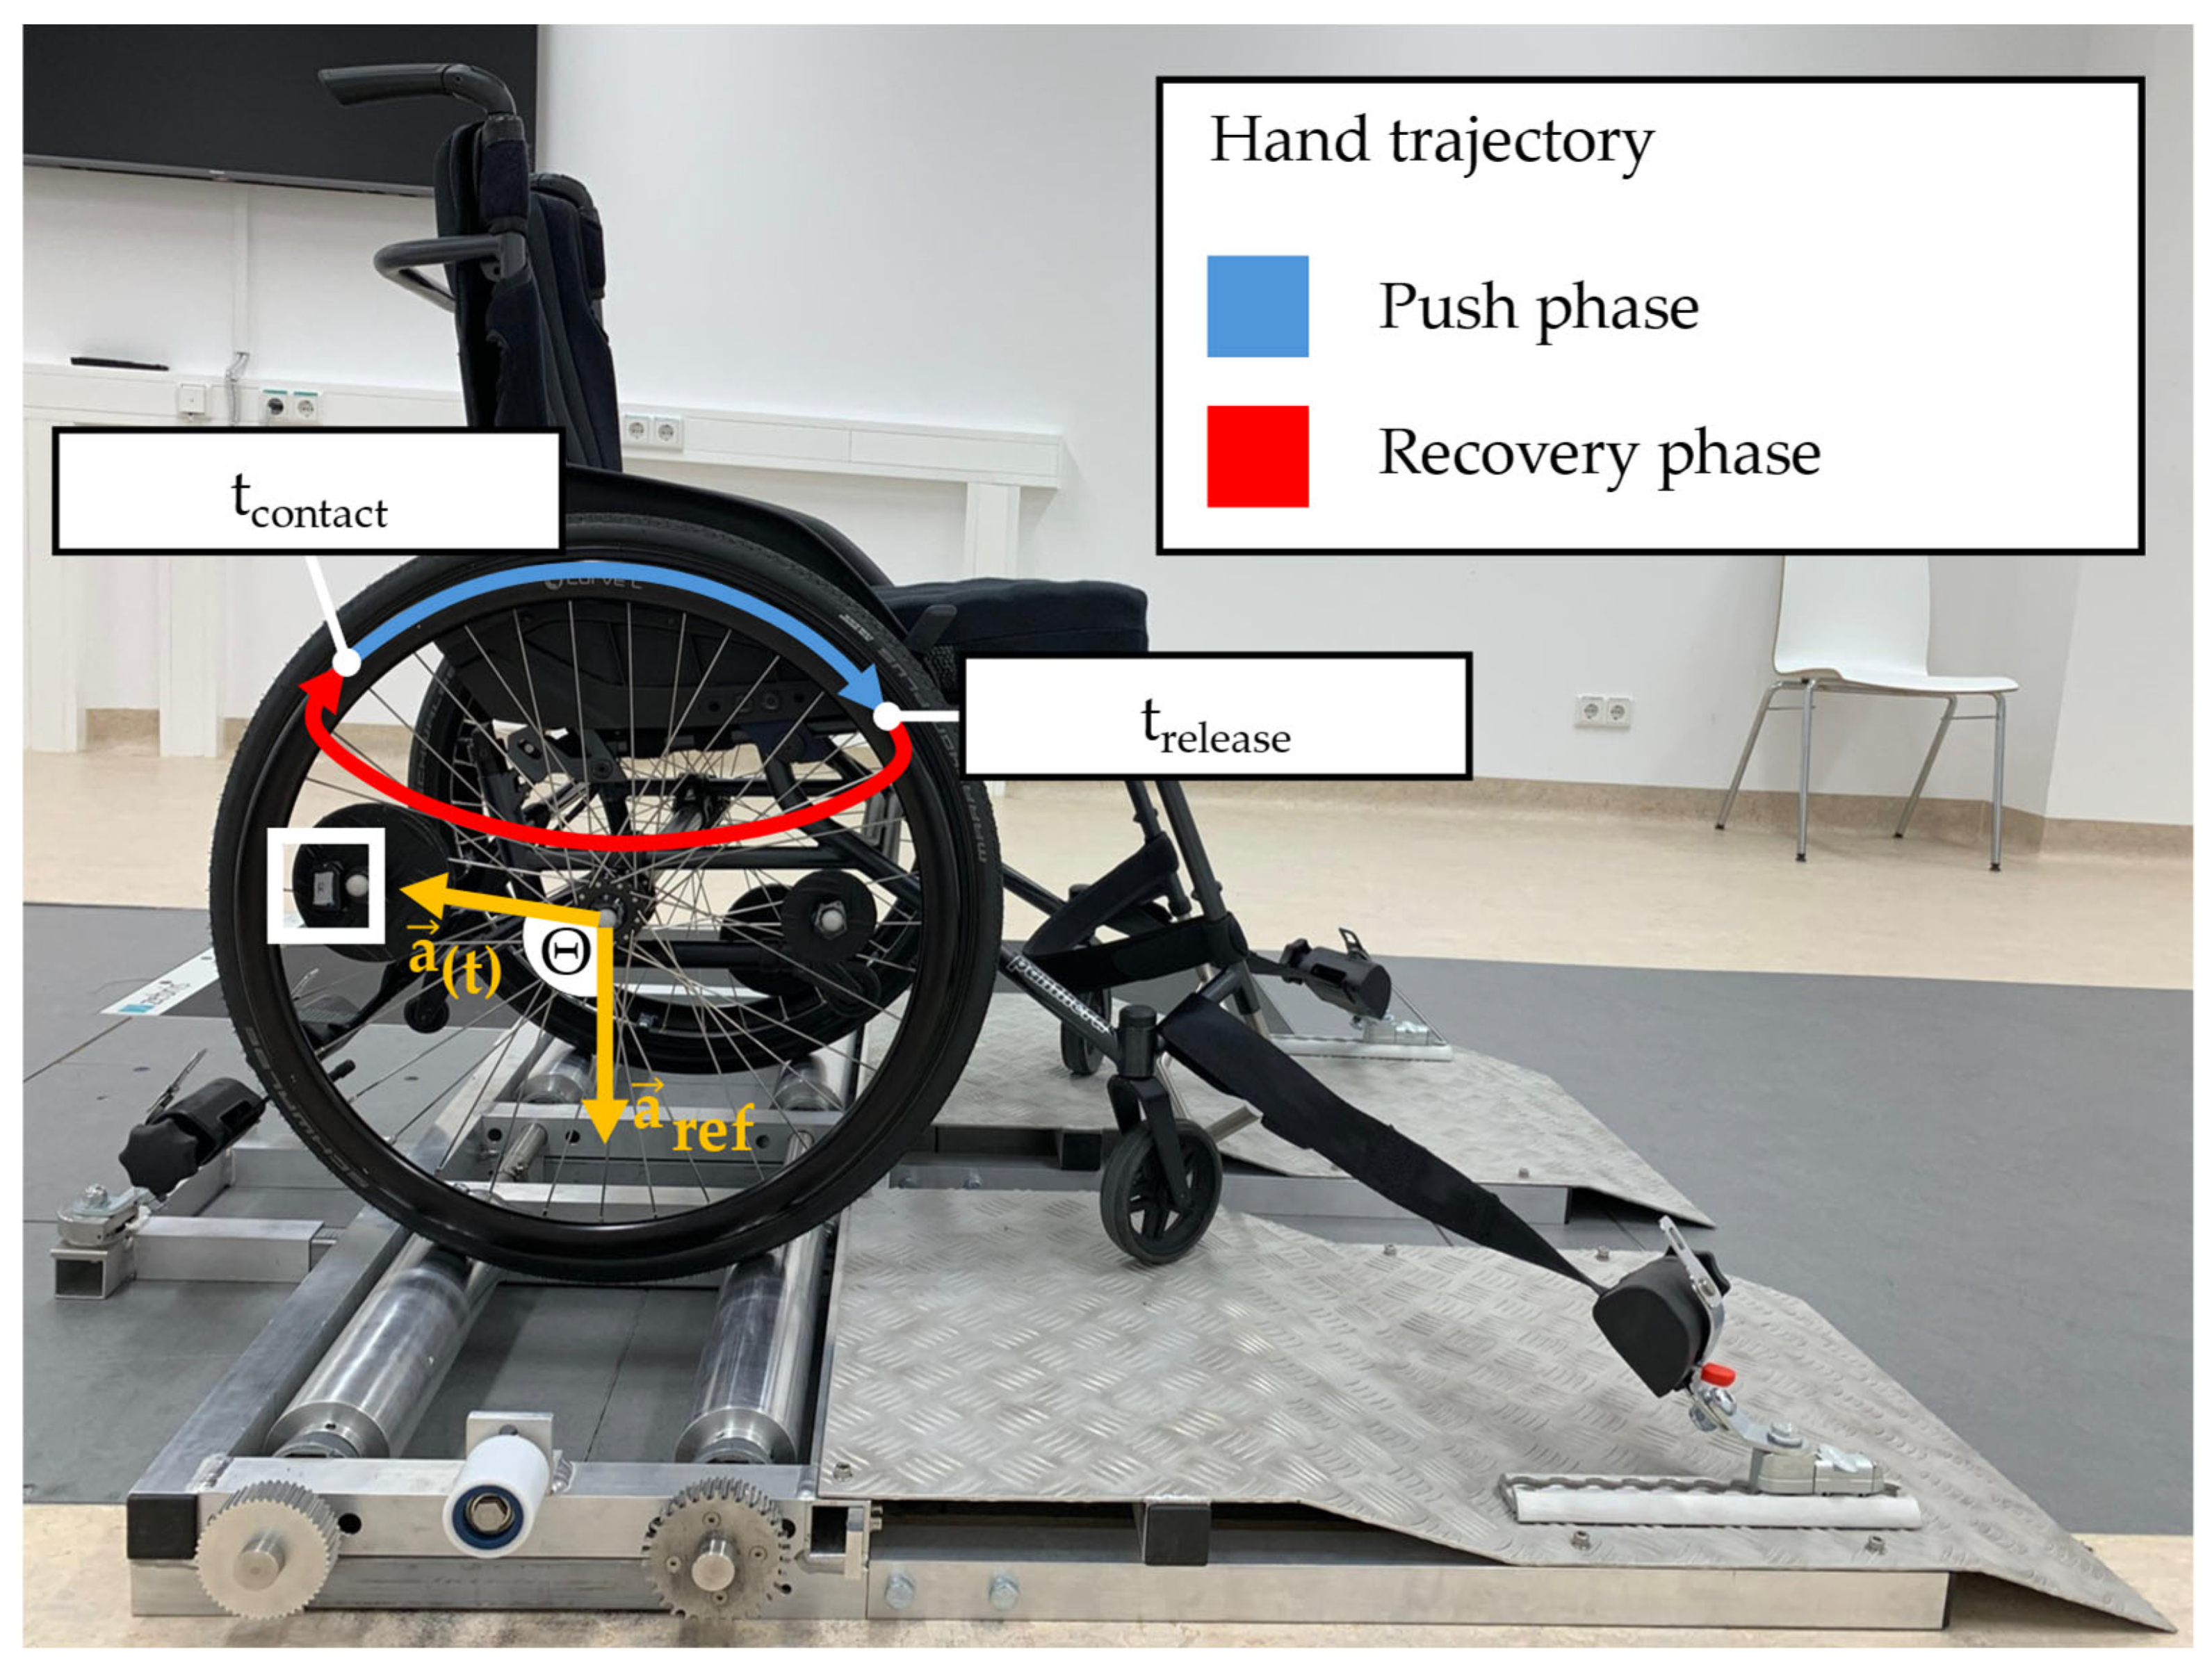
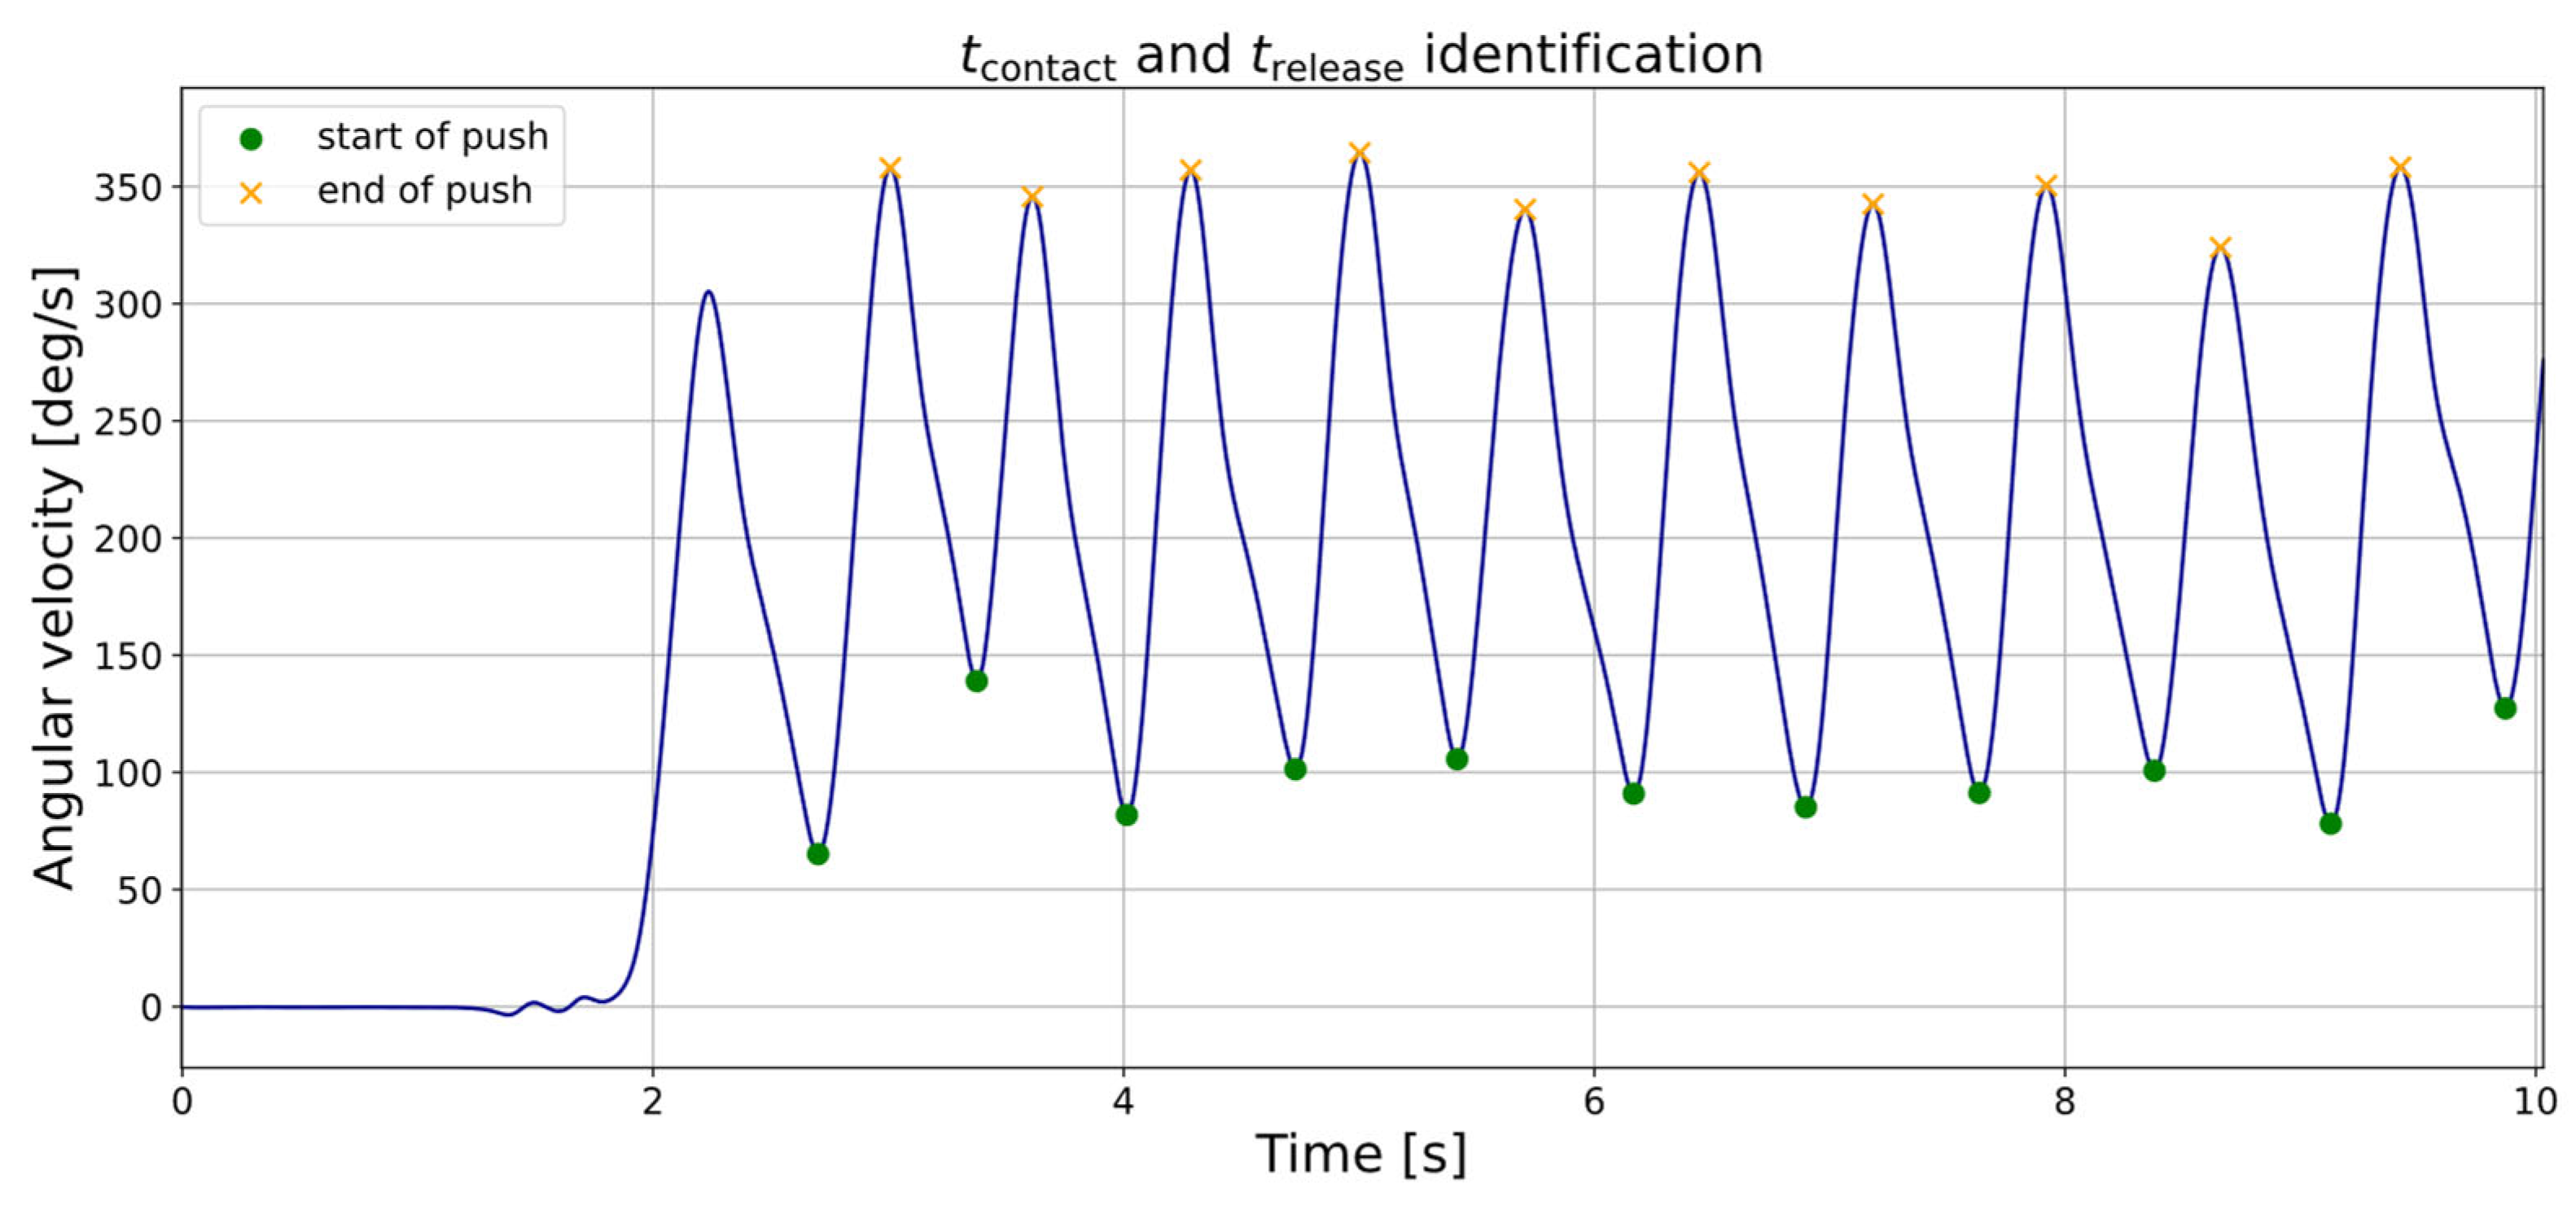
| tcontact | Point in time of initial hand contact with pushrim |
| trelease | Point in time of hand release from pushrim |
| Push length | Duration of hand contact during the push phase |
| Recovery length | Duration between hand release and initial hand contact |
| Cycle speed | Average speed of one propulsion cycle |
| Propulsion frequency | Number of propulsion cycles per second |
| Push angle | Angle between hand contact and release on the pushrim |
| Parameter | Marker Value 1 | IMUs Value 1 | Bias ± SD | Abs. Error (%) 2 | ρ 3 |
|---|---|---|---|---|---|
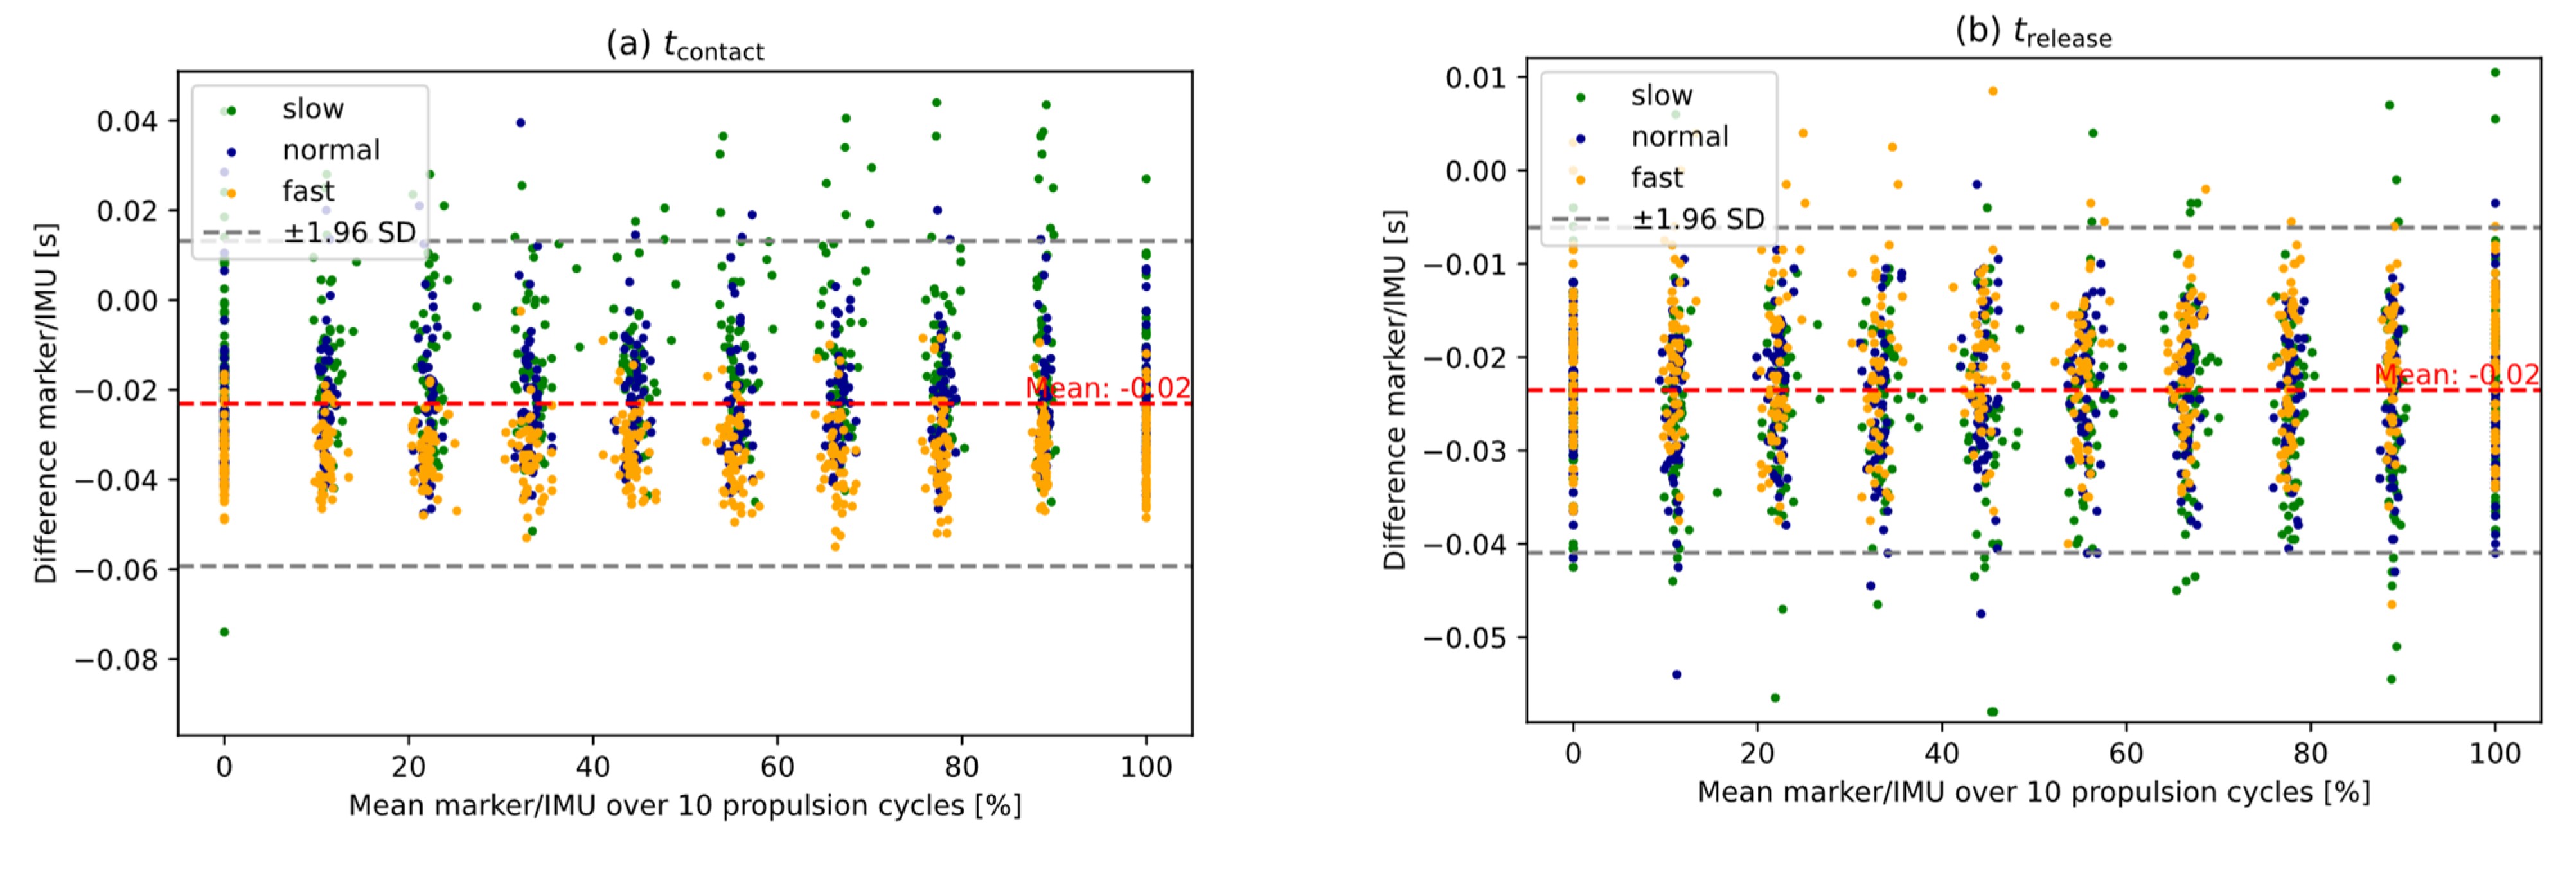
| tcontact (s) | - 4 | - 4 | −0.02 ± 0.02 | 0.36 | 1.000 |
| trelease (s) | - 4 | - 4 | −0.02 ± 0.01 | 0.28 | 1.000 |
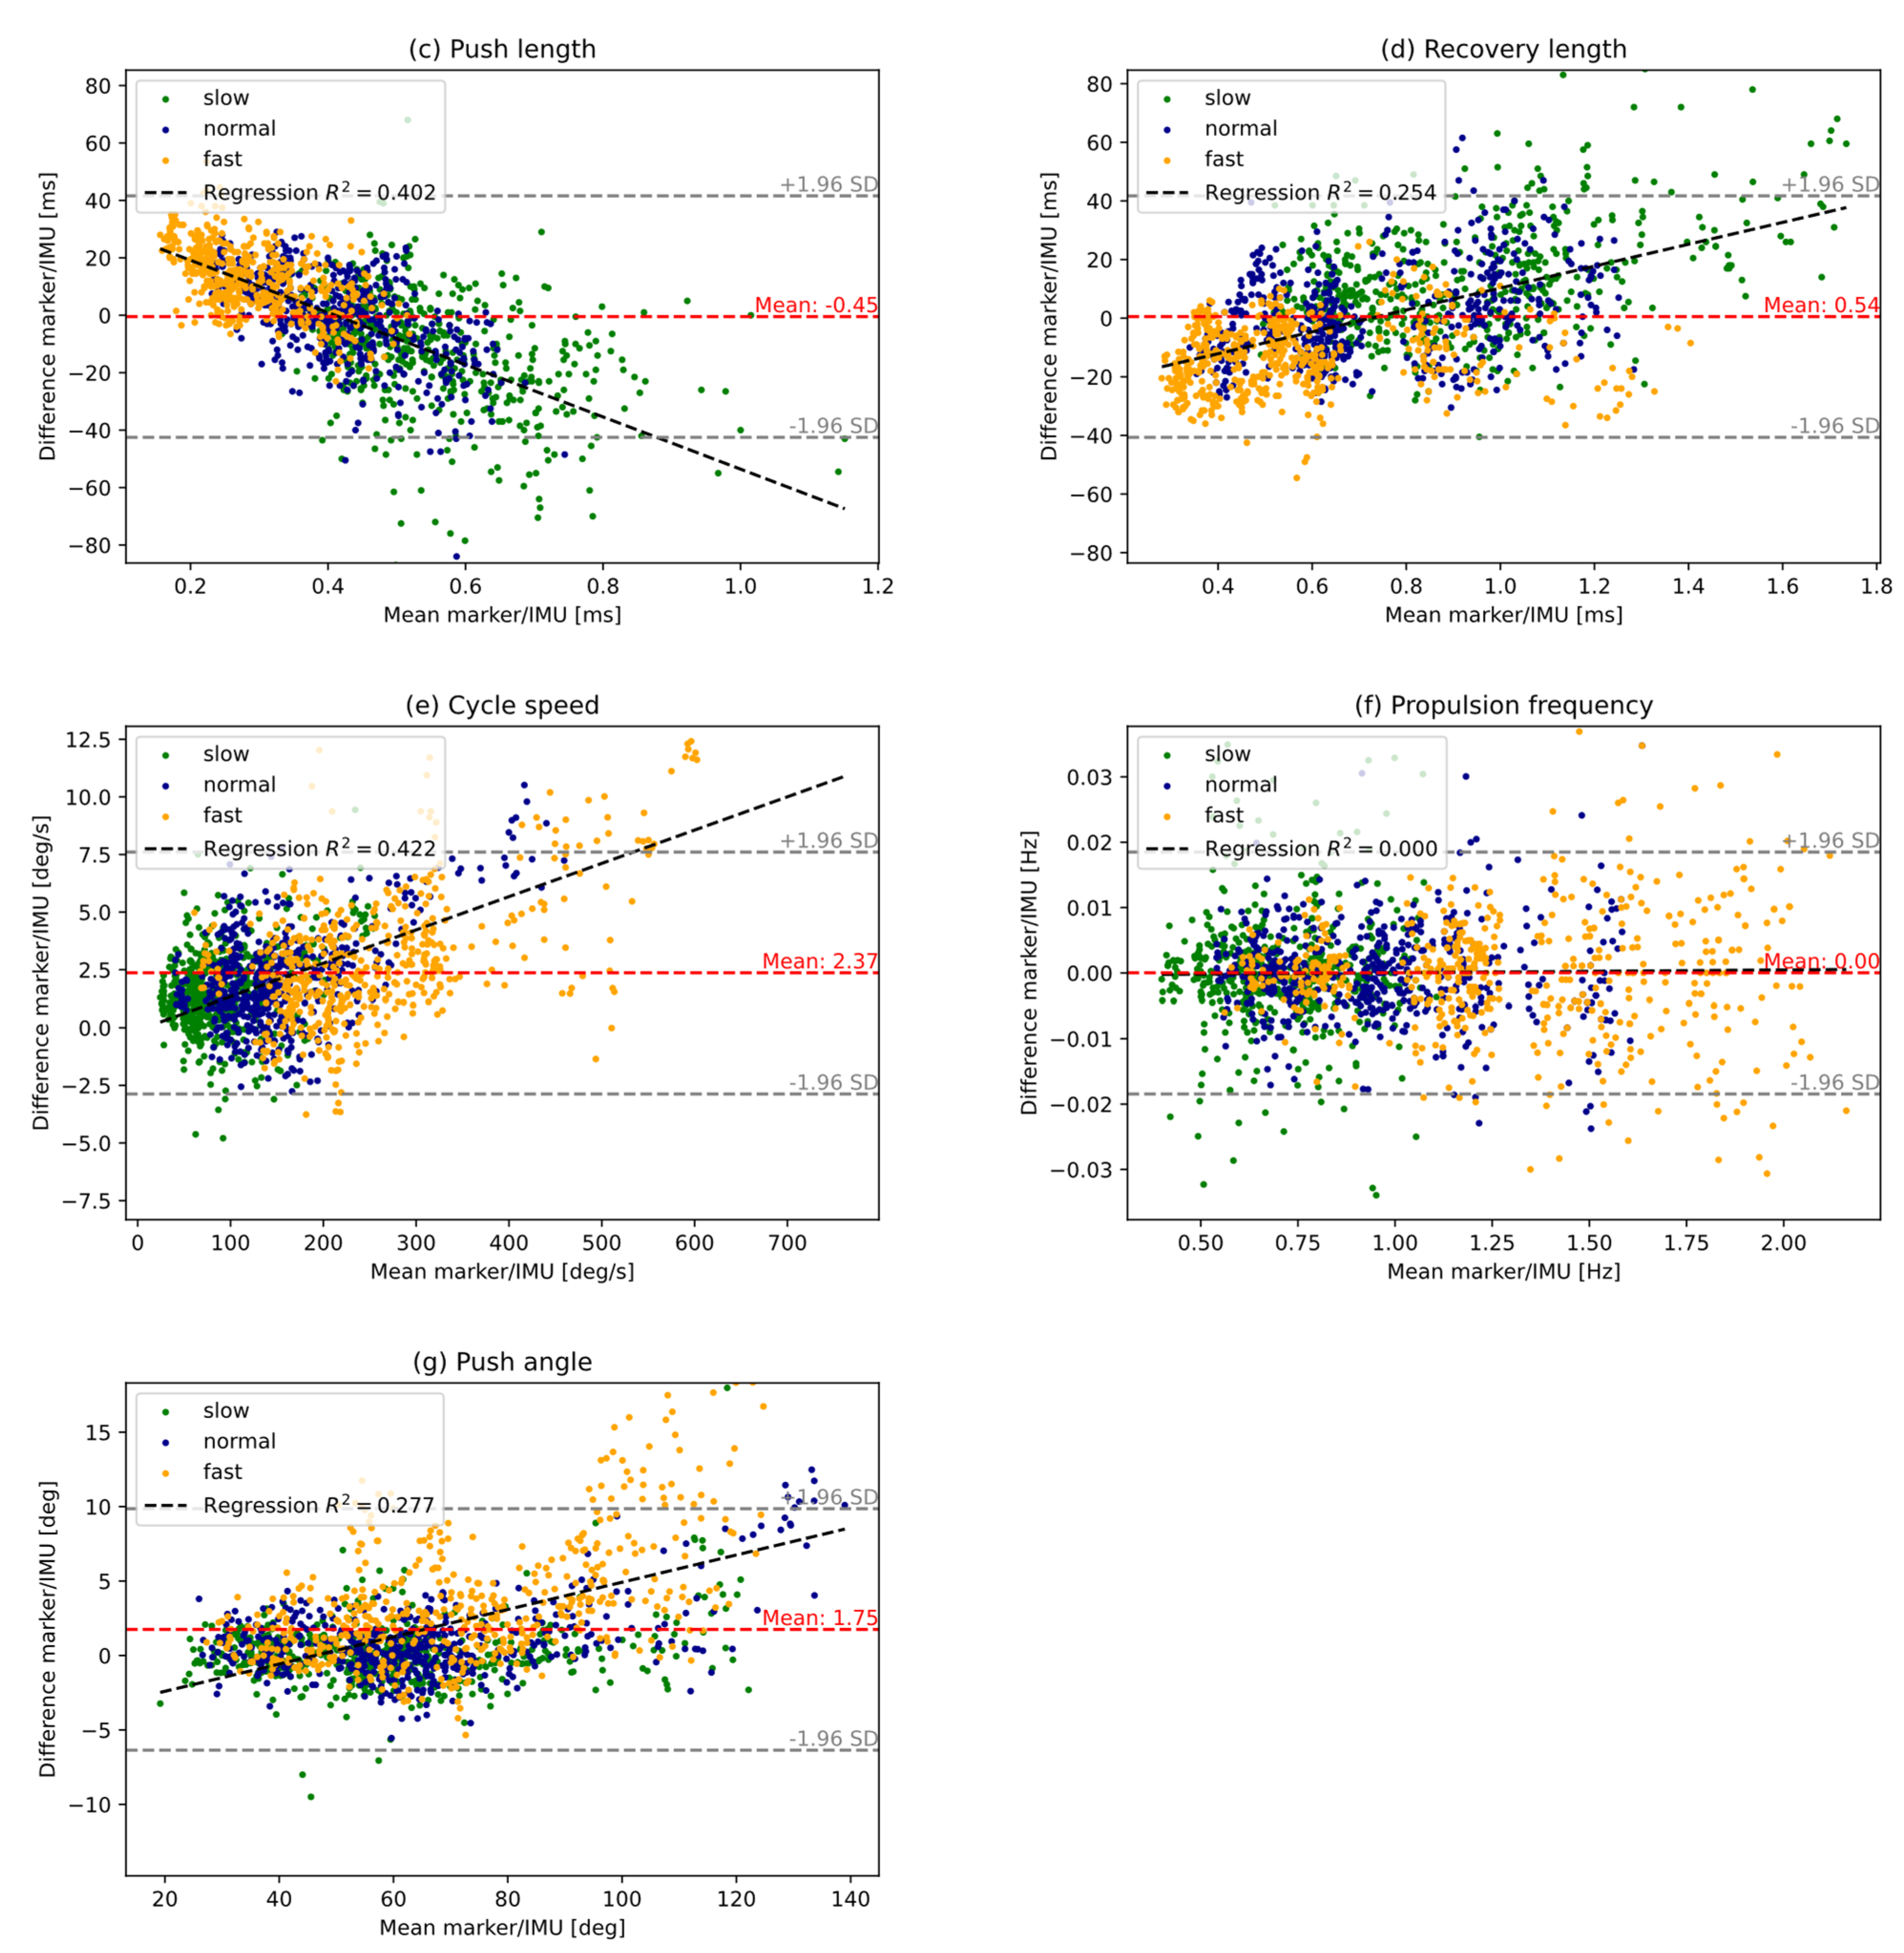
| Push length (ms) | 415.50 ± 142.93 | 415.96 ± 156.51 | −0.45 ± 21.45 | 4.05 | 0.994 |
| Recovery length (ms) | 739.24 ± 289.31 | 738.70 ± 278.72 | 0.54 ± 21.02 | 2.27 | 0.998 |
| Cycle speed (°/s) | 172.31 ± 121.16 | 169.94 ± 119.42 | 2.37 ± 2.67 | 1.76 | 1.000 |
| Propulsion frequency (Hz) | 0.99 ± 0.37 | 0.99 ± 0.37 | 0.00 ± 0.01 | 0.66 | 1.000 |
| Push angle (°) | 66.25 ± 24.91 | 64.50 ± 22.74 | 1.75 ± 4.14 | 3.49 | 0.992 |
Disclaimer/Publisher’s Note: The statements, opinions and data contained in all publications are solely those of the individual author(s) and contributor(s) and not of MDPI and/or the editor(s). MDPI and/or the editor(s) disclaim responsibility for any injury to people or property resulting from any ideas, methods, instructions or products referred to in the content. |
© 2025 by the authors. Licensee MDPI, Basel, Switzerland. This article is an open access article distributed under the terms and conditions of the Creative Commons Attribution (CC BY) license (https://creativecommons.org/licenses/by/4.0/).
Share and Cite
Karner, L.; Schreff, L.; Abel, R.; Müller, R. Validity of IMUs in Comparison to a Marker-Based-Motion Capture System for Spatio-Temporal Parameters During Wheelchair Propulsion. Sensors 2025, 25, 4676. https://doi.org/10.3390/s25154676
Karner L, Schreff L, Abel R, Müller R. Validity of IMUs in Comparison to a Marker-Based-Motion Capture System for Spatio-Temporal Parameters During Wheelchair Propulsion. Sensors. 2025; 25(15):4676. https://doi.org/10.3390/s25154676
Chicago/Turabian StyleKarner, Lukas, Lucas Schreff, Rainer Abel, and Roy Müller. 2025. "Validity of IMUs in Comparison to a Marker-Based-Motion Capture System for Spatio-Temporal Parameters During Wheelchair Propulsion" Sensors 25, no. 15: 4676. https://doi.org/10.3390/s25154676
APA StyleKarner, L., Schreff, L., Abel, R., & Müller, R. (2025). Validity of IMUs in Comparison to a Marker-Based-Motion Capture System for Spatio-Temporal Parameters During Wheelchair Propulsion. Sensors, 25(15), 4676. https://doi.org/10.3390/s25154676