
Fault Detection in Real-Time Kinematic Positioning Using Multiple Reference Stations


Abstract
1. Introduction
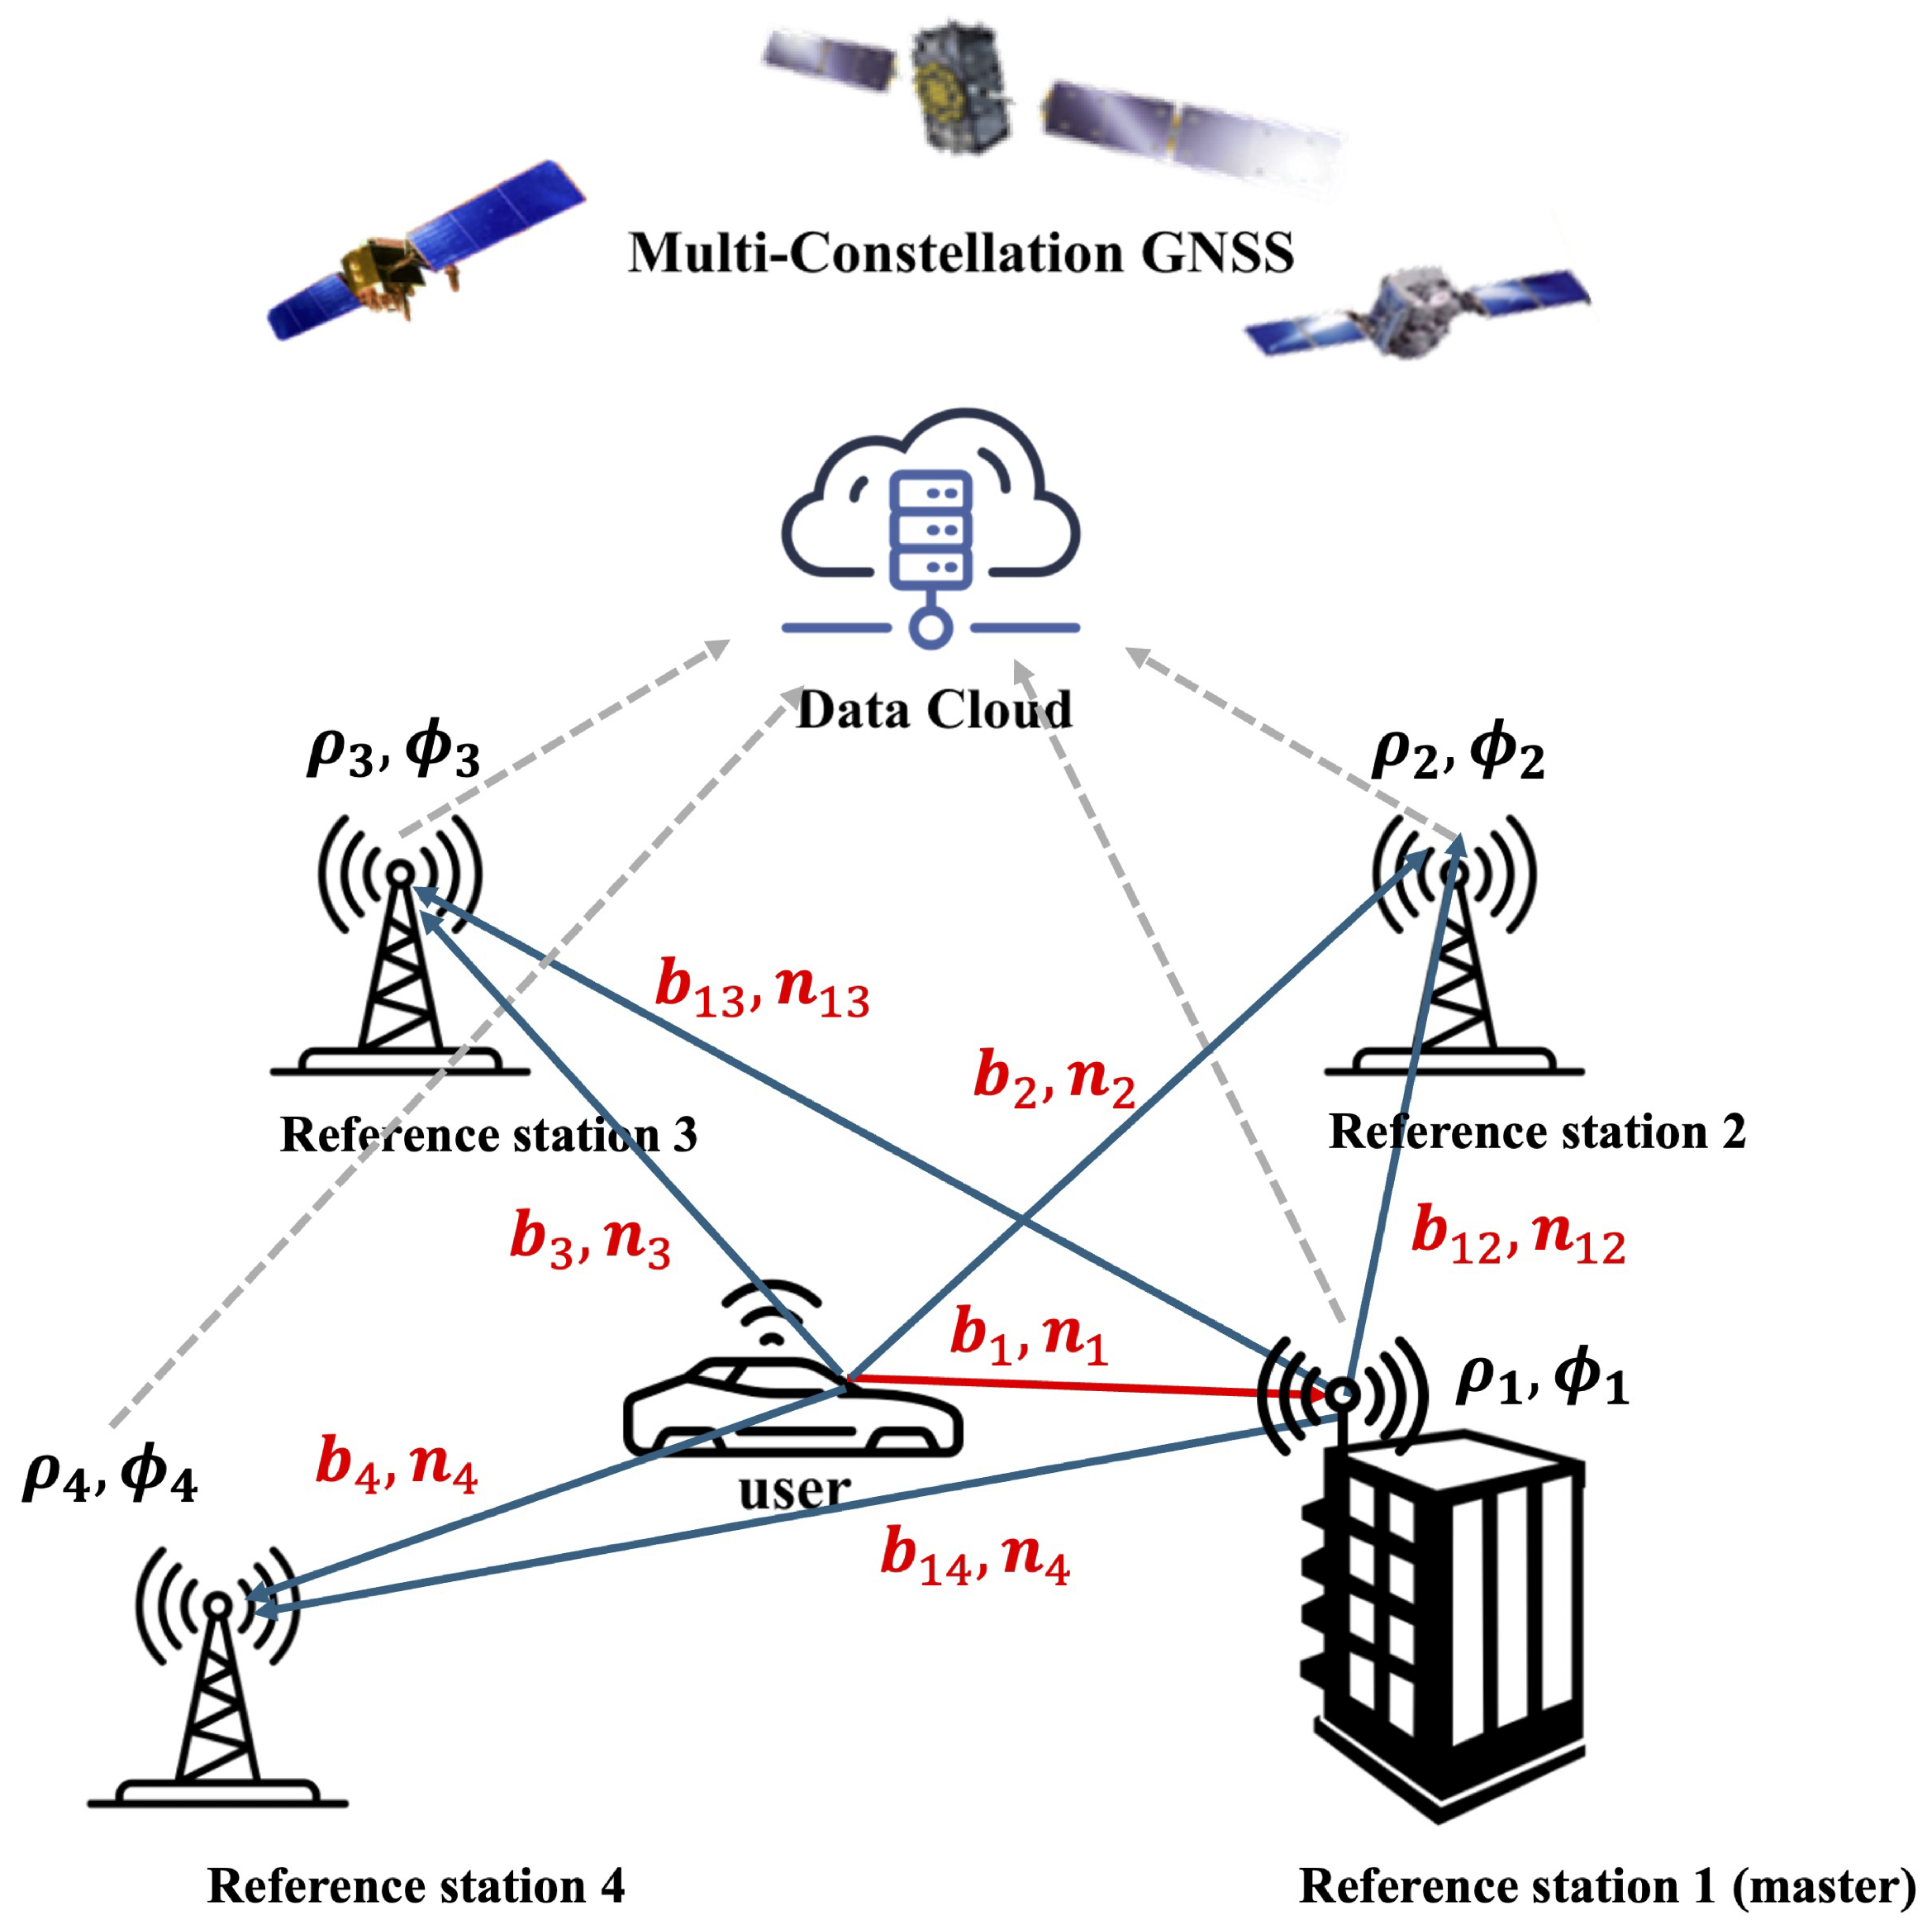
2. Measurement Model for MR-RTK
3. EKF and Fault Monitoring in MR-RTK
4. Test Results of Proposed MR-RTK Fault Detection Method
5. Discussion
6. Conclusions
Author Contributions
Funding
Institutional Review Board Statement
Informed Consent Statement
Data Availability Statement
Conflicts of Interest
References
- Montenbruck, O.; Ebinuma, T.; Lightsey, E.G.; Leung, S. A real-time kinematic GPS sensor for spacecraft relative navigation. Aerosp. Sci. Technol. 2002, 6, 435–449. [Google Scholar] [CrossRef]
- Peyret, F.; Bétaille, D.; Hintzy, G. High-precision application of GPS in the field of real-time equipment positioning. Autom. Constr. 2000, 9, 299–314. [Google Scholar] [CrossRef]
- Teunissen, P.J. Success probability of integer GPS ambiguity rounding and bootstrapping. J. Geod. 1998, 72, 606–612. [Google Scholar] [CrossRef]
- De Jonge, P.; Tiberius, C.C.J.M. The LAMBDA method for integer ambiguity estimation: Implementation aspects. Publ. Delft Comput. Cent. LGR-Ser. 1996, 12, 1–47. [Google Scholar]
- Chang, X.W.; Yang, X.; Zhou, T. MLAMBDA: A modified LAMBDA method for integer least-squares estimation. J. Geod. 2005, 79, 552–565. [Google Scholar] [CrossRef]
- Park, C.; Teunissen, P.J.G. Integer least squares with quadratic equality constraints and its application to GNSS attitude determination systems. Int. J. Control Autom. Syst. 2009, 7, 566–576. [Google Scholar] [CrossRef]
- Teunissen, P.J.G. The Lambda Method for the GNSS Compass. Artif. Satell. 2006, 41, 89–103. [Google Scholar] [CrossRef]
- Giorgi, G.; Teunissen, P.J.G.; Buist, P.J. A search and shrink approach for the baseline constrained LAMBDA method: Experimental results. In Proceedings of the International GPS/GNSS Symposium, Tokyo, Japan, 11 November 2008. [Google Scholar]
- Wang, B.; Miao, L.; Wang, S.; Shen, J. A constrained LAMBDA method for GPS attitude determination. GPS Solut. 2009, 13, 97–107. [Google Scholar] [CrossRef]
- Teunissen, P. A general multivariate formulation of the multi-antenna GNSS attitude determination problem. Artif. Satell. 2007, 42, 97–111. [Google Scholar] [CrossRef]
- Giorgi, G.; Teunissen, P.J.G. Carrier phase GNSS attitude determination with the Multivariate Constrained LAMBDA method. In Proceedings of the IEEE Aerospace Conference, Big Sky, MT, USA, 15 March 2010. [Google Scholar]
- Wang, S.; You, Z.; Sun, X. A Partial Carrier Phase Integer Ambiguity Fixing Algorithm for Combinatorial Optimization between Network RTK Reference Stations. Sensors 2022, 22, 165. [Google Scholar] [CrossRef]
- Kim, B.-G.; Kim, D.; Song, J.; Kee, C. Expanding Network RTK Coverage Using an Ionospheric-Free Combination and Kriging for Tropospheric Delay. NAVIGATION J. Inst. Navig. 2024, 71, navi.662. [Google Scholar] [CrossRef]
- Yuan, H.; Zhang, Z.; He, X.; Zeng, J.; Li, X. Resilient Ambiguity Resolution Strategy in GNSS Real-Time Kinematic Positioning for Urban Environments. IEEE Internet Things J. 2024, 11, 30004–30013. [Google Scholar] [CrossRef]
- Wu, S.; Zhao, X.; Pang, C.; Zhang, L. A comparison between hard-and soft-constrained rtk positioning with multiple reference antennas. IEEE Access 2018, 6, 78173–78183. [Google Scholar] [CrossRef]
- Li, B.; Teunissen, P.J. GNSS antenna array-aided CORS ambiguity resolution. J. Geod. 2014, 88, 363–376. [Google Scholar] [CrossRef]
- Wu, S.; Zhao, X.; Zhang, L.; Pang, C.; Wu, M. Improving reliability and efficiency of RTK ambiguity resolution with reference antenna array: BDS+ GPS analysis and test. J. Geod. 2019, 93, 1297–1311. [Google Scholar] [CrossRef]
- He, K.; Xu, T.; Förste, C.; Petrovic, S.; Barthelmes, F.; Jiang, N.; Flechtner, F. GNSS Precise Kinematic Positioning for Multiple Kinematic Stations Based on A Priori Distance Constraints. Sensors 2016, 16, 470. [Google Scholar] [CrossRef]
- Kim, E.; Kim, S. Antenna Array-Aided Real-Time Kinematic Using Moving Base Stations. IEEE Access 2022, 10, 11654–116563. [Google Scholar] [CrossRef]
- Liu, X.; Ballal, T.; Al-Naffouri, T.Y. Performance Analysis of Antenna Array-Aided RTK Positioning. IEEE Trans. Aerosp. Electron. Syst. 2025, 61, 5325–5336. [Google Scholar] [CrossRef]
- Yoder, J.E.; Humphreys, T.E. Low-Cost Inertial Aiding for Deep-Urban Tightly Coupled Multi-Antenna Precise GNSS. NAVIGATION J. Inst. Navig. 2023, 70, navi.561. [Google Scholar] [CrossRef]
- An, X.; Bellés, A.; Rizzi, F.G.; Hösch, L.; Lass, C.; Medina, D. Array ppp-rtk: A high precision pose estimation method for outdoor scenarios. IEEE Trans. Intell. Transp. Syst. 2024, 25, 6223–6237. [Google Scholar] [CrossRef]
- Yuan, R.; Cui, X.; Lu, M.; Bai, Z. A GNSS Multi-Antenna Fast Millimeter-level Positioning Method for Rail Track Deformation Monitoring. IEEE Trans. Instrum. Meas. 2024, 73, 1–8. [Google Scholar]
- Li, X.; Qi, Y. Multi-Antenna and Geometry-Based Differential GNSS Positioning for Vehicles. IEEE Trans. Intell. Transp. Syst. 2024, 5, 3389–3401. [Google Scholar] [CrossRef]
- Zhu, N.; Marais, J.; Betaille, D.; Berbineau, M. GNSS position integrity in urban environments: A review of literature. IEEE Trans. Intell. Transp. Syst. 2018, 19, 2762–2778. [Google Scholar] [CrossRef]
- Crespillo, O.; Grosch, A.; Skaloud, J.; Meurer, M. Innovation vs. Residual KF Based GNSS/INS Autonomous Integrity Monitoring in Single Fault Scenario. In Proceedings of the 30th International Technical Meeting of The Satellite Division of the Institute of Navigation, Portland, OR, USA, 25 September 2017. [Google Scholar]
- Tanil, C.; Khanafseh, S.; Joerger, M.; Pervan, B. Sequential Integrity Monitoring for Kalman Filter Innovations-Based Detectors. In Proceedings of the 31st International Technical Meeting of the Satellite Division of the Institute of Navigation (ION GNSS+ 2018), Miami, FL, USA, 8 October 2018. [Google Scholar] [CrossRef]
- Morton, Y.T.J.; van Diggelen, F.; Spilker, J.J., Jr.; Parkinson, B.W.; Lo, S.; Gao, G. (Eds.) Position, Navigation, and Timing Technologies in the 21st Century: Integrated Satellite Navigation, Sensor Systems, and Civil Applications; Wiley-IEEE Press: Hoboken, NJ, USA, 2020; pp. 259–306. ISBN 9781119458418. [Google Scholar] [CrossRef]


| Symbol/Abbreviation | Description |
|---|---|
| DD carrier phase measurement vector for reference receiver i | |
| DD pseudorange measurement vector for reference receiver i | |
| Baseline vector between the user and reference receiver i | |
| DD Integer ambiguity vector for reference receiver i | |
| Baseline vector between reference stations i and j | |
| DD integer ambiguities between reference stations i and j | |
| Wavelength matrix | |
| DD user-to-satellite line-of-sight geometry matrix for all frequencies | |
| DD user-to-satellite line-of-sight geometry matrix for one frequency | |
| ⊗ | Kronecker product operator |
| Column vector of 1s corresponding to the number of f | |
| Expectation operator (mean of a random variable) | |
| f | Frequency |
| Nonlinear sensor model at epoch k | |
| Measurement vector after applying a priori information at epoch k | |
| EKF state vector at epoch k | |
| State variance–covariance (VC) matrix at epoch k | |
| Process noise VC matrix from epoch to k | |
| State transition matrix from epoch to k | |
| Innovation VC matrix at epoch k | |
| Measurement Jacobian matrix at epoch k | |
| Measurement VC matrix at epoch k | |
| Identity matrix with a dimension of | |
| Innovation vector at epoch k | |
| Innovation vector at epoch k in nominal cases | |
| Innovation vector at epoch k in fault cases | |
| Innovation element occurred due to measurement fault | |
| Innovation-based fault detection test statistic at epoch k | |
| Degree of freedom in a chi-squared distribution | |
| Noncentraility parameter of a chi-squared distribution | |
| Chi-squared distribution |
| Station Name | Receiver Model | Baseline [km] | Used Signals |
|---|---|---|---|
| HONG | NovAtel OEM7700 | - | GPS (L1/L2), GAL (E1) |
| YONS | TRIMBLE ALLOY 6.10 | 6.784 | GPS (L1/L2), GAL (E1) |
| GANS | TRIMBLE ALLOY 6.10 | 7.810 | GPS (L1/L2), GAL (E1) |
| GUMC | TRIMBLE ALLOY 6.10 | 10.504 | GPS (L1/L2), GAL (E1) |
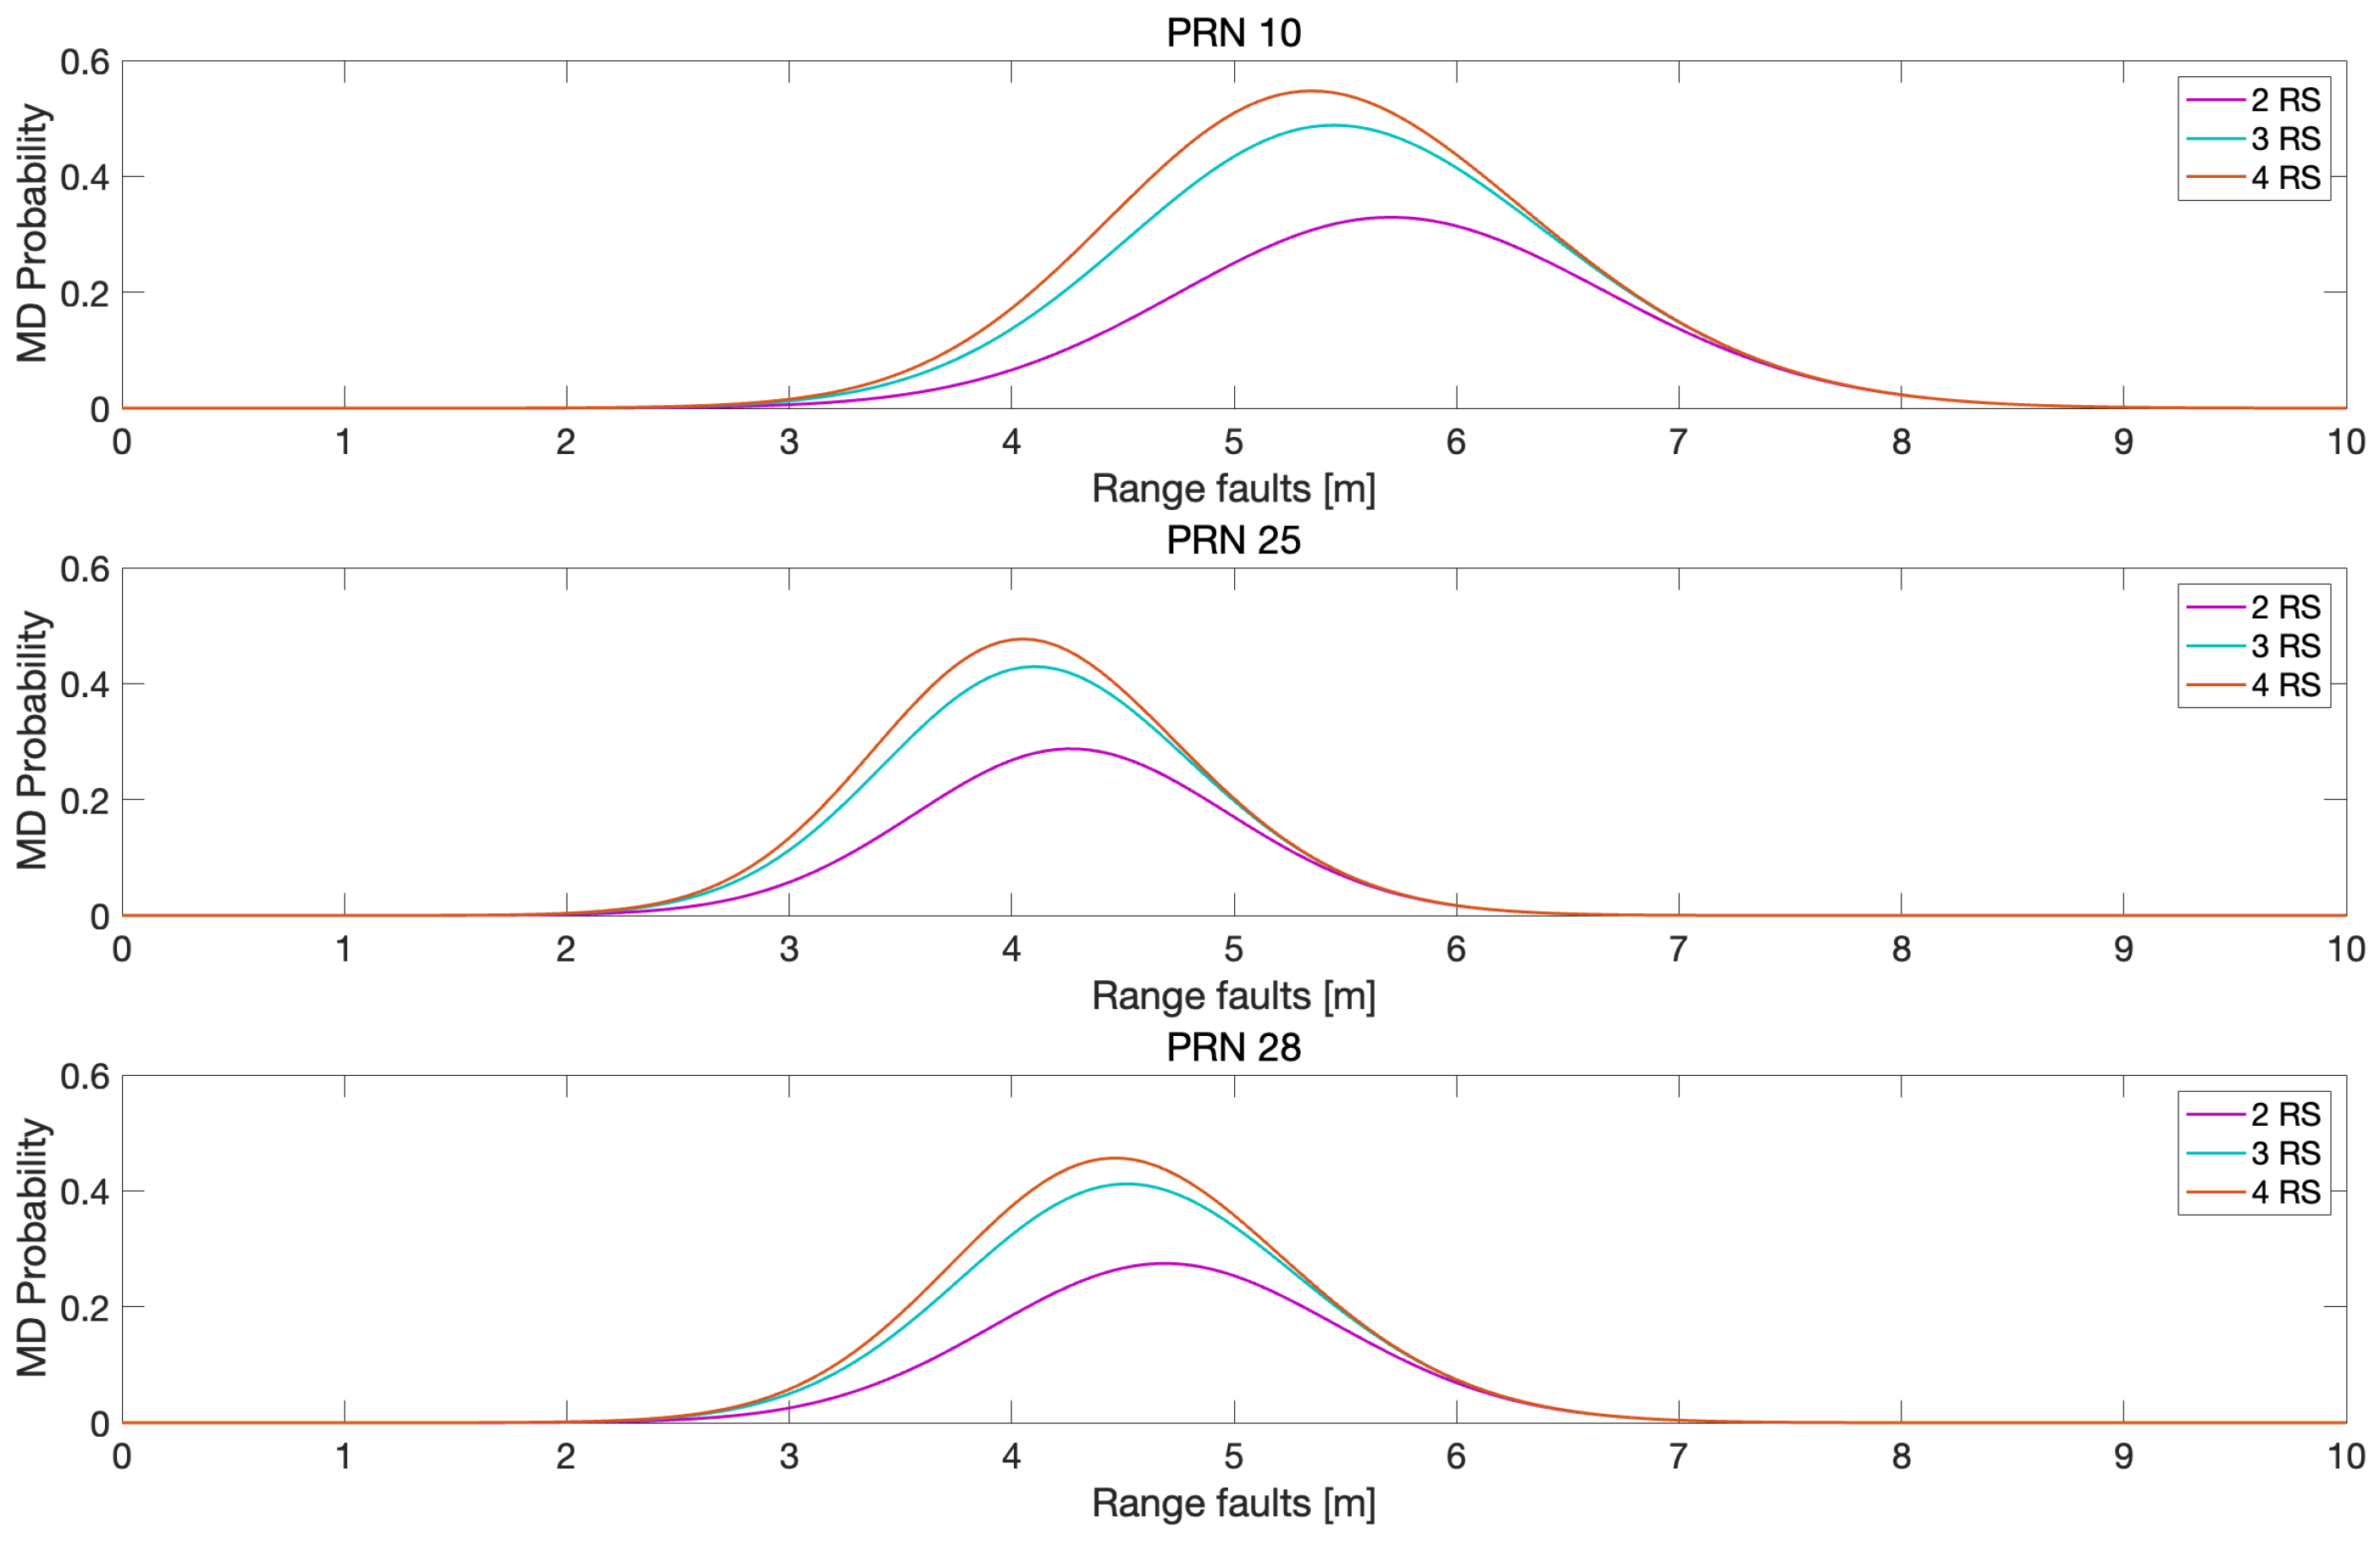
| Number of RS | PRN 10 | PRN 25 | PRN 28 |
|---|---|---|---|
| 2 | 0.32 | 0.29 | 0.27 |
| 3 | 0.49 | 0.43 | 0.41 |
| 4 | 0.55 | 0.47 | 0.46 |
Disclaimer/Publisher’s Note: The statements, opinions and data contained in all publications are solely those of the individual author(s) and contributor(s) and not of MDPI and/or the editor(s). MDPI and/or the editor(s) disclaim responsibility for any injury to people or property resulting from any ideas, methods, instructions or products referred to in the content. |
© 2025 by the authors. Licensee MDPI, Basel, Switzerland. This article is an open access article distributed under the terms and conditions of the Creative Commons Attribution (CC BY) license (https://creativecommons.org/licenses/by/4.0/).
Share and Cite
Kim, E.; Lee, S. Fault Detection in Real-Time Kinematic Positioning Using Multiple Reference Stations. Sensors 2025, 25, 4653. https://doi.org/10.3390/s25154653
Kim E, Lee S. Fault Detection in Real-Time Kinematic Positioning Using Multiple Reference Stations. Sensors. 2025; 25(15):4653. https://doi.org/10.3390/s25154653
Chicago/Turabian StyleKim, Euiho, and Soomin Lee. 2025. "Fault Detection in Real-Time Kinematic Positioning Using Multiple Reference Stations" Sensors 25, no. 15: 4653. https://doi.org/10.3390/s25154653
APA StyleKim, E., & Lee, S. (2025). Fault Detection in Real-Time Kinematic Positioning Using Multiple Reference Stations. Sensors, 25(15), 4653. https://doi.org/10.3390/s25154653