

Advances in Interferometric Synthetic Aperture Radar Technology and Systems and Recent Advances in Chinese SAR Missions


Abstract
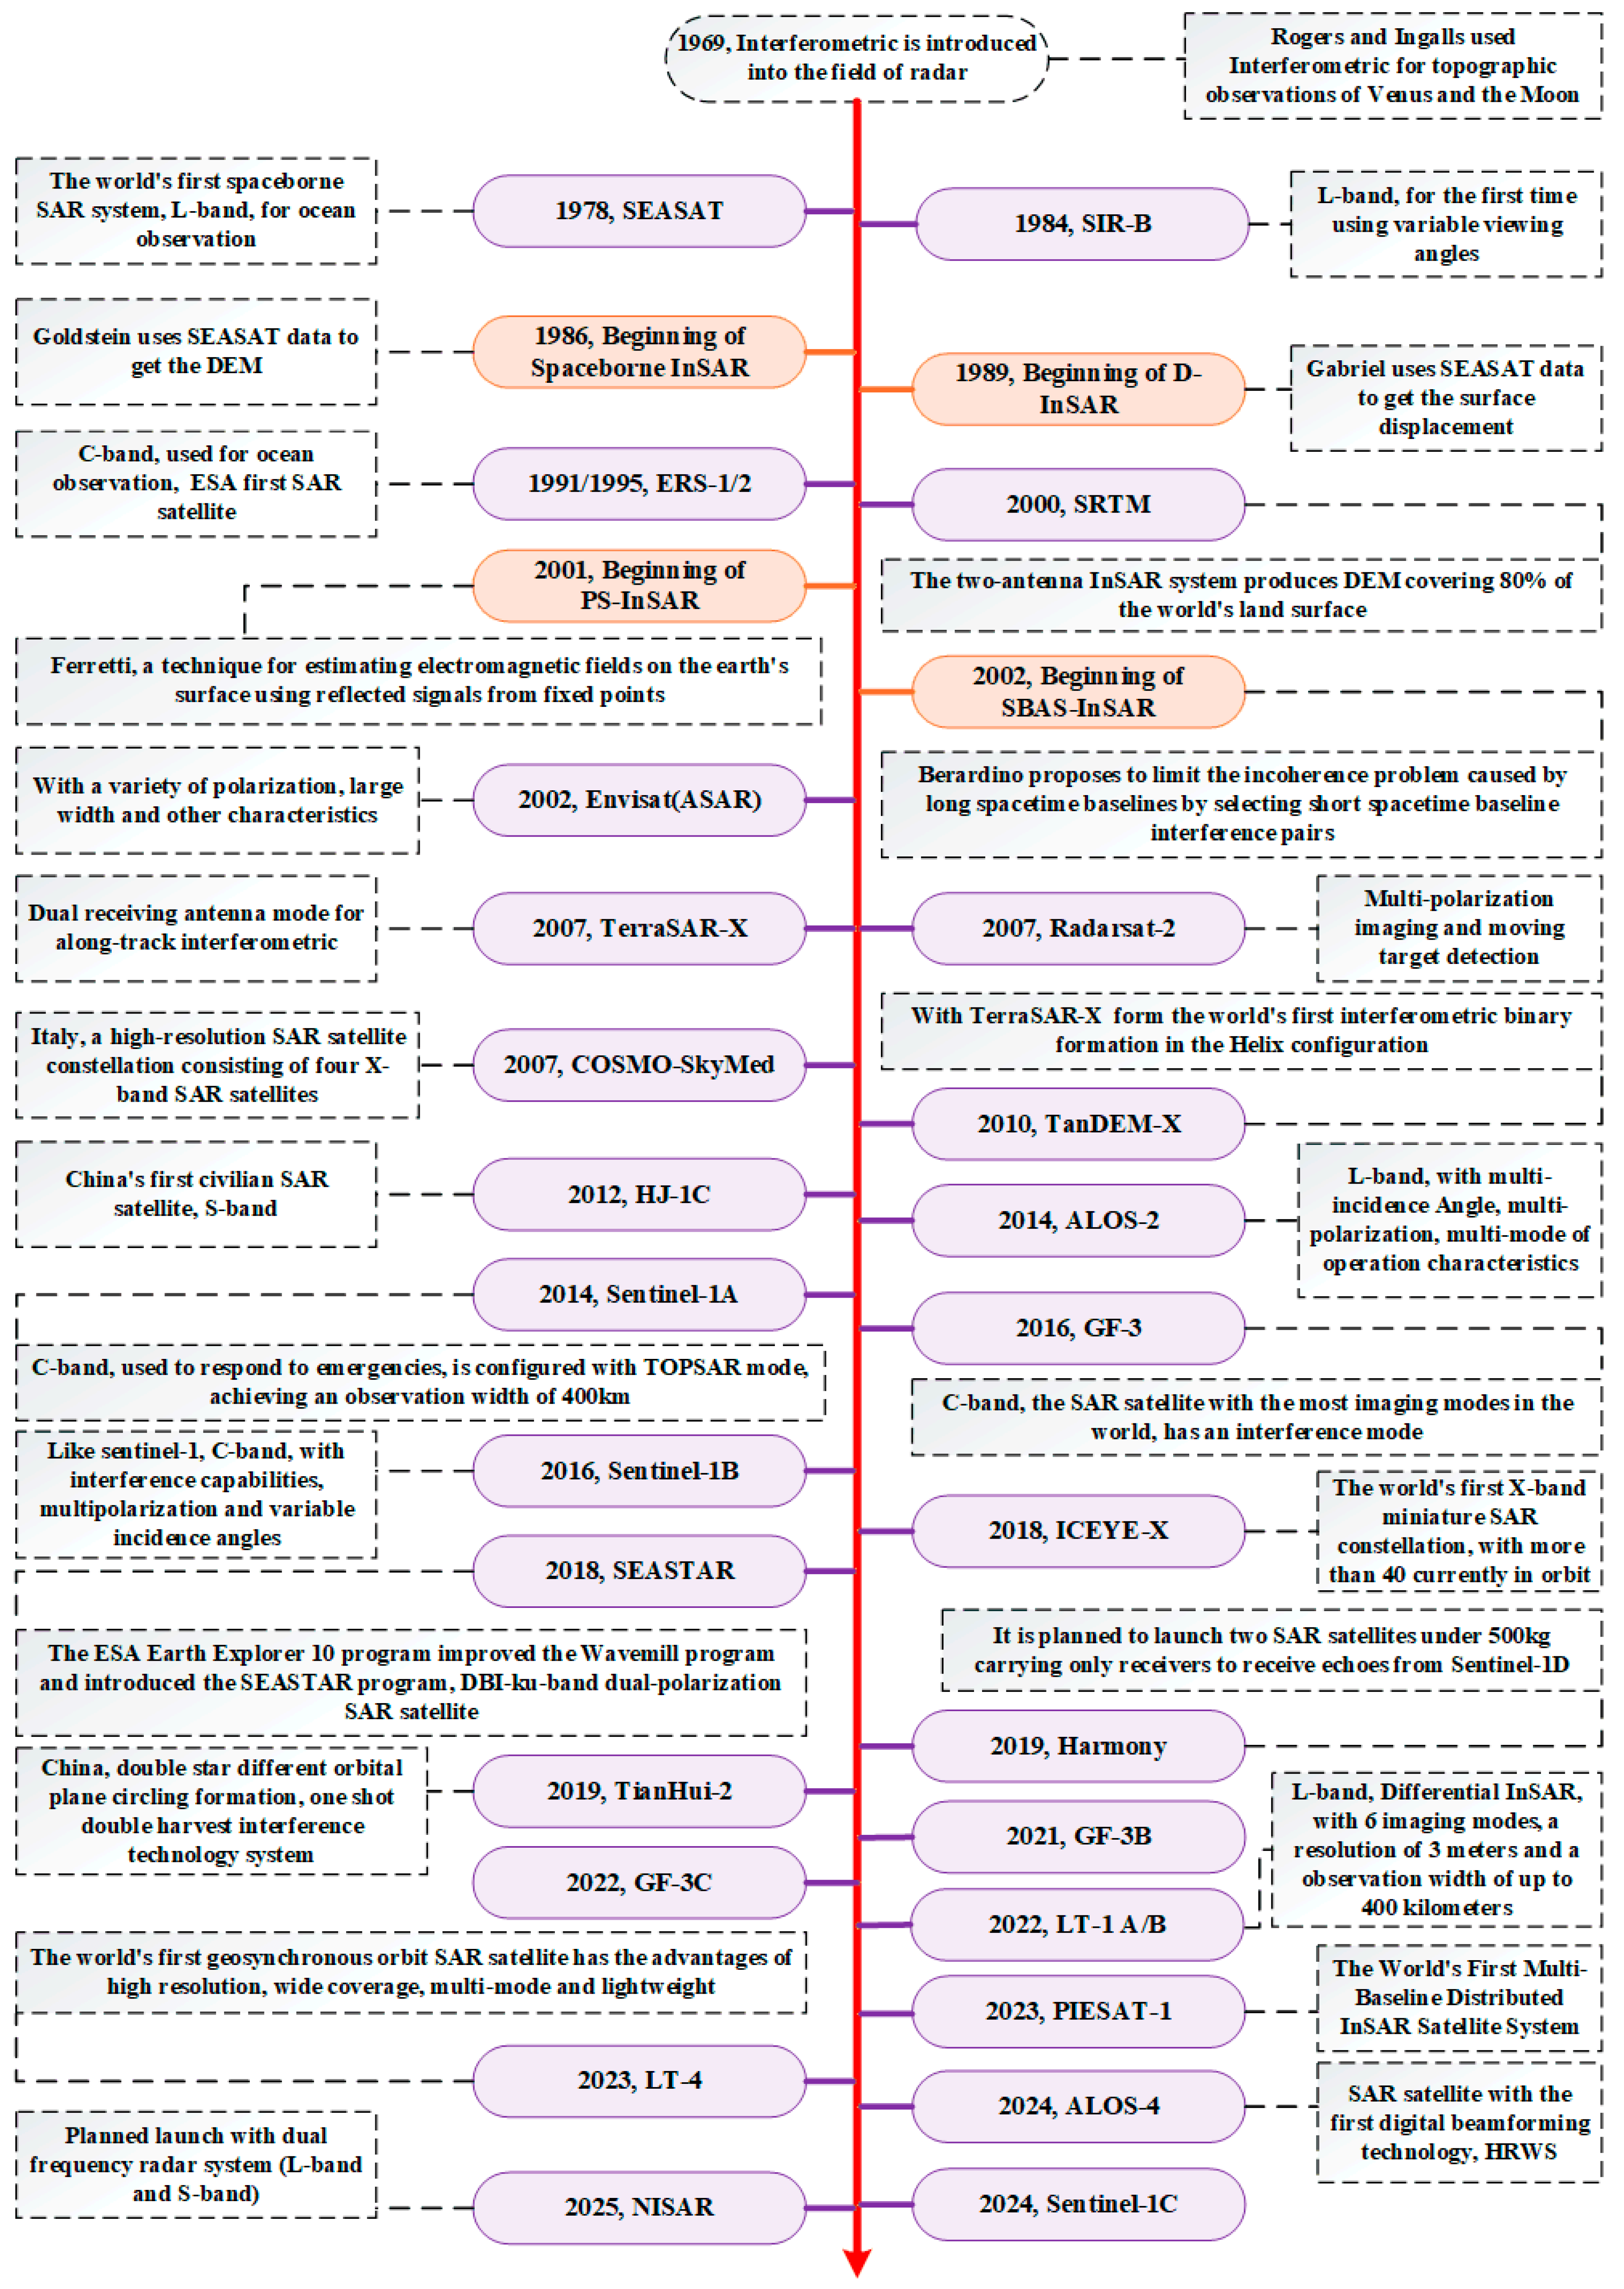
1. Introduction
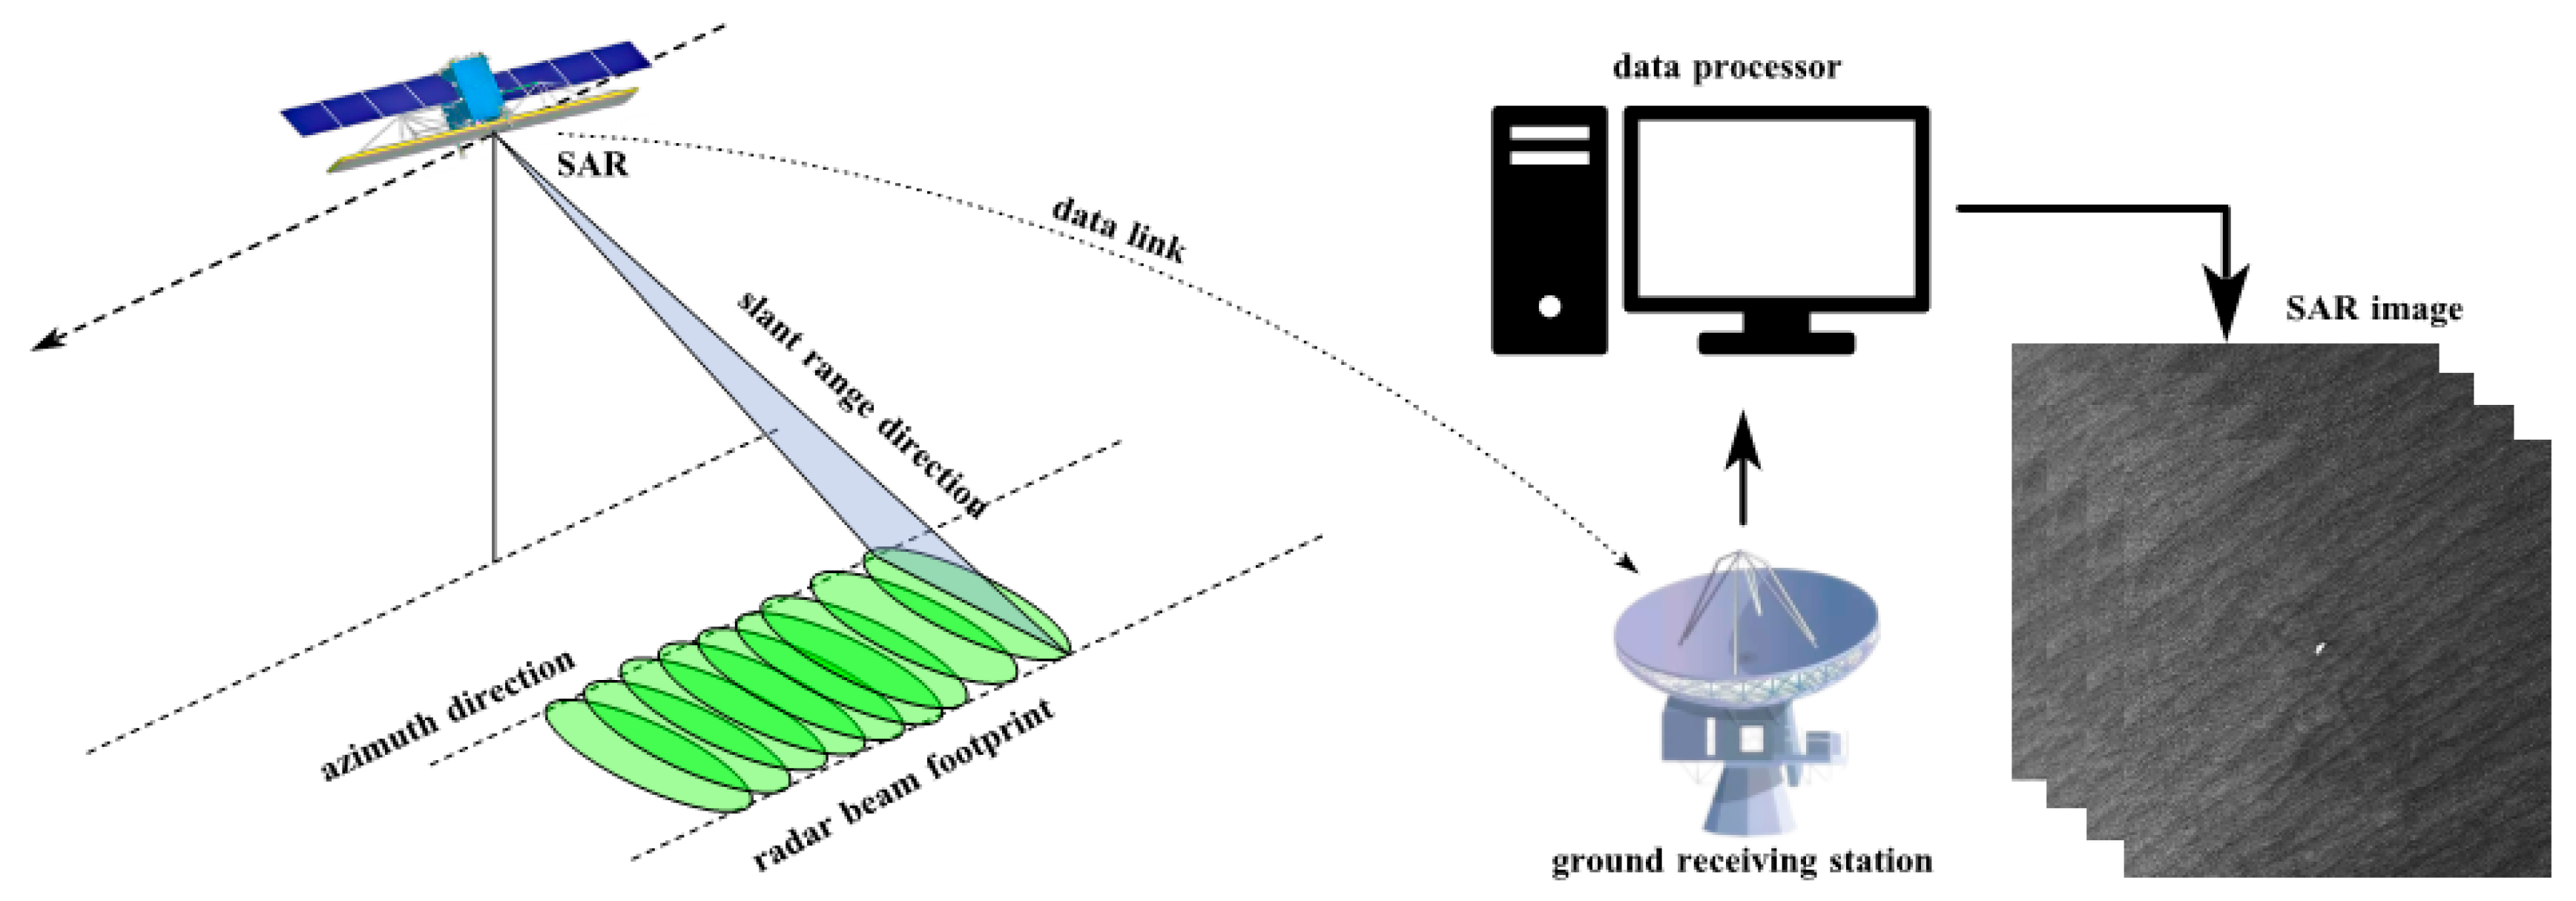
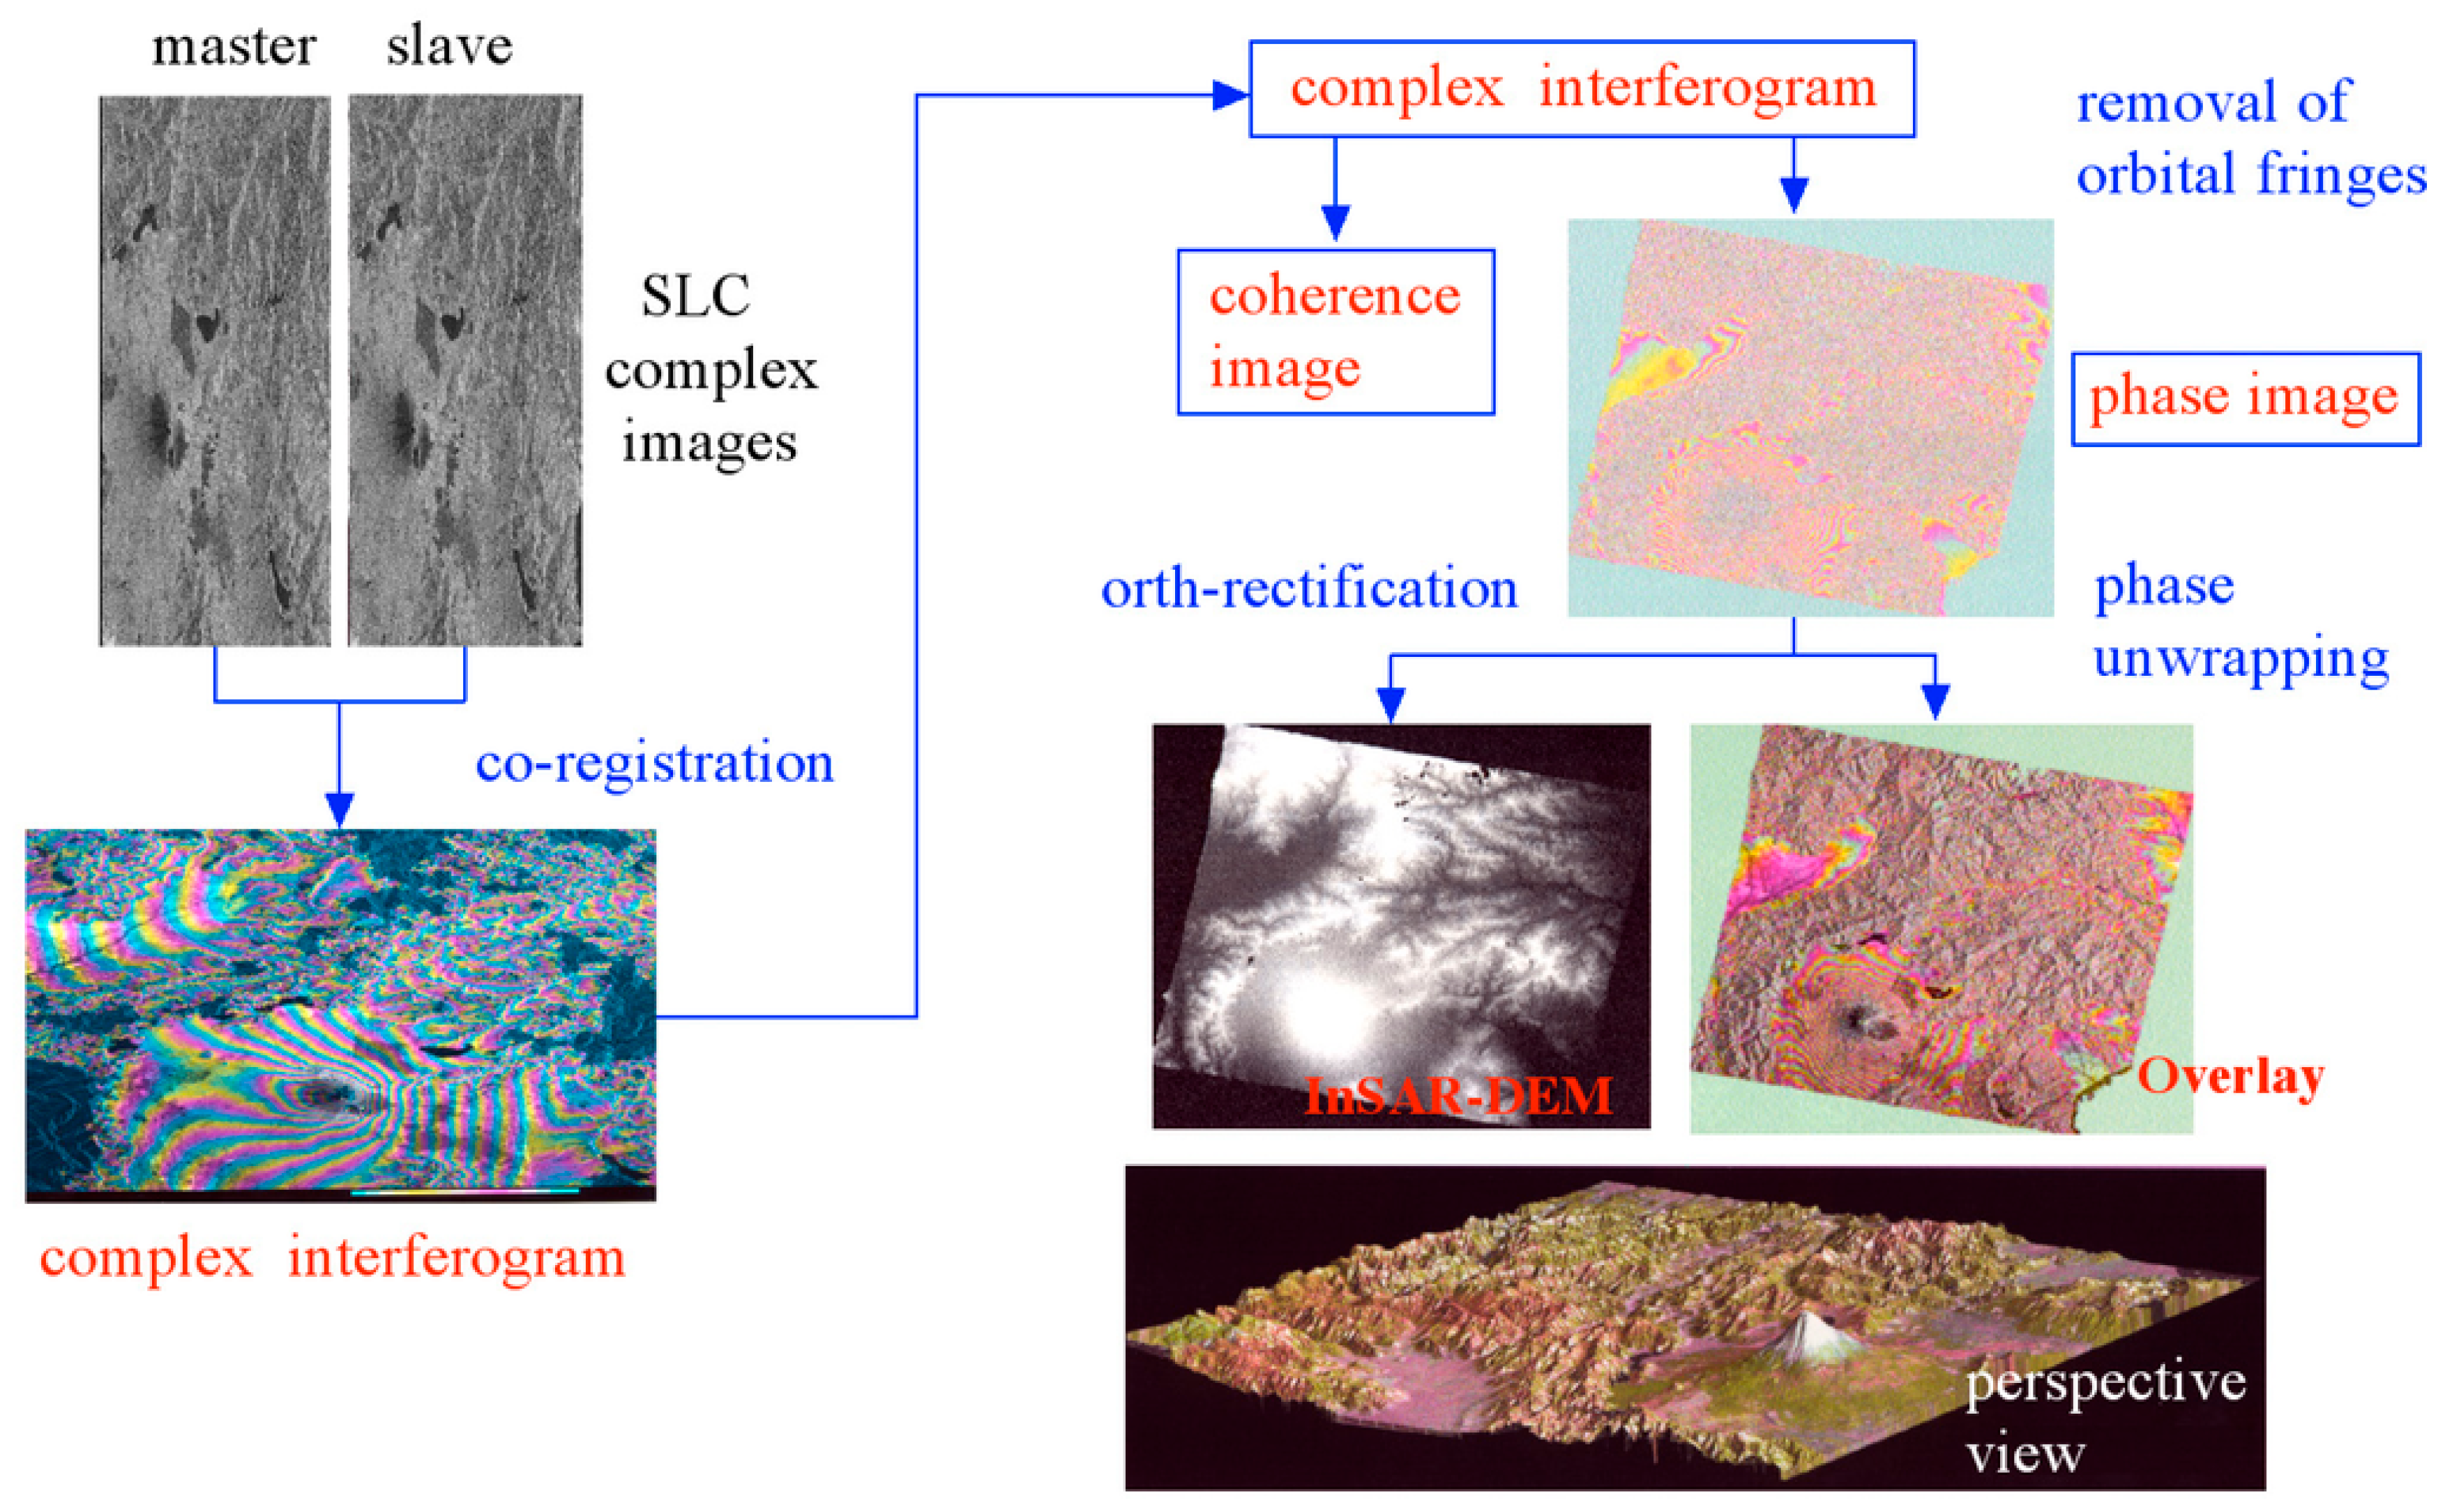
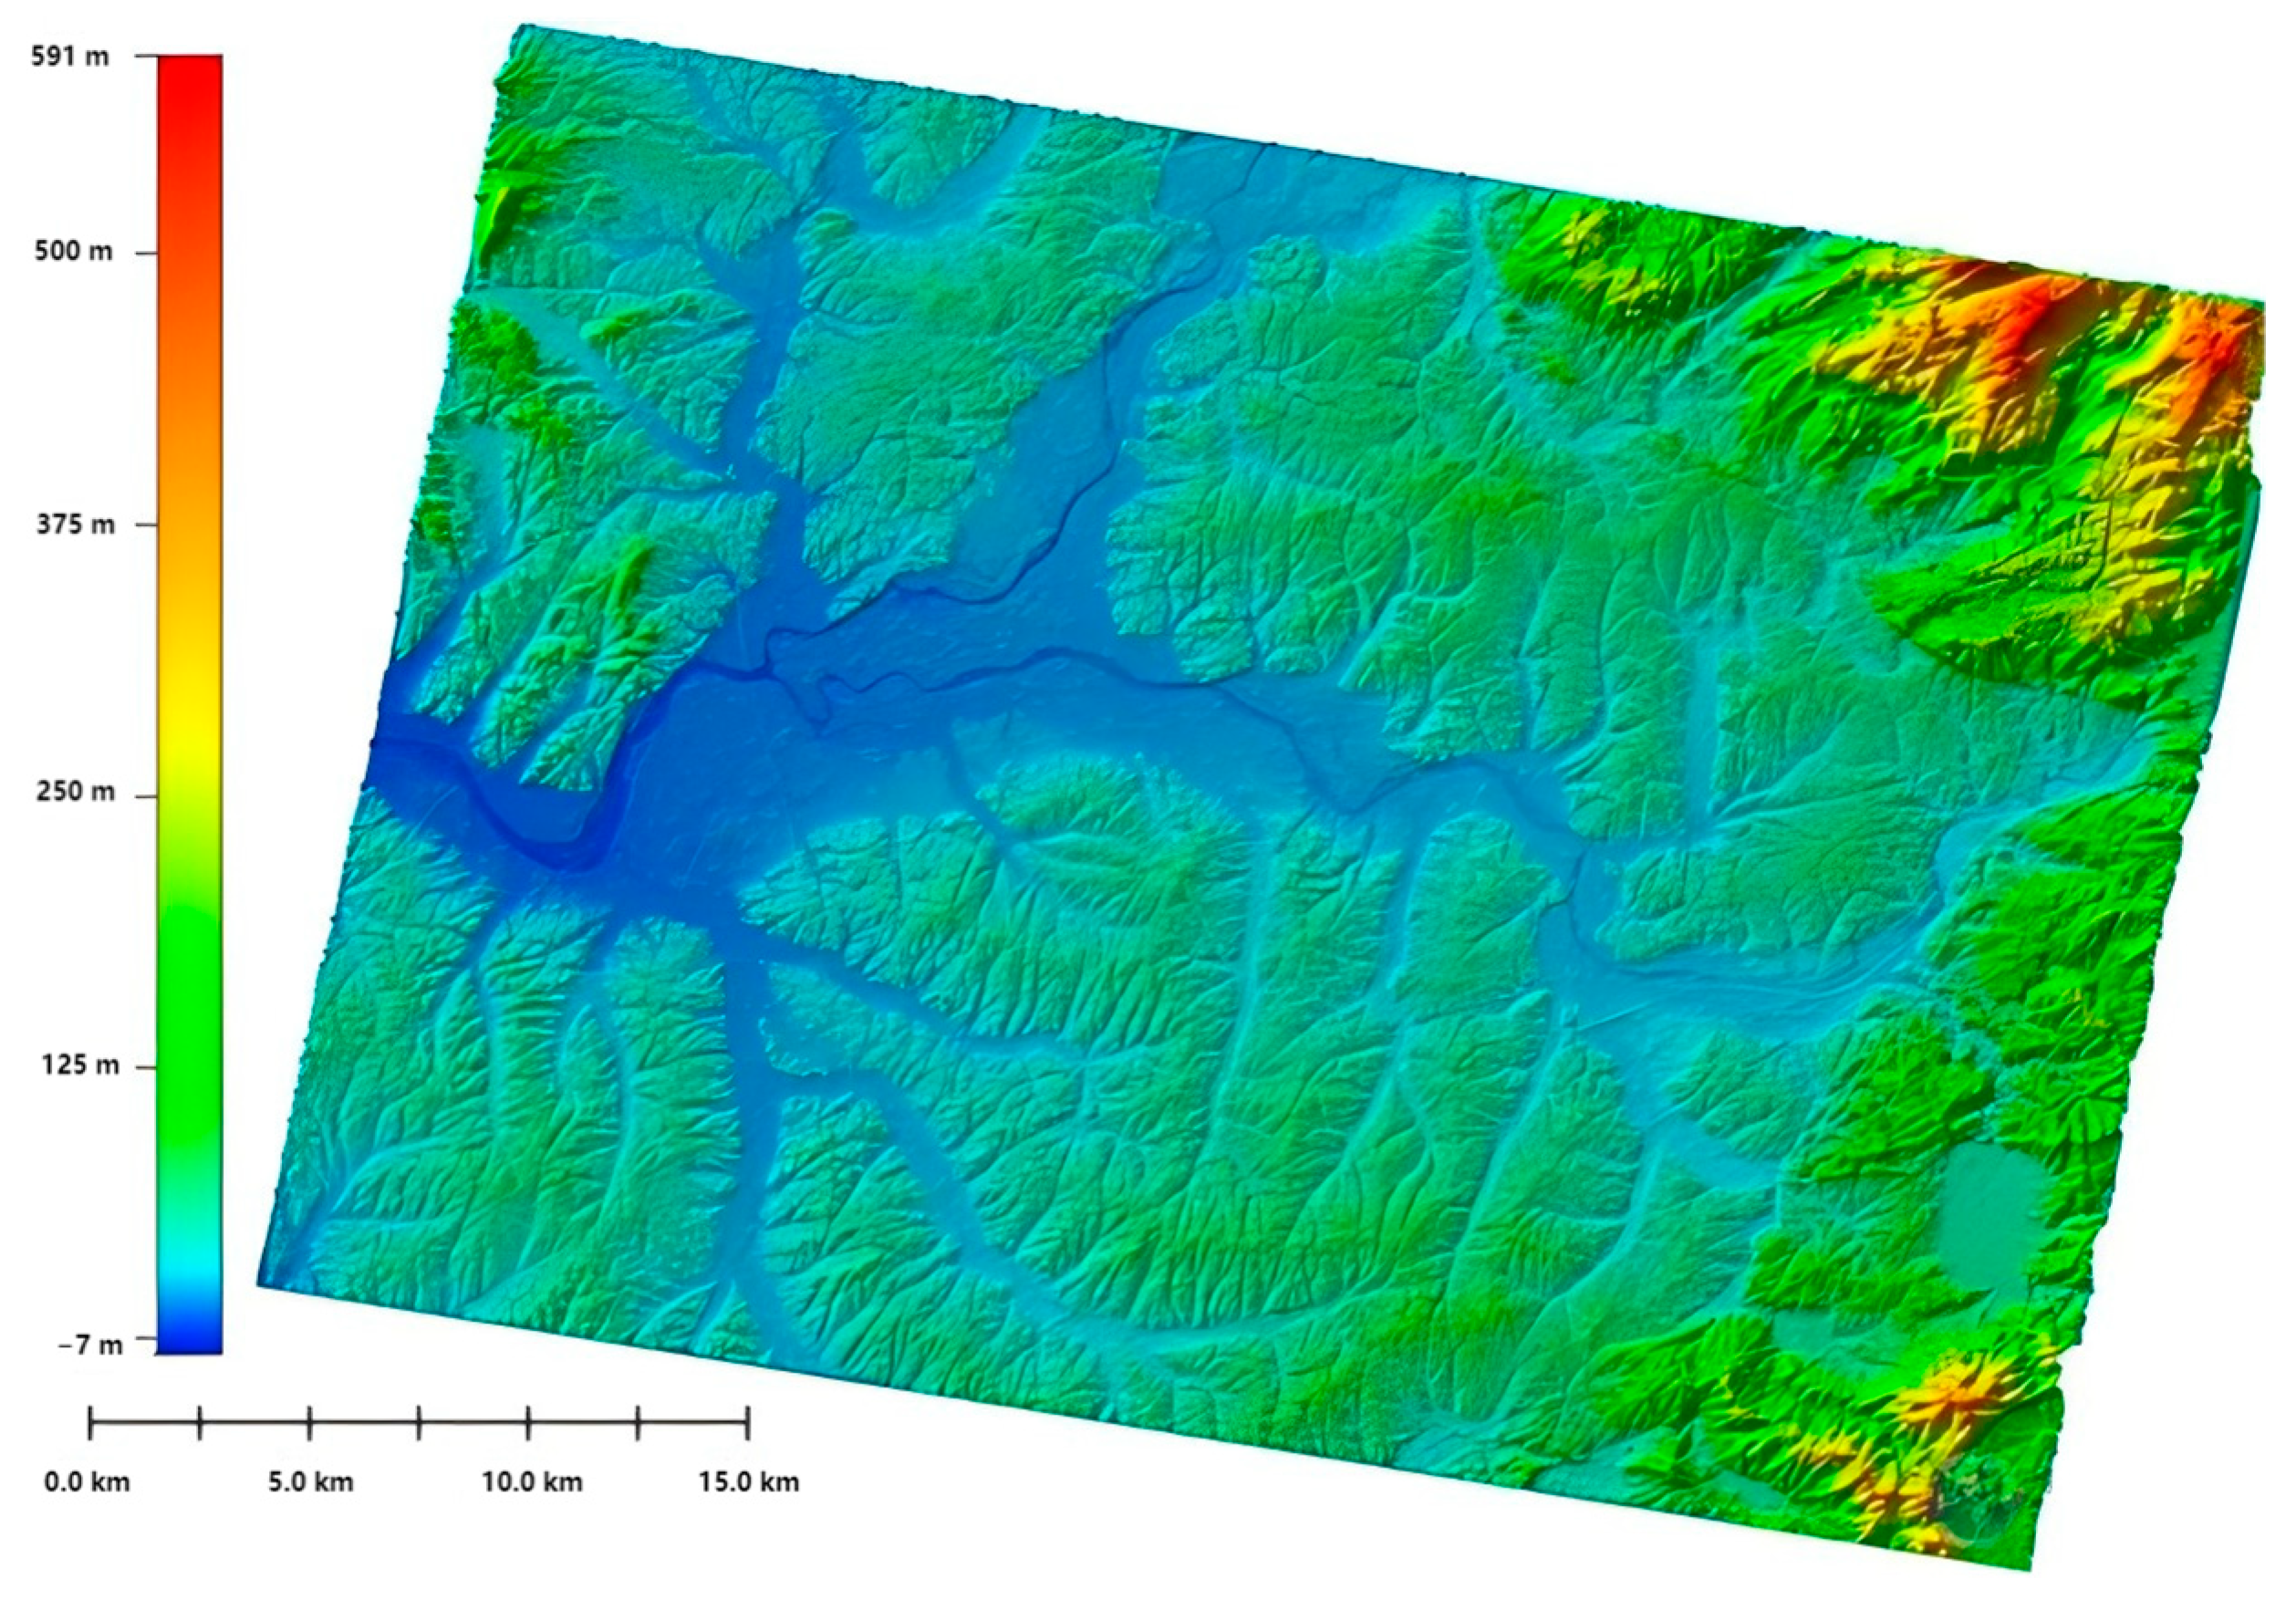
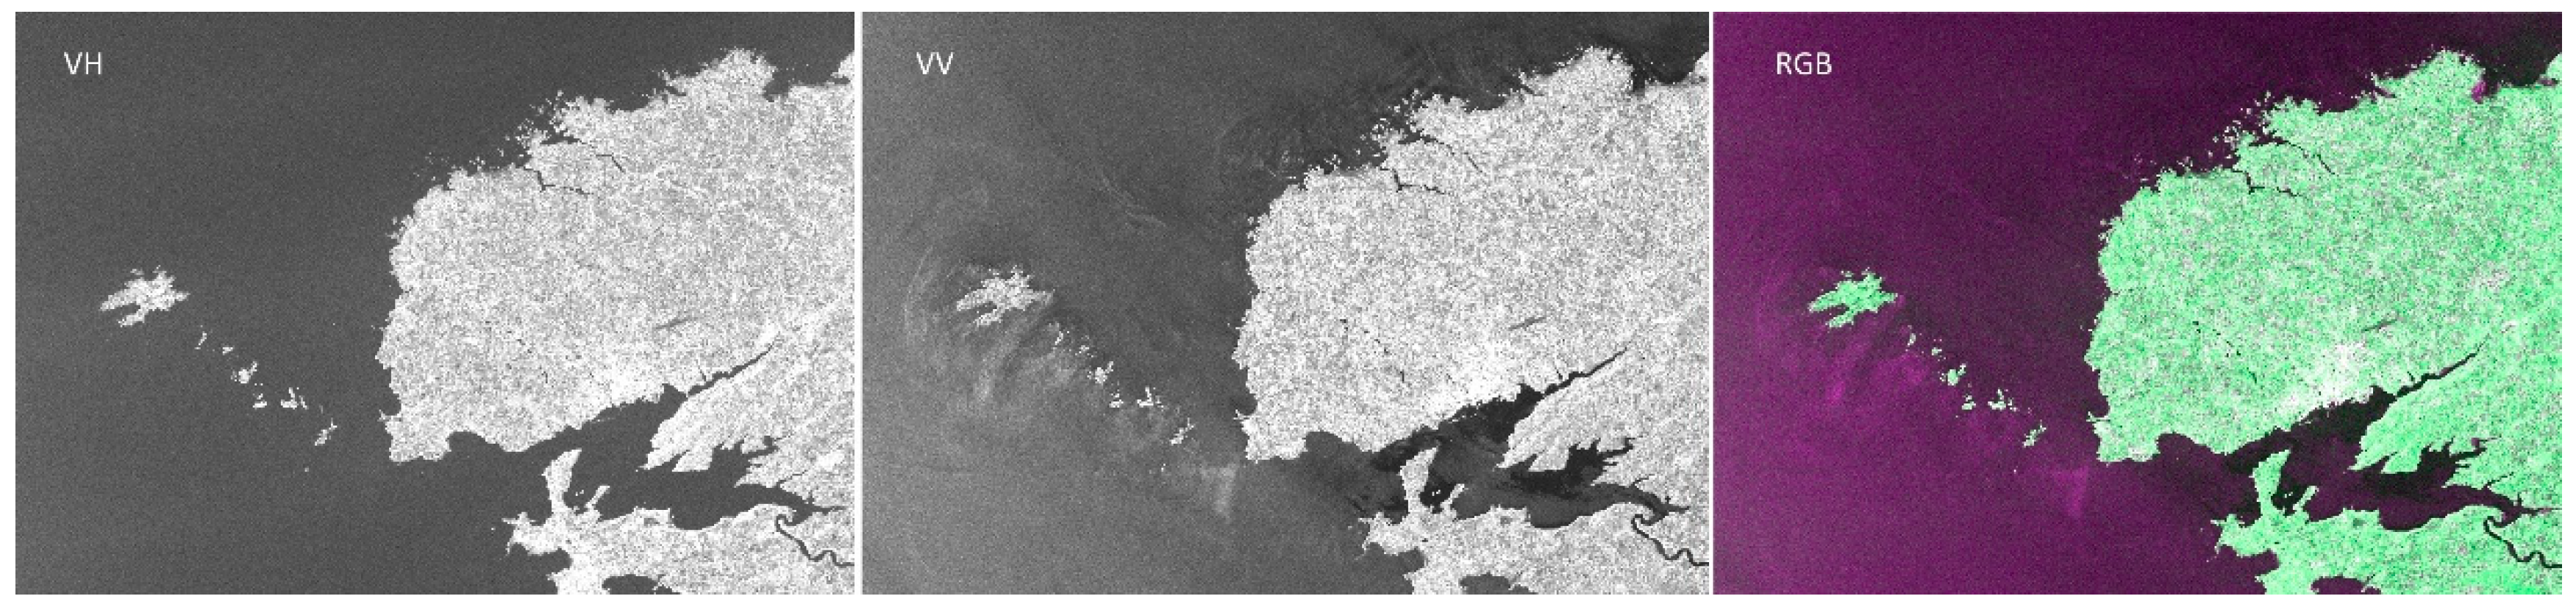
2. InSAR Principle
3. Status and Application
3.1. Repeat-Pass Interference
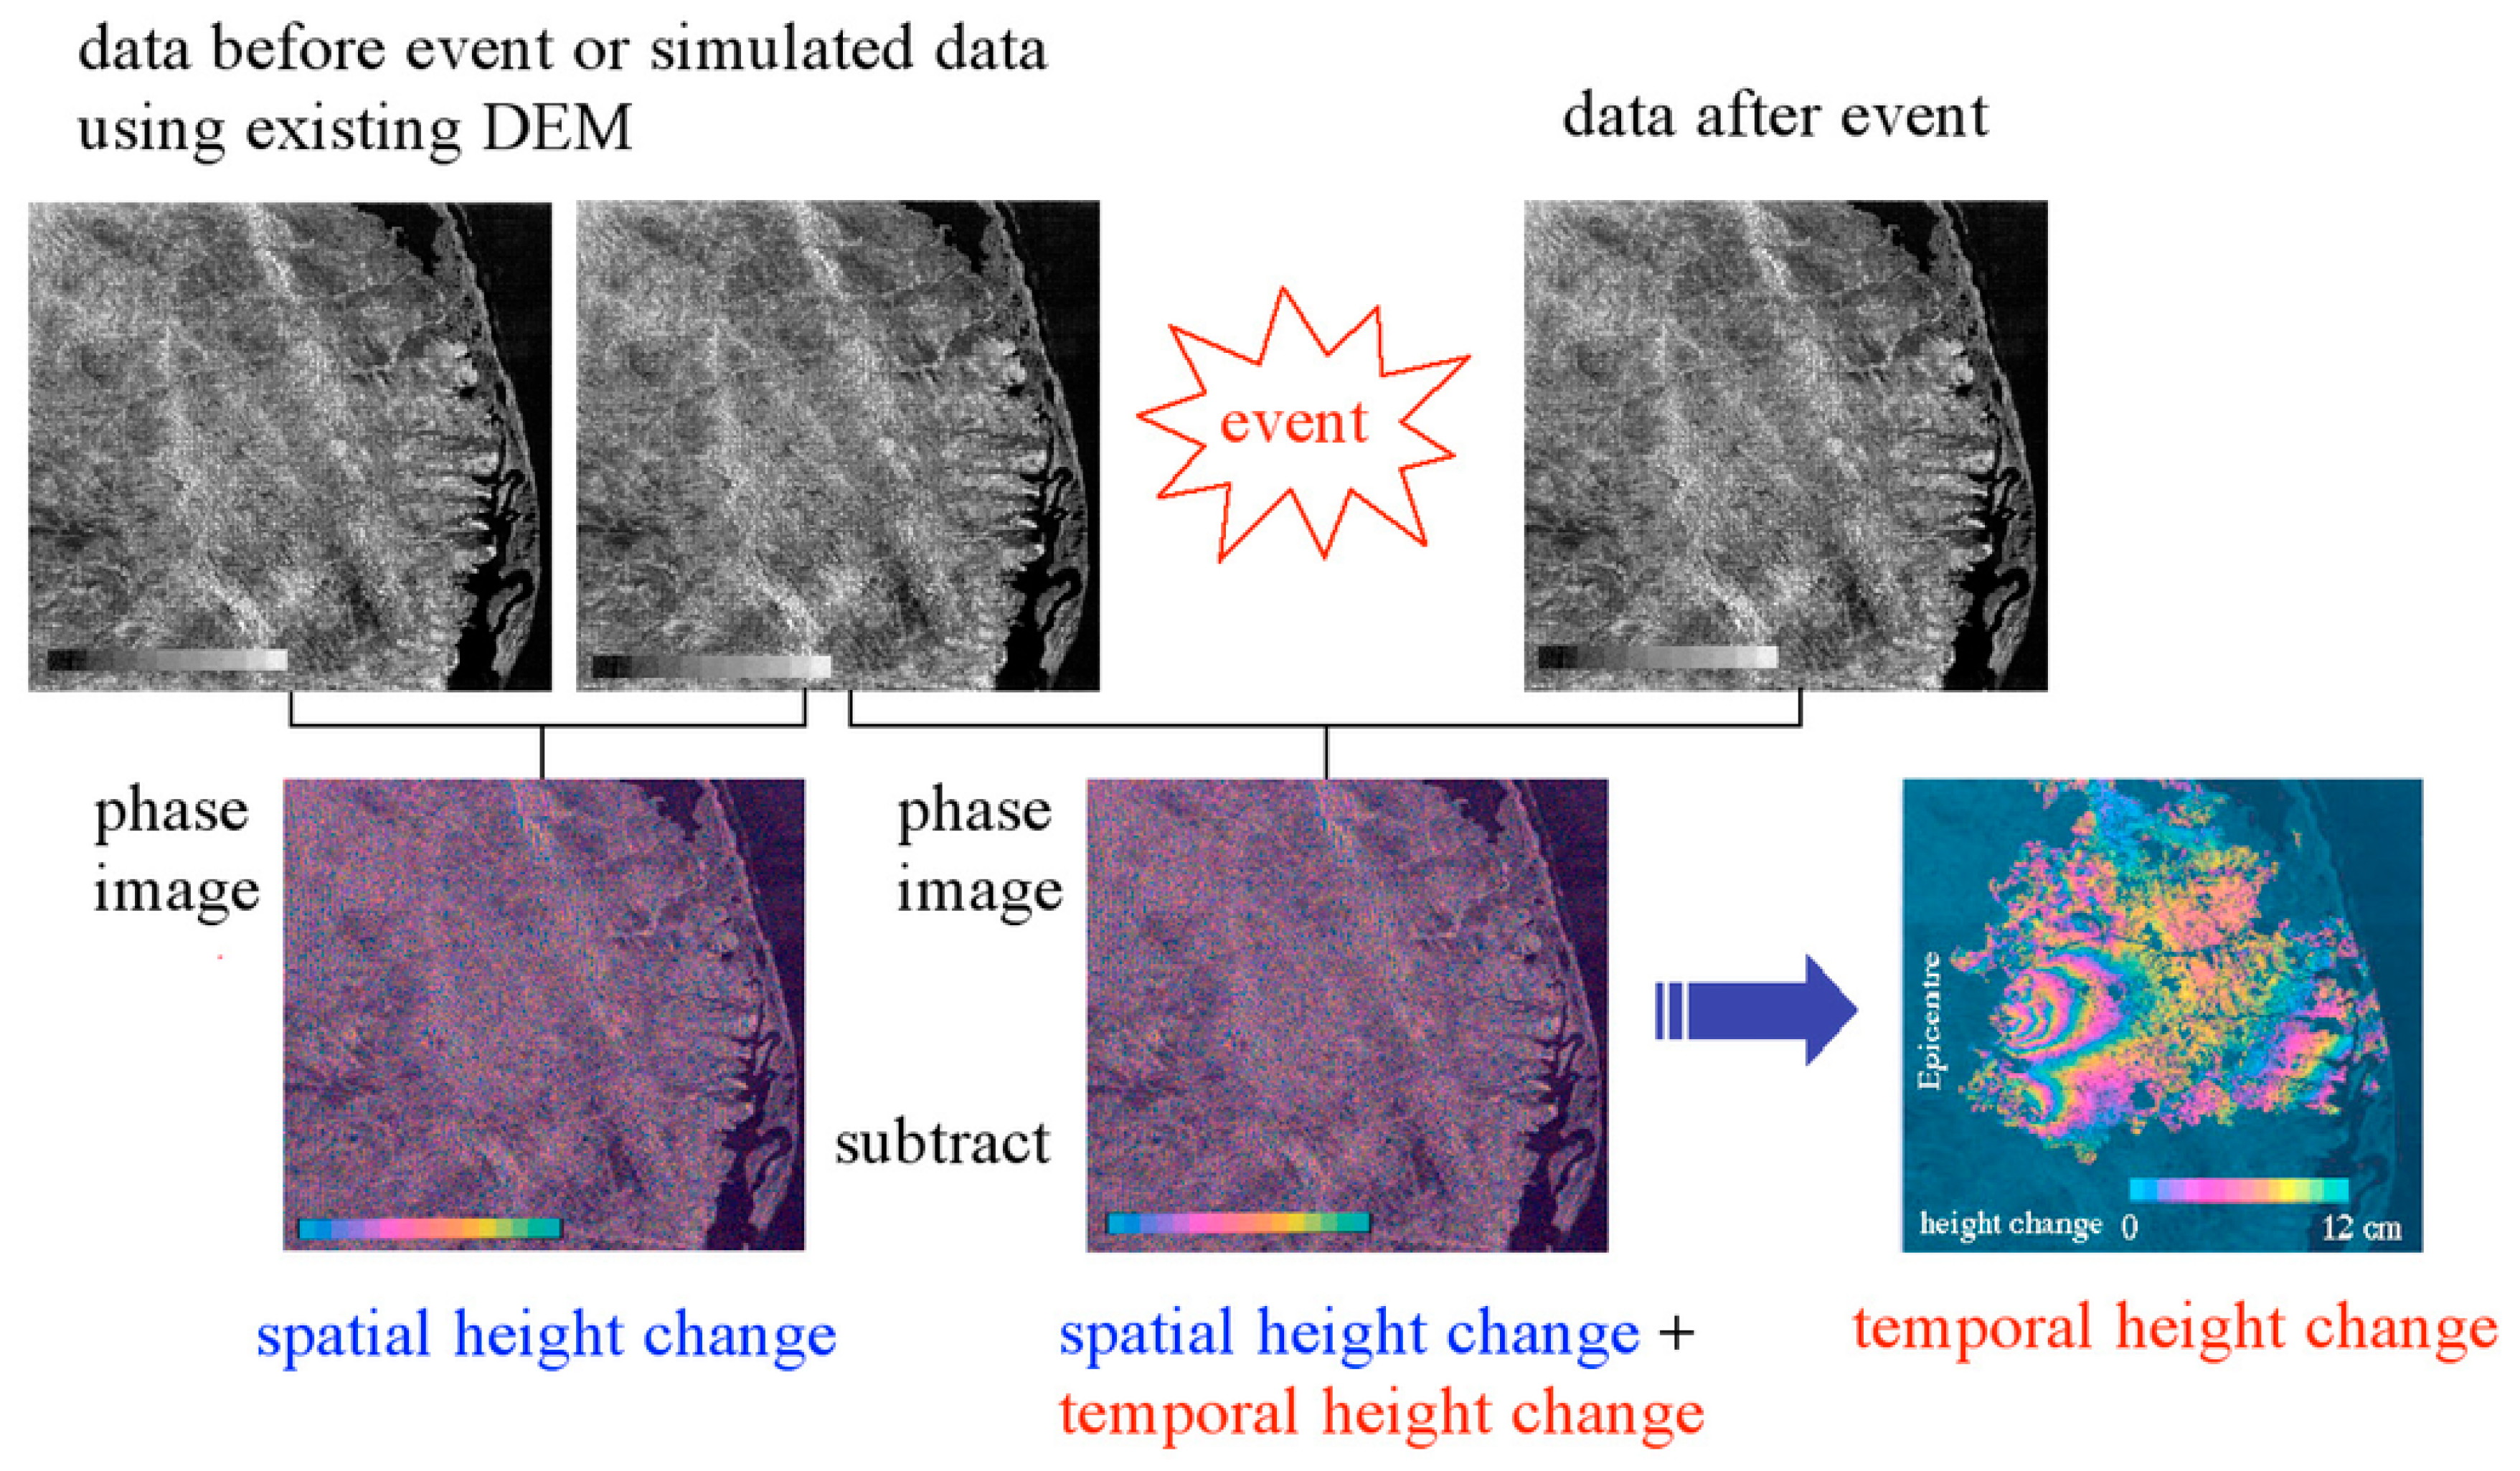
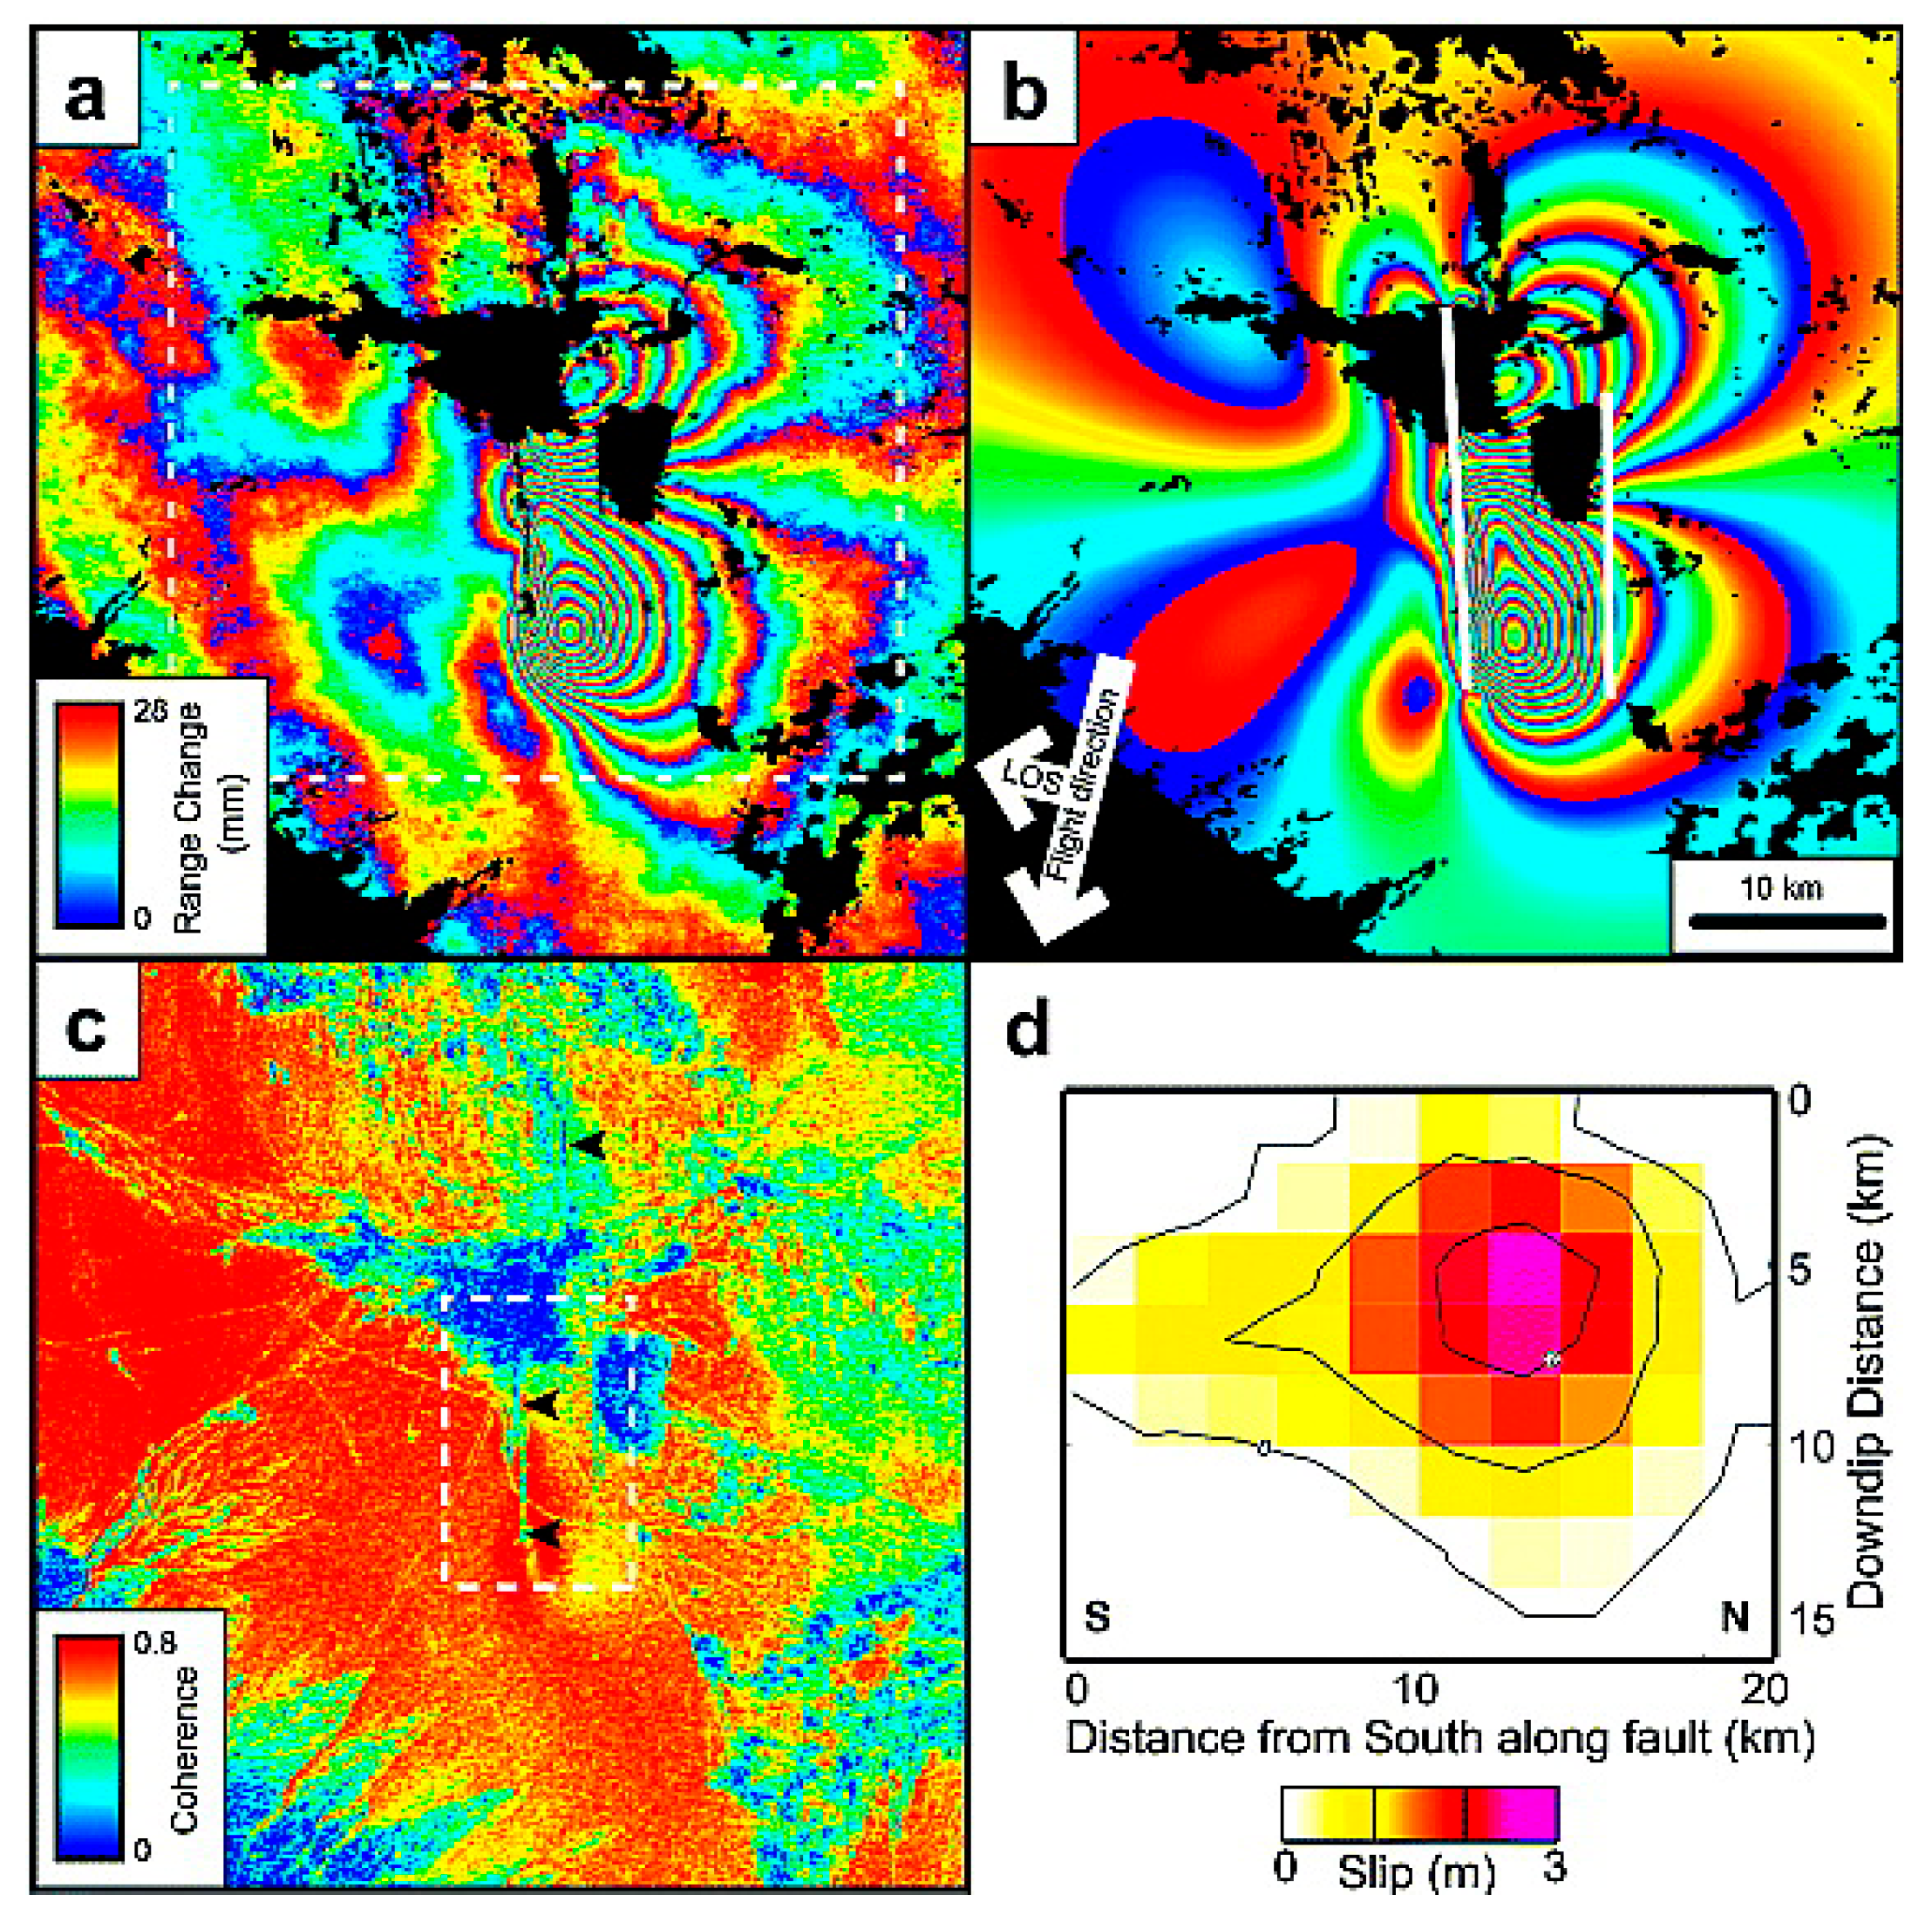
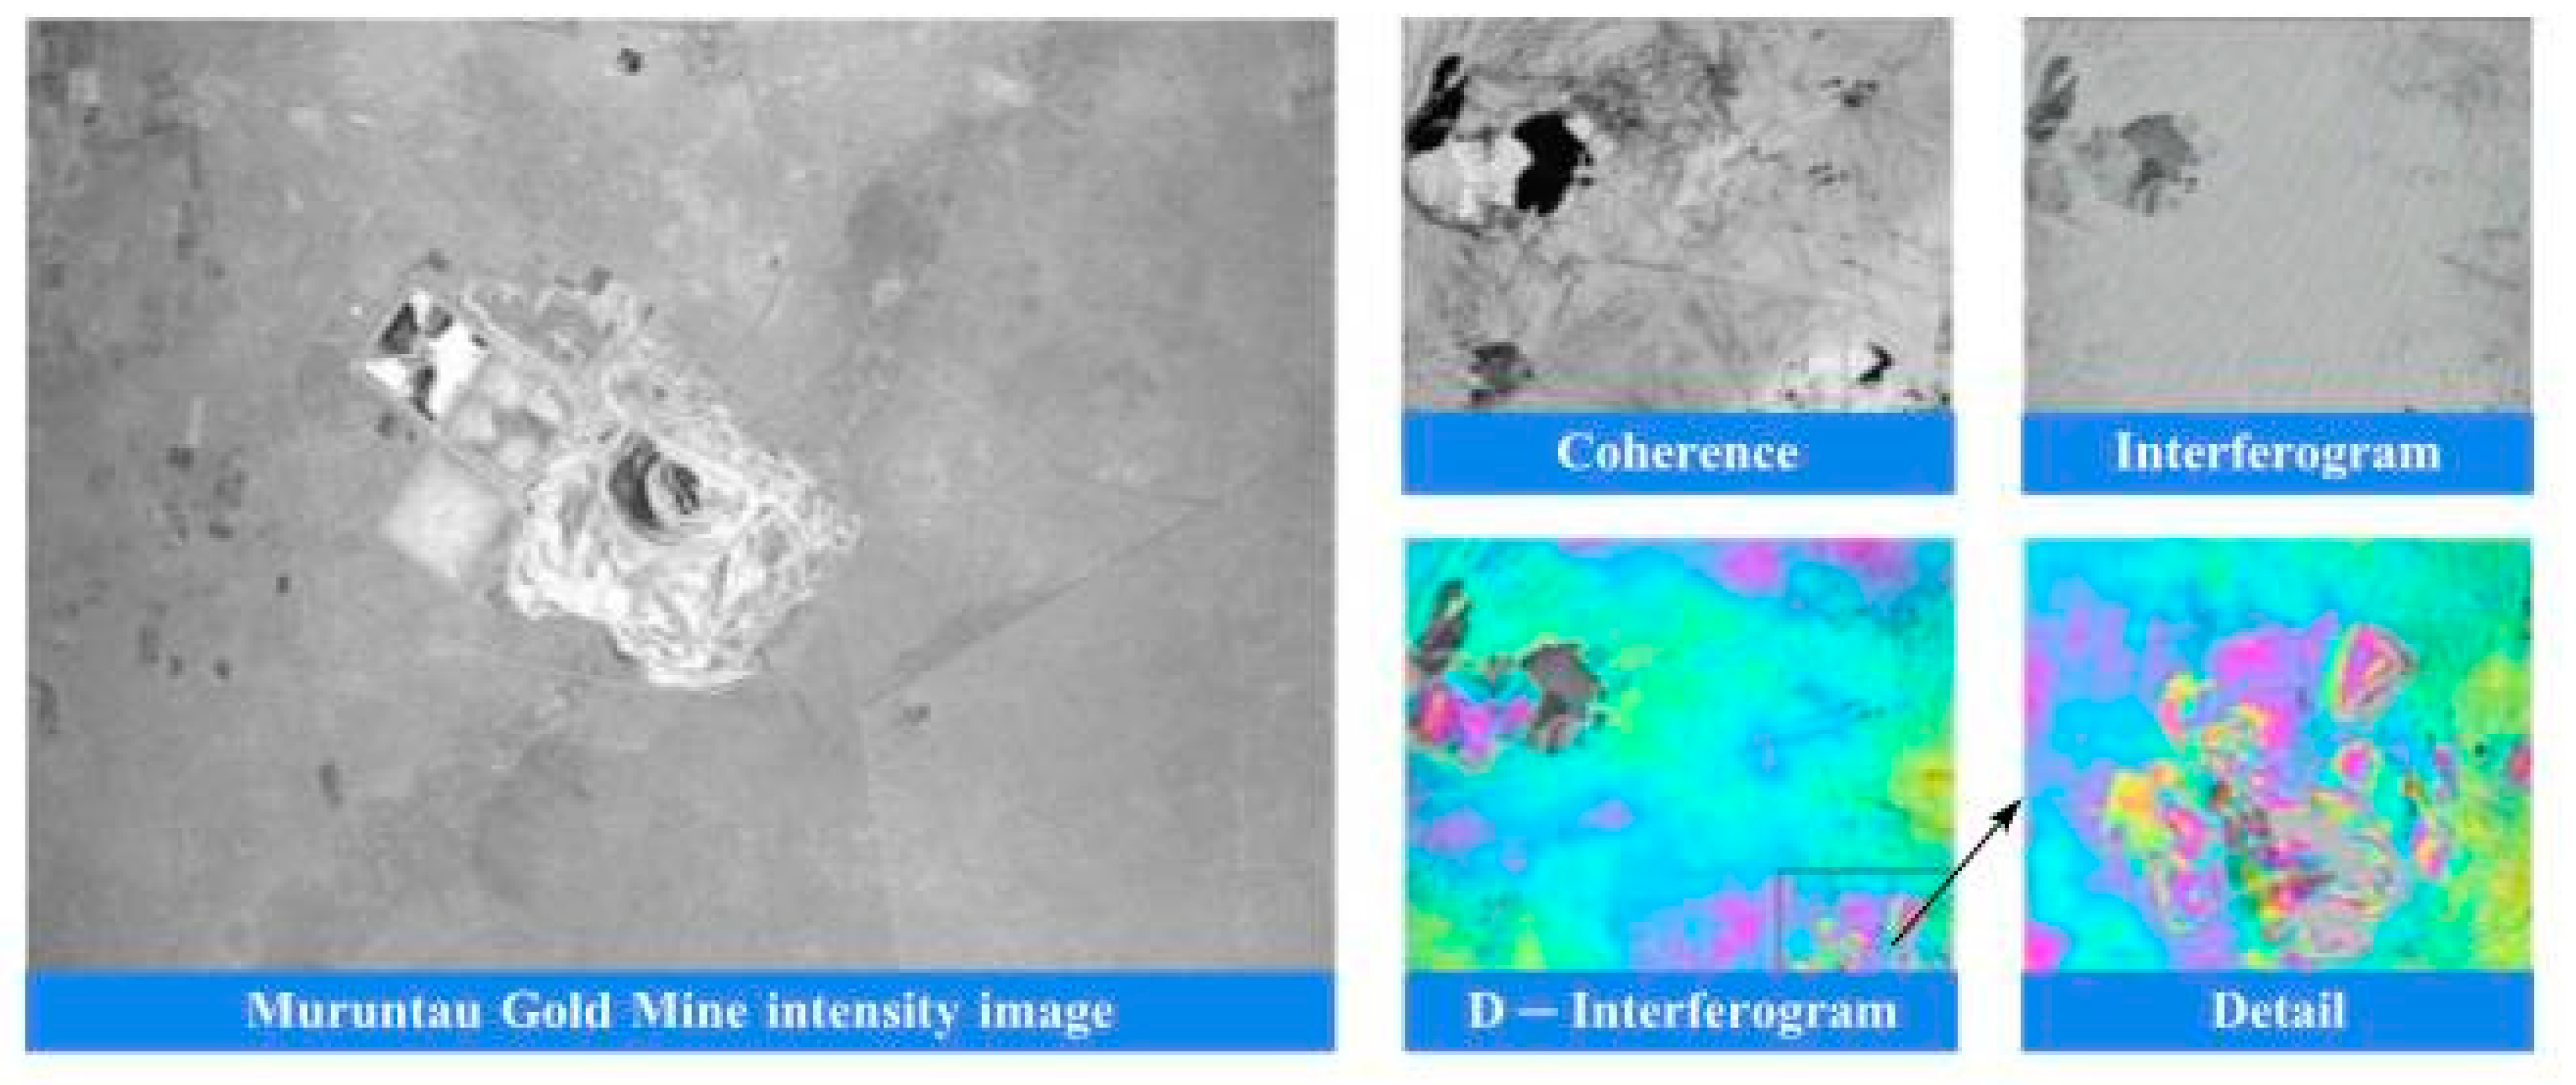
3.1.1. D-InSAR
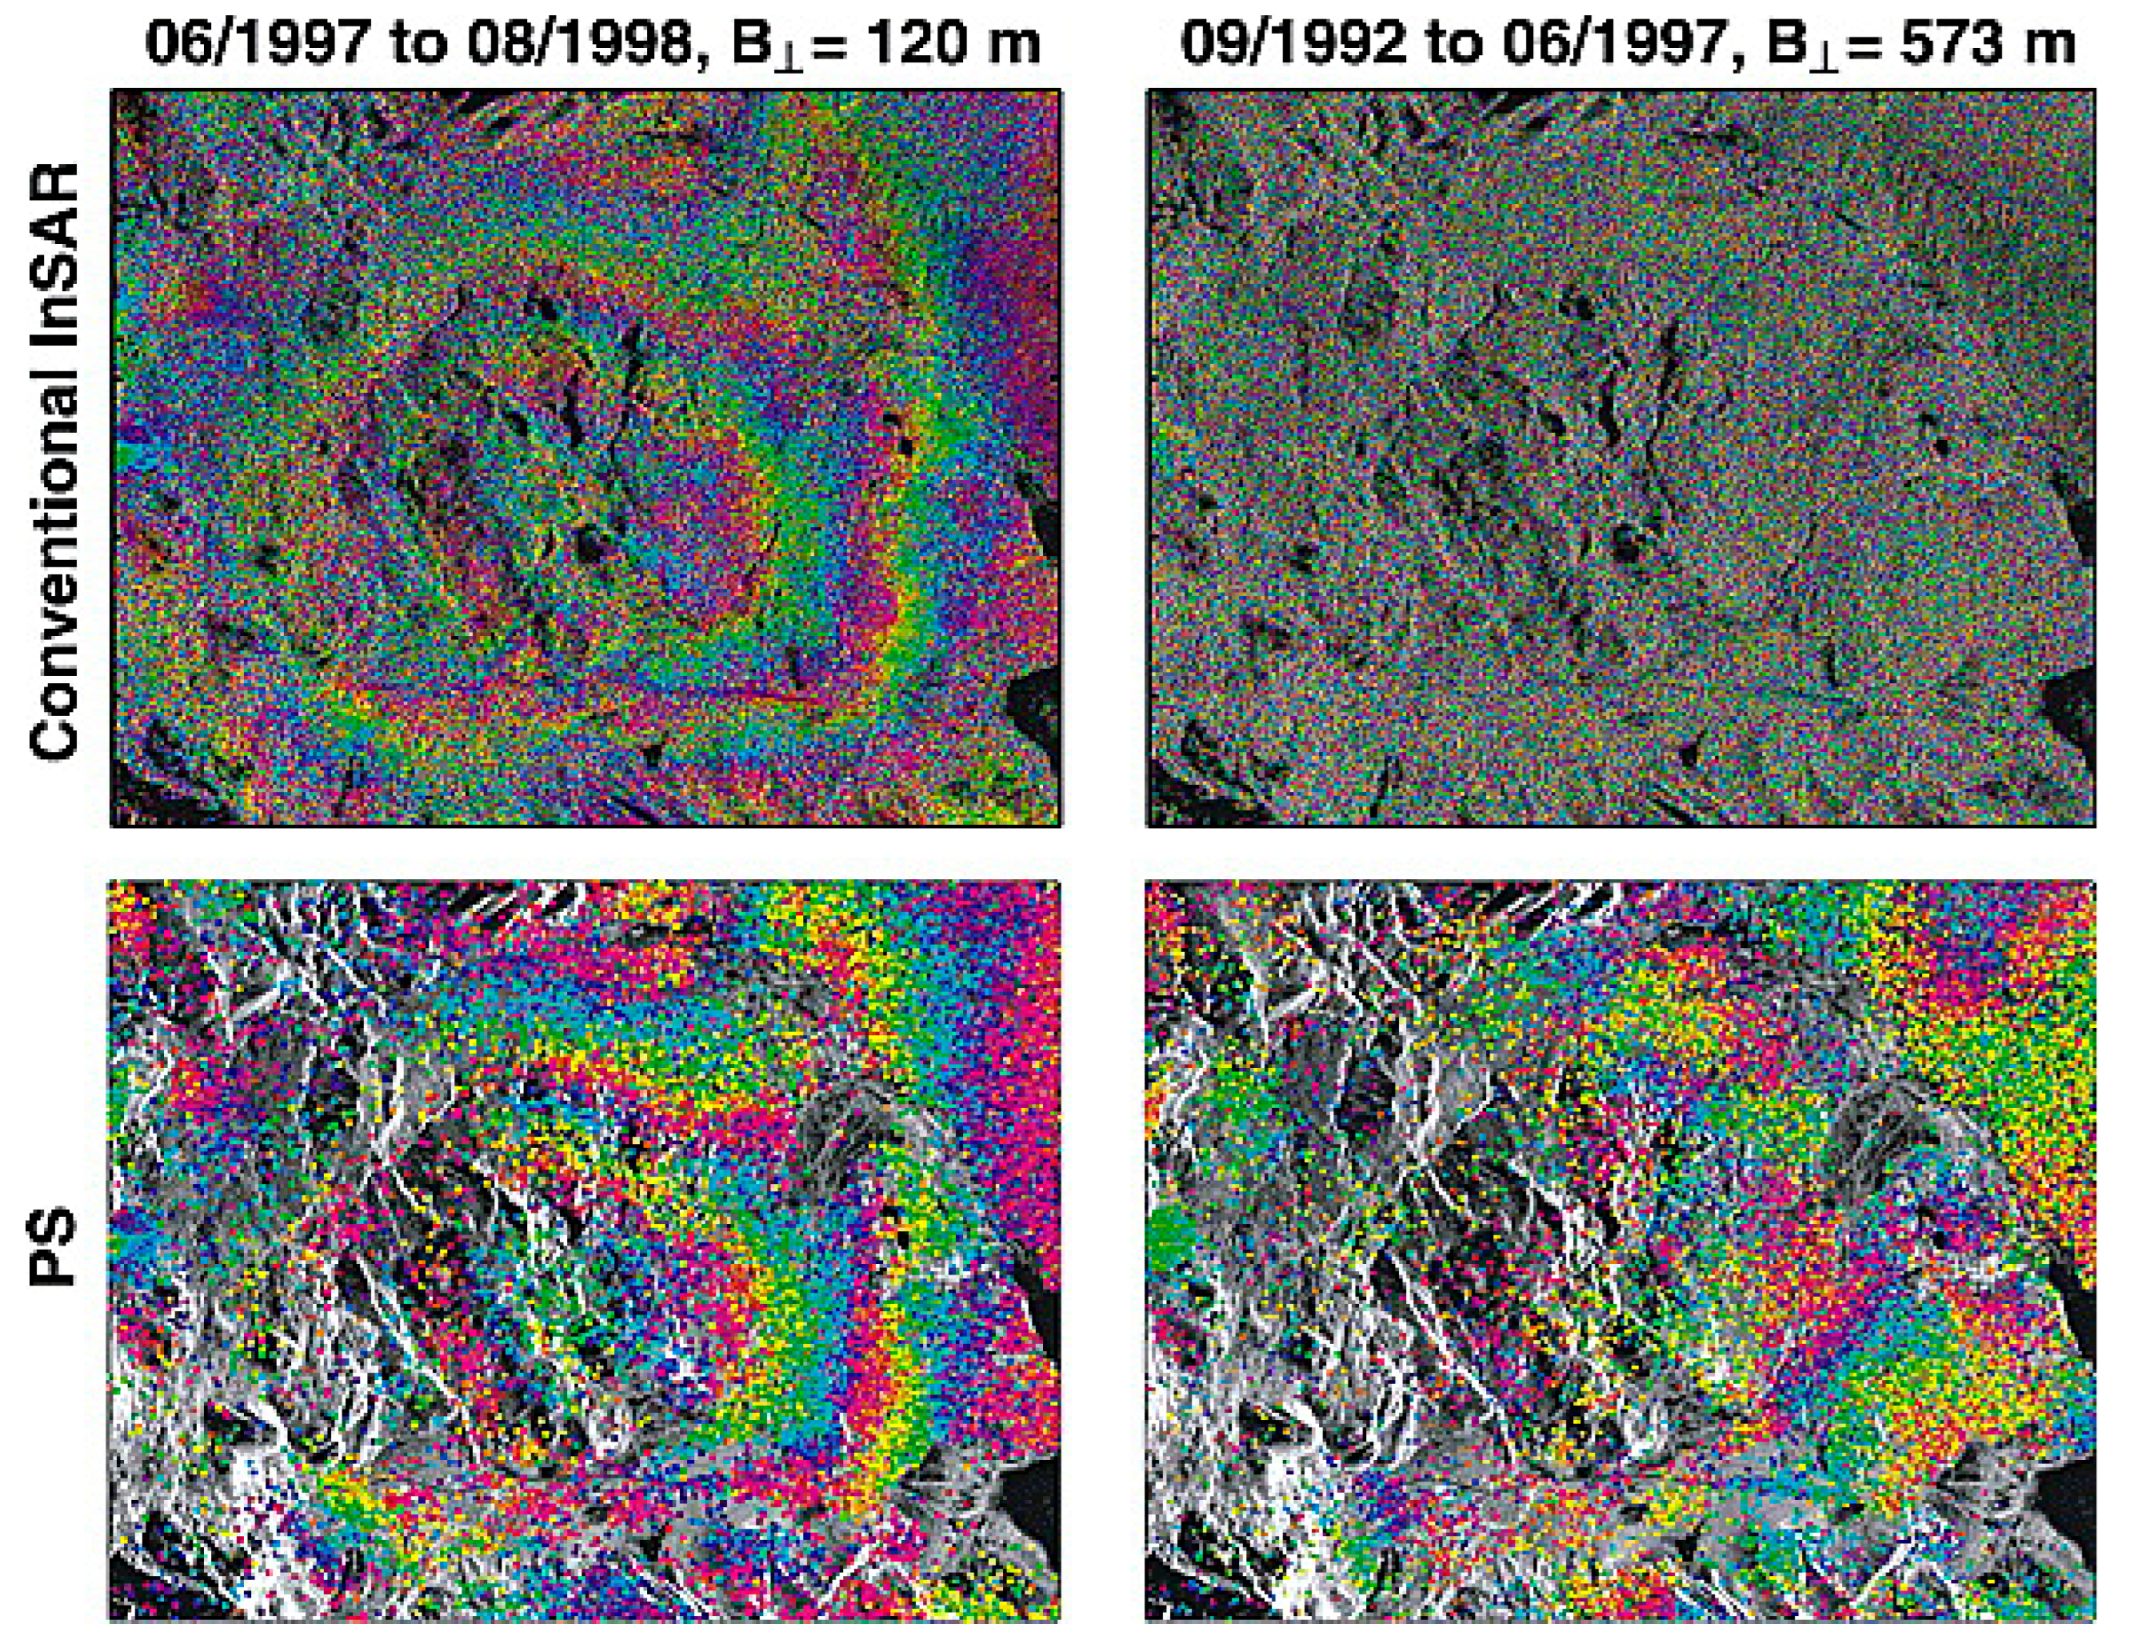
3.1.2. PS-InSAR
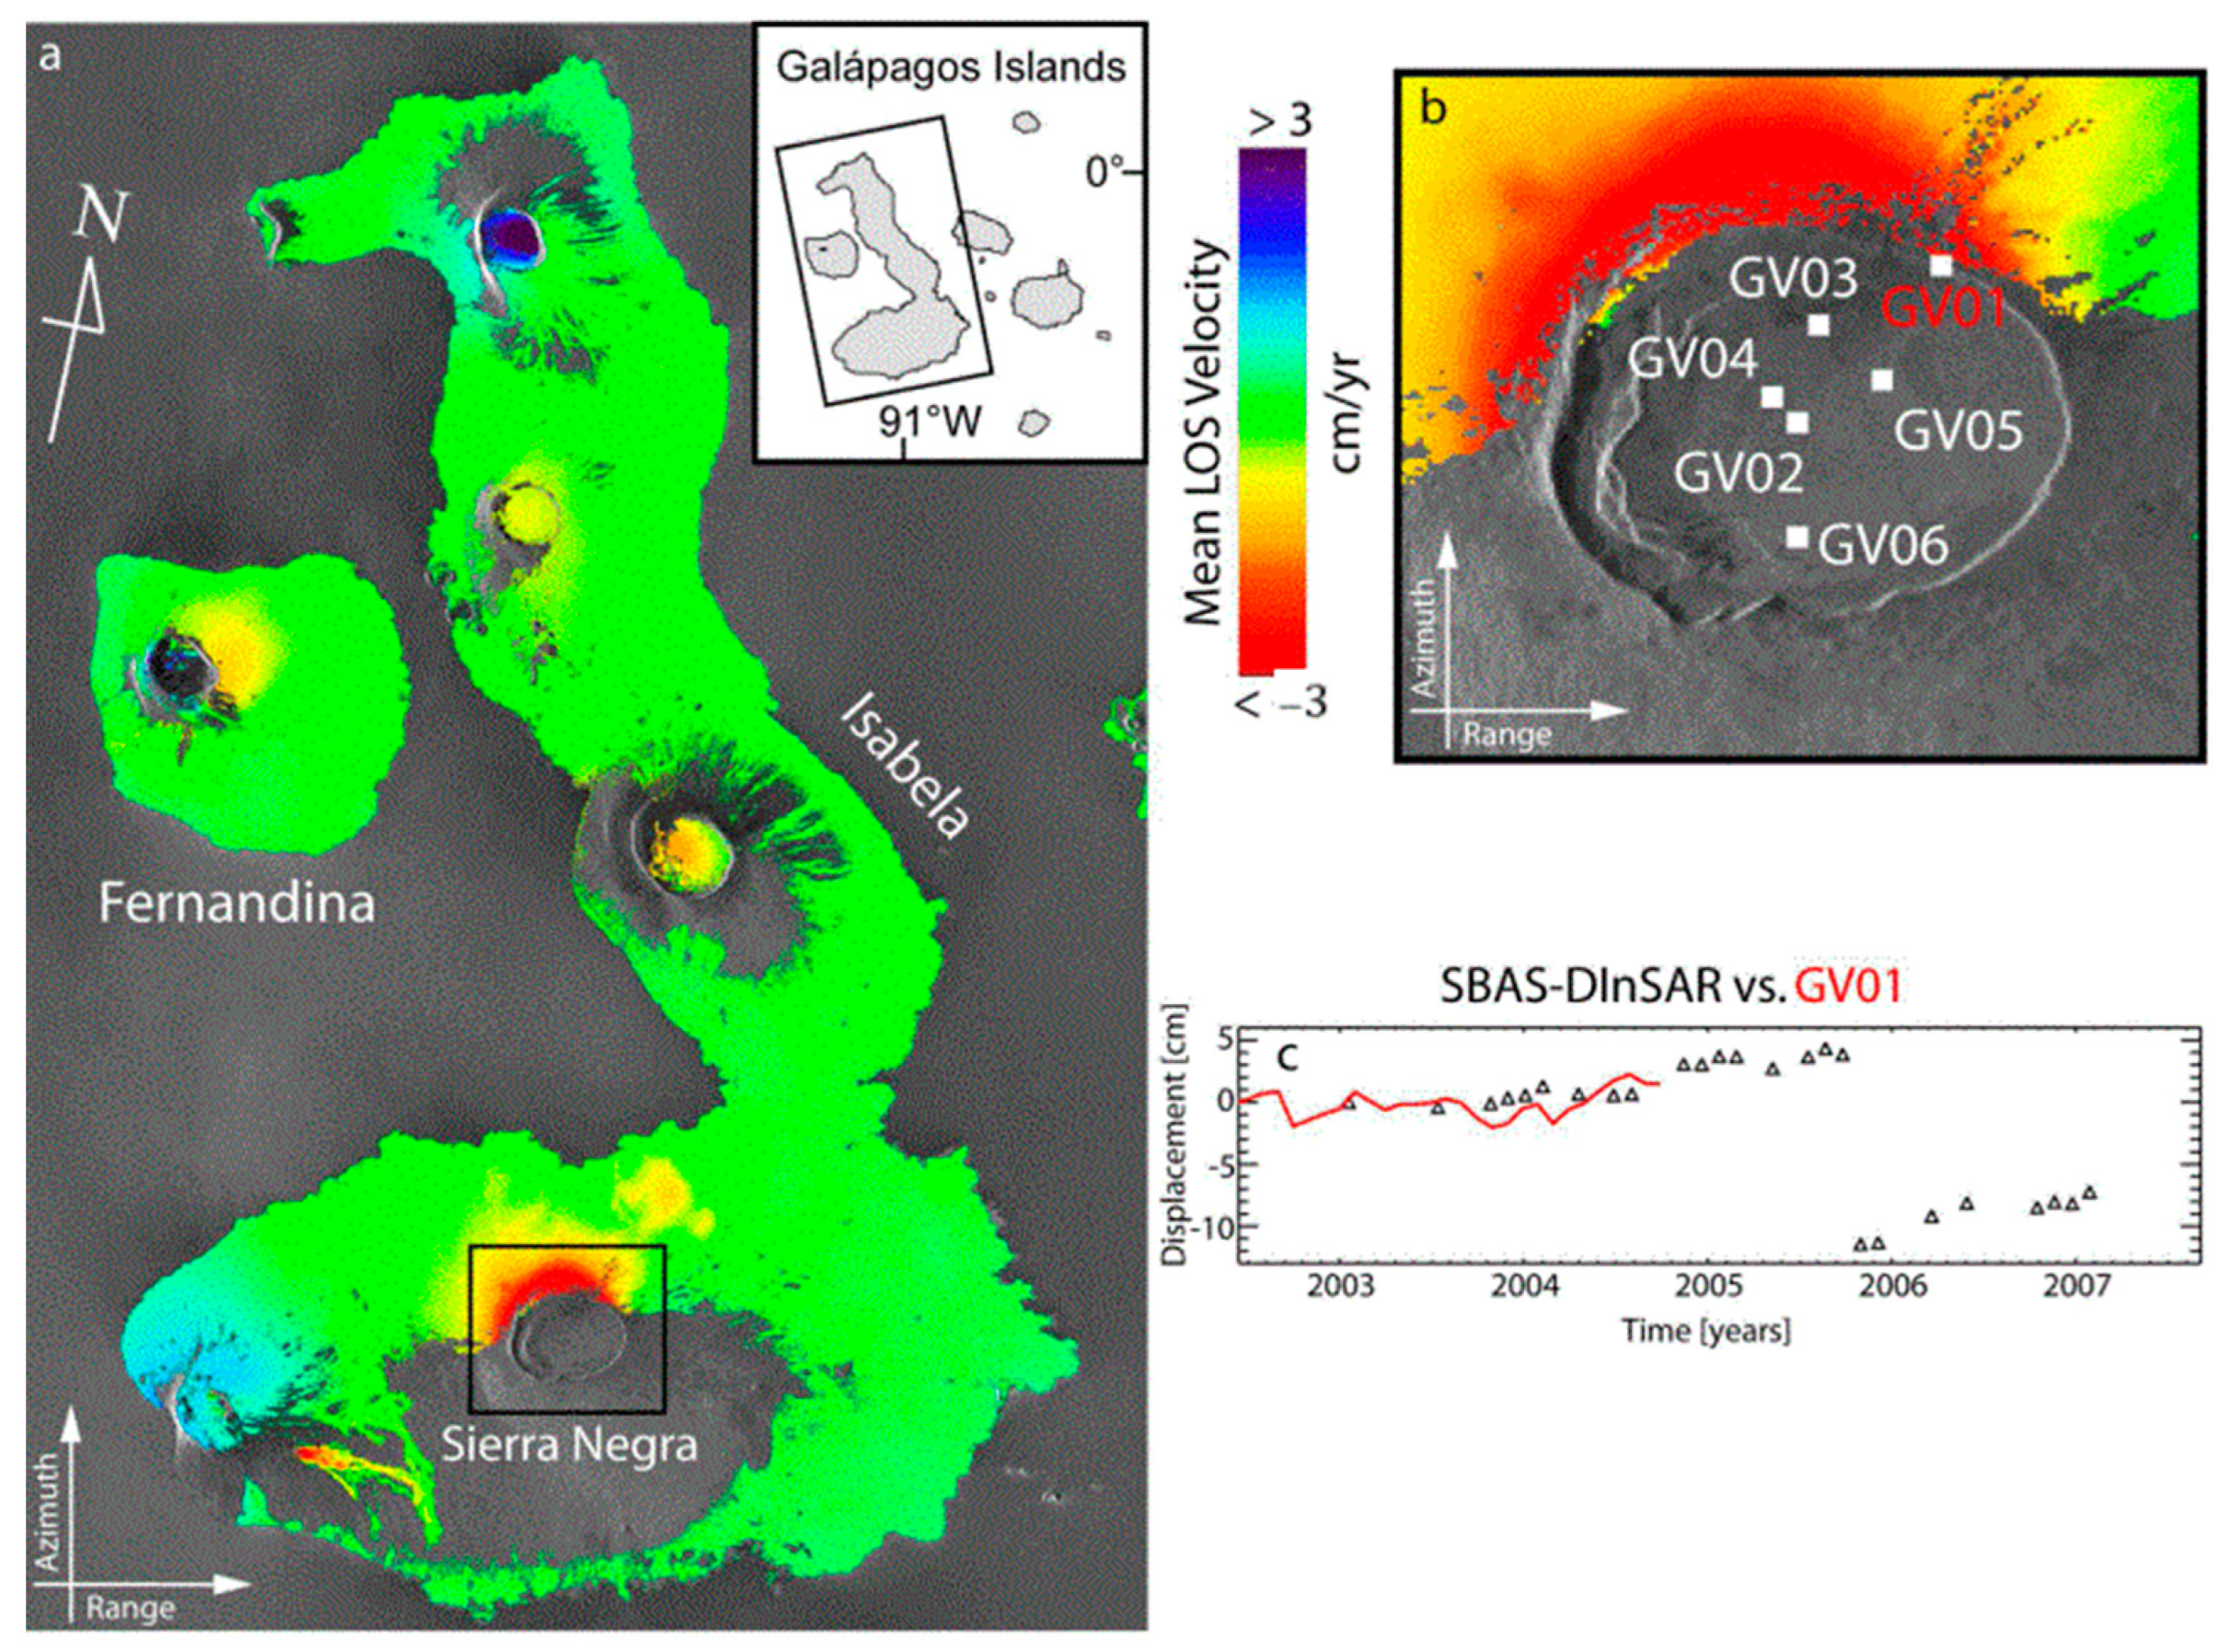
3.1.3. SBAS-InSAR
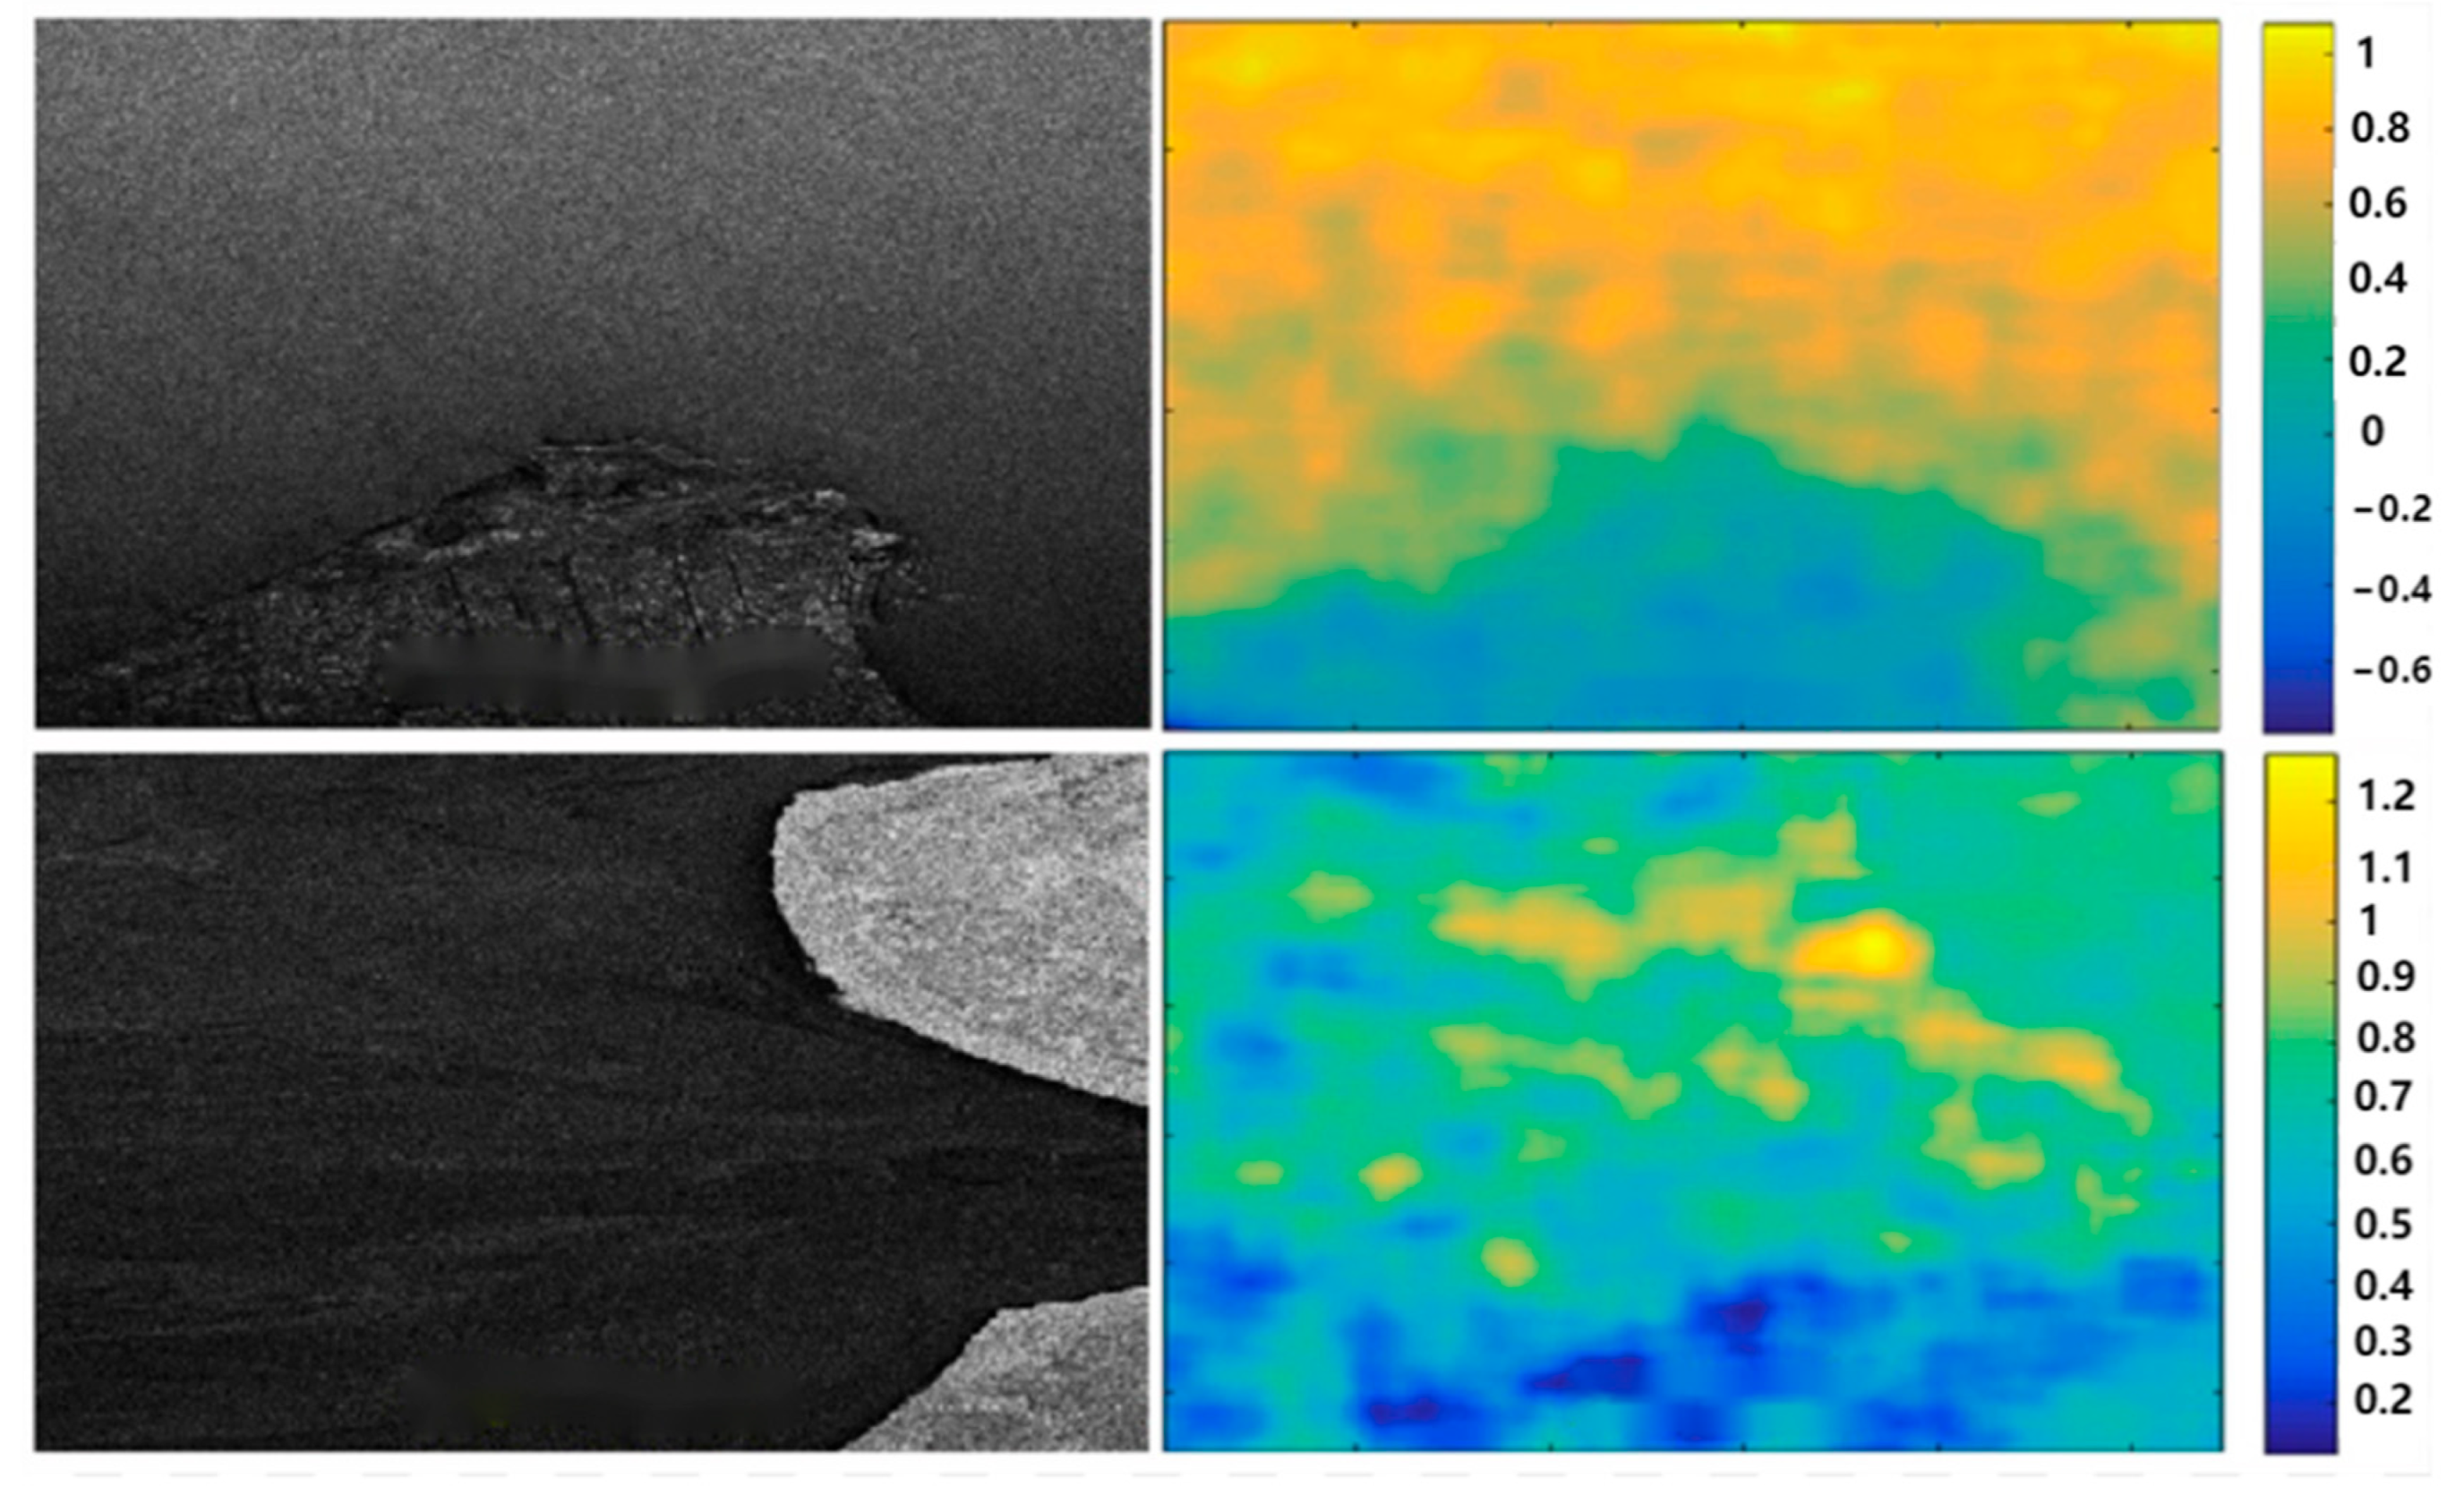
3.2. Single-Pass Interference
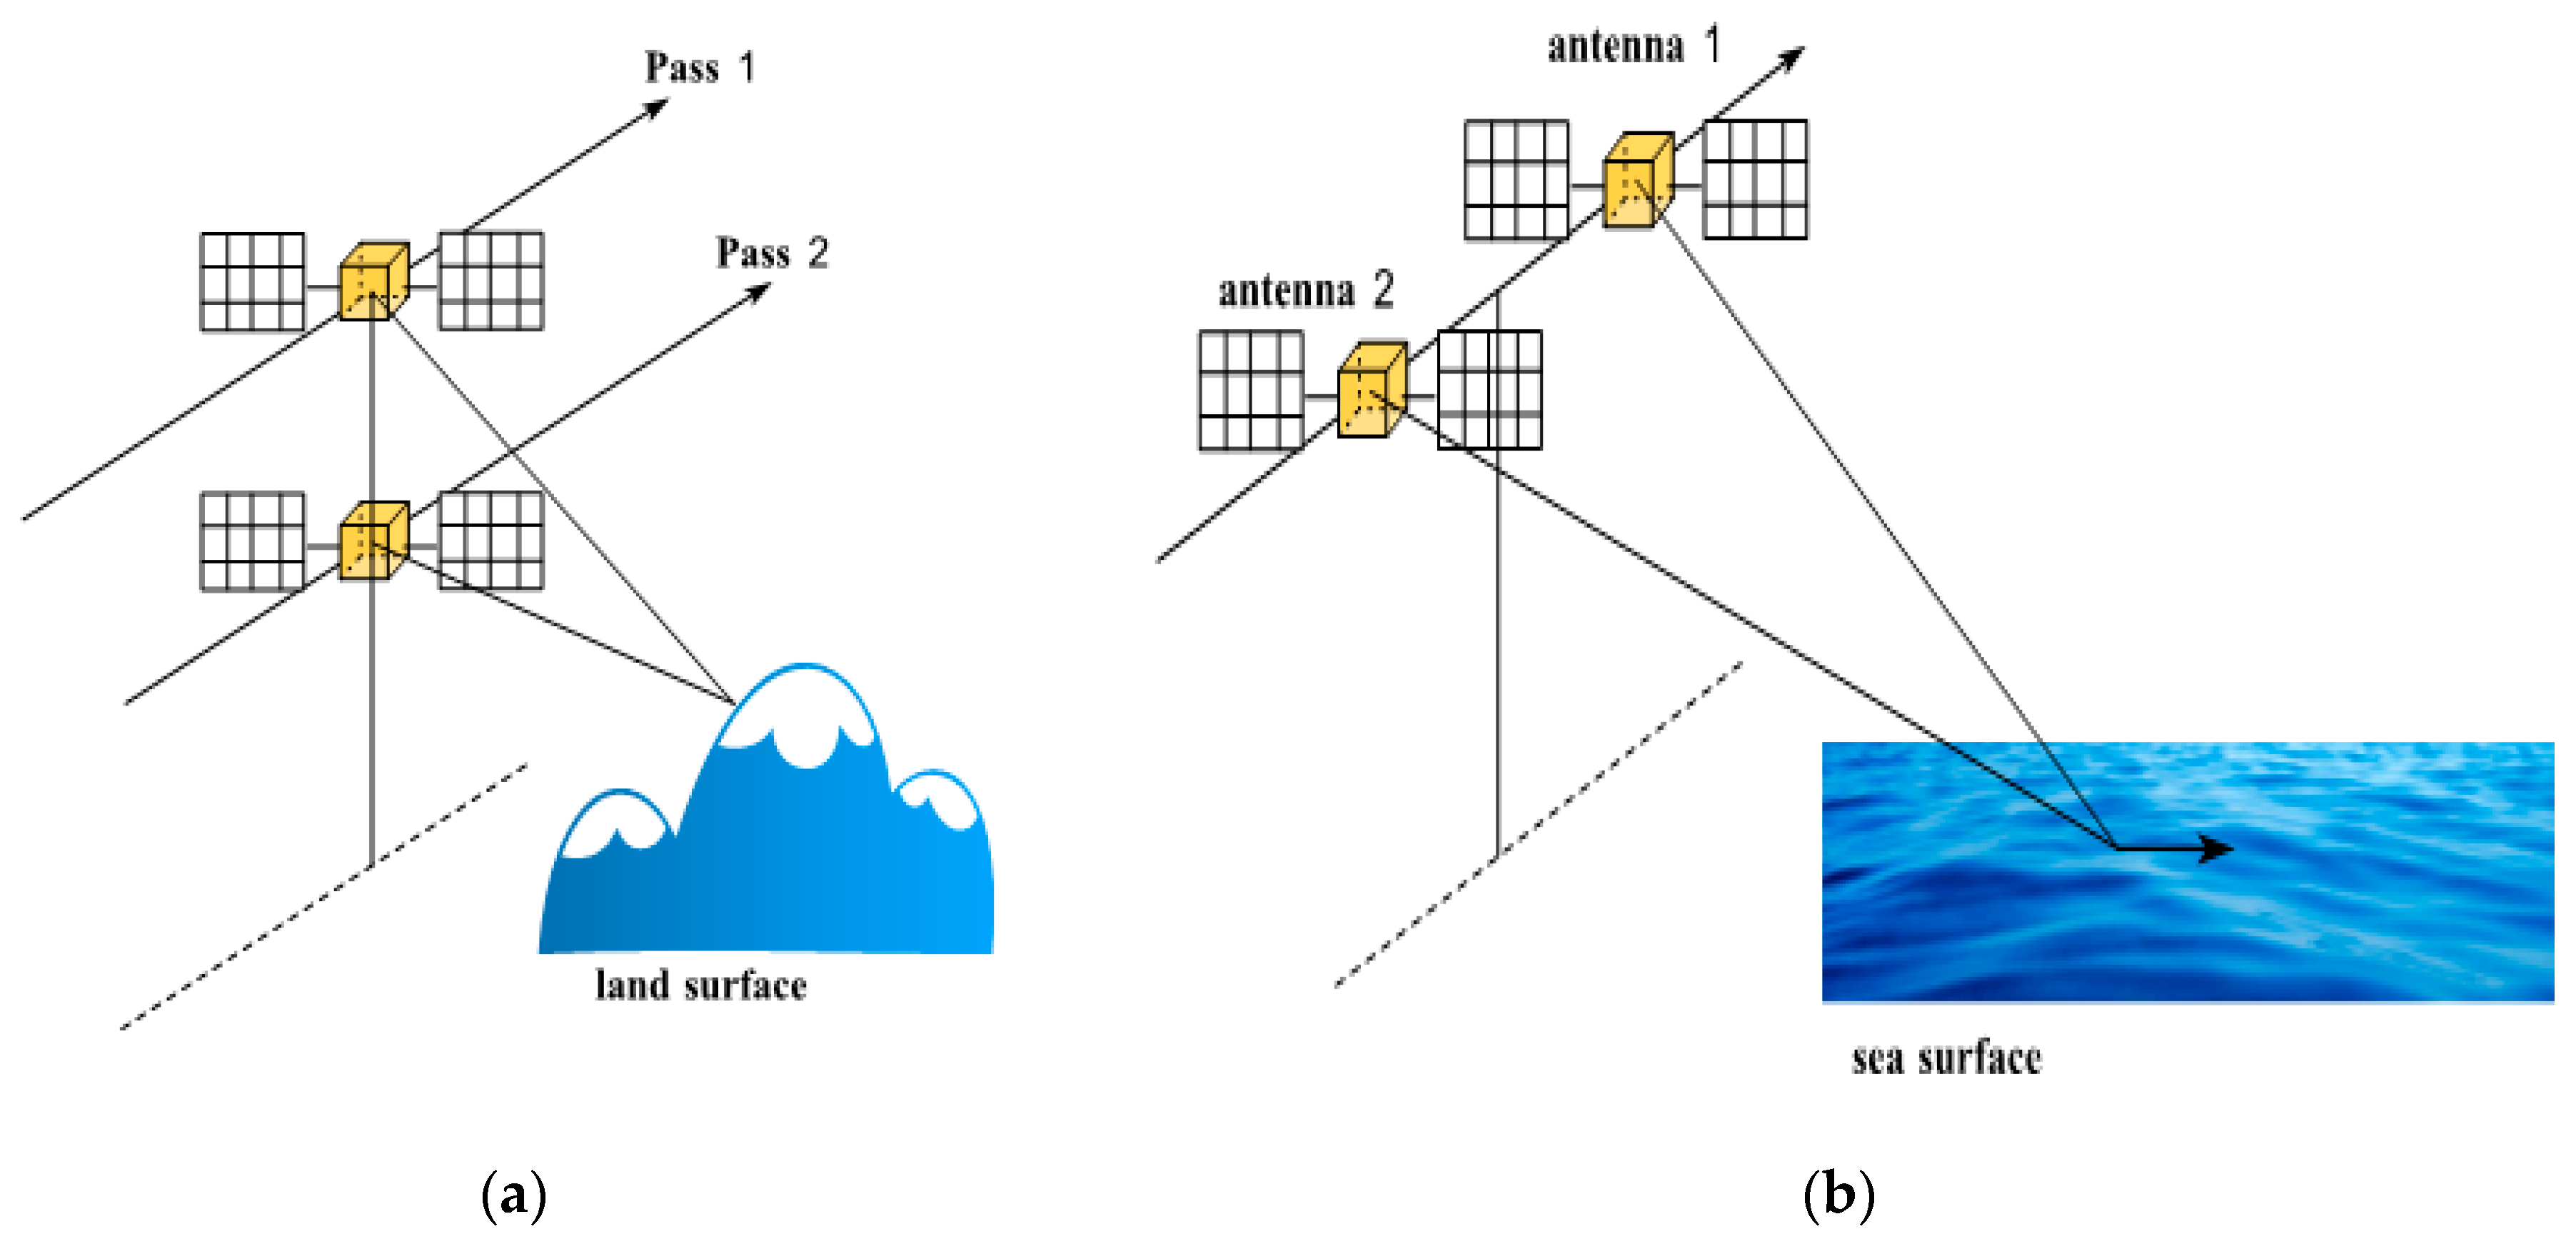
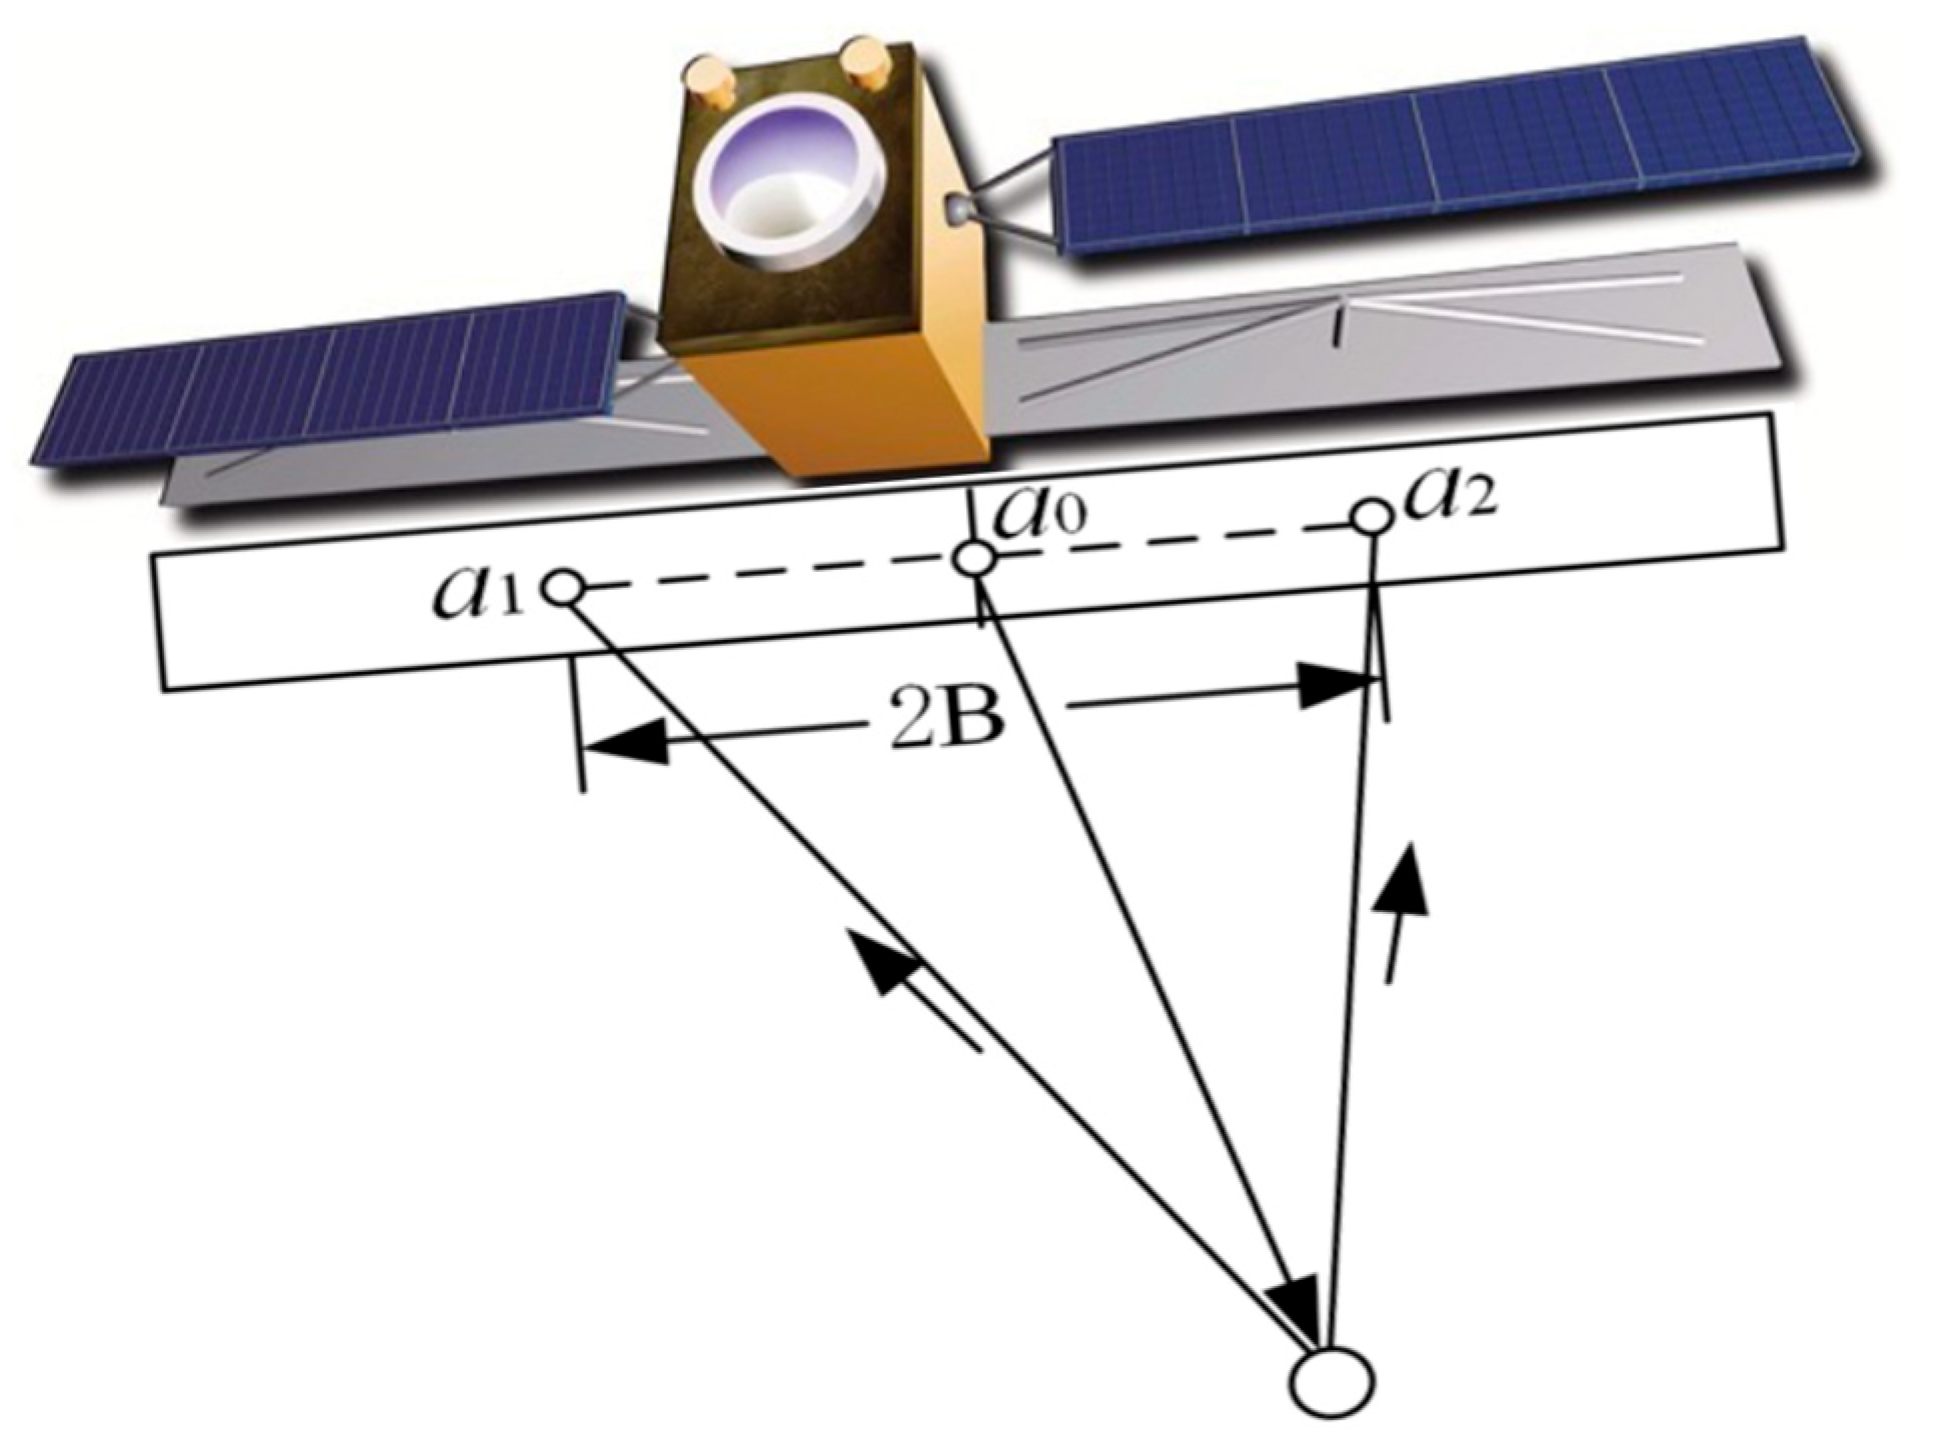
3.2.1. CT-InSAR
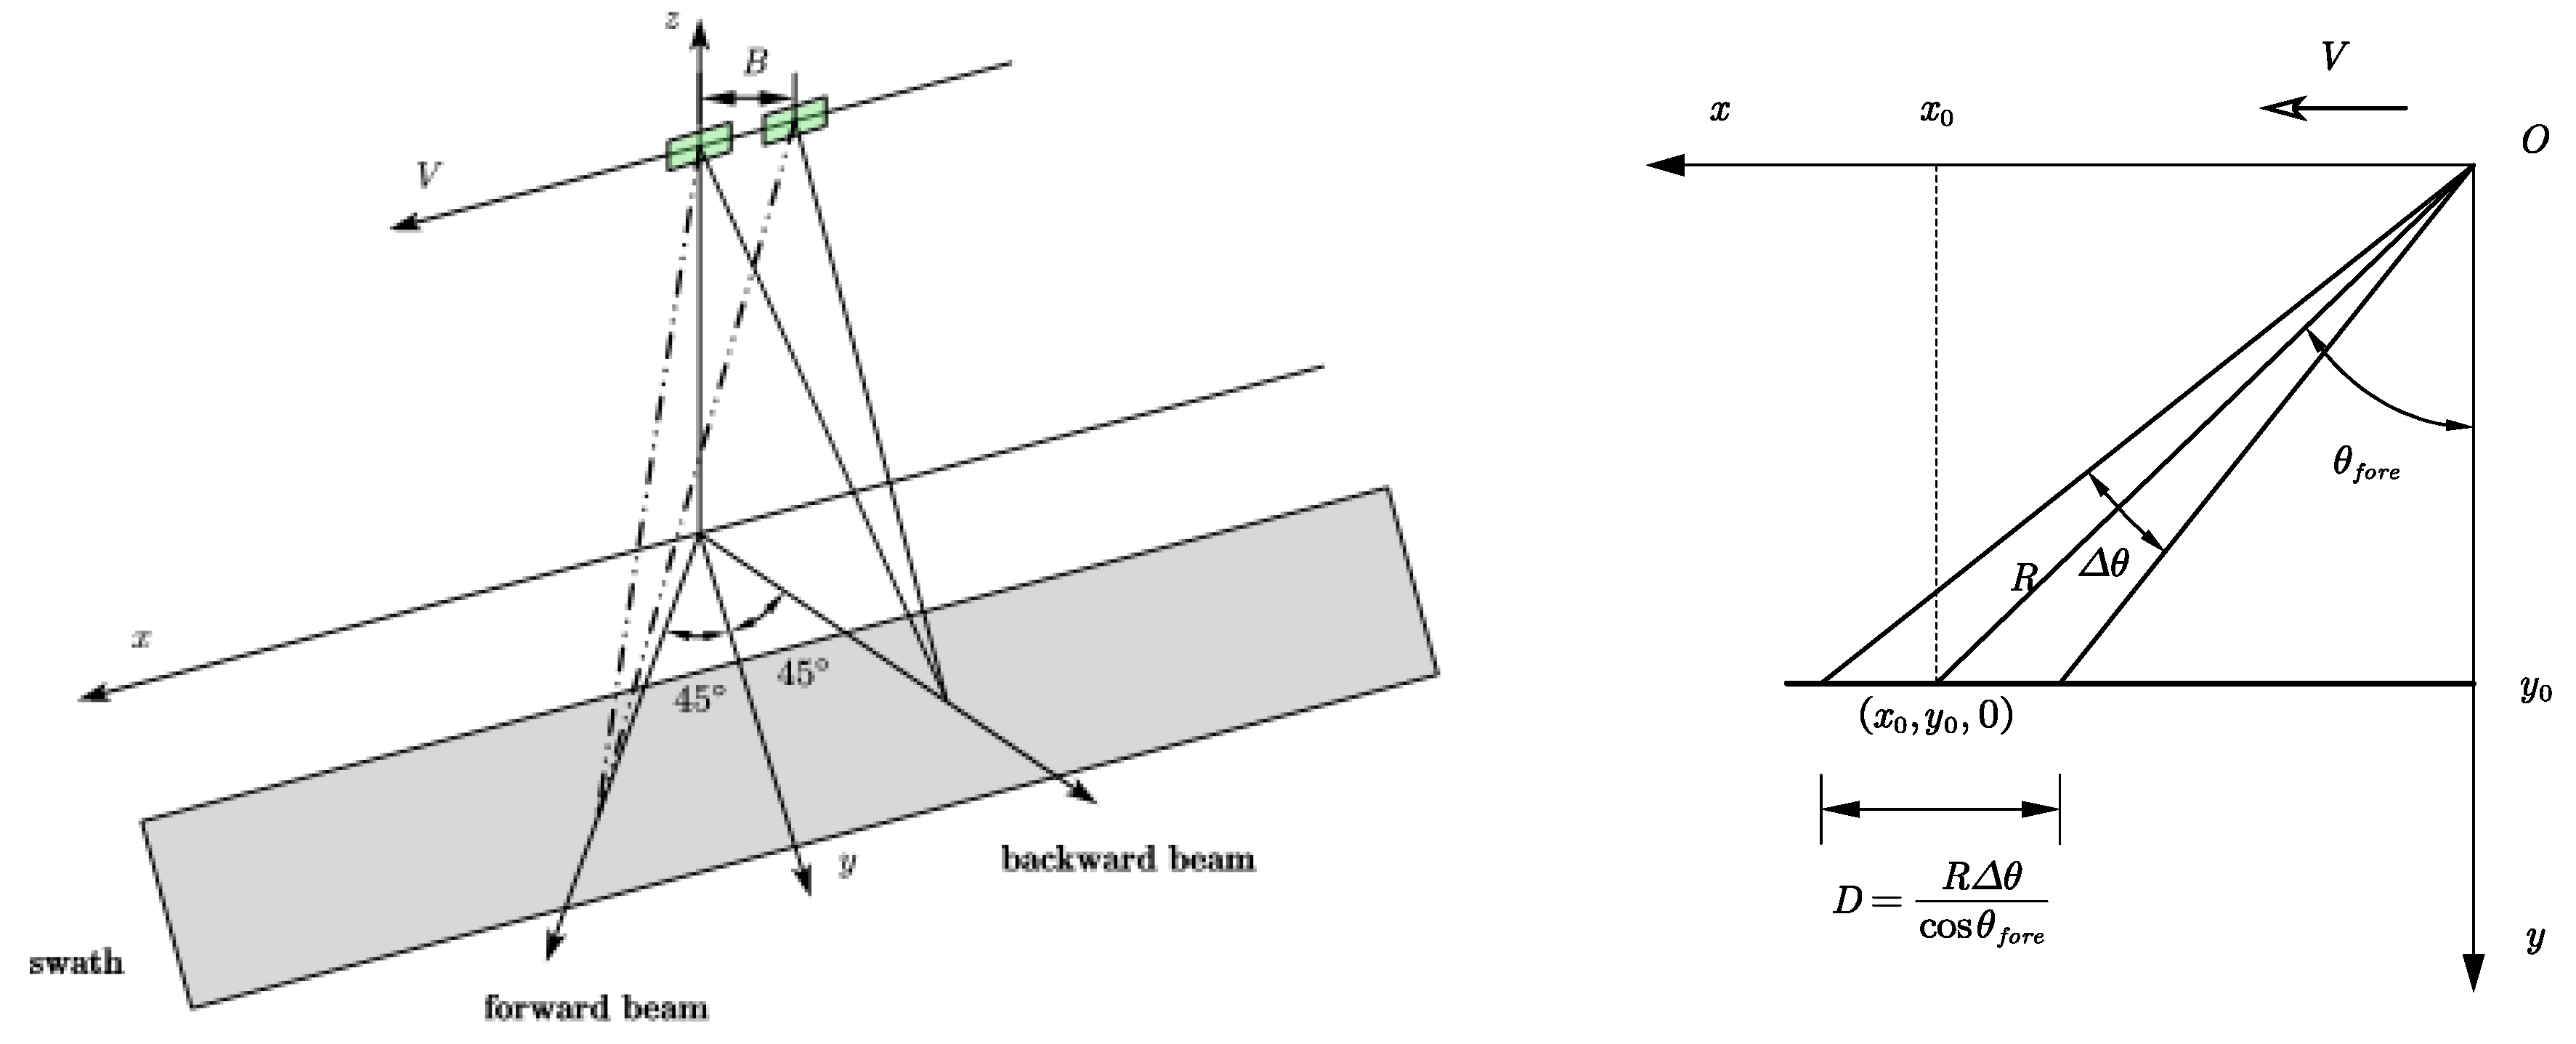
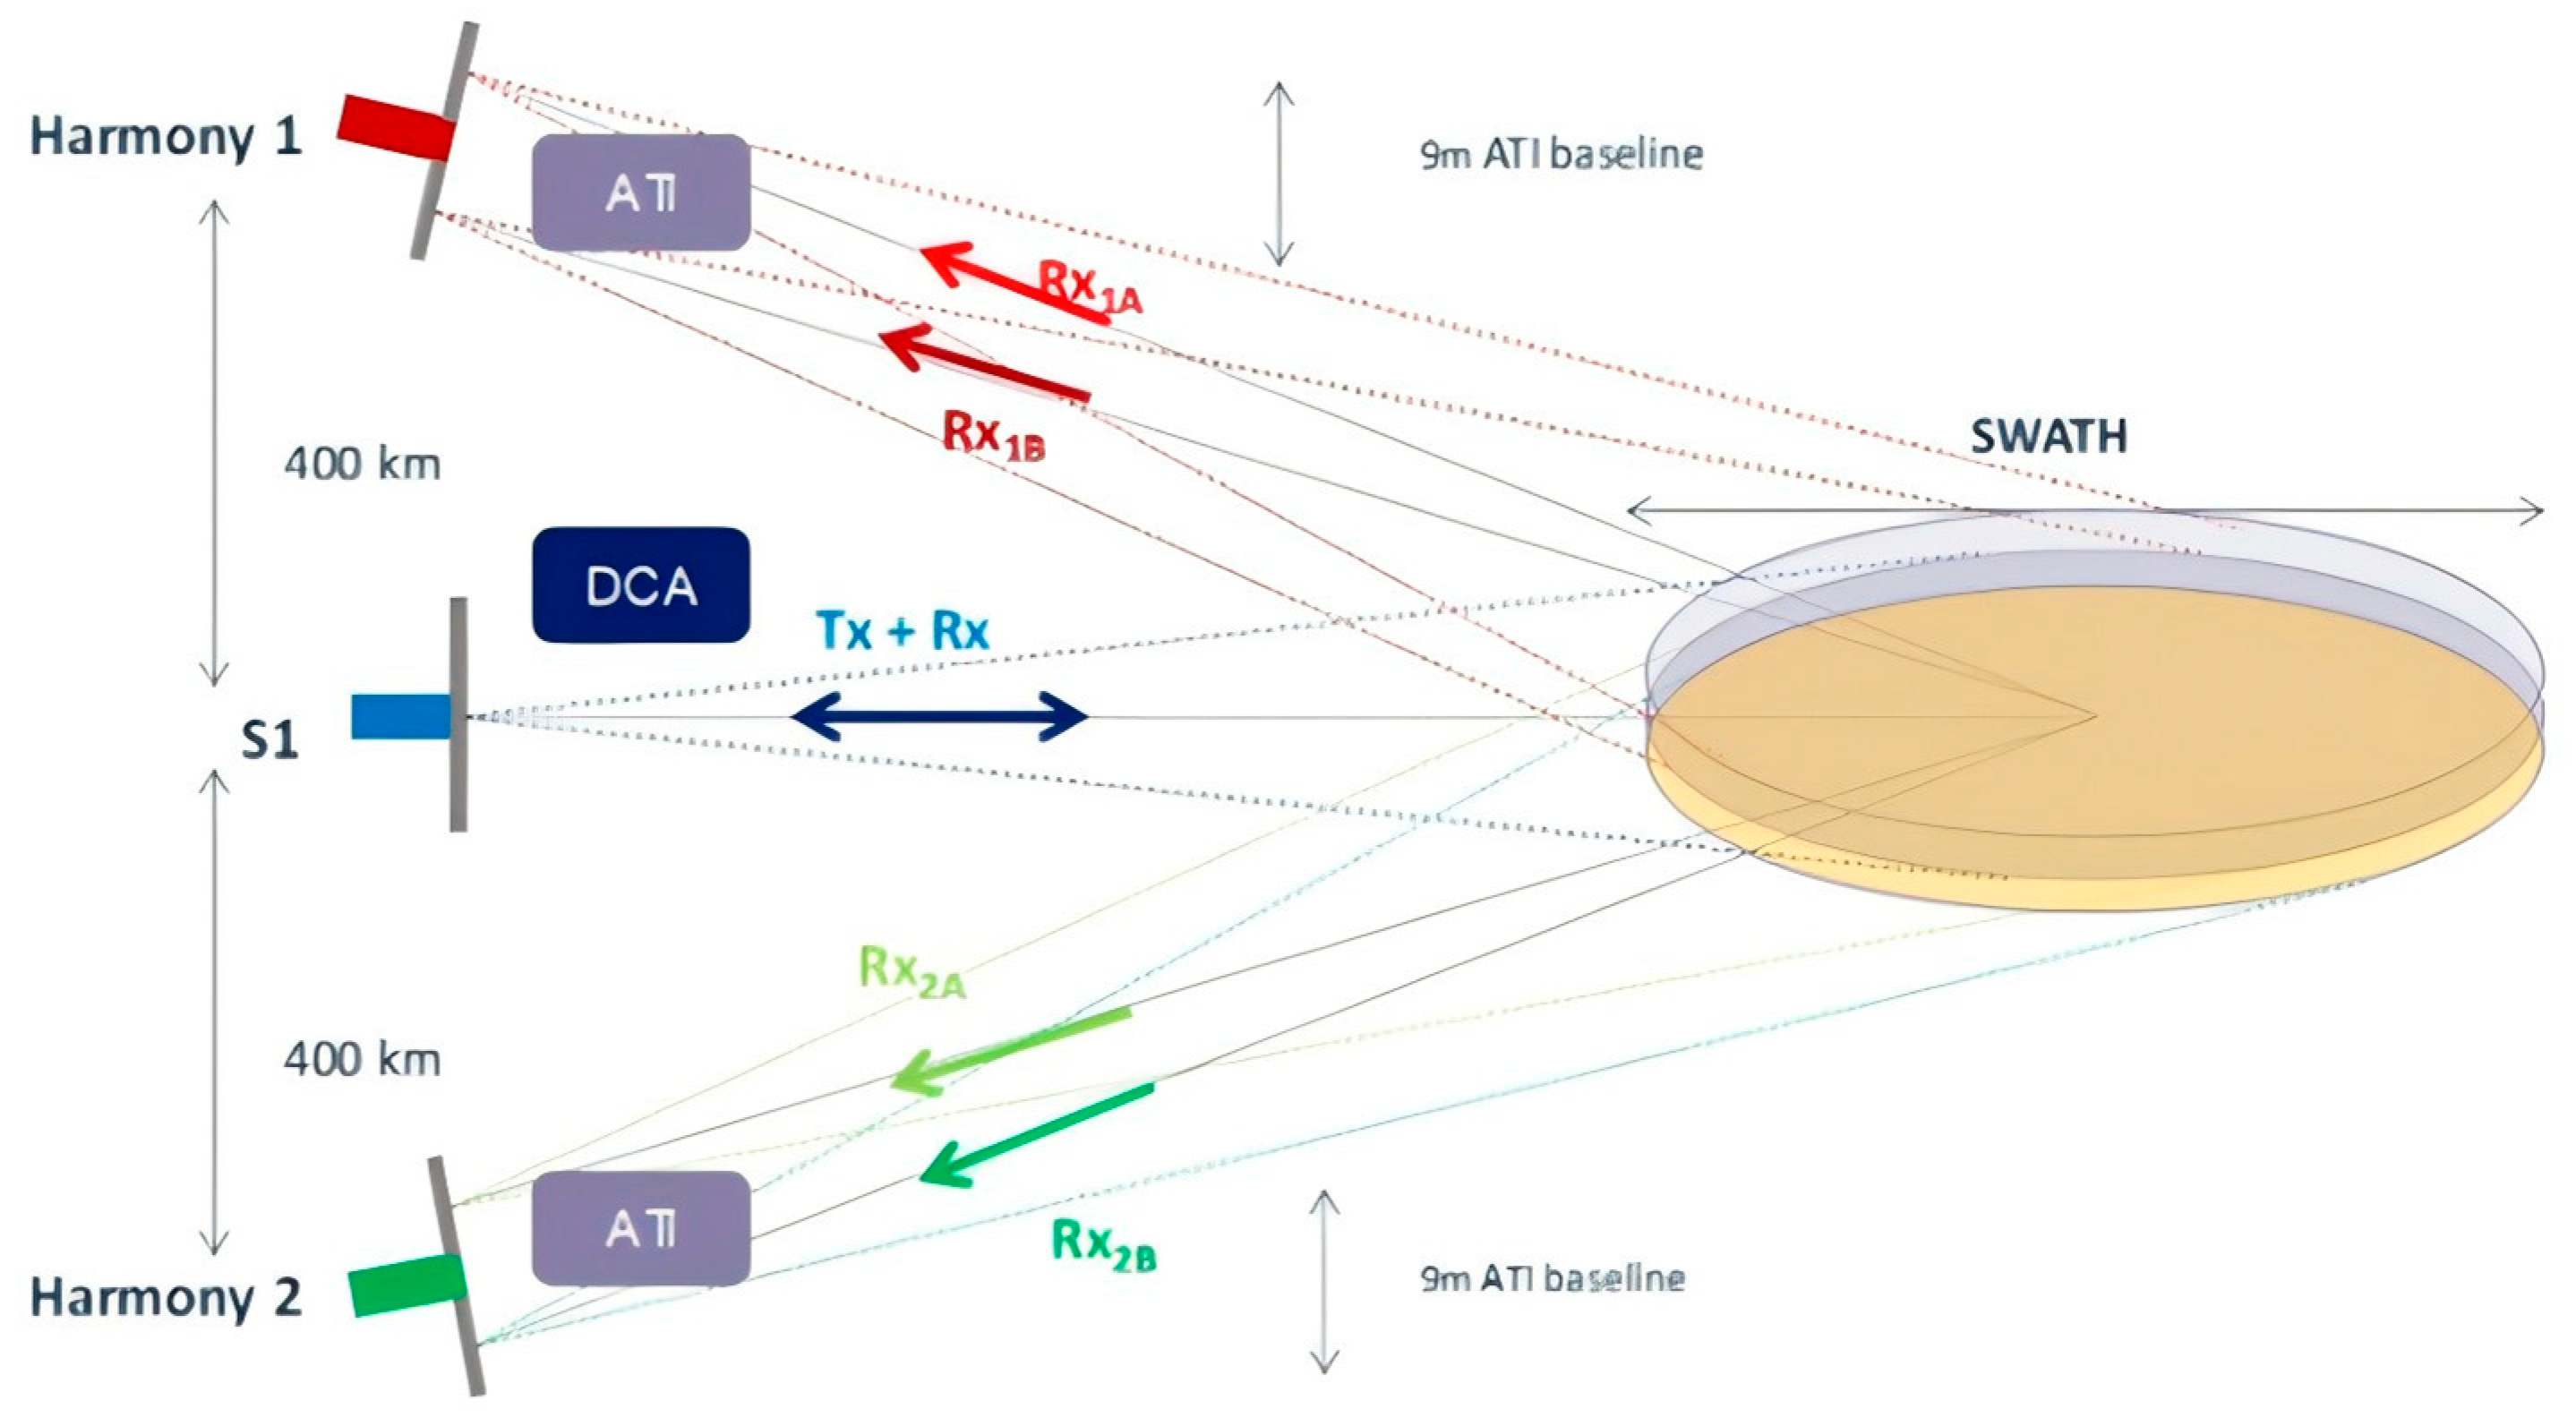
3.2.2. AT-InSAR
4. Trends and Challenges
4.1. Multidimensional
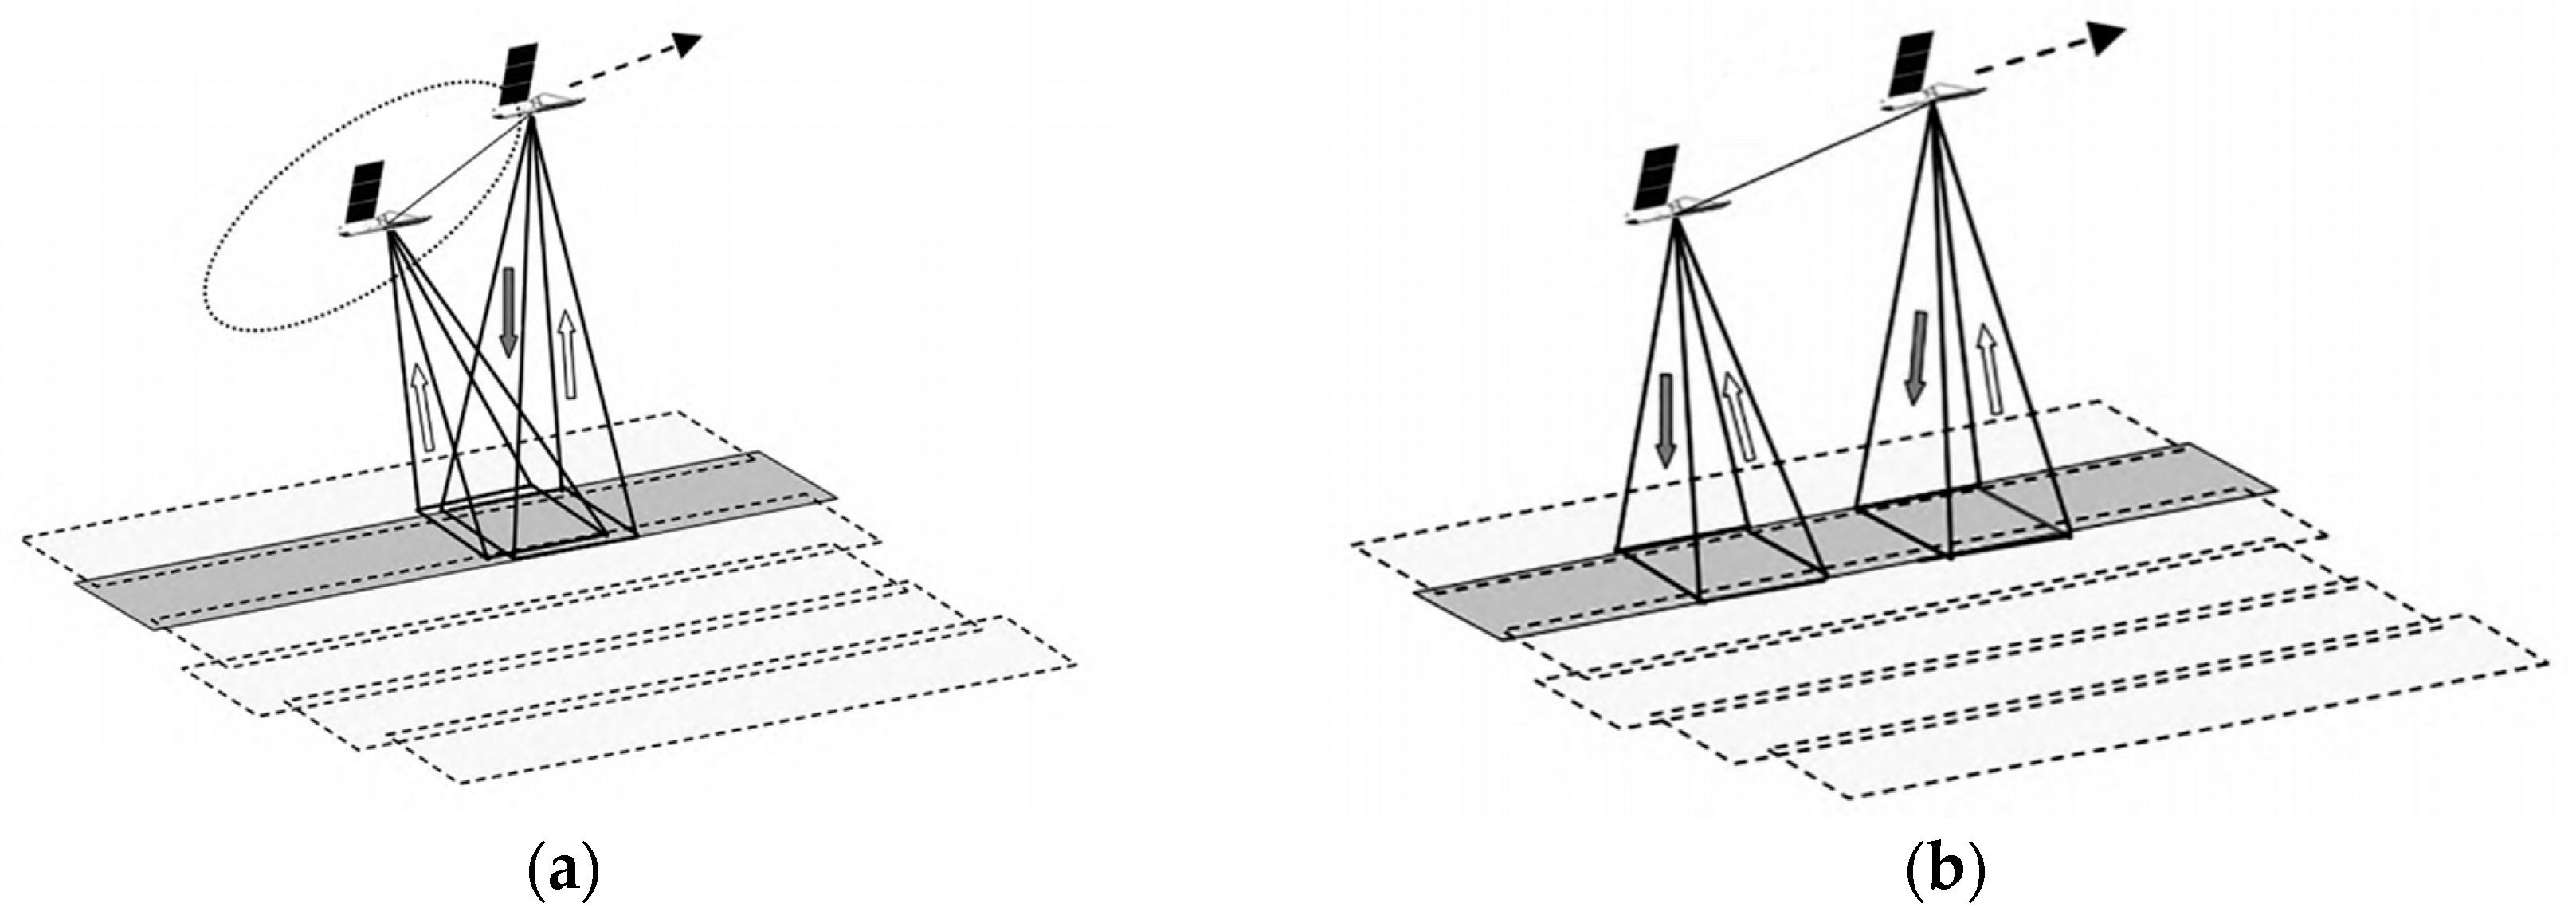
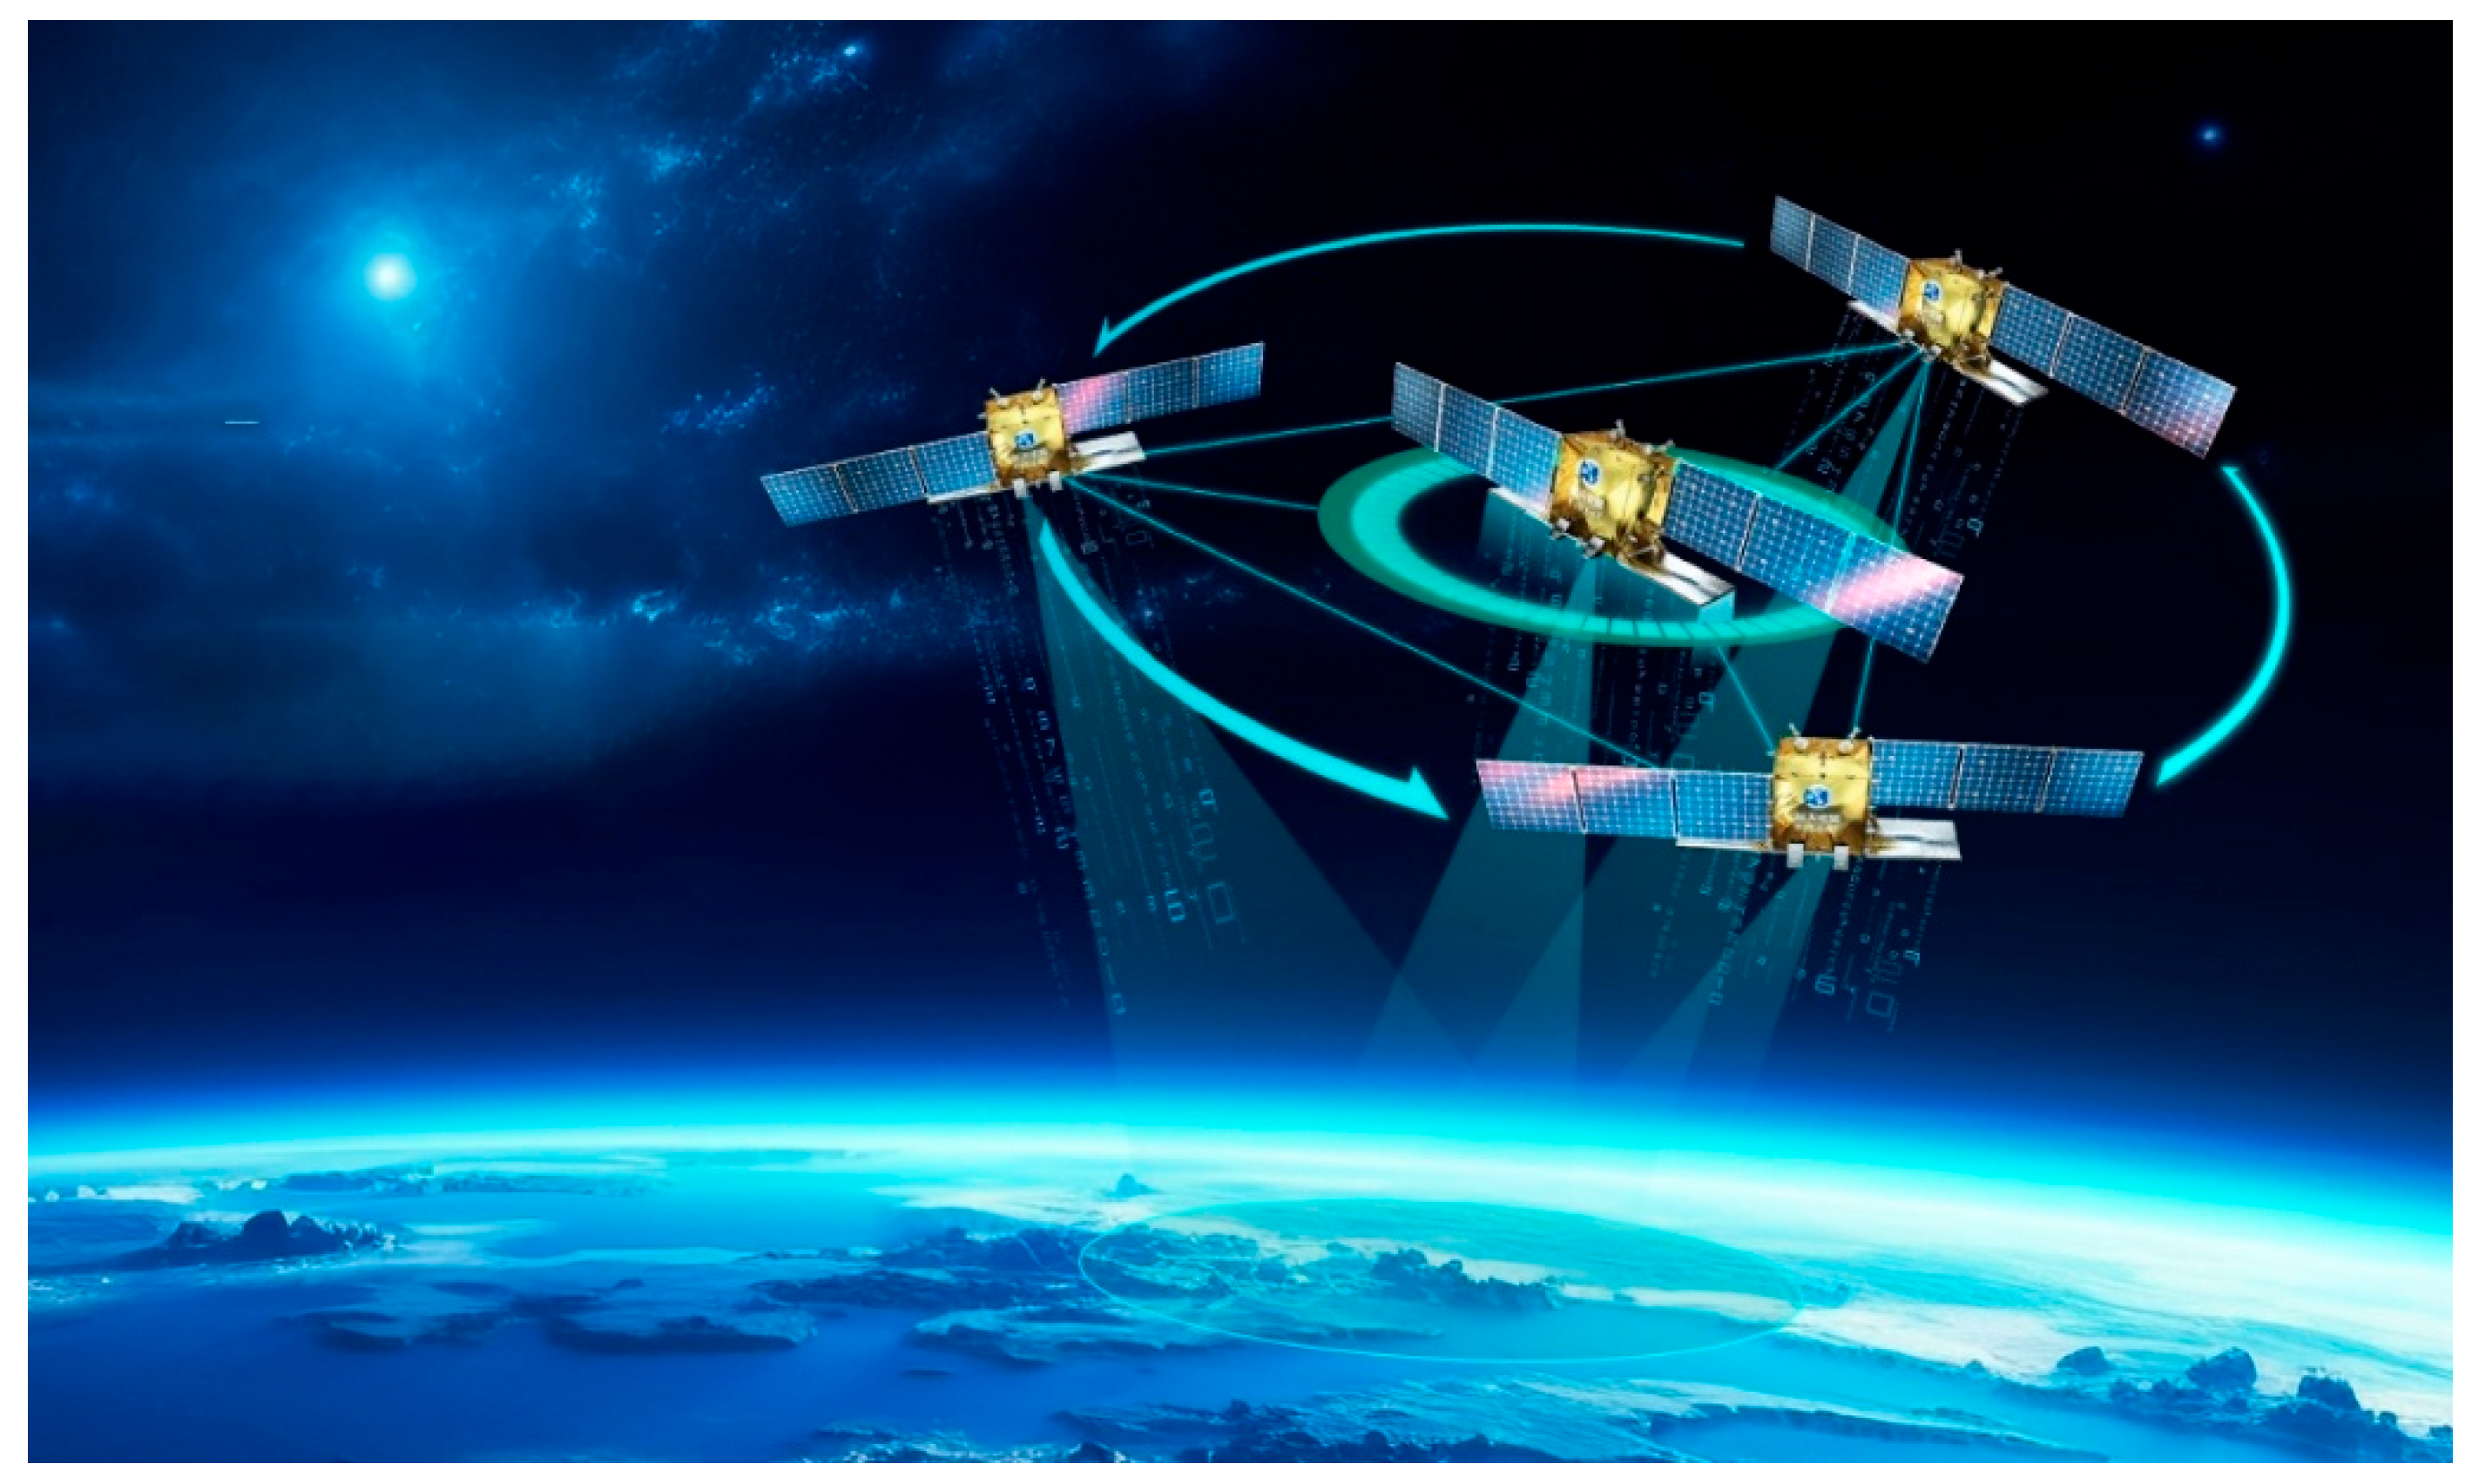
4.1.1. Multi-Satellite Networking
4.1.2. Multiband
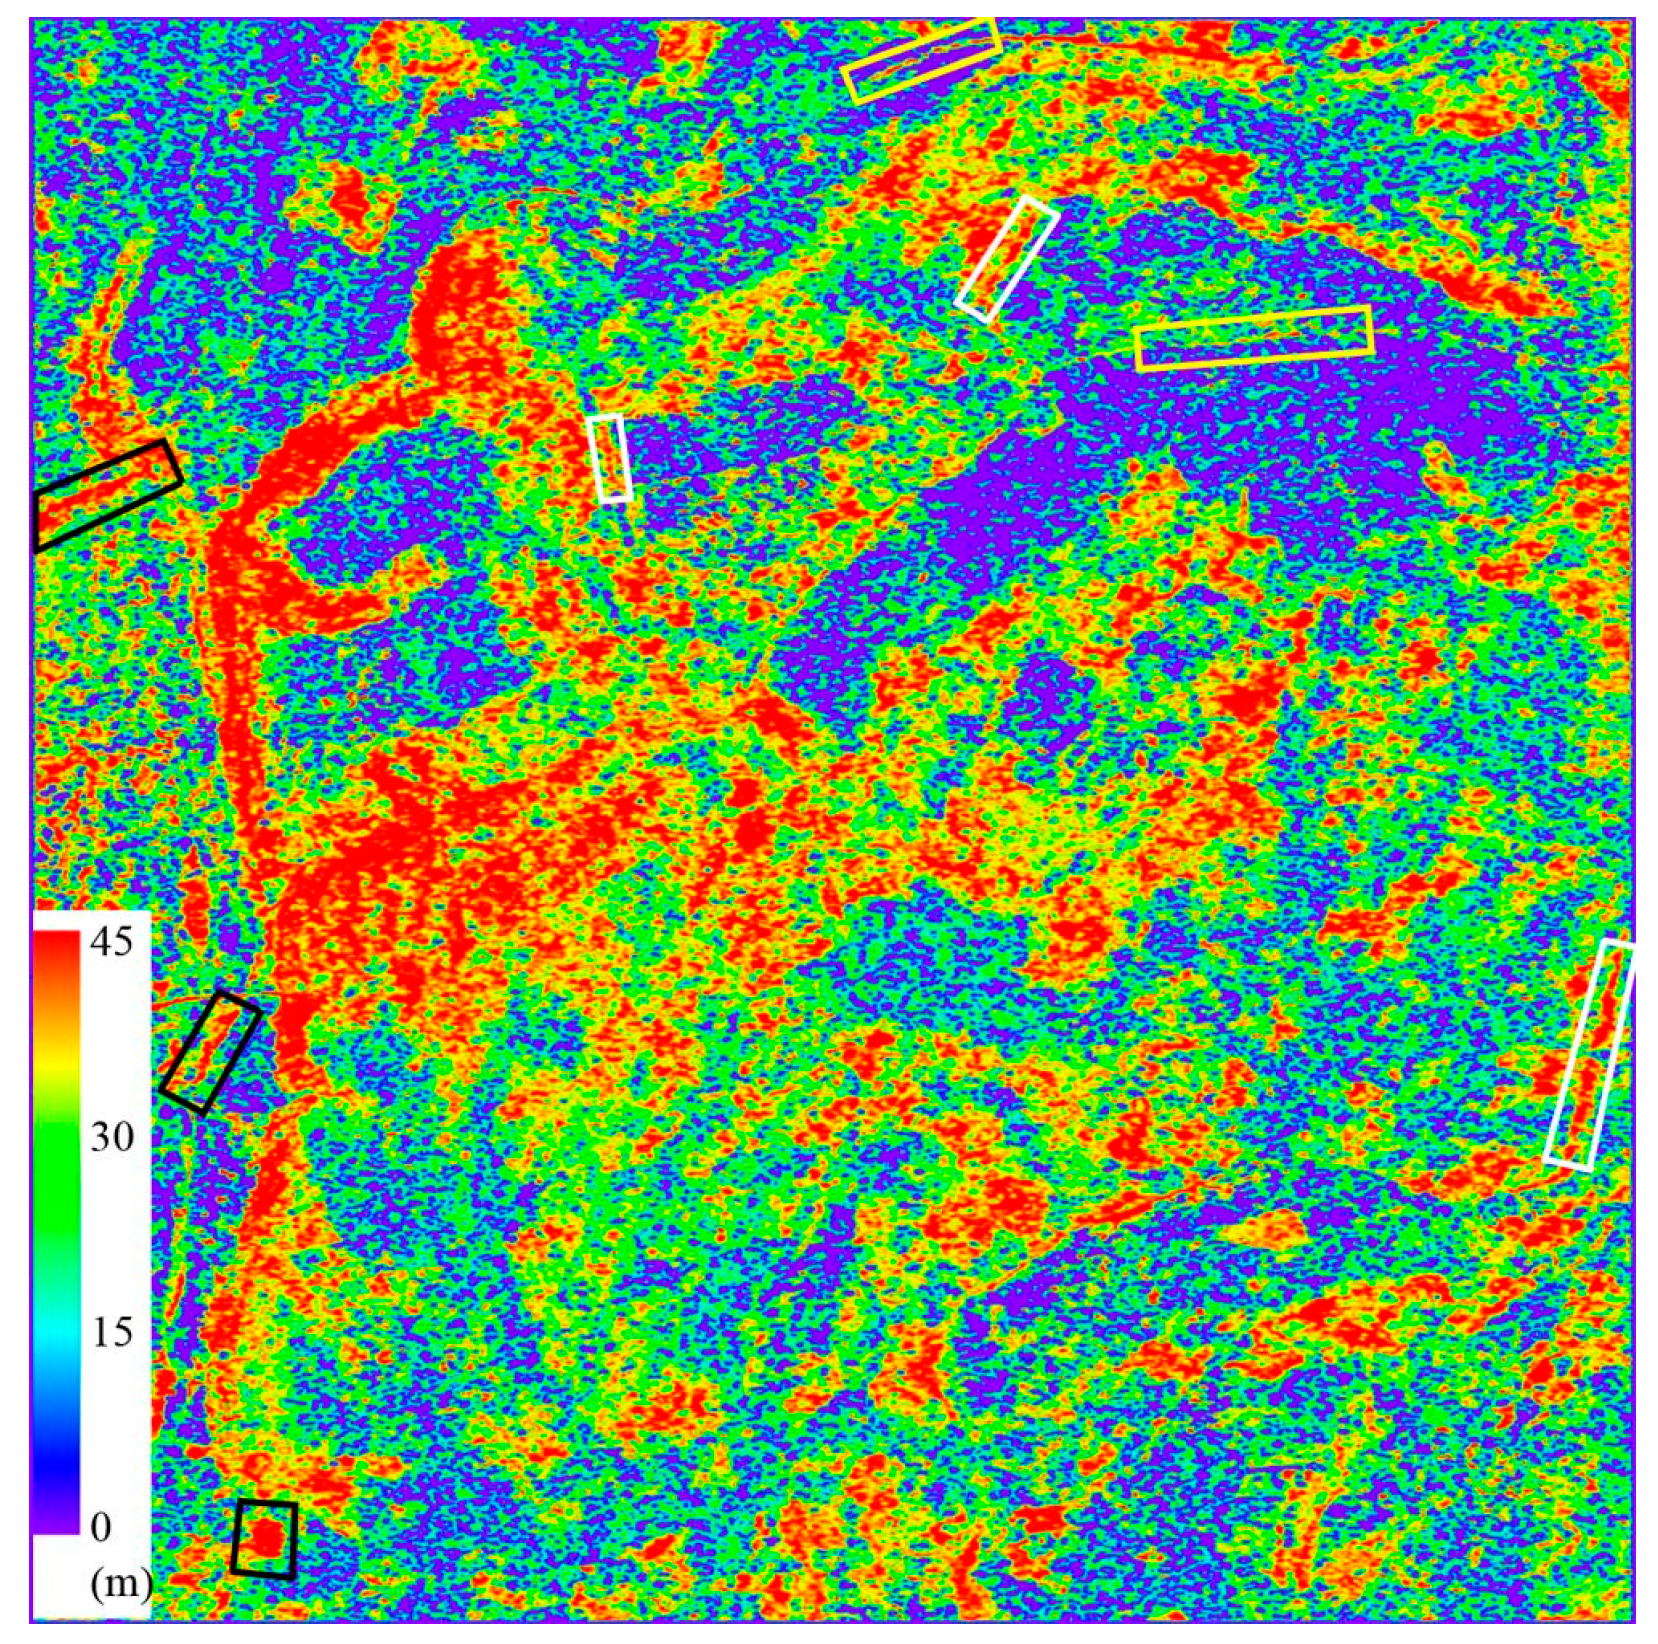
4.1.3. Multi-Baseline
4.1.4. Multipolarity
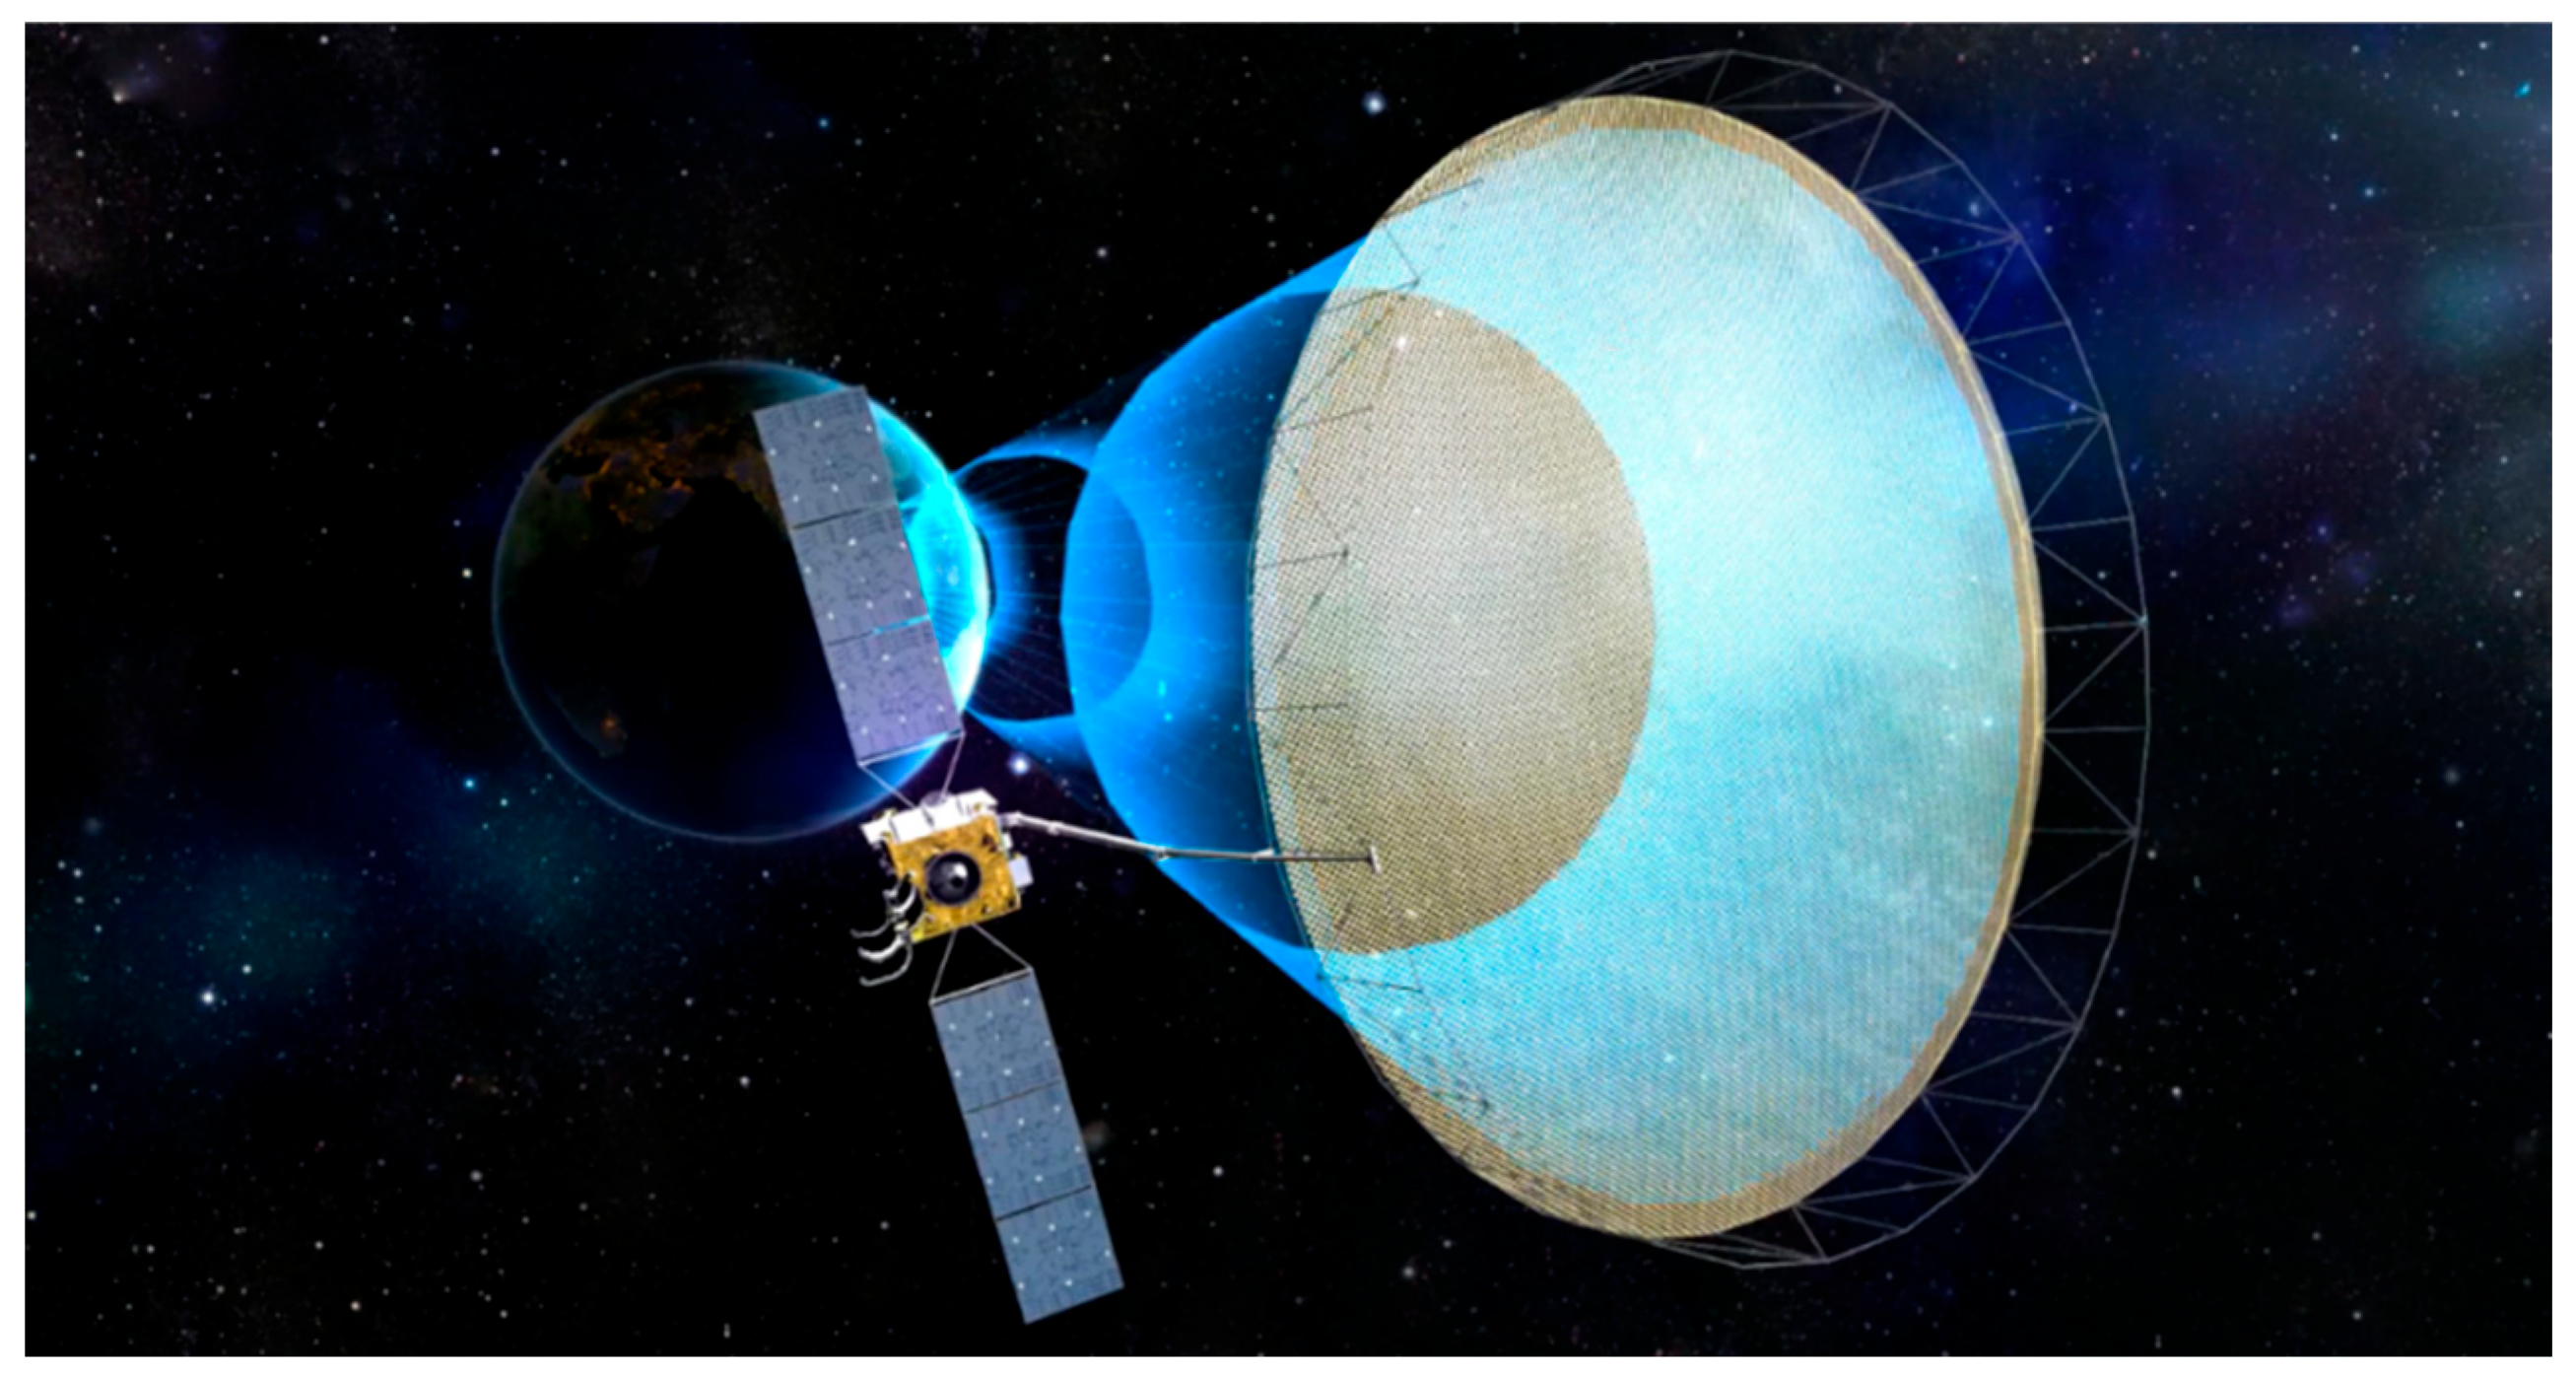
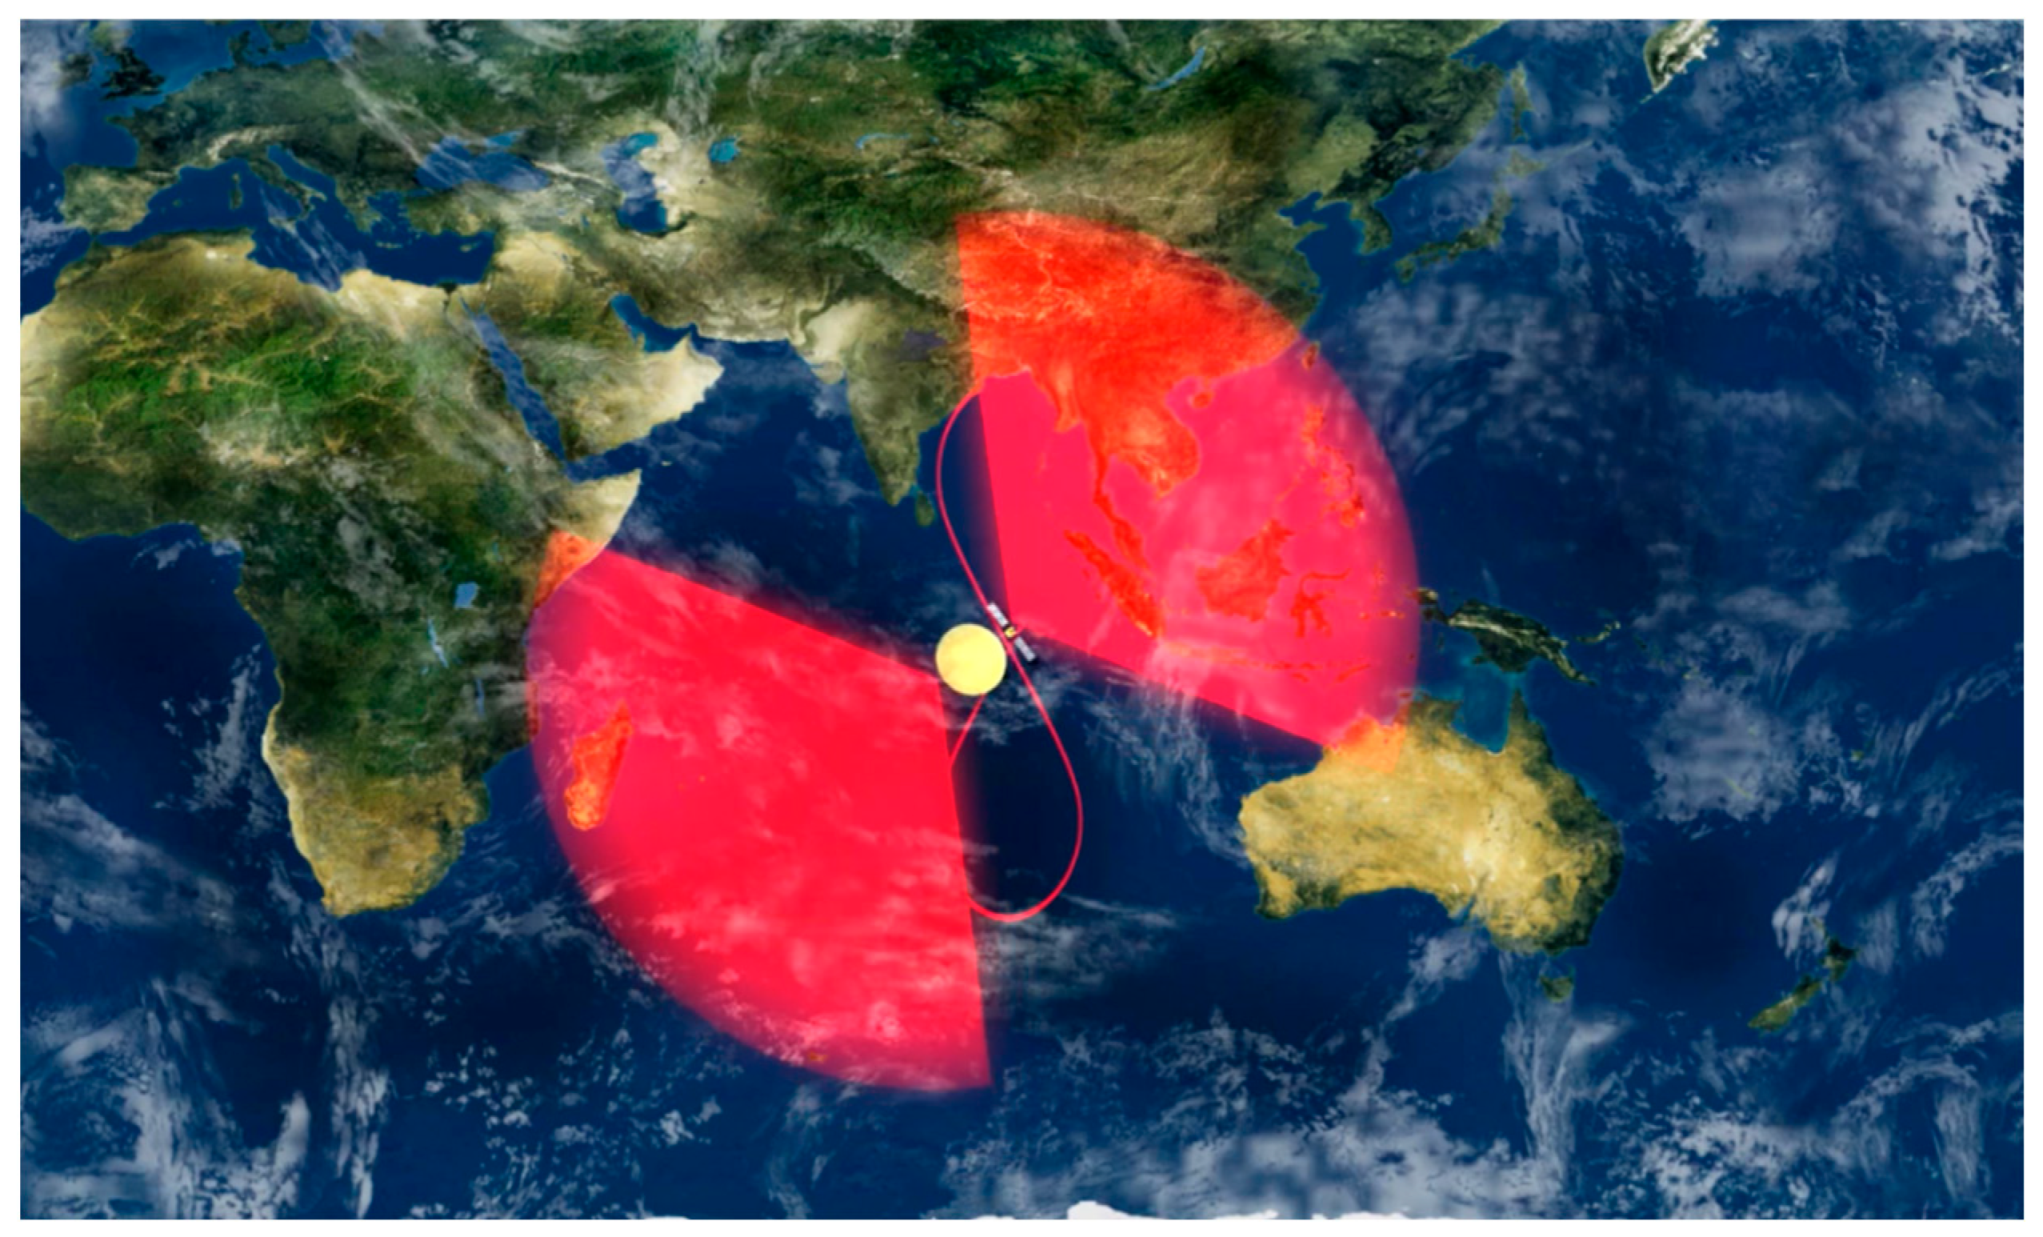
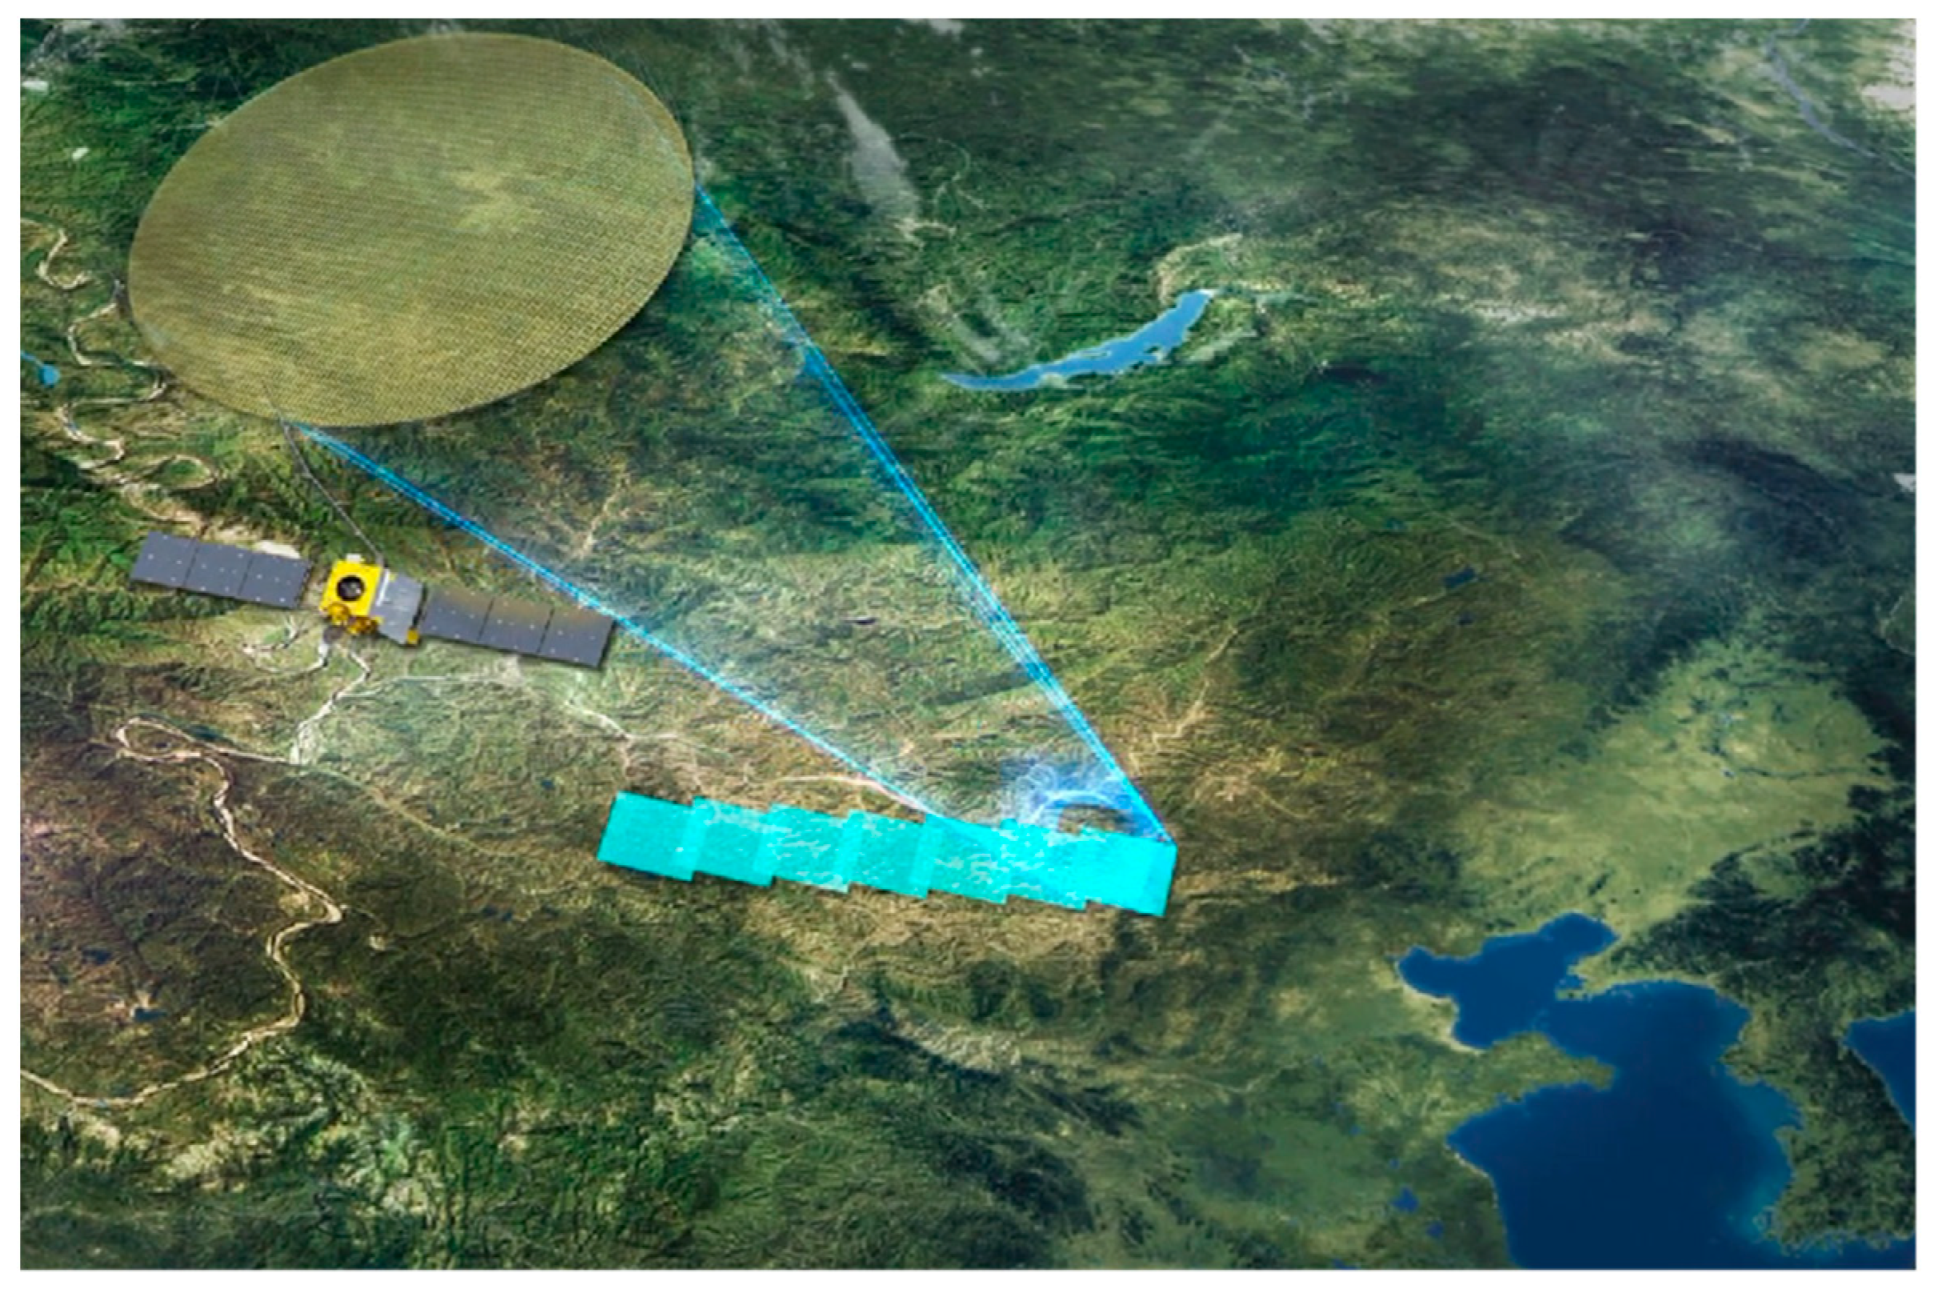
4.2. Geosynchronous Orbit
4.3. Low-Earth Orbit
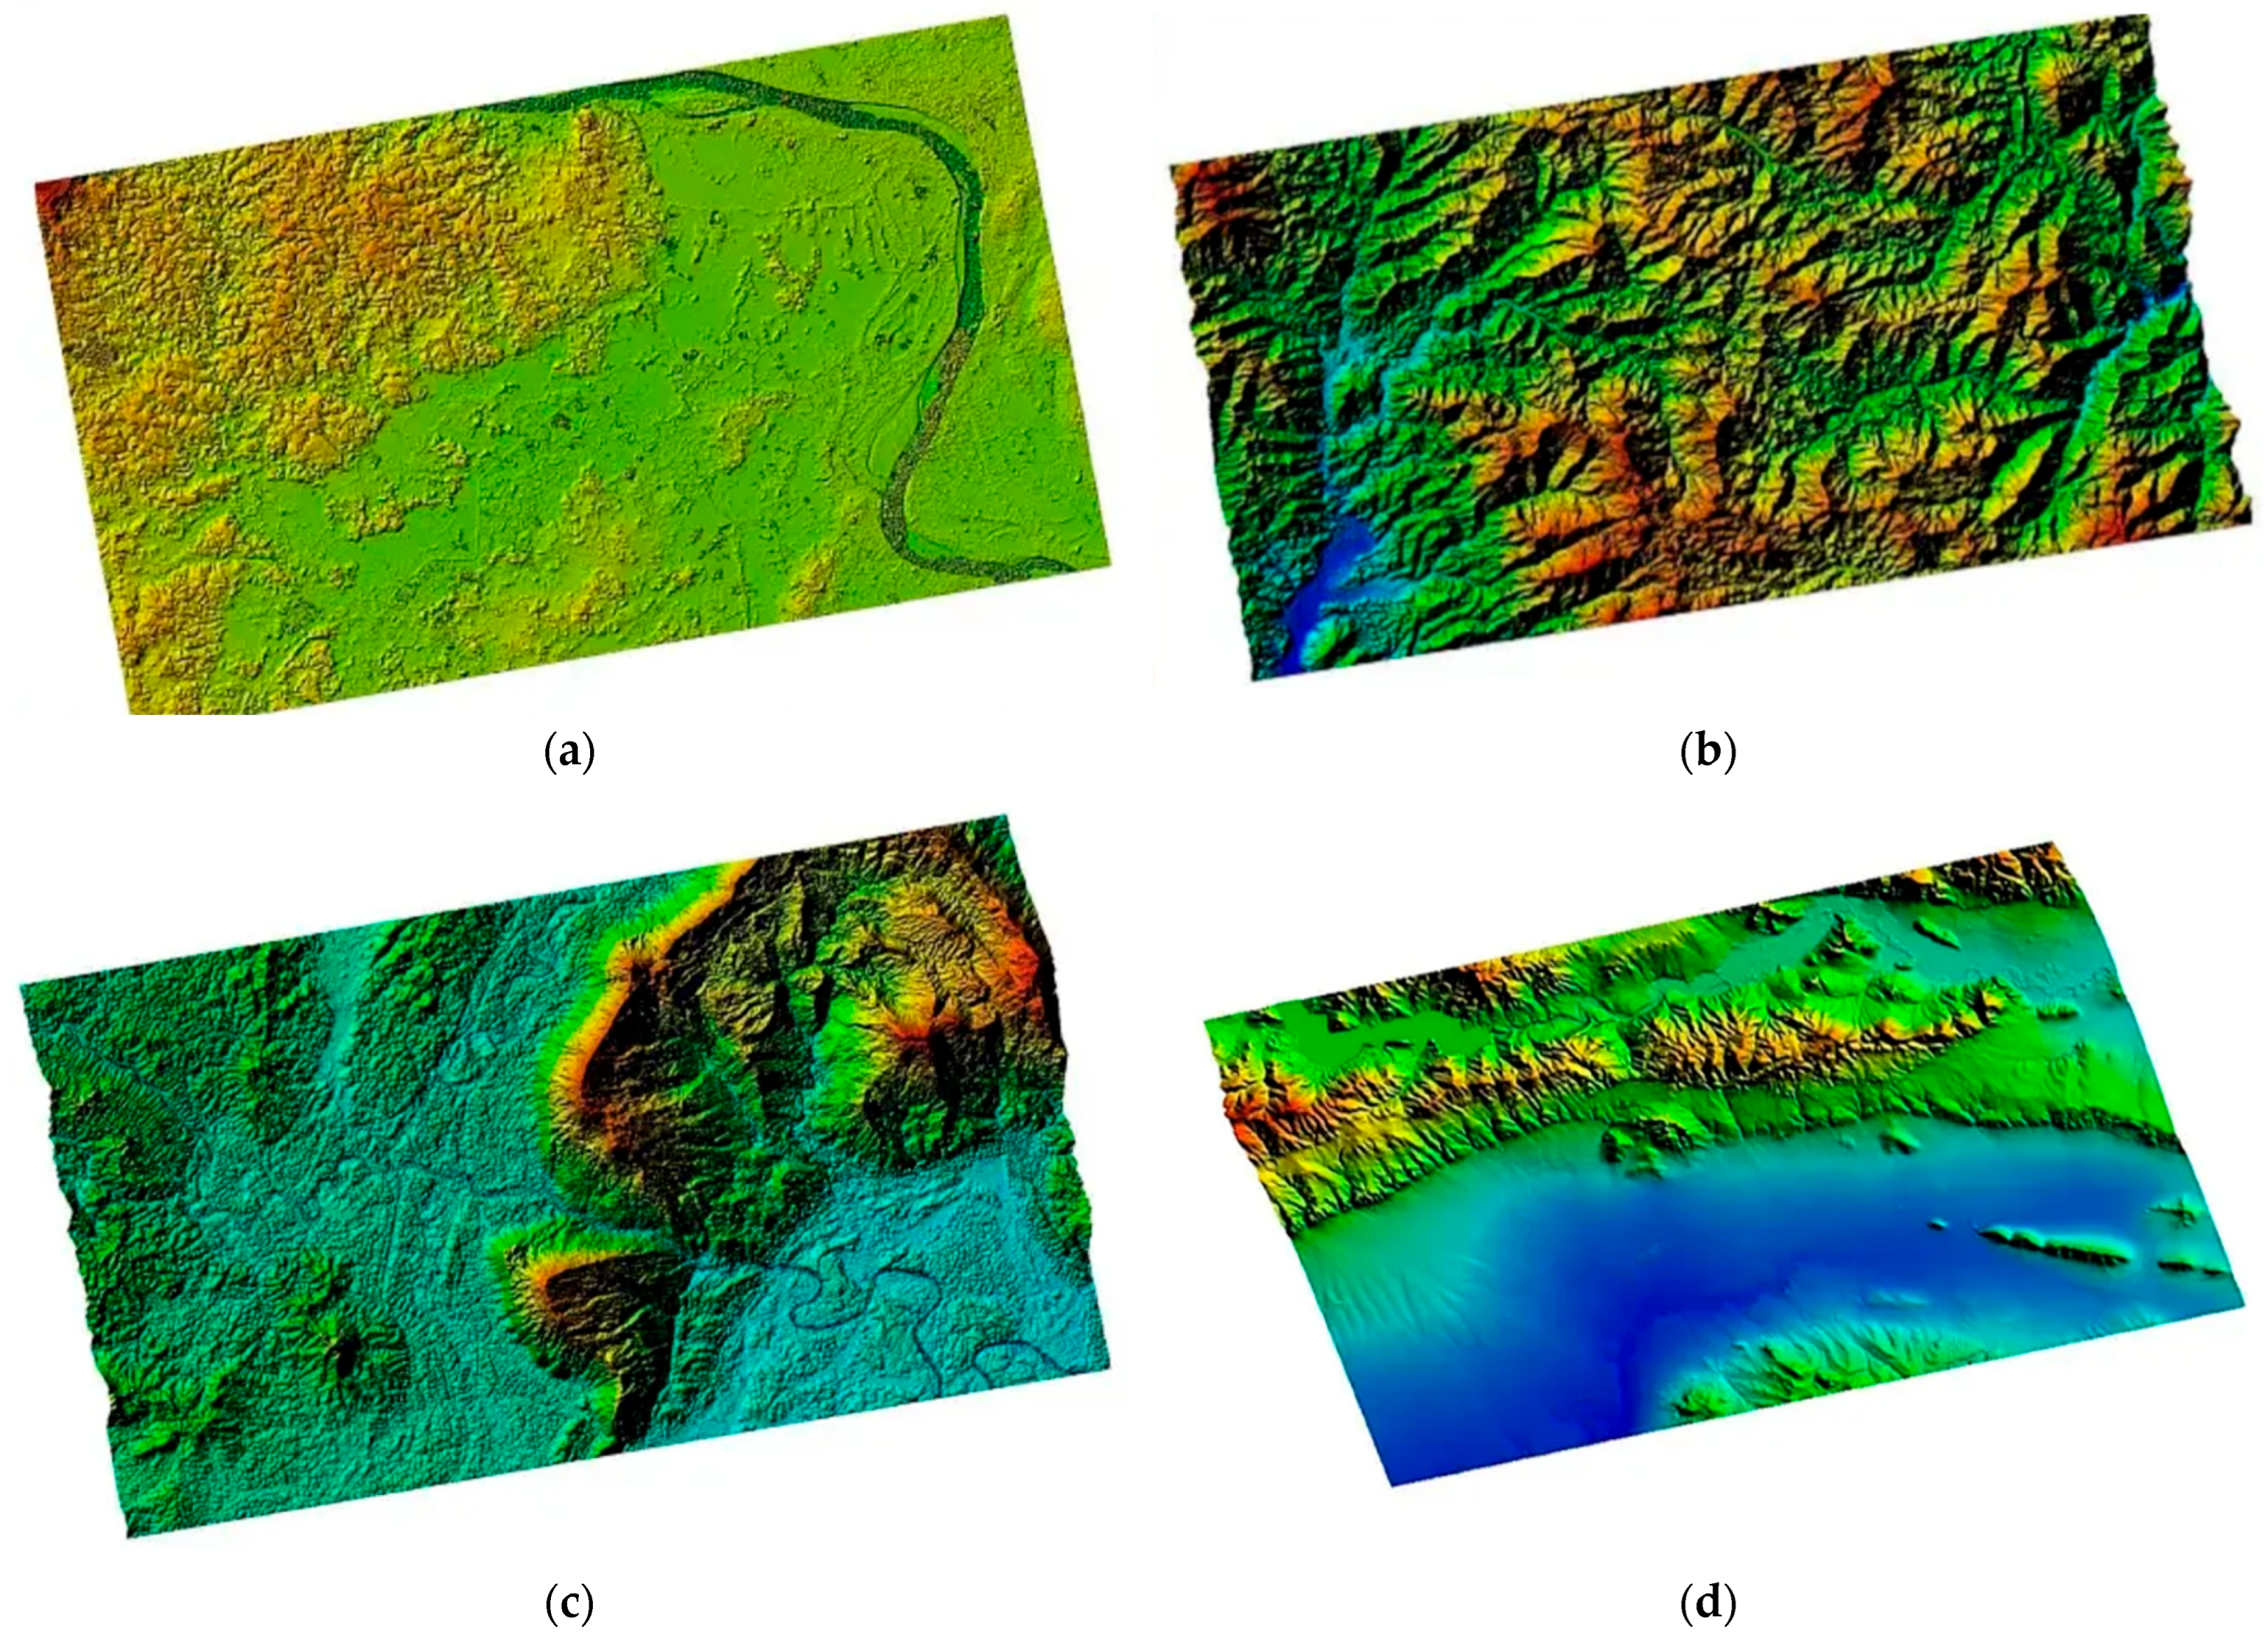
4.4. HRWS
4.5. Lunar and Deep Space Exploration
4.6. Challenges
- (1)
- Multi-platform synchronization and multi-baseline keeping.
- (2)
- Storage, transmission, and on-board processing of massive amounts of data.
5. Conclusions
Author Contributions
Funding
Acknowledgments
Conflicts of Interest
References
- Deng, Y.; Yu, W.; Zhang, H.; Wang, W.; Liu, D.; Wang, R. Forthcoming Spaceborne SAR Development. J. Radars 2020, 9, 1–33. [Google Scholar]
- Chen, J.; Liu, Y.; Chen, Z.; Zhao, D. Spaceborne Interferometric Synthetic Aperture Radar: Status and Prospect. Aerosp. Shanghai 2021, 38, 96–108. [Google Scholar]
- Li, Z.; Zhu, W.; Yu, C.; Zhang, Q.; Zhnag, C.; Liu, Z.; Zhang, X.; Chen, B.; Du, J.; Song, C.; et al. Interferometric synthetic aperture radar for deformation mapping: Opportunities, challenges and the outlook. Acta Geod. Cartogr. Sin. 2022, 51, 1485–1519. [Google Scholar]
- Ouchi, K. Recent Trend and Advance of Synthetic Aperture Radar with Selected Topics. Remote Sens. 2013, 5, 716–807. [Google Scholar] [CrossRef]
- Jiang, L.; Shao, Y.; Zhou, Z.; Ma, P.; Wang, T. A review of intelligent InSAR data processing: Recent advancements, challenges and prospects. Acta Geod. Cartogr. Sin. 2024, 53, 1037–1056. [Google Scholar]
- He, S.; Wu, H.; Li, J. A Review of the Application of InSAR Technology in Digital Terrain Analysis. Sci. Technol. Vis. 2024, 14, 60–64. [Google Scholar]
- Wang, X. Key techniques and their application of InSAR in ground deformation monitoring. Acta Geod. Cartogr. Sin. 2022, 51, 2244. [Google Scholar]
- Zhao, X.; Ma, X.; Yu, Q.; Wang, Z. Application of high-resolution InSAR technique in monitoring deformations in the Beijing Daxing International Airport. Remote Sens. Nat. Resour. 2024, 36, 49–57. [Google Scholar]
- Yi, J.; Zhang, Q.; Liu, J.; Zhang, R.; Zhao, L.; Zhang, C.; Liu, Y. A Review on Development of Formation Flying Interferometric SAR Satellite System. Spacecr. Eng. 2018, 27, 116–122. [Google Scholar]
- Rogers, A.E.E.; Ingalls, R.P. Venus: Mapping the Surface Reflectivity by Radar Interferometry. Science 1969, 165, 797–799. [Google Scholar] [CrossRef] [PubMed]
- Graham, L.C. Synthetic Interferometer Radar for Topographic Mapping. Proc. IEEE 1974, 62, 763–768. [Google Scholar] [CrossRef]
- Zebker, H.A.; Goldstein, R.M. Topographic Mapping from Interferometric Synthetic Aperture Radar Observations. J. Geophys. Res. Solid Earth 1986, 91, 4993–4999. [Google Scholar] [CrossRef]
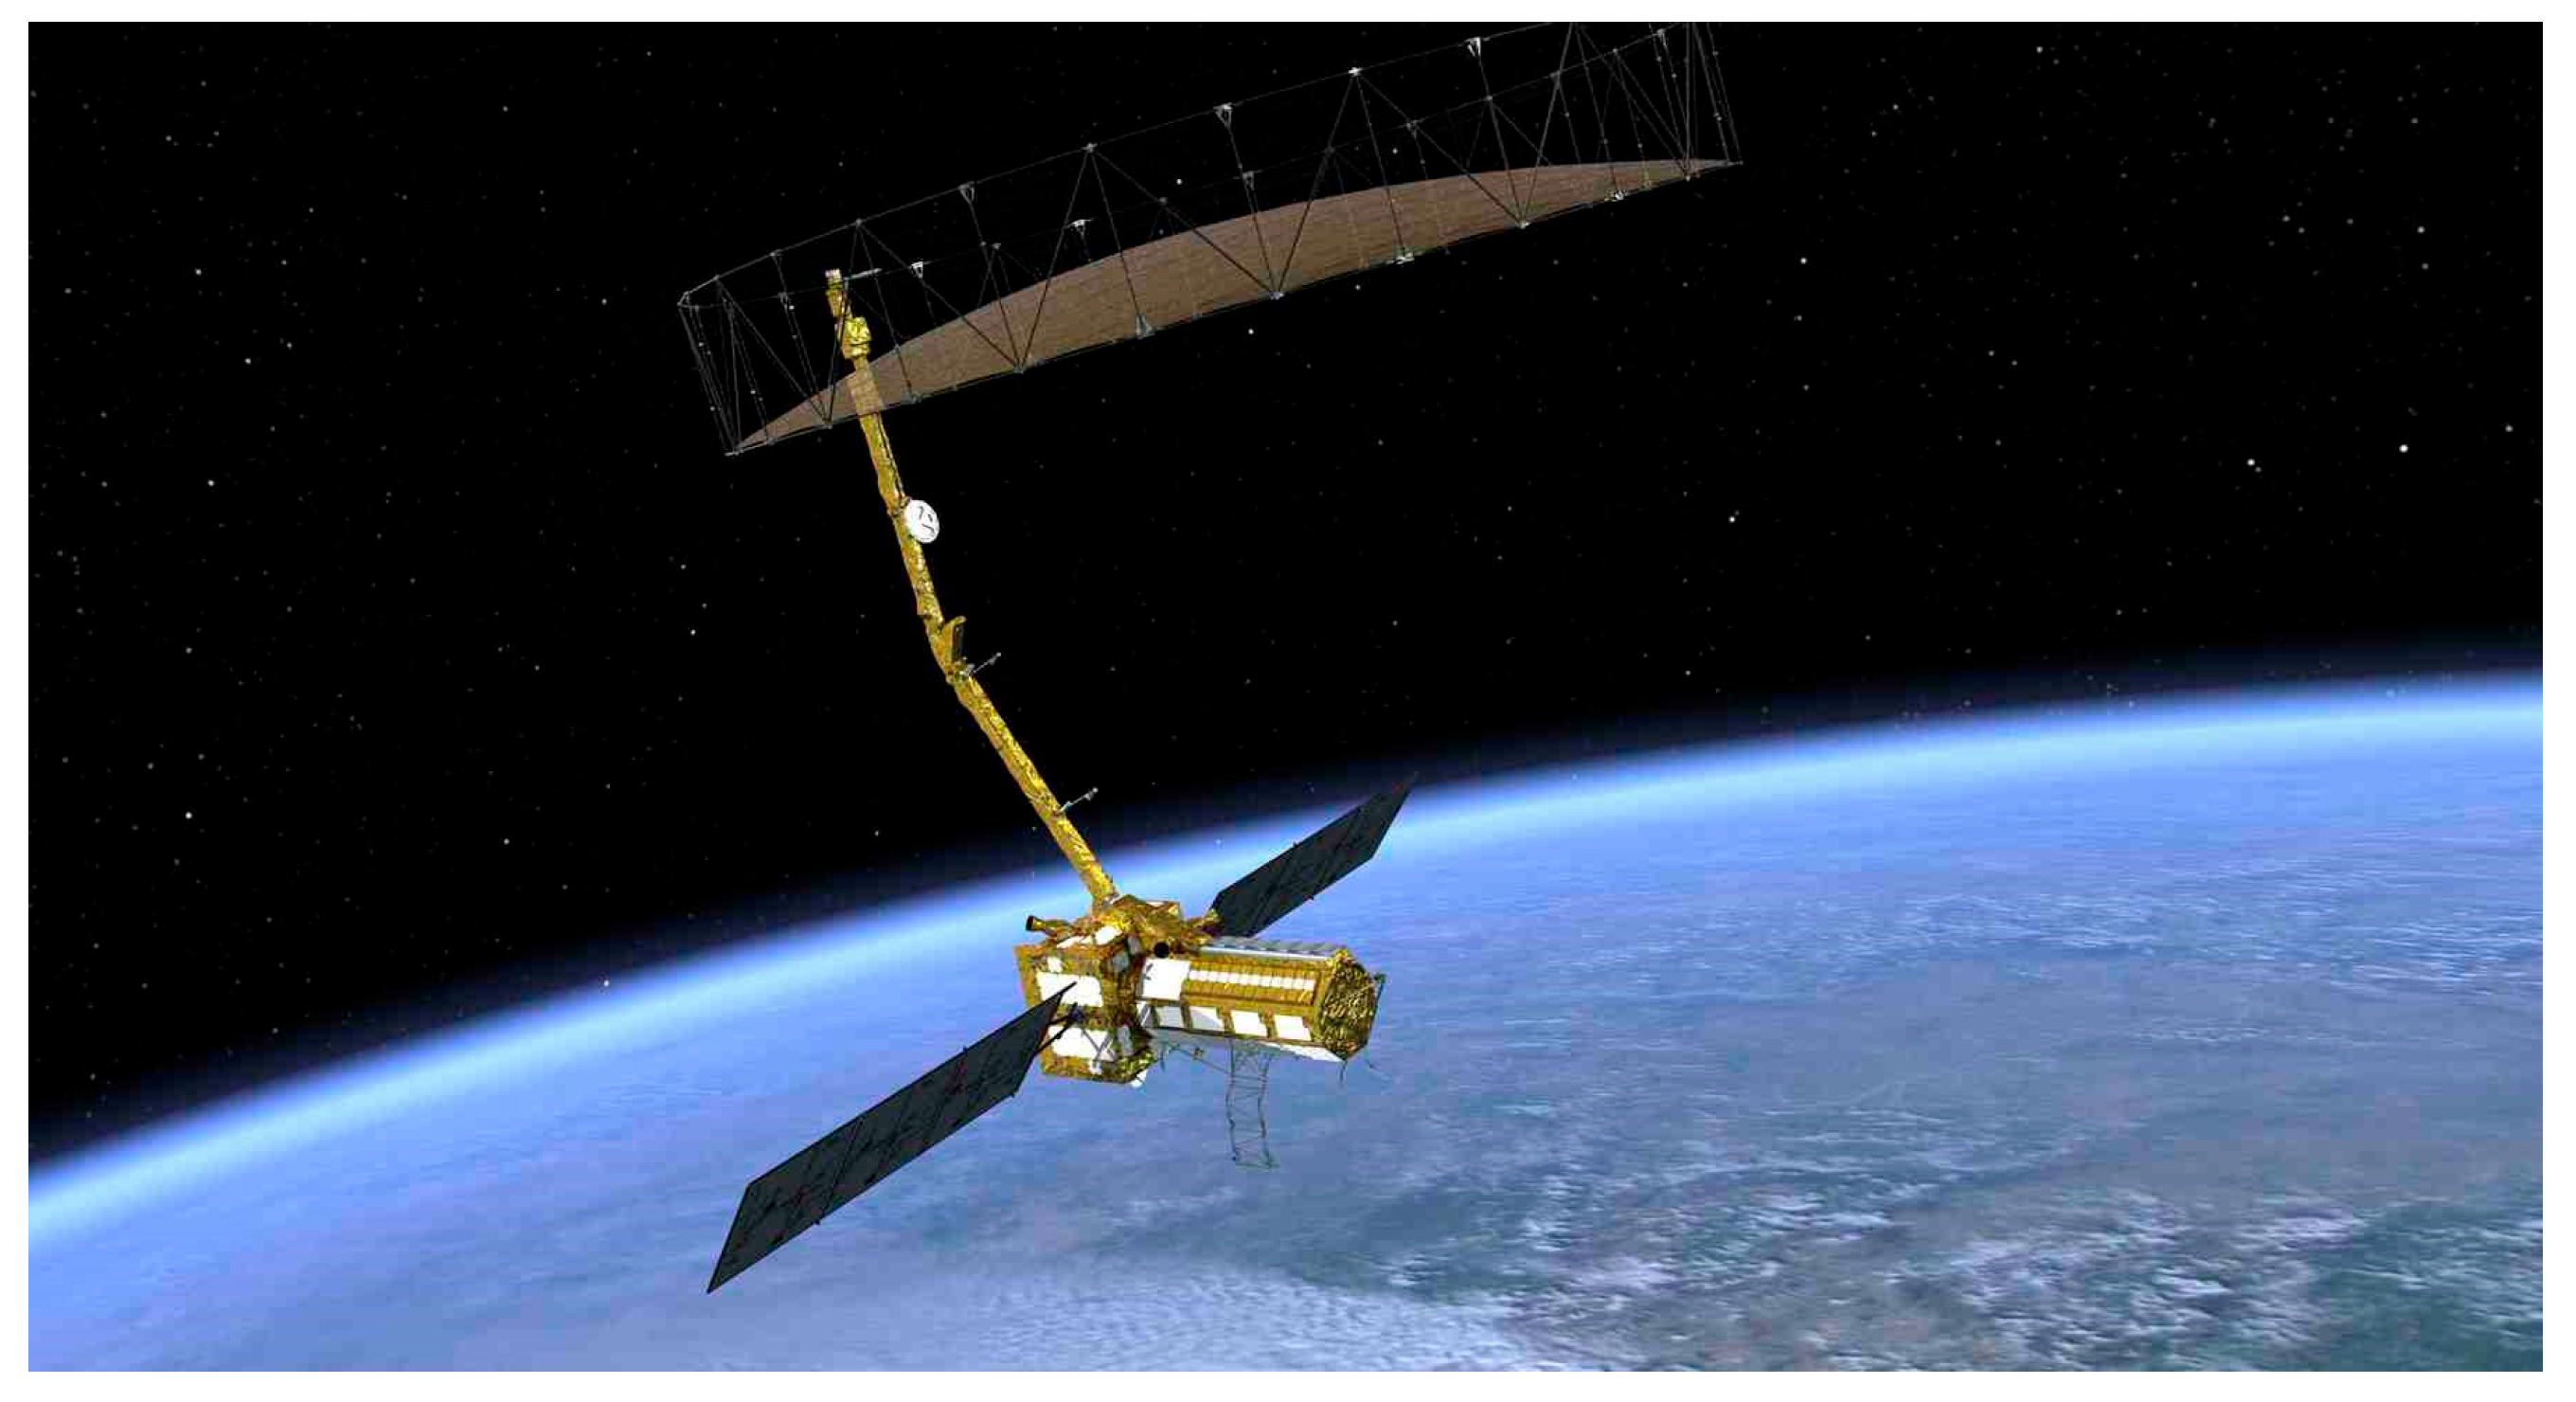
- Krieger, G.; Moreira, A.; Fiedler, H.; Hajnsek, I.; Werner, M.; Younis, M.; Zink, M. TanDEM-X: A Satellite Formation for High-Resolution SAR Interferometry. IEEE Trans. Geosci. Remote Sens. 2007, 45, 3317–3341. [Google Scholar] [CrossRef]
- Werner, M. Operating the X-Band SAR Interferometer of the SRTM. In Proceedings of the IGARSS 2000. IEEE 2000 International Geoscience and Remote Sensing Symposium. Taking the Pulse of the Planet: The Role of Remote Sensing in Managing the Environment. Proceedings (Cat. No.00CH37120), Honolulu, HI, USA, 24–28 July 2000; Volume 6, pp. 2587–2589. [Google Scholar]
- Zhao, L.; Zhang, Q.; Li, Y.; Qi, Y.; Yuan, X.; Liu, J.; Li, H. China’s Gaofen-3 Satellite System and Its Application and Prospect. IEEE J. Sel. Top. Appl. Earth Obs. Remote Sens. 2021, 14, 11019–11028. [Google Scholar] [CrossRef]
- Zhang, Q. System Design and Key Technologies of the GF-3 Satellite. Acta Geod. Cartogr. Sin. 2017, 46, 269–277. [Google Scholar] [CrossRef]
- Zhang, Q.; Han, X.; Liu, J. Technology Progress and Development Trend of Spaceborne Synthetic Aperture Radar Remote Sensing. Spacecr. Eng. 2017, 26, 1–8. [Google Scholar] [CrossRef]
- Wang, Z.; Qin, Y.; Zhang, Q.; Li, Y.; Liu, J.; Yuan, X.; Zhao, L.; Li, M.; Cao, S. China’s GaoFen-3 Mission: A review. IEEE Geosci. Remote Sens. Mag. 2025; early access. [Google Scholar] [CrossRef]
- Qin, Y.; Zhang, Q.; Hong, W.; Han, B.; Li, F.; Shen, J.; Wang, K.; Wang, M. GaoFen-3 Mission for InSAR Time Series Analysis: A Quantitative Evaluation. IEEE J. Sel. Top. Appl. Earth Obs. Remote Sens. 2025, 18, 11428–11450. [Google Scholar] [CrossRef]
- Moreira, A.; Prats-Iraola, P.; Younis, M.; Krieger, G.; Hajnsek, I.; Papathanassiou, K.P. A Tutorial on Synthetic Aperture Radar. IEEE Geosci. Remote Sens. Mag. 2013, 1, 6–43. [Google Scholar] [CrossRef]
- Gabriel, A.K.; Goldstein, R.M.; Zebker, H.A. Mapping Small Elevation Changes over Large Areas: Differential Radar Interferometry. J. Geophys. Res. Solid Earth 1989, 94, 9183–9191. [Google Scholar] [CrossRef]
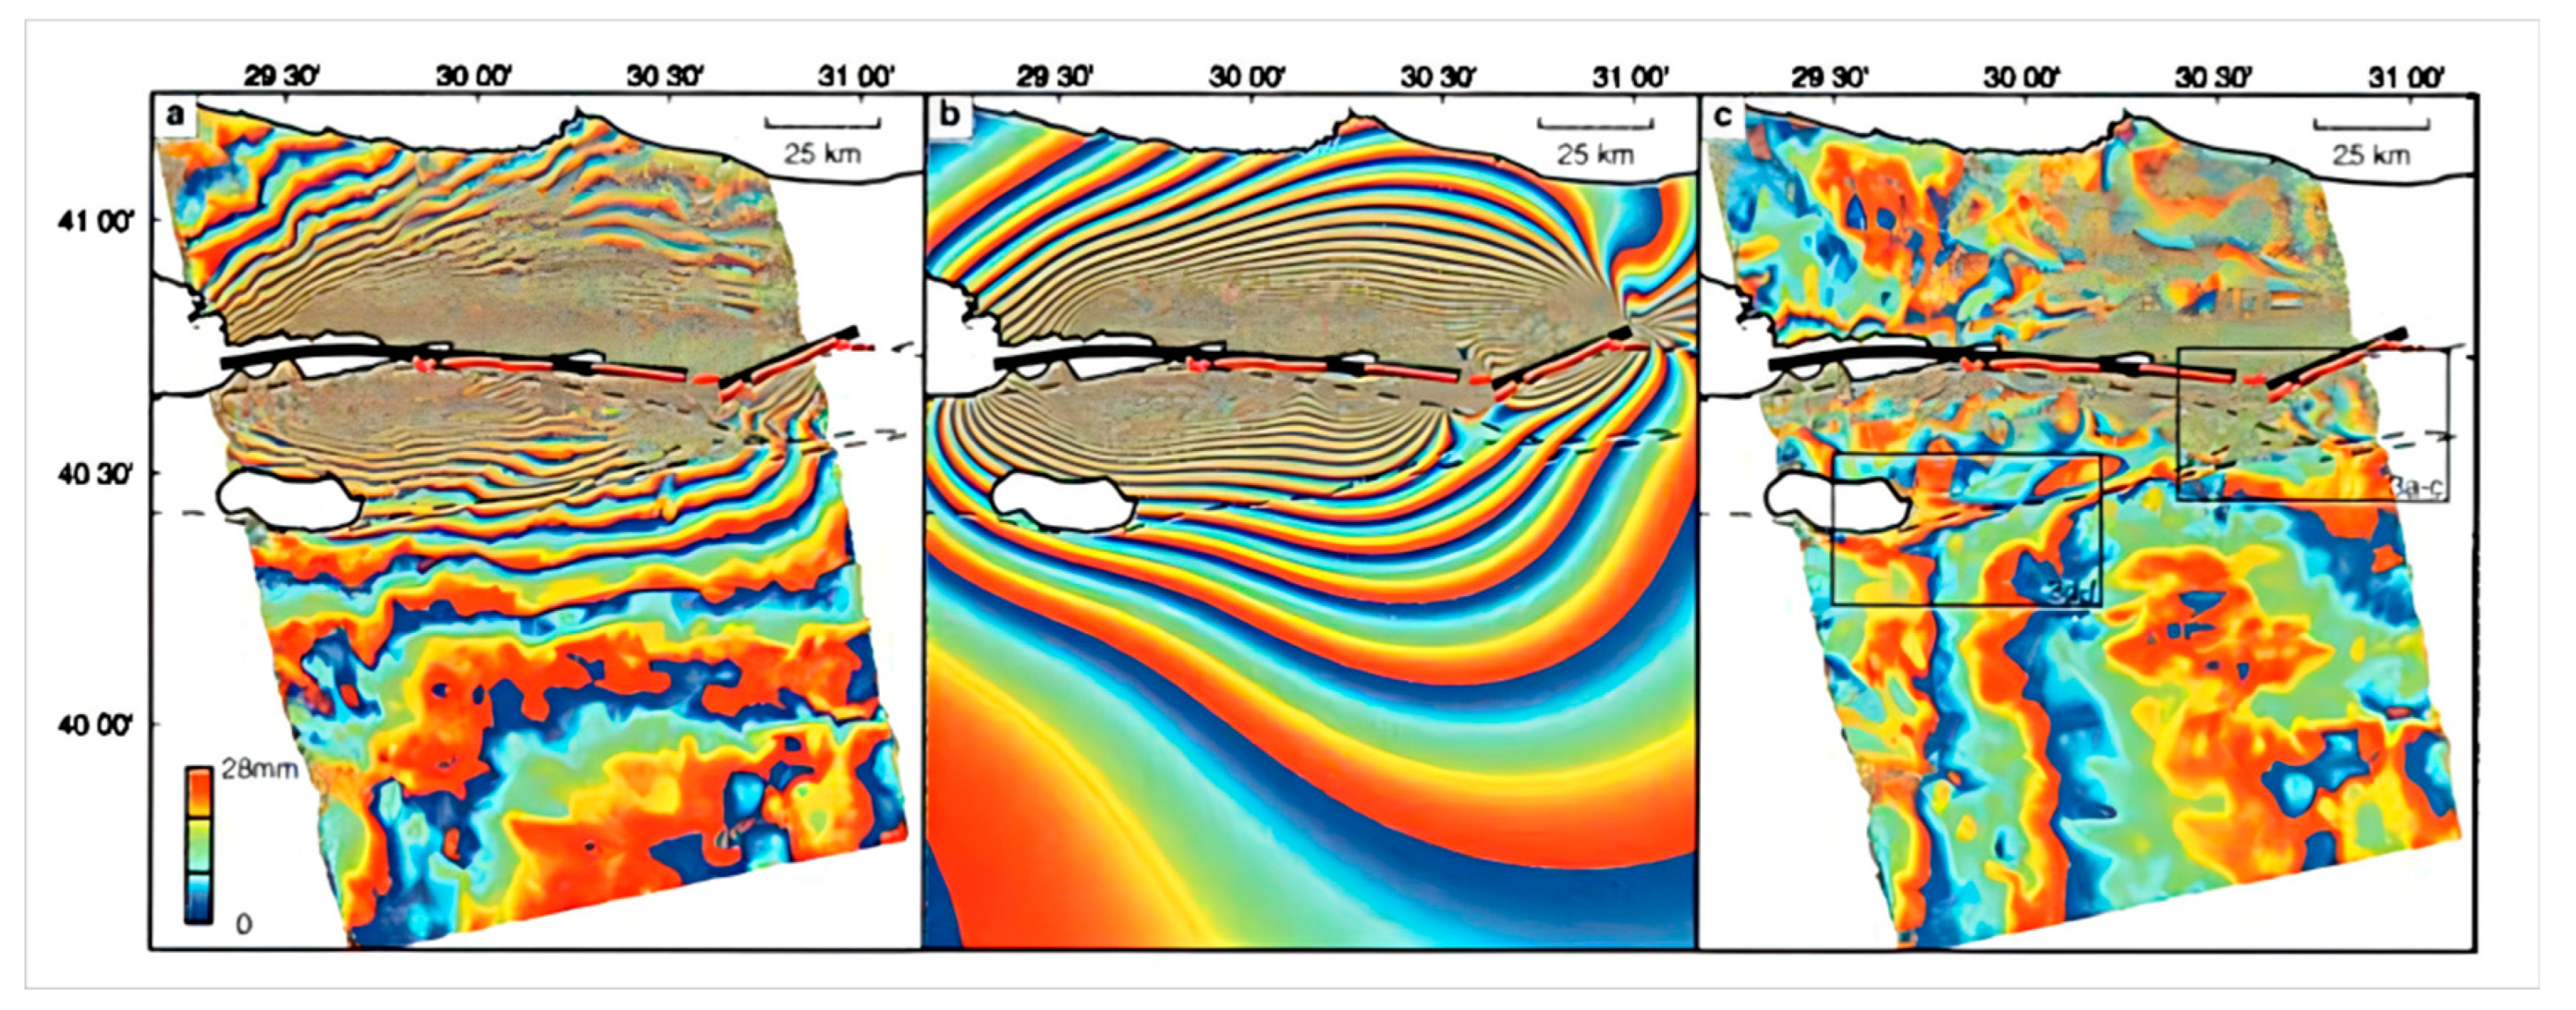
- Massonnet, D.; Rossi, M.; Carmona, C.; Adragna, F.; Peltzer, G.; Feigl, K.; Rabaute, T. The Displacement Field of the Landers Earthquake Mapped by Radar Interferometry. Nature 1993, 364, 138–142. [Google Scholar] [CrossRef]
- Hanssen, R. Radar Interferometry: Data Interpretation and Error Analysis. Available online: https://www.semanticscholar.org/paper/Radar-Interferometry%3A-Data-Interpretation-and-Error-Hanssen/341cfe9b84770bed948a6113fd98b71ed380bc07 (accessed on 24 January 2025).
- Liu, G. Principles and Applications of InSAR; Science Press: Beijing, China, 2019; ISBN 978-7-03-061185-7. [Google Scholar]
- Monserrat, O.; Crosetto, M.; Luzi, G. A Review of Ground-Based SAR Interferometry for Deformation Measurement. ISPRS J. Photogramm. Remote Sens. 2014, 93, 40–48. [Google Scholar] [CrossRef]
- Ma, C.; Zhang, G.; Ma, X.; Shan, X.; Li, F.; Zhang, X. A Model of In-Depth Displacement under Ms8.1 at Kunlun Earthquake with D-InSAR Co-Seismic Deformation Field. In Proceedings of the 2009 Sixth International Conference on Fuzzy Systems and Knowledge Discovery, Tianjin, China, 14–16 August 2009; Volume 5, pp. 141–144. [Google Scholar]
- Zhu, B.; Chen, H.; Wang, Y. Evaluating the Impact of the 2008 China Wenchuan Earthquake on Airports by Insar Technology and Palsar Data. In Proceedings of the IGARSS 2024—2024 IEEE International Geoscience and Remote Sensing Symposium, Athens, Greece, 7–12 July 2024; pp. 3461–3464. [Google Scholar]
- Wright, T.; Fielding, E.; Parsons, B. Triggered Slip: Observations of the 17 August 1999 Izmit (Turkey) Earthquake Using Radar Interferometry. Geophys. Res. Lett. 2001, 28, 1079–1082. [Google Scholar] [CrossRef]
- Rott, H. Advances in Interferometric Synthetic Aperture Radar (InSAR) in Earth System Science. Prog. Phys. Geogr. 2009, 33, 769–791. [Google Scholar] [CrossRef]
- Liu, G.; Ding, X.; Li, Z.; Chen, Y.; Li, Y.; Yu, S. ERS Satellite Radar Interferometry: Pre-earthquake and Coseismic Surface Displacements of the 1999 Taiwan Jiji Earthquake. Chin. J. Geophys. 2002, 45, 165–174. [Google Scholar]
- Peltzer, G.; Rosen, P. Surface Displacement of the 17 May 1993 Eureka Valley, California, Earthquake Observed by SAR Interferometry. Science 1995, 268, 1333–1336. [Google Scholar] [CrossRef] [PubMed]
- Hu, J.; Li, Z.W.; Ding, X.L.; Zhu, J.J.; Zhang, L.; Sun, Q. Resolving Three-Dimensional Surface Displacements from InSAR Measurements: A Review. Earth-Sci. Rev. 2014, 133, 1–17. [Google Scholar] [CrossRef]
- Pritchard, M.E.; Simons, M. A Satellite Geodetic Survey of Large-Scale Deformation of Volcanic Centres in the Central Andes. Nature 2002, 418, 167–171. [Google Scholar] [CrossRef] [PubMed]
- Talebian, M.; Fielding, E.J.; Funning, G.J.; Ghorashi, M.; Jackson, J.; Nazari, H.; Parsons, B.; Priestley, K.; Rosen, P.A.; Walker, R.; et al. The 2003 Bam (Iran) Earthquake: Rupture of a Blind Strike-Slip Fault. Geophys. Res. Lett. 2004, 31, L11611. [Google Scholar] [CrossRef]
- Wright, T. The Earthquake Deformation Cycle. Astron. Geophys. 2016, 57, 20–26. [Google Scholar] [CrossRef]
- Wang, X.; Liu, G.; Yu, B.; Dai, K.; Zhang, R.; Chen, Q.; Li, Z. 3D Coseismic Deformations and Source Parameters of the 2010 Yushu Earthquake (China) Inferred from DInSAR and Multiple-Aperture InSAR Measurements. Remote Sens. Environ. 2014, 152, 174–189. [Google Scholar] [CrossRef]
- Xu, C.; Xu, B.; Wen, Y.; Liu, Y. Heterogeneous Fault Mechanisms of the 6 October 2008 MW 6.3 Dangxiong (Tibet) Earthquake Using Interferometric Synthetic Aperture Radar Observations. Remote Sens. 2016, 8, 228. [Google Scholar] [CrossRef]
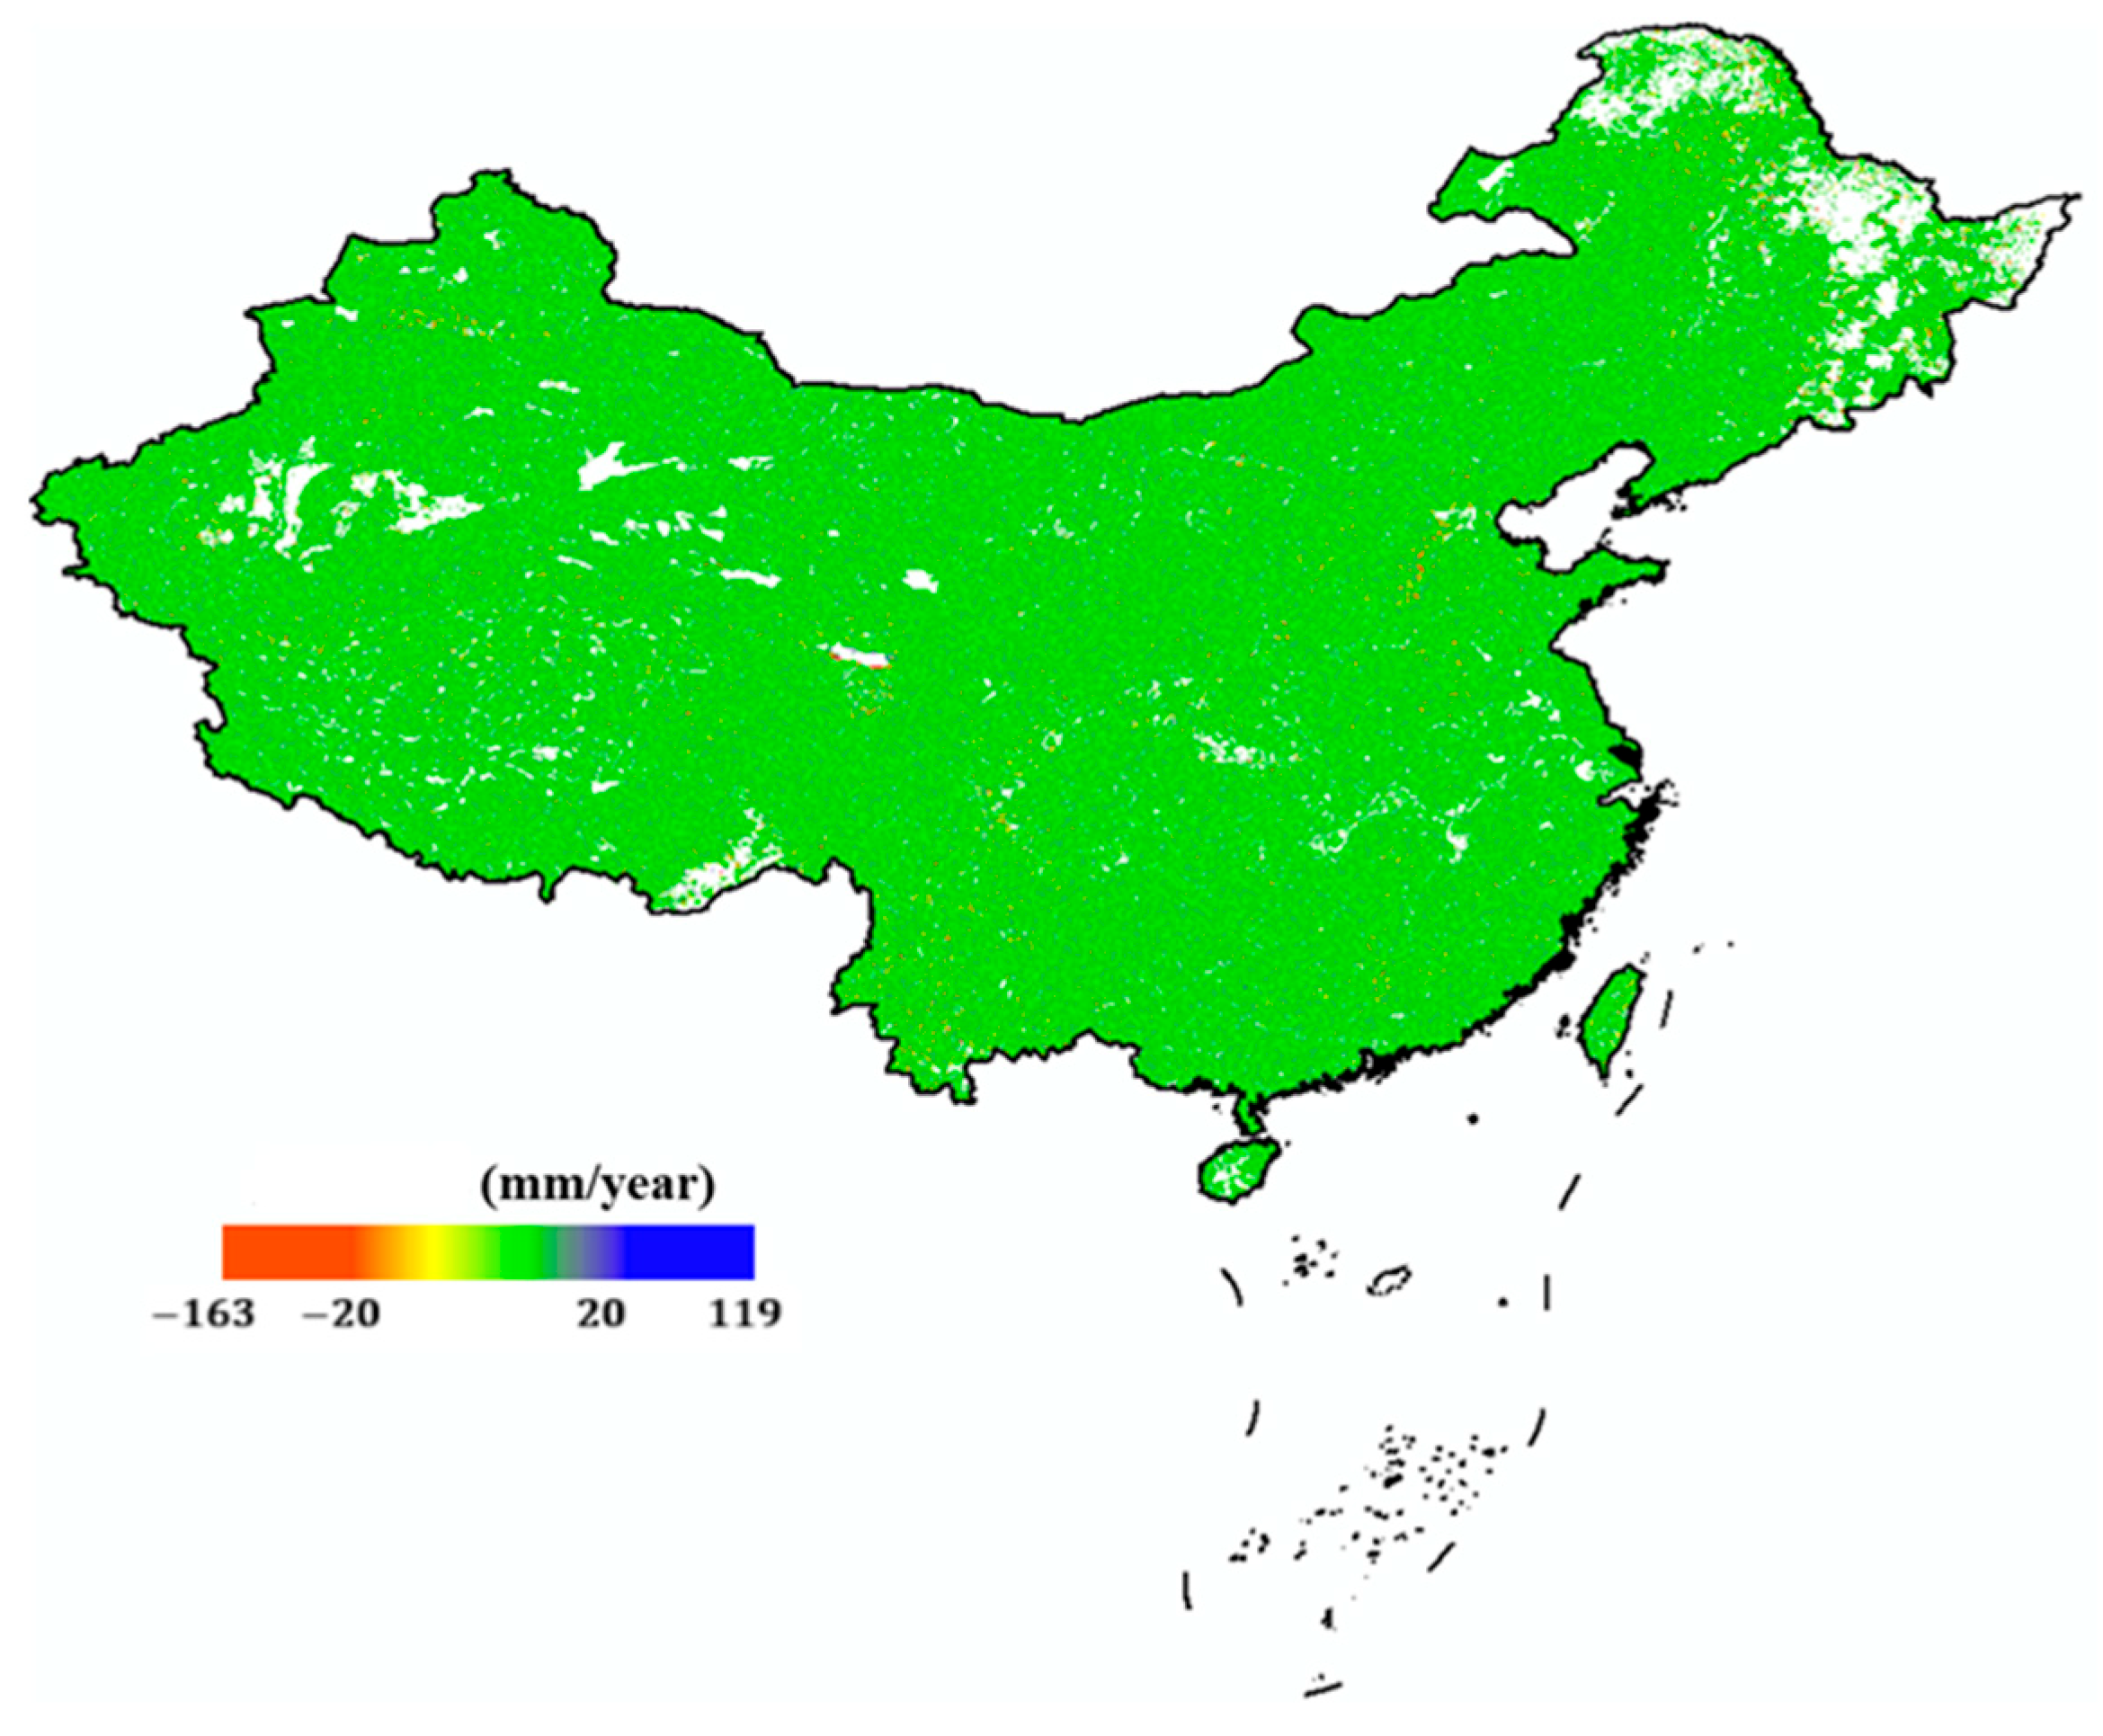
- A Map of Surface Deformation with a Resolution of 40 Meters Nationwide and an Accuracy of 5 mm/year [EB/OL]. Available online: http://www.hbeos.org.cn/xwzx/1/2022-08-22/867.html (accessed on 24 January 2025).
- China’s First Supercomputing InSAR System Achieves Nationwide Surface Deformation Monitoring—Chinese Academy of Sciences [EB/OL]. Available online: https://www.cas.cn/syky/202012/t20201216_4770987.shtml (accessed on 24 January 2025).
- Duan, W.; Zhang, H.; Wang, C.; Tang, Y. Multi-Temporal InSAR Parallel Processing for Sentinel-1 Large-Scale Surface Deformation Mapping. Remote Sens. 2020, 12, 3749. [Google Scholar] [CrossRef]
- Song, C.; Yu, C.; Li, Z.; Utili, S.; Frattini, P.; Crosta, G.; Peng, J. Triggering and Recovery of Earthquake Accelerated Landslides in Central Italy Revealed by Satellite Radar Observations. Nat. Commun. 2022, 13, 7278. [Google Scholar] [CrossRef] [PubMed]
- Ferretti, A.; Prati, C.; Rocca, F. Permanent Scatterers in SAR Interferometry. IEEE Trans. Geosci. Remote Sens. 2001, 39, 8–20. [Google Scholar] [CrossRef]
- Ferretti, A.; Savio, G.; Barzaghi, R.; Borghi, A.; Musazzi, S.; Novali, F.; Prati, C.; Rocca, F. Submillimeter Accuracy of InSAR Time Series: Experimental Validation. IEEE Trans. Geosci. Remote Sens. 2007, 45, 1142–1153. [Google Scholar] [CrossRef]
- Ferretti, A.; Prati, C.; Rocca, F. Nonlinear Subsidence Rate Estimation Using Permanent Scatterers in Differential SAR Interferometry. IEEE Trans. Geosci. Remote Sens. 2000, 38, 2202–2212. [Google Scholar] [CrossRef]
- Adam, N.; Kampes, B.; Eineder, M. Development of a Scientific Permanent Scatterer System: Modifications for Mixed ERS/Envisat Time Series. In Proceedings of the 2004 Envisat & ERS Symposium (ESA SP-572), Salzburg, Austria, 6–10 September 2004. [Google Scholar]
- Hooper, A.; Zebker, H.; Segall, P.; Kampes, B. A New Method for Measuring Deformation on Volcanoes and Other Natural Terrains Using InSAR Persistent Scatterers. Geophys. Res. Lett. 2004, 31, L23611. [Google Scholar] [CrossRef]
- Ferretti, A.; Fumagalli, A.; Novali, F.; Prati, C.; Rocca, F.; Rucci, A. A New Algorithm for Processing Interferometric Data-Stacks: SqueeSAR. IEEE Trans. Geosci. Remote Sens. 2011, 49, 3460–3470. [Google Scholar] [CrossRef]
- Huang, S.A.; Sauber, J.M. Leveraging Multi-Primary PS-InSAR Configurations for the Robust Estimation of Coastal Subsidence. IEEE Geosci. Remote Sens. Lett. 2024, 21, 4003105. [Google Scholar] [CrossRef]
- Nyoman Sudi Parwata, I.; Osawa, T. Surface Deformation Monitoring Induced by Volcanic Activity of Mount Agung, Indonesia, by PS-InSAR Using Sentinel-1 SAR from 2014–2021. In Proceedings of the 2021 7th Asia-Pacific Conference on Synthetic Aperture Radar (APSAR), Virtual, 1–3 November 2021; pp. 1–4. [Google Scholar]
- Xu, J.; Gu, S.; Li, J.; Tian, X.; Li, L.; Xu, S. Monitoring and Risk Assessment of Urban Surface Deformation Based on PS-InSAR Technology: A Case Study of Nanjing City. IEEE J. Miniaturiz. Air Space Syst. 2024, 5, 73–78. [Google Scholar] [CrossRef]
- Berardino, P.; Fornaro, G.; Lanari, R.; Sansosti, E. A New Algorithm for Surface Deformation Monitoring Based on Small Baseline Differential SAR Interferograms. IEEE Trans. Geosci. Remote Sens. 2002, 40, 2375–2383. [Google Scholar] [CrossRef]
- Lauknes, T.R.; Zebker, H.A.; Larsen, Y. InSAR Deformation Time Series Using an L1 -Norm Small-Baseline Approach. IEEE Trans. Geosci. Remote Sens. 2011, 49, 536–546. [Google Scholar] [CrossRef]
- Casu, F.; Manconi, A.; Pepe, A.; Lanari, R. Deformation Time-Series Generation in Areas Characterized by Large Displacement Dynamics: The SAR Amplitude Pixel-Offset SBAS Technique. IEEE Trans. Geosci. Remote Sens. 2011, 49, 2752–2763. [Google Scholar] [CrossRef]
- Li, Z.; Fielding, E.J.; Cross, P. Integration of InSAR Time-Series Analysis and Water-Vapor Correction for Mapping Postseismic Motion After the 2003 Bam (Iran) Earthquake. IEEE Trans. Geosci. Remote Sens. 2009, 47, 3220–3230. [Google Scholar] [CrossRef]
- Sowter, A.; Bateson, L.; Strange, P.; Ambrose, K.; Syafiudin, M.F. DInSAR Estimation of Land Motion Using Intermittent Coherence with Application to the South Derbyshire and Leicestershire Coalfields. Remote Sens. Lett. 2013, 4, 979–987. [Google Scholar] [CrossRef]
- Casu, F.; Elefante, S.; Imperatore, P.; Zinno, I.; Manunta, M.; De Luca, C.; Lanari, R. SBAS-DInSAR Parallel Processing for Deformation Time-Series Computation. IEEE J. Sel. Top. Appl. Earth Obs. Remote Sens. 2014, 7, 3285–3296. [Google Scholar] [CrossRef]
- Samsonov, S.; d’Oreye, N. Multidimensional Time-Series Analysis of Ground Deformation from Multiple InSAR Data Sets Applied to Virunga Volcanic Province. Geophys. J. Int. 2012, 191, 1095–1108. [Google Scholar] [CrossRef]
- Guo, S.; Ji, Y.; Tian, X.; Zhang, W.; Kang, W.; Li, Y.; Zhang, T. Deformation Velocity Monitoring in Kunming City Using Ascending and Descending Sentinel-1A Data with SBAS-InSAR Technique. In Proceedings of the IGARSS 2020—2020 IEEE International Geoscience and Remote Sensing Symposium, Waikoloa, HI, USA, 26 September–2 October 2020; pp. 1993–1996. [Google Scholar]
- Lu, X.; Yang, T.; Wang, Z.; Tang, W. Surface Deformation Analysis in Jiuzhaigou, China Using SBAS-InSAR Technique. In Proceedings of the 2021 IEEE International Geoscience and Remote Sensing Symposium IGARSS, Brussels, Belgium, 11–16 July 2021; pp. 5350–5353. [Google Scholar]
- Yan, M.; Zhao, C.; Liu, X.; Wang, B. Sequential SBAS-InSAR Backward Estimation of Deformation Time Series. IEEE Geosci. Remote Sens. Lett. 2024, 21, 4001505. [Google Scholar] [CrossRef]
- Pac, R.D. X-SAR/SRTM—Shuttle Radar Topography Mission: Mapping the Earth from Space; United States Geological Survey: Reston, VA, USA, 1999. [Google Scholar]
- Werner, M. Shuttle Radar Topography Mission (SRTM): Experience with the X-Band SAR Interferometer. In Proceedings of the 2001 CIE International Conference on Radar Proceedings (Cat No.01TH8559), Beijing, China, 15–18 October 2001; pp. 634–638. [Google Scholar]
- Moreira, A.; Krieger, G.; Hajnsek, I.; Hounam, D.; Werner, M.; Riegger, S.; Settelmeyer, E. TanDEM-X: A terraSAR-X Add-on Satellite for Single-Pass SAR Interferometry. In Proceedings of the IEEE International Geoscience and Remote Sensing Symposium 2004. IGARSS ’04, Anchorage, AK, USA, 20–24 September 2004; Proceedings. IEEE: Anchorage, AK, USA, 2004; Volume 2, pp. 1000–1003. [Google Scholar]
- Zink, M.; Bachmann, M.; Brautigam, B.; Fritz, T.; Hajnsek, I.; Krieger, G.; Moreira, A.; Wessel, B. TanDEM-X: A Single-Pass SAR Interferometer for Global DEM Generation and Demonstration of New SAR Techniques. In Proceedings of the 2015 IEEE International Geoscience and Remote Sensing Symposium (IGARSS), Milan, Italy, 26–31 July 2015; IEEE: Milan, Italy, 2015; pp. 2888–2891. [Google Scholar]
- Rodriguez-Cassola, M.; Prats, P.; Schulze, D.; Tous-Ramon, N.; Steinbrecher, U.; Marotti, L.; Nannini, M.; Younis, M.; Lopez-Dekker, P.; Zink, M.; et al. First Bistatic Spaceborne SAR Experiments With TanDEM-X. IEEE Geosci. Remote Sens. Lett. 2012, 9, 33–37. [Google Scholar] [CrossRef]
- Lou, L.; Liu, Z.; Zhang, H.; Qian, F.; Huang, Y. TIANHUI-2 satellite engineering design and implementation. Acta Geod. Cartogr. Sin. 2020, 49, 1252–1264. [Google Scholar]
- Xiang, J.; Lü, X.; Fu, X.; Xue, F.; Yun, Y.; Ye, Y.; He, K. Bistatic InSAR interferometry imaging and DSM generation for TIANHUI-2. Acta Geod. Cartogr. Sin. 2022, 51, 2493–2500. [Google Scholar]
- The First “1+3” Wheel Formation InSAR Commercial Satellite Data Product Was Released [EB/OL]. Available online: https://www.sastind.gov.cn/n10086200/n10086331/c10391350/content.html (accessed on 24 January 2025).
- Romeiser, R.; Thompson, D.R. Numerical Study on the Along-Track Interferometric Radar Imaging Mechanism of Oceanic Surface Currents. IEEE Trans. Geosci. Remote Sens. 2000, 38, 446–458. [Google Scholar] [CrossRef]
- Romeiser, R.; Suchandt, S.; Runge, H.; Graber, H. Currents in Rivers, Coastal Areas, and the Open Ocean from TerraSAR-X along-Track InSAR. In Proceedings of the 2010 IEEE International Geoscience and Remote Sensing Symposium, Honolulu, HI, USA, 25–30 July 2010; IEEE: Honolulu, HI, USA, 2010; pp. 3059–3062. [Google Scholar]
- Romeiser, R.; Alpers, W.; Wismann, V. An Improved Composite Surface Model for the Radar Backscattering Cross Section of the Ocean Surface: 1. Theory of the Model and Optimization/Validation by Scatterometer Data. J. Geophys. Res. Oceans 1997, 102, 25237–25250. [Google Scholar] [CrossRef]
- Romeiser, R.; Alpers, W. An Improved Composite Surface Model for the Radar Backscattering Cross Section of the Ocean Surface: 2. Model Response to Surface Roughness Variations and the Radar Imaging of Underwater Bottom Topography. J. Geophys. Res. Oceans 1997, 102, 25251–25267. [Google Scholar] [CrossRef]
- Romeiser, R.; Breit, H.; Eineder, M.; Runge, H.; Flament, P.; de Jong, K.; Vogelzang, J. Validation of SRTM-Derived Surface Currents off the Dutch Coast by Numerical Circulation Model Results. In Proceedings of the IGARSS 2003. 2003 IEEE International Geoscience and Remote Sensing Symposium. Proceedings (IEEE Cat. No.03CH37477), Toulouse, France, 21–25 July 2003; Volume 5, pp. 3085–3087. [Google Scholar]
- Runge, H.; Suchandt, S.; Breit, H.; Eineder, M.; Schulz-Stellenfleth, J.; Bard, J.; Romeiser, R. Mapping of Tidal Currents with SAR along Track Interferometry. In Proceedings of the IEEE International Geoscience and Remote Sensing Symposium 2004. IGARSS ’04, Anchorage, AK, USA, 20–24 September 2004; Proceedings. IEEE: Anchorage, AK, USA, 2004; Volume 2, pp. 1156–1159. [Google Scholar]
- Romeiser, R.; Runge, H. Theoretical Evaluation of Several Possible Along-Track InSAR Modes of TerraSAR-X for Ocean Current Measurements. IEEE Trans. Geosci. Remote Sens. 2007, 45, 21–35. [Google Scholar] [CrossRef]
- Ahmed, U.I.; Rabus, B.; Geudtner, D.; Rashid, M.; Gierull, C. Along Track Interferometry (ATI) versus Doppler Centroid Anomaly (DCA) Estimation of Ocean Surface Radial Velocity Using RADARSAT-2 Modex-1 ScanSAR Data. In Proceedings of the EUSAR 2022, 14th European Conference on Synthetic Aperture Radar, Leipzig, Germany, 25–27 July 2022; pp. 1–5. [Google Scholar]
- Rodríguez, E.; Imel, D.; Houshmand, B. Two-Dimensional Surface Currents Using Vector along-Track Interferometry. Proc. PIERS 1995, 95, 763. [Google Scholar]
- Frasier, S.J.; Camps, A.J. Dual-Beam Interferometry for Ocean Surface Current Vector Mapping. IEEE Trans. Geosci. Remote Sens. 2001, 39, 401–414. [Google Scholar] [CrossRef]
- Buck, C.; Aguirre, M.; Donion, C.; Petrolati, D.; D’Addio, S. Steps towards the Preparation of a Wavemill Mission. In Proceedings of the 2011 IEEE International Geoscience and Remote Sensing Symposium, Vancouver, BC, Canada, 24–29 July 2011; IEEE: Vancouver, BC, Canada, 2011; pp. 3959–3962. [Google Scholar]
- Yague-Martinez, N.; Márquez, J.; Cohen, M.; Lancashire, D.; Buck, C. Wavemill Proof-of-Concept Campaign. Processing Algorithms and Results. In Proceedings of the EUSAR 2012; 9th European Conference on Synthetic Aperture Radar, Nuremberg, Germany, 23–26 April 2012; pp. 312–315. [Google Scholar]
- Zink, M. TanDEM-X Mission Status. In Proceedings of the 2012 IEEE International Geoscience and Remote Sensing Symposium, Munich, Germany, 22–27 July 2012; IEEE: Munich, Germany, 2012; pp. 1896–1899. [Google Scholar]
- Zink, M.; Moreira, A. TanDEM-X Mission: Overview, Challenges and Status. In Proceedings of the 2013 IEEE International Geoscience and Remote Sensing Symposium—IGARSS, Melbourne, VIC, Australia, 21–26 July 2013; IEEE: Melbourne, VIC, Australia, 2013; pp. 1885–1888. [Google Scholar]
- Romeiser, R.; Runge, H.; Suchandt, S.; Kahle, R.; Rossi, C.; Bell, P.S. Quality Assessment of Surface Current Fields from TerraSAR-X and TanDEM-X Along-Track Interferometry and Doppler Centroid Analysis. IEEE Trans. Geosci. Remote Sens. 2014, 52, 2759–2772. [Google Scholar] [CrossRef]
- Suchandt, S.; Runge, H.; Suchandt, S. High-Resolution Surface Current Mapping Using TanDEM-X ATI. In Proceedings of the EUSAR 2014; 10th European Conference on Synthetic Aperture Radar, Berlin, Germany, 3–5 June 2014; pp. 1–4. [Google Scholar]
- Romeiser, R. Surface Current Measurements by Spaceborne Along-Track inSAR—terraSAR-X, tanDEM-X, and Future Systems. In Proceedings of the 2015 IEEE/OES Eleveth Current, Waves and Turbulence Measurement (CWTM), St. Petersburg, FL, USA, 2–6 March 2015; IEEE: St. Petersburg, FL, USA, 2015; pp. 1–4. [Google Scholar]
- Qingjun, Z.; Yadong, L. Overview of Chinese First C Band Multi-Polarization SAR Satellite GF-3. Aerosp. China 2017, 18, 22–31. [Google Scholar] [CrossRef]
- Ren, B.; Zhao, L.; Zhu, F. Design of C-band Multi-polarized Active Phased Array Antenna System for GF-3 Satellite. Spacecr. Eng. 2017, 26, 68–74. [Google Scholar]
- Yuan, X.; Lin, M.; Han, B.; Zhao, L.; Wang, W.; Sun, J.; Wang, W. Observing Sea Surface Current by Gaofen-3 Satellite Along-Track Interferometric SAR Experimental Mode. IEEE J. Sel. Top. Appl. Earth Obs. Remote Sens. 2021, 14, 7762–7770. [Google Scholar] [CrossRef]
- S1 Mission. Available online: https://sentiwiki.copernicus.eu/web/s1-mission (accessed on 5 February 2025).
- Sentinel-1C Captures First Radar Images. Available online: https://www.esa.int/Applications/Observing_the_Earth/Copernicus/Sentinel-1/Sentinel-1C_captures_first_radar_images (accessed on 5 February 2025).
- NISAR (NASA-ISRO Synthetic Aperture Radar)—eoPortal. Available online: https://www.eoportal.org/satellite-missions/nisar (accessed on 4 February 2025).
- Work Continues on NISAR Satellite as Mission Looks Toward Launch. Available online: https://nisar.jpl.nasa.gov/news/58/work-continues-on-nisar-satellite-as-mission-looks-toward-launch (accessed on 5 February 2025).
- McDonald, K.; Podest, E.; Steiner, N.; Tesser, D.; Zimmermann, R.; Niessner, A.; Rios, M.; Urquiza, J.D.; Huneini, R.; Downs, B.; et al. NISAR: Seeing Beyond the Trees to Understand Wetlands, Forests and Biodiversity. In Proceedings of the IGARSS 2024—2024 IEEE International Geoscience and Remote Sensing Symposium, Athens, Greece, 7–12 July 2024; pp. 6775–6778. [Google Scholar]
- Zhou, L.; Wang, B.; Wang, Y.; Zhu, Y.; Jiao, Z.; Song, C.; Wang, Z.; Han, D.; Ding, C. Preliminary Process of Airborne Multidimensional Space Joint-observation SAR System. J. Electron. Inf. Technol. 2023, 45, 1243–1253. [Google Scholar] [CrossRef]
- Li, L.; Zhang, F.; Shao, Y.; Wei, Q.; Huang, Q.; Jiao, Y. Airborne SAR Radiometric Calibration Based on Improved Sliding Window Integral Method. Sensors 2022, 22, 320. [Google Scholar] [CrossRef] [PubMed]
- Liu, B.; Zhou, F. Design of a Miniaturized Dual-band Receiver for UAV Platform. Telecommun. Eng. 2016, 56, 629–634. [Google Scholar]
- Lopez-Dekker, P.; Rott, H.; Prats-Iraola, P.; Chapron, B.; Scipal, K.; Witte, E.D. Harmony: An Earth Explorer 10 Mission Candidate to Observe Land, Ice, and Ocean Surface Dynamics. In Proceedings of the IGARSS 2019—2019 IEEE International Geoscience and Remote Sensing Symposium, Yokohama, Japan, 28 July–2 August 2019; IEEE: Yokohama, Japan, 2019; pp. 8381–8384. [Google Scholar] [CrossRef]
- Theodosiou, A.; Kleinherenbrink, M.; Lopez-Dekker, P. Wide-Swath Ocean Topography Using Formation Flying Under Squinted Geometries: The Harmony Mission Case. In Proceedings of the 2021 IEEE International Geoscience and Remote Sensing Symposium IGARSS, Brussels, Belgium, 11–16 July 2021; IEEE: Brussels, Belgium, 2021; pp. 2134–2137. [Google Scholar] [CrossRef]
- Lou, L.; Liu, Z.; Zhang, H.; Qian, F.; Zhang, X. Key technologies of TIANHUI-2 satellite system. Acta Geod. Cartogr. Sin. 2022, 51, 2403–2416. [Google Scholar]
- Bao, Z.; Ma, L.; Ma, H. Analysis of Operation Maintenance and Application of TianHui-2 Satellite. Geomat. Spat. Inf. Technol. 2023, 46, 135–138, 141. [Google Scholar]
- Li, D.; Cao, Y.; Hao, L.; Guan, H. Comparative analysis of DSM extraction accuracy from Tianhui-2 and ZY-3 satellites. Geomat. Spat. Inf. Technol. 2024, 47, 115–118. [Google Scholar]
- “Aerospace HongTu No. 1” Satellite Remote Sensing Image Product Set [EB/OL]. Available online: https://book.yunzhan365.com/gdtl/tojf/mobile/index.html (accessed on 5 February 2025).
- Papathanassiou, K.P.; Cloude, S.R. Polarimetric Effects in Repeat-Pass SAR Interferometry. In Proceedings of the IGARSS’97. 1997 IEEE International Geoscience and Remote Sensing Symposium Proceedings. Remote Sensing—A Scientific Vision for Sustainable Development, Singapore, 3–8 August 1997; Volume 4, pp. 1926–1928. [Google Scholar]
- Cloude, S.R.; Papathanassiou, K.P. Polarimetric SAR interferometry. IEEE Trans. Geosci. Remote Sens. 1998, 36, 1551–1565. [Google Scholar] [CrossRef]
- Tang, F.; Li, Z.; Zhang, Q.; Suo, Z.; Zhang, Z.; Xing, C.; Guo, H. Polarimetric Synthetic Aperture Radar Speckle Filter Based on Joint Similarity Measurement Criterion. Remote Sens. 2023, 15, 5224. [Google Scholar] [CrossRef]
- Kugler, F.; Schulze, D.; Hajnsek, I.; Pretzsch, H.; Papathanassiou, K.P. TanDEM-X Pol-InSAR Performance for Forest Height Estimation. IEEE Trans. Geosci. Remote Sens. 2014, 52, 6404–6422. [Google Scholar] [CrossRef]
- Ma, L.; Zhang, Q.; Liu, J.; Bian, M.; Wang, Z.; Wang, Y. Dual-Frequency Pol-SAR Interferometry Employing Formation Flying Based on Master Satellite and Distributed Small Satellite. In Proceedings of the 2019 6th Asia-Pacific Conference on Synthetic Aperture Radar (APSAR), Xiamen, China, 26–29 November 2019; IEEE: Xiamen, China, 2019; pp. 1–5. [Google Scholar]
- Gierull, C.H.; Sikaneta, I. Potential Marine Moving Target Indication (MMTI) Performance of the RADARSAT Constellation Mission (RCM). In Proceedings of the EUSAR 2012; 9th European Conference on Synthetic Aperture Radar, Nuremberg, Germany, 23–26 April 2012; pp. 404–407. [Google Scholar]
- Fu, W.; Guo, H.; Li, X.; Tian, B.; Sun, Z. Extended Three-Stage Polarimetric SAR Interferometry Algorithm by Dual-Polarization Data. IEEE Trans. Geosci. Remote Sens. 2016, 54, 2792–2802. [Google Scholar] [CrossRef]
- Tai, W.; Chen, X.; Zhang, X.; Cai, M.; Ren, Z.; Wang, L.; Shi, X. Application Test of GF-3 Satellite Image in Land Surface Change Detection. Spacecr. Recover. Remote Sens. 2024, 45, 41. [Google Scholar] [CrossRef]
- Chen, Y.; Li, L.; Liu, G.; Li, Z. Performance of an Effective SAR Polarimetric Calibration Method Using Polarimetric Active Radar Calibrators: Numerical Simulations and LT-1 Experiments. Remote Sens. 2025, 17, 584. [Google Scholar] [CrossRef]
- Xie, Y.; Fu, H.; Zhu, J.; Wang, C.; Xie, Q.; Wan, J.; Han, W. Improved forest height mapping using multibaseline low-frequency PolInSAR data based on effective selection of dual-baseline combinations. Remote Sens. Environ. 2024, 312, 114306. [Google Scholar] [CrossRef]
- Hobbs, S.; Mitchell, C.; Forte, B.; Holley, R.; Snapir, B.; Whittaker, P. System Design for Geosynchronous Synthetic Aperture Radar Missions. IEEE Trans. Geosci. Remote Sens. 2014, 52, 7750–7763. [Google Scholar] [CrossRef]
- Tomiyasu, K. Synthetic Aperture Radar in Geosynchronous Orbit. In Proceedings of the 1978 Antennas and Propagation Society International Symposium, College Park, MD, USA, 15–19 May 1978; Volume 16, pp. 42–45. [Google Scholar]
- Bruno, D.; Hobbs, S.E. Radar Imaging from Geosynchronous Orbit: Temporal Decorrelation Aspects. IEEE Trans. Geosci. Remote Sens. 2010, 48, 2924–2929. [Google Scholar] [CrossRef]
- Monti Guarnieri, A.; Leanza, A.; Recchia, A.; Tebaldini, S.; Venuti, G. Atmospheric Phase Screen in GEO-SAR: Estimation and Compensation. IEEE Trans. Geosci. Remote Sens. 2018, 56, 1668–1679. [Google Scholar] [CrossRef]
- Cai-Pin, L.I.; Ming-Yi, H.E.; Ya-Lin, Z.H.U.; Guang-Ting, L.I.; Bo, L.I.U. Imaging Experiment with Long Integrated Time and Curved Trajectory for Geosynchronous Obit SAR. Chin. Space Sci. Technol. 2015, 35, 17. [Google Scholar] [CrossRef]
- Hu, C.; Chen, Z.; Dong, X.; Cui, C. Multistatic Geosynchronous SAR Resolution Analysis and Grating Lobe Suppression Based on Array Spatial Ambiguity Function. IEEE Trans. Geosci. Remote Sens. 2020, 58, 6020–6038. [Google Scholar] [CrossRef]
- Zhang, Q.; Ni, C.; Dai, C.; Liu, L.; Tang, Z.; Shu, W. System design and key technologies of No.4 land exploration satellite 01. Chin. Space Sci. Technol. 2025, 45, 1–11. [Google Scholar]
- Feng, T.; Zahng, Q.; Lin, K.; Wang, L.; Zhang, Q.; Yang, J.; Xiao, Y. System design of spaceborne large aperture perimeter truss antenna. Chin. Space Sci. Technol. 2025, 45, 24–33. [Google Scholar]
- Aerospace Information Research Institute. “China’s First Very-Low-Orbit SAR Satellite ‘Haishao-1’ Successfully Launched”. AIR, 30 June 2025, p. 1. Available online: http://english.aircas.ac.cn/ne/re/202506/t20250630_1046457.html (accessed on 22 July 2025).
- CCTV News. The 2+2 Low-Orbit Satellite Observation System Initially Formed. CCTV, 8 August 2023, p. 1. Available online: https://content-static.cctvnews.cctv.com/snow-book/index.html?item_id=13053634975484929563 (accessed on 22 July 2025).
- JAXA|First Observation Image of L-Band Synthetic Aperture Radar (PALSAR-3) on Advanced Radar Satellite “DAICHI-4” (ALOS-4) [EB/OL]. Available online: https://www.jaxa.jp/press/2024/07/20240731-1_j.html (accessed on 4 February 2025).
- Zhou, Y.; Wang, W.; Chen, Z.; Wang, P.; Zhang, H.; Qiu, J.; Wang, R. Digital Beamforming Synthetic Aperture Radar (DBSAR): Experiments and Performance Analysis in Support of 16-Channel Airborne X-Band SAR Data. IEEE Trans. Geosci. Remote Sens. 2021, 59, 6784–6798. [Google Scholar] [CrossRef]
- Guo, H.; Ding, Y.; Liu, G. Moon-based Earth observation. Sci. Bull. 2022, 67, 2036–2039. [Google Scholar] [CrossRef] [PubMed]
- Li, H.; Wang, R.; Deng, Y.; Wang, W.; Zhang, H. Analysis of time and beam synchronization errors for distributed spaceborne sar system. J. Radars 2018, 7, 244–253. [Google Scholar] [CrossRef]
- Liang, D.; Liu, K.; Zhang, H.; Deng, Y.; Liu, D.; Chen, Y.; Li, C.; Yue, H.; Wang, R. A High-Accuracy Synchronization Phase-Compensation Method Based on Kalman Filter for Bistatic Synthetic Aperture Radar. IEEE Geosci. Remote Sens. Lett. 2020, 17, 1722–1726. [Google Scholar] [CrossRef]
- Xu, M.; Chen, L.; Shi, H.; Yang, Z.; Li, J.; Long, T. FPGA-Based Implementation of Ship Detection for Satellite On-Board Processing. IEEE J. Sel. Top. Appl. Earth Obs. Remote Sens. 2022, 15, 9733–9745. [Google Scholar] [CrossRef]
- García, L.P.; Furano, G.; Ghiglione, M.; Zancan, V.; Imbembo, E.; Ilioudis, C.; Clemente, C.; Trucco, P. Advancements in Onboard Processing of Synthetic Aperture Radar (SAR) Data: Enhancing Efficiency and Real-Time Capabilities. IEEE J. Sel. Top. Appl. Earth Obs. Remote Sens. 2024, 17, 16625–16645. [Google Scholar] [CrossRef]
- Flordal, O.; Gollin, N.; Jäger, M.; Kollias, V.; Martone, M.; Naghmouchi, J.; Persson, M.; Pedersen, S.; Pogkas, N.; Scheiber, R.; et al. Smart On-board Processing for Next Generation SAR Payloads. In Proceedings of the EUSAR 2024; 15th European Conference on Synthetic Aperture Radar, Munich, Germany, 23–26 April 2024; pp. 606–610. [Google Scholar]

| Geophysical Phenomenon | Process Classification | Spatial Scale/km | Deformation Scale/mm | |||
|---|---|---|---|---|---|---|
| Instantaneous | Slow | Reversible | Irreversible | |||
| Active volcano rises or sinks | — 1 | ✓ 2 | ✓ | — | <20 | <5 |
| Volcanic eruption | ✓ | — | — | ✓ | <20 | >50 |
| Earthquake co-seismic deformation | ✓ | — | — | ✓ | 50~100 | >50 |
| Deformation before and after earthquake | — | ✓ | — | ✓ | 50~100 | <5 |
| Crustal fault movement | — | ✓ | — | ✓ | >20 | <5 |
| Surface settlement | — | ✓ | — | ✓ | 0.5~20 | 1~20/a |
| Mining subsidence | ✓ | — | — | ✓ | 0.1~10 | 1~100/d |
| Landslide (foreboding) | — | ✓ | — | ✓ | 1~20 | 1 |
| Landslide (eruption) | ✓ | — | — | ✓ | 1~20 | >1000 |
| Measurement | Precision Level | GNSS | D-InSAR |
|---|---|---|---|
| Spatial coverage | Discrete point | Discrete point | Surface covering |
| Accuracy | mm | mm | mm |
| Periodic velocity | Long and slow | Short and fast | Short and fast |
| Operating condition | According to the weather | All-weather | All-weather |
| Cost | High | higher | low |
| InSAR Technology | Advantages | Disadvantages | Accuracy |
|---|---|---|---|
| D-InSAR | Easy processing. Suitable for deformation monitoring in a small area. | Two or more high-quality SAR images are required. Low sensitivity. Not suitable for large-scale deformation monitoring and non-linear changes in surface deformation. | 1~2 cm/a |
| SBAS-InSAR | High monitoring accuracy. Suitable for medium-range deformation monitoring. | A large amount of SAR data is required. Complex processing. Sensitive to the choice of baseline and requires caution. | 2~5 mm/a |
| PS-InSAR | High precision and high sensitivity. Suitable for the monitoring of complex terrain and non-linear deformation. Stable surface targets such as buildings, telecommunication towers, etc., can be detected. | Complex processing. A large amount of SAR data is required. High requirements for the stability of ground objects. | 0.5~1 mm/a |
| DEM Acquisition Technique | Coverage | DEM Accuracy |
|---|---|---|
| Ground | Local, large-scale mapping range | 0.01~0.1 m |
| Airborne photogrammetry | Region | 0.1~1 m |
| Airborne lidar | Region | 0.5~2 m |
| InSAR | Regional to global | 1~20 m |
| Shadow mapping | Regional to global | Slope ≤ 2°, 22 m |
| Stereo mapping | Region | 10~100 m |
| Requirement | Specification | DTED-2 | HRTI-3 |
|---|---|---|---|
| Relative vertical accuracy | 90% linear point-to-point | 12 m (slope < 20%) | 2 m (slope < 20%) |
| error over a 1° × 1° cell | 15 m (slope > 20%) | 4 m (slope > 20%) | |
| Absolute vertical accuracy | 90% linear error | 18 m | 10 m |
| Relative horizontal | 90% circular error | 15 m | 3 m |
| Horizontal accuracy | 90% circular error | 23 m | 10 m |
| Spatial resolution | independent pixels | 30 m (1 arc sec at equator) | 12 m (0.4 arc sec at equator) |
Disclaimer/Publisher’s Note: The statements, opinions and data contained in all publications are solely those of the individual author(s) and contributor(s) and not of MDPI and/or the editor(s). MDPI and/or the editor(s) disclaim responsibility for any injury to people or property resulting from any ideas, methods, instructions or products referred to in the content. |
© 2025 by the authors. Licensee MDPI, Basel, Switzerland. This article is an open access article distributed under the terms and conditions of the Creative Commons Attribution (CC BY) license (https://creativecommons.org/licenses/by/4.0/).
Share and Cite
Zhang, Q.; Fan, H.; Qin, Y.; Zhou, Y. Advances in Interferometric Synthetic Aperture Radar Technology and Systems and Recent Advances in Chinese SAR Missions. Sensors 2025, 25, 4616. https://doi.org/10.3390/s25154616
Zhang Q, Fan H, Qin Y, Zhou Y. Advances in Interferometric Synthetic Aperture Radar Technology and Systems and Recent Advances in Chinese SAR Missions. Sensors. 2025; 25(15):4616. https://doi.org/10.3390/s25154616
Chicago/Turabian StyleZhang, Qingjun, Huangjiang Fan, Yuxiao Qin, and Yashi Zhou. 2025. "Advances in Interferometric Synthetic Aperture Radar Technology and Systems and Recent Advances in Chinese SAR Missions" Sensors 25, no. 15: 4616. https://doi.org/10.3390/s25154616
APA StyleZhang, Q., Fan, H., Qin, Y., & Zhou, Y. (2025). Advances in Interferometric Synthetic Aperture Radar Technology and Systems and Recent Advances in Chinese SAR Missions. Sensors, 25(15), 4616. https://doi.org/10.3390/s25154616