

An Ensemble-Based AI Approach for Continuous Blood Pressure Estimation in Health Monitoring Applications


Abstract
1. Introduction
2. Materials and Methods
2.1. Data Source
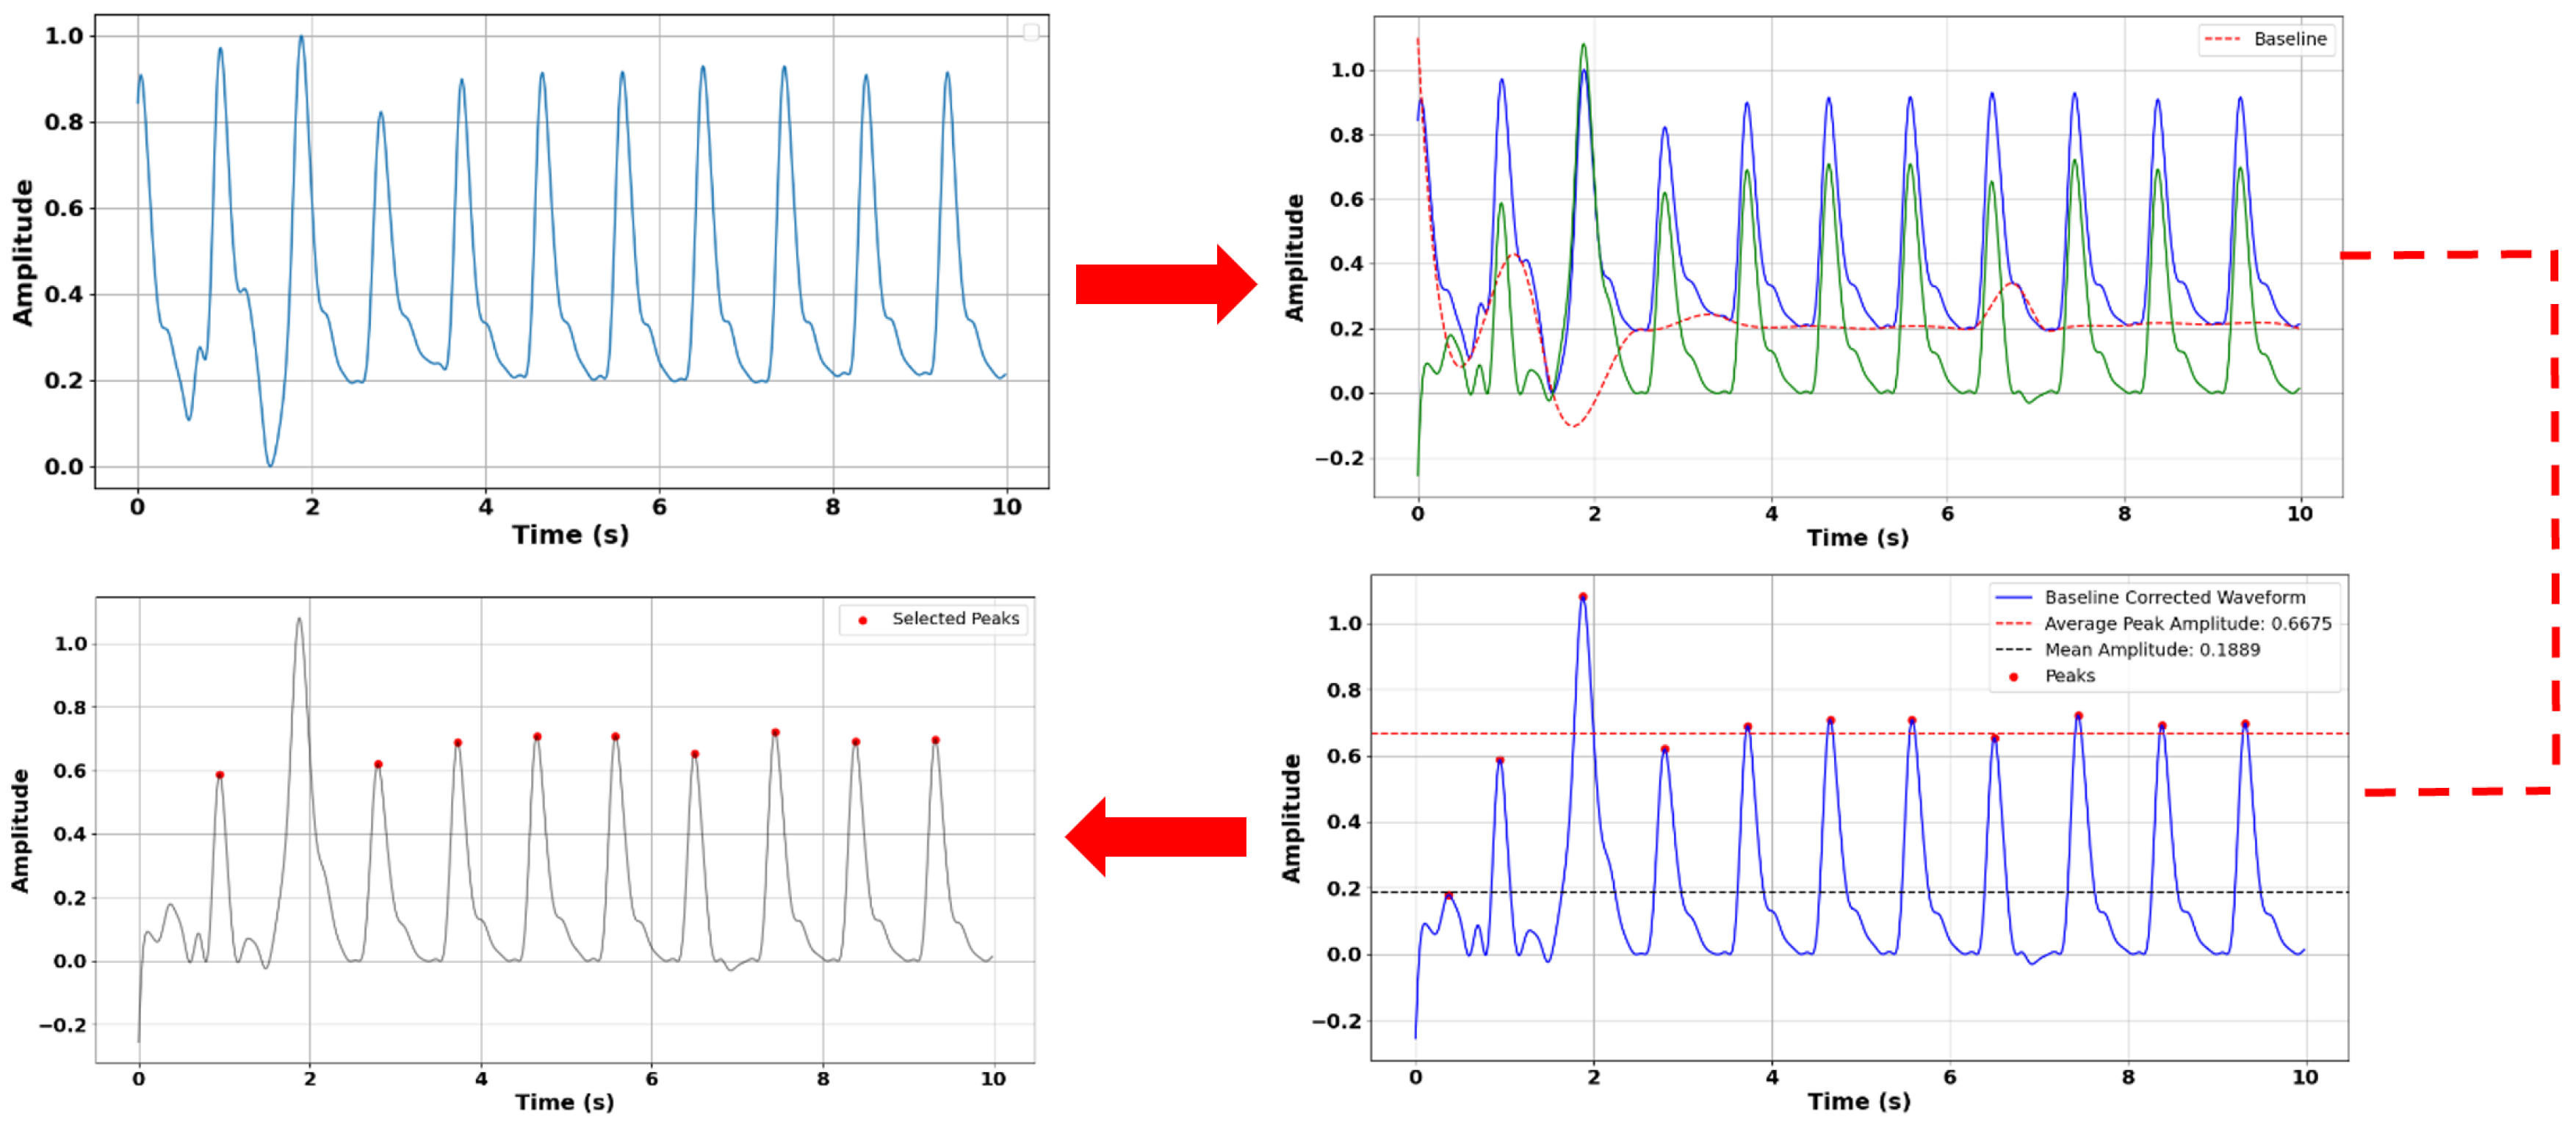
2.2. Preprocessing
2.3. Overview of Proposed Network Architecture
2.4. Experimental Details
3. Results
3.1. Clinical-Grade Accuracy: Compliance with AAMI and BHS Standards
3.2. Consistent Performance Across Diverse Subject Groups
3.3. Comparative Analysis: Individual Models vs. the Integrated Model
3.4. Comparative Analysis: Our Model vs. Other ML Approaches
3.5. Constraints and Proposed Solutions
4. Conclusions
Author Contributions
Funding
Institutional Review Board Statement
Informed Consent Statement
Data Availability Statement
Conflicts of Interest
References
- World Health Organization; 2018. Available online: https://www.who.int/news-room/fact-sheets/detail/cardiovasculardiseases-(cvds) (accessed on 19 July 2025).
- Mancia, G.; Verdecchia, P. Clinical value of ambulatory blood pressure: Evidence and limits. Circ. Res. 2015, 116, 1034–1045. [Google Scholar] [CrossRef] [PubMed]
- Berta, E.; Lengyel, I.; Halmi, S.; Zrínyi, M.; Erdei, A.; Harangi, M.; Páll, D.; Nagy, E.V.; Bodor, M. Hypertension in thyroid disorders. Front. Endocrinol. 2019, 10, 482. [Google Scholar] [CrossRef] [PubMed]
- Bolte, A.C.; van Geijn, H.P.; Dekker, G.A. Management and monitoring of severe preeclampsia. Eur. J. Obstet. Gynecol. Reprod. Biol. 2001, 96, 8–20. [Google Scholar] [CrossRef] [PubMed]
- Hermida, R.C. Sleep-time ambulatory blood pressure as a prognostic marker of vascular and other risks and therapeutic target for prevention by hypertension chronotherapy: Rationale and design of the Hygia Project. Chronobiol. Int. 2016, 33, 906–936. [Google Scholar] [CrossRef] [PubMed]
- Shahimi, N.H.; Lim, R.; Mat, S.; Goh, C.H.; Tan, M.P.; Lim, E. Association between mental illness and blood pressure variability: A systematic review. Biomed. Eng. Online 2022, 21, 19. [Google Scholar] [CrossRef] [PubMed]
- Haque, Y.; Zawad, R.S.; Rony, C.S.A.; Al Banna, H.; Ghosh, T.; Kaiser, M.S.; Mahmud, M. State-of-the-art of stress prediction from heart rate variability using artificial intelligence. Cogn. Comput. 2024, 16, 455–481. [Google Scholar] [CrossRef]
- Hsu, Y.C.; Li, Y.H.; Chang, C.C.; Harfiya, L.N. Generalized deep neural network model for cuffless blood pressure estimation with photoplethysmogram signal only. Sensors 2020, 20, 5668. [Google Scholar] [CrossRef] [PubMed]
- O’brien, E.; Waeber, B.; Parati, G.; Staessen, J.; Myers, M.G. Blood pressure measuring devices: Recommendations of the European Society of Hypertension. BMJ 2001, 322, 531–536. [Google Scholar] [CrossRef] [PubMed]
- O’Brien, E.; Petrie, J.; Littler, W.; de Swiet, M.; Padfield, P.L.; O’Malley, K.; Jamieson, M.; Altman, D.; Bland, M.; Atkins, N. The British Hypertension Society protocol for the evaluation of automated and semi-automated blood pressure measuring devices with special reference to ambulatory systems. J. Hypertens. 1990, 8, 607–619. [Google Scholar] [CrossRef] [PubMed]
- Li, Y.H.; Harfiya, L.N.; Purwandari, K.; Lin, Y.D. Real-time cuffless continuous blood pressure estimation using deep learning model. Sensors 2020, 20, 5606. [Google Scholar] [CrossRef] [PubMed]
- Kachuee, M.; Kiani, M.M.; Mohammadzade, H.; Shabany, M. Cuff-less high-accuracy calibration-free blood pressure estimation using pulse transit time. In Proceedings of the 2015 IEEE International Symposium on Circuits and Systems (ISCAS), Lisbon, Portugal, 24–27 May 2015; IEEE: Toulouse, France, 2015; pp. 1006–1009. [Google Scholar]
- Kachuee, M.; Kiani, M.M.; Mohammadzade, H.; Shabany, M. Cuffless blood pressure estimation algorithms for continuous health-care monitoring. IEEE Trans. Biomed. Eng. 2016, 64, 859–869. [Google Scholar] [CrossRef] [PubMed]
- Sible, I.J.; Yoo, H.J.; Min, J.; Nashiro, K.; Chang, C.; Nation, D.A.; Mather, M. Short-term blood pressure variability is inversely related to regional amplitude of low frequency fluctuations in older and younger adults. Aging Brain 2023, 4, 100085. [Google Scholar] [CrossRef] [PubMed]
- Mejía-Mejía, E.; Budidha, K.; Abay, T.Y.; May, J.M.; Kyriacou, P.A. Heart rate variability (HRV) and pulse rate variability (PRV) for the assessment of autonomic responses. Front. Physiol. 2020, 11, 779. [Google Scholar] [CrossRef] [PubMed]
- Gupta, S.; Singh, A.; Sharma, A. Exploiting moving slope features of PPG derivatives for estimation of mean arterial pressure. Biomed. Eng. Lett. 2023, 13, 1–9. [Google Scholar] [CrossRef] [PubMed]
- Hossain Chowdhury, M.; Nazmul Islam Shuzan, M.; Chowdhury, M.E.; Mahbub, Z.B.; Monir Uddin, M.; Khandakar, A.; Ibne Reaz, M.B. Estimating Blood Pressure from Photoplethysmogram Signal and Demographic Features using Machine Learning Techniques. arXiv 2020. [Google Scholar] [CrossRef]
- Liu, I.S.C.; Liu, F.; Zhong, Q.; Ni, S. A finger on the pulse of cardiovascular health: Estimating blood pressure with smartphone photoplethysmography-based pulse waveform analysis. BioMedical Eng. OnLine 2025, 24, 36. [Google Scholar] [CrossRef] [PubMed]
- Wang, W.; Mohseni, P.; Kilgore, K.L.; Najafizadeh, L. PulseDB: A large, cleaned dataset based on MIMIC-III and VitalDB for benchmarking cuff-less blood pressure estimation methods. Front. Digit. Health 2023, 4, 1090854. [Google Scholar] [CrossRef] [PubMed]
- Lee, J.; Yang, S.; Lee, S.; Kim, H.C. Analysis of pulse arrival time as an indicator of blood pressure in a large surgical biosignal database: Recommendations for developing ubiquitous blood pressure monitoring methods. J. Clin. Med. 2019, 8, 1773. [Google Scholar] [CrossRef] [PubMed]
- Gregg, J.T.; Moore, J.H. STAR_outliers: A python package that separates univariate outliers from non-normal distributions. BioData Min. 2023, 16, 25. [Google Scholar] [CrossRef] [PubMed]
- Amri, T.C.; Sarno, R.; Abdillah, R.; Haq, F.A.; Septiyanto, A.F.; Sunaryono, D. Filter Validation for Detecting Outliers of Photoplethysmograph Data. In Proceedings of the 2023 International Conference on Artificial Intelligence in Information and Communication (ICAIIC), Bali, Indonesia, 20–23 February 2023; IEEE: Toulouse, France, 2023; pp. 012–017. [Google Scholar]
- Walker, M. Python Data Cleaning Cookbook: Modern Techniques and Python Tools to Detect and Remove Dirty Data and Extract Key Insights; Packt Publishing Ltd.: Birmingham, UK, 2020. [Google Scholar]
- Lin, W.H.; Li, X.; Li, Y.; Li, G.; Chen, F. Investigating the physiological mechanisms of the photoplethysmogram features for blood pressure estimation. Physiol. Meas. 2020, 41, 044003. [Google Scholar] [CrossRef] [PubMed]
- Haddad, S.; Boukhayma, A.; Caizzone, A. Continuous PPG-based blood pressure monitoring using multi-linear regression. IEEE J. Biomed. Health Inform. 2021, 26, 2096–2105. [Google Scholar] [CrossRef] [PubMed]
- Huang, X.; Khetan, A.; Cvitkovic, M.; Karnin, Z. Tabtransformer: Tabular data modeling using contextual embeddings. arXiv 2020. [Google Scholar] [CrossRef]
- Xia, H.; Ramezani, R. Analyzing the performance of TabTransformer in brain stroke prediction. J. Stud. Res 2023, 12, 28. [Google Scholar] [CrossRef]
- Cholakov, R.; Kolev, T. The GatedTabTransformer. An enhanced deep learning architecture for tabular modeling. arXiv 2022, arXiv:2201.00199. [Google Scholar]
- Zhang, B.; Ren, J.; Cheng, Y.; Wang, B.; Wei, Z. Health data driven on continuous blood pressure prediction based on gradient boosting decision tree algorithm. IEEE Access 2019, 7, 32423–32433. [Google Scholar] [CrossRef]
- Liu, Z.D.; Li, Y.; Zhang, Y.T.; Zeng, J.; Chen, Z.X.; Liu, J.K.; Miao, F. HGCTNet: Handcrafted feature-guided CNN and transformer network for wearable cuffless blood pressure measurement. IEEE J. Biomed. Health Inform. 2024, 28, 3882–3894. [Google Scholar] [CrossRef] [PubMed]
- Chen, J.; Geng, X.; Yao, F.; Liao, X.; Zhang, Y.; Wang, Y. Single-cycle pulse signal recognition based on one-dimensional deep convolutional neural network. Electronics 2024, 13, 511. [Google Scholar] [CrossRef]
- Prokhorenkova, L.; Gusev, G.; Vorobev, A.; Dorogush, A.V.; Gulin, A. CatBoost: Unbiased boosting with categorical features. Adv. Neural Inf. Process. Syst. 2018, 31, 6639–6649. [Google Scholar]
- Chen, T.; Guestrin, C. Xgboost: A scalable tree boosting system. In Proceedings of the 22nd ACM Sigkdd International Conference on Knowledge Discovery and Data Mining, San Francisco, CA, USA, 13–17 August 2016; pp. 785–794. [Google Scholar]
- Ke, G.; Meng, Q.; Finley, T.; Wang, T.; Chen, W.; Ma, W.; Ye, Q.; Liu, T.Y. LightGBM: A Highly Efficient Gradient Boosting Decision Tree. In Proceedings of the Advances in Neural Information Processing Systems, Long Beach, CA, USA, 4–9 December 2017; Guyon, I., Luxburg, U.V., Bengio, S., Wallach, H., Fergus, R., Vishwanathan, S., Garnett, R., Eds.; Curran Associates, Inc.: Red Hook, NY, USA, 2017; Volume 30. [Google Scholar]
- Friedman, J.H. Greedy function approximation: A gradient boosting machine. Ann. Stat. 2001, 29, 1189–1232. [Google Scholar] [CrossRef]
- Mousavi, S.S.; Hemmati, M.; Charmi, M.; Moghadam, M.; Firouzmand, M.; Ghorbani, Y. Cuff-Less blood pressure estimation using only the ecg signal in frequency domain. In Proceedings of the 2018 8th International Conference on Computer and Knowledge Engineering (ICCKE), Mashhad, Iran, 25–26 October 2018; IEEE: Toulouse, France, 2018; pp. 147–152. [Google Scholar]
- Zhang, Y.; Feng, Z. A SVM method for continuous blood pressure estimation from a PPG signal. In Proceedings of the 9th International Conference on Machine Learning and Computing, Singapore, 24–26 February 2017; pp. 128–132. [Google Scholar]
- Rong, M.; Li, K. A blood pressure prediction method based on imaging photoplethysmography in combination with machine learning. Biomed. Signal Process. Control 2021, 64, 102328. [Google Scholar] [CrossRef]
- Figini, V.; Galici, S.; Russo, D.; Centonze, I.; Visintin, M.; Pagana, G. Improving cuff-less continuous blood pressure estimation with linear regression analysis. Electronics 2022, 11, 1442. [Google Scholar] [CrossRef]
- Fati, S.M.; Muneer, A.; Akbar, N.A.; Taib, S.M. A continuous cuffless blood pressure estimation using tree-based pipeline optimization tool. Symmetry 2021, 13, 686. [Google Scholar] [CrossRef]
- Slapničar, G.; Mlakar, N.; Luštrek, M. Blood pressure estimation from photoplethysmogram using a spectro-temporal deep neural network. Sensors 2019, 19, 3420. [Google Scholar] [CrossRef] [PubMed]
- Sanches, I.; Gomes, V.V.; Caetano, C.; Cabrera, L.S.; Cene, V.H.; Beltrame, T.; Lee, W.; Baek, S.; Penatti, O.A. MIMIC-BP: A curated dataset for blood pressure estimation. Sci. Data 2024, 11, 1233. [Google Scholar] [CrossRef] [PubMed]
- Ibtehaz, N.; Mahmud, S.; Chowdhury, M.E.; Khandakar, A.; Ayari, M.A.; Tahir, A.; Rahman, M.S. Ppg2abp: Translating photoplethysmogram (ppg) signals to arterial blood pressure (abp) waveforms using fully convolutional neural networks. arXiv 2020, arXiv:2005.01669. [Google Scholar]
- El-Hajj, C.; Kyriacou, P.A. Cuffless blood pressure estimation from PPG signals and its derivatives using deep learning models. Biomed. Signal Process. Control 2021, 70, 102984. [Google Scholar] [CrossRef]
- Kim, D.K.; Kim, Y.T.; Kim, H.; Kim, D.J. Deepcnap: A deep learning approach for continuous noninvasive arterial blood pressure monitoring using photoplethysmography. IEEE J. Biomed. Health Inform. 2022, 26, 3697–3707. [Google Scholar] [CrossRef] [PubMed]


| Feature | Std Dev | Mean | Median | Min. | Max. |
|---|---|---|---|---|---|
| SBP | 114.61 | 23.07 | 113.0 | 50 | 207 |
| DBP | 62.73 | 14.66 | 62.0 | 30 | 172 |
| Age | 59.33 | 14.52 | 61.0 | 8 | 91 |
| Group | Number of Subj. | Training Set | Test Set | Validation Set |
|---|---|---|---|---|
| 1 | 1000 | 700 | 150 | 150 |
| 2 | 900 | 700 | 100 (Female) | 100 |
| 3 | 900 | 700 | 100 (Male) | 100 |
| 4 | 270 | 150 | 20 (BMI ≥ 25) | 100 |
| Group | Score SBP | Score DBP | Avg. RMSE SBP | Avg. RMSE DBP | MAE (SBP) (mmHg) | MAE (DBP) (mmHg) |
|---|---|---|---|---|---|---|
| 1 | 0.9393 | 0.9181 | 5.56 | 3.90 | 3.87 | 2.50 |
| 2 | 0.9347 | 0.9276 | 5.73 | 3.65 | 4.07 | 2.39 |
| 3 | 0.9379 | 0.9190 | 5.61 | 3.86 | 3.87 | 2.66 |
| 4 | 0.9411 | 0.9126 | 4.52 | 3.65 | 1.55 | 1.43 |
| Methods | R2 SBP | R2 DBP | MAE SBP (mmHg) | MAE DBP (mmHg) |
|---|---|---|---|---|
| CatBoost | 0.9171 | 0.9192 | 3.88 | 2.69 |
| XGBoost | 0.9052 | 0.9128 | 3.59 | 3.56 |
| LightGBM | 0.9073 | 0.9251 | 3.89 | 2.81 |
| Tab-Transformer | 0.9116 | 0.9120 | 3.91 | 3.34 |
| Our proposed ensemble model | 0.9393 | 0.9181 | 3.87 | 2.50 |
| Methods | Score | MAE (mmHg) | ||
|---|---|---|---|---|
| SBP | DBP | SBP | DBP | |
| Random Forest Regression | 0.8804 | 0.8946 | 5.8936 | 3.4093 |
| Extreme Gradient Boosting | 0.8976 | 0.8980 | 5.6991 | 5.3725 |
| LS Boosting | 0.9502 | 0.9622 | 3.93 | 3.03 |
| Our Hierarchical Transformer-Boosted Model (HTBM) | 0.9393 | 0.9181 | 3.87 | 2.50 |
| Dataset | Methods | Number of Subjects | MAE (mmHg) | BHS Grade | AAMI Status | Ref. | |
|---|---|---|---|---|---|---|---|
| SBP | DBP | ||||||
| MIMIC II | Random Forest Regression | 441 | 12.75 | 6.04 | A (DBP), D (SBP) | DBP Pass | [36] |
| MIMIC II | Long-term Recurrent Convolutional Network | 510 | 9.43 | 6.88 | Grade C | Fail | [41] |
| MIMIC II | Residual Network with 152 layers | 942 | 12.98 | 8.78 | Fail | Fail | [42] |
| Queensland and MIMIC II | KNN + Category-Wise Regression Tree | 282 | 7.1 | 6.0 | B (SBP), A (DBP) | Pass | [13] |
| MIMIC II | U-shaped Convolutional Neural Network | 942 | 5.73 | 3.45 | A(DBP) | DBP Pass | [43] |
| MIMIC II | BiLSTM + LSTM + Attention | 942 | 4.51 | 2.60 | B (SBP), A (DBP) | Pass | [44] |
| MIMIC II | Support Vector Machine | 1000 | 12.38 | 6.34 | B (DBP) | Fail | [12] |
| Pulse-DB-Vital | Our Proposed Model | 1000 | 3.87 | 2.50 | A (SBP, DBP) | Pass | This work |
Disclaimer/Publisher’s Note: The statements, opinions and data contained in all publications are solely those of the individual author(s) and contributor(s) and not of MDPI and/or the editor(s). MDPI and/or the editor(s) disclaim responsibility for any injury to people or property resulting from any ideas, methods, instructions or products referred to in the content. |
© 2025 by the authors. Licensee MDPI, Basel, Switzerland. This article is an open access article distributed under the terms and conditions of the Creative Commons Attribution (CC BY) license (https://creativecommons.org/licenses/by/4.0/).
Share and Cite
Haque, R.; Wang, C.; Pala, N. An Ensemble-Based AI Approach for Continuous Blood Pressure Estimation in Health Monitoring Applications. Sensors 2025, 25, 4574. https://doi.org/10.3390/s25154574
Haque R, Wang C, Pala N. An Ensemble-Based AI Approach for Continuous Blood Pressure Estimation in Health Monitoring Applications. Sensors. 2025; 25(15):4574. https://doi.org/10.3390/s25154574
Chicago/Turabian StyleHaque, Rafita, Chunlei Wang, and Nezih Pala. 2025. "An Ensemble-Based AI Approach for Continuous Blood Pressure Estimation in Health Monitoring Applications" Sensors 25, no. 15: 4574. https://doi.org/10.3390/s25154574
APA StyleHaque, R., Wang, C., & Pala, N. (2025). An Ensemble-Based AI Approach for Continuous Blood Pressure Estimation in Health Monitoring Applications. Sensors, 25(15), 4574. https://doi.org/10.3390/s25154574