


Medical Data over Sound—CardiaWhisper Concept
 , , , , and
Abstract

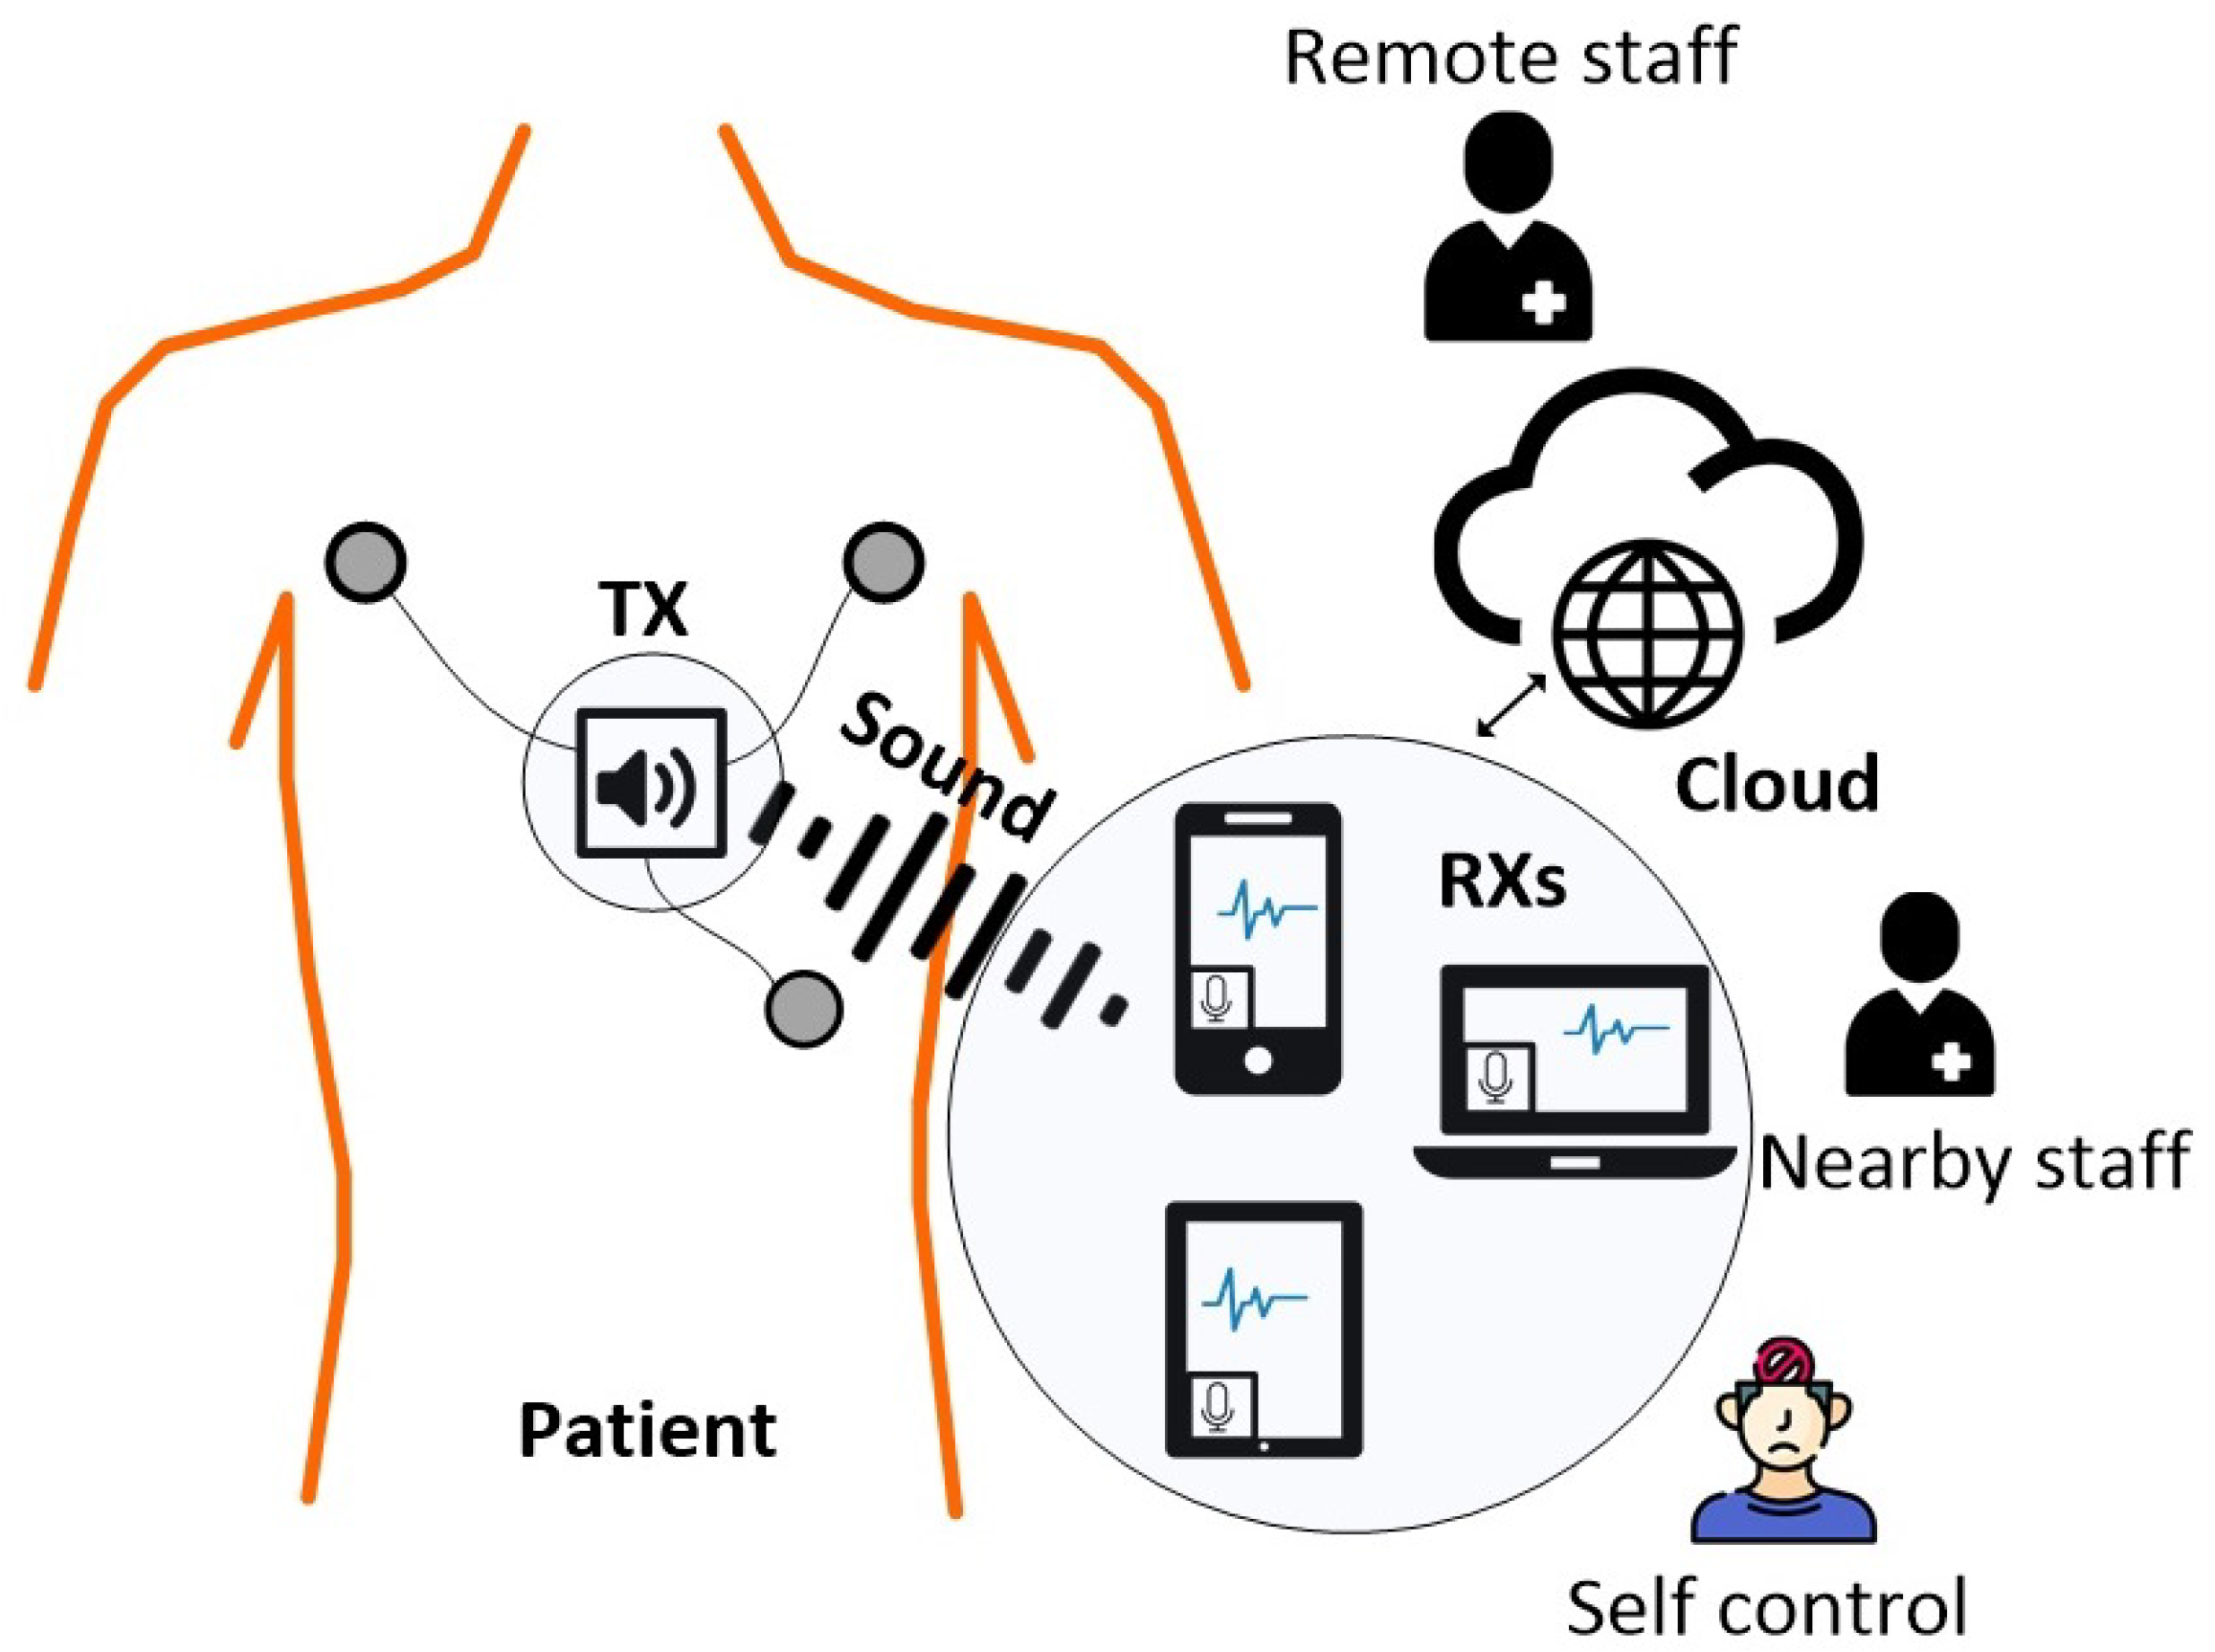
1. Introduction
2. Methodology
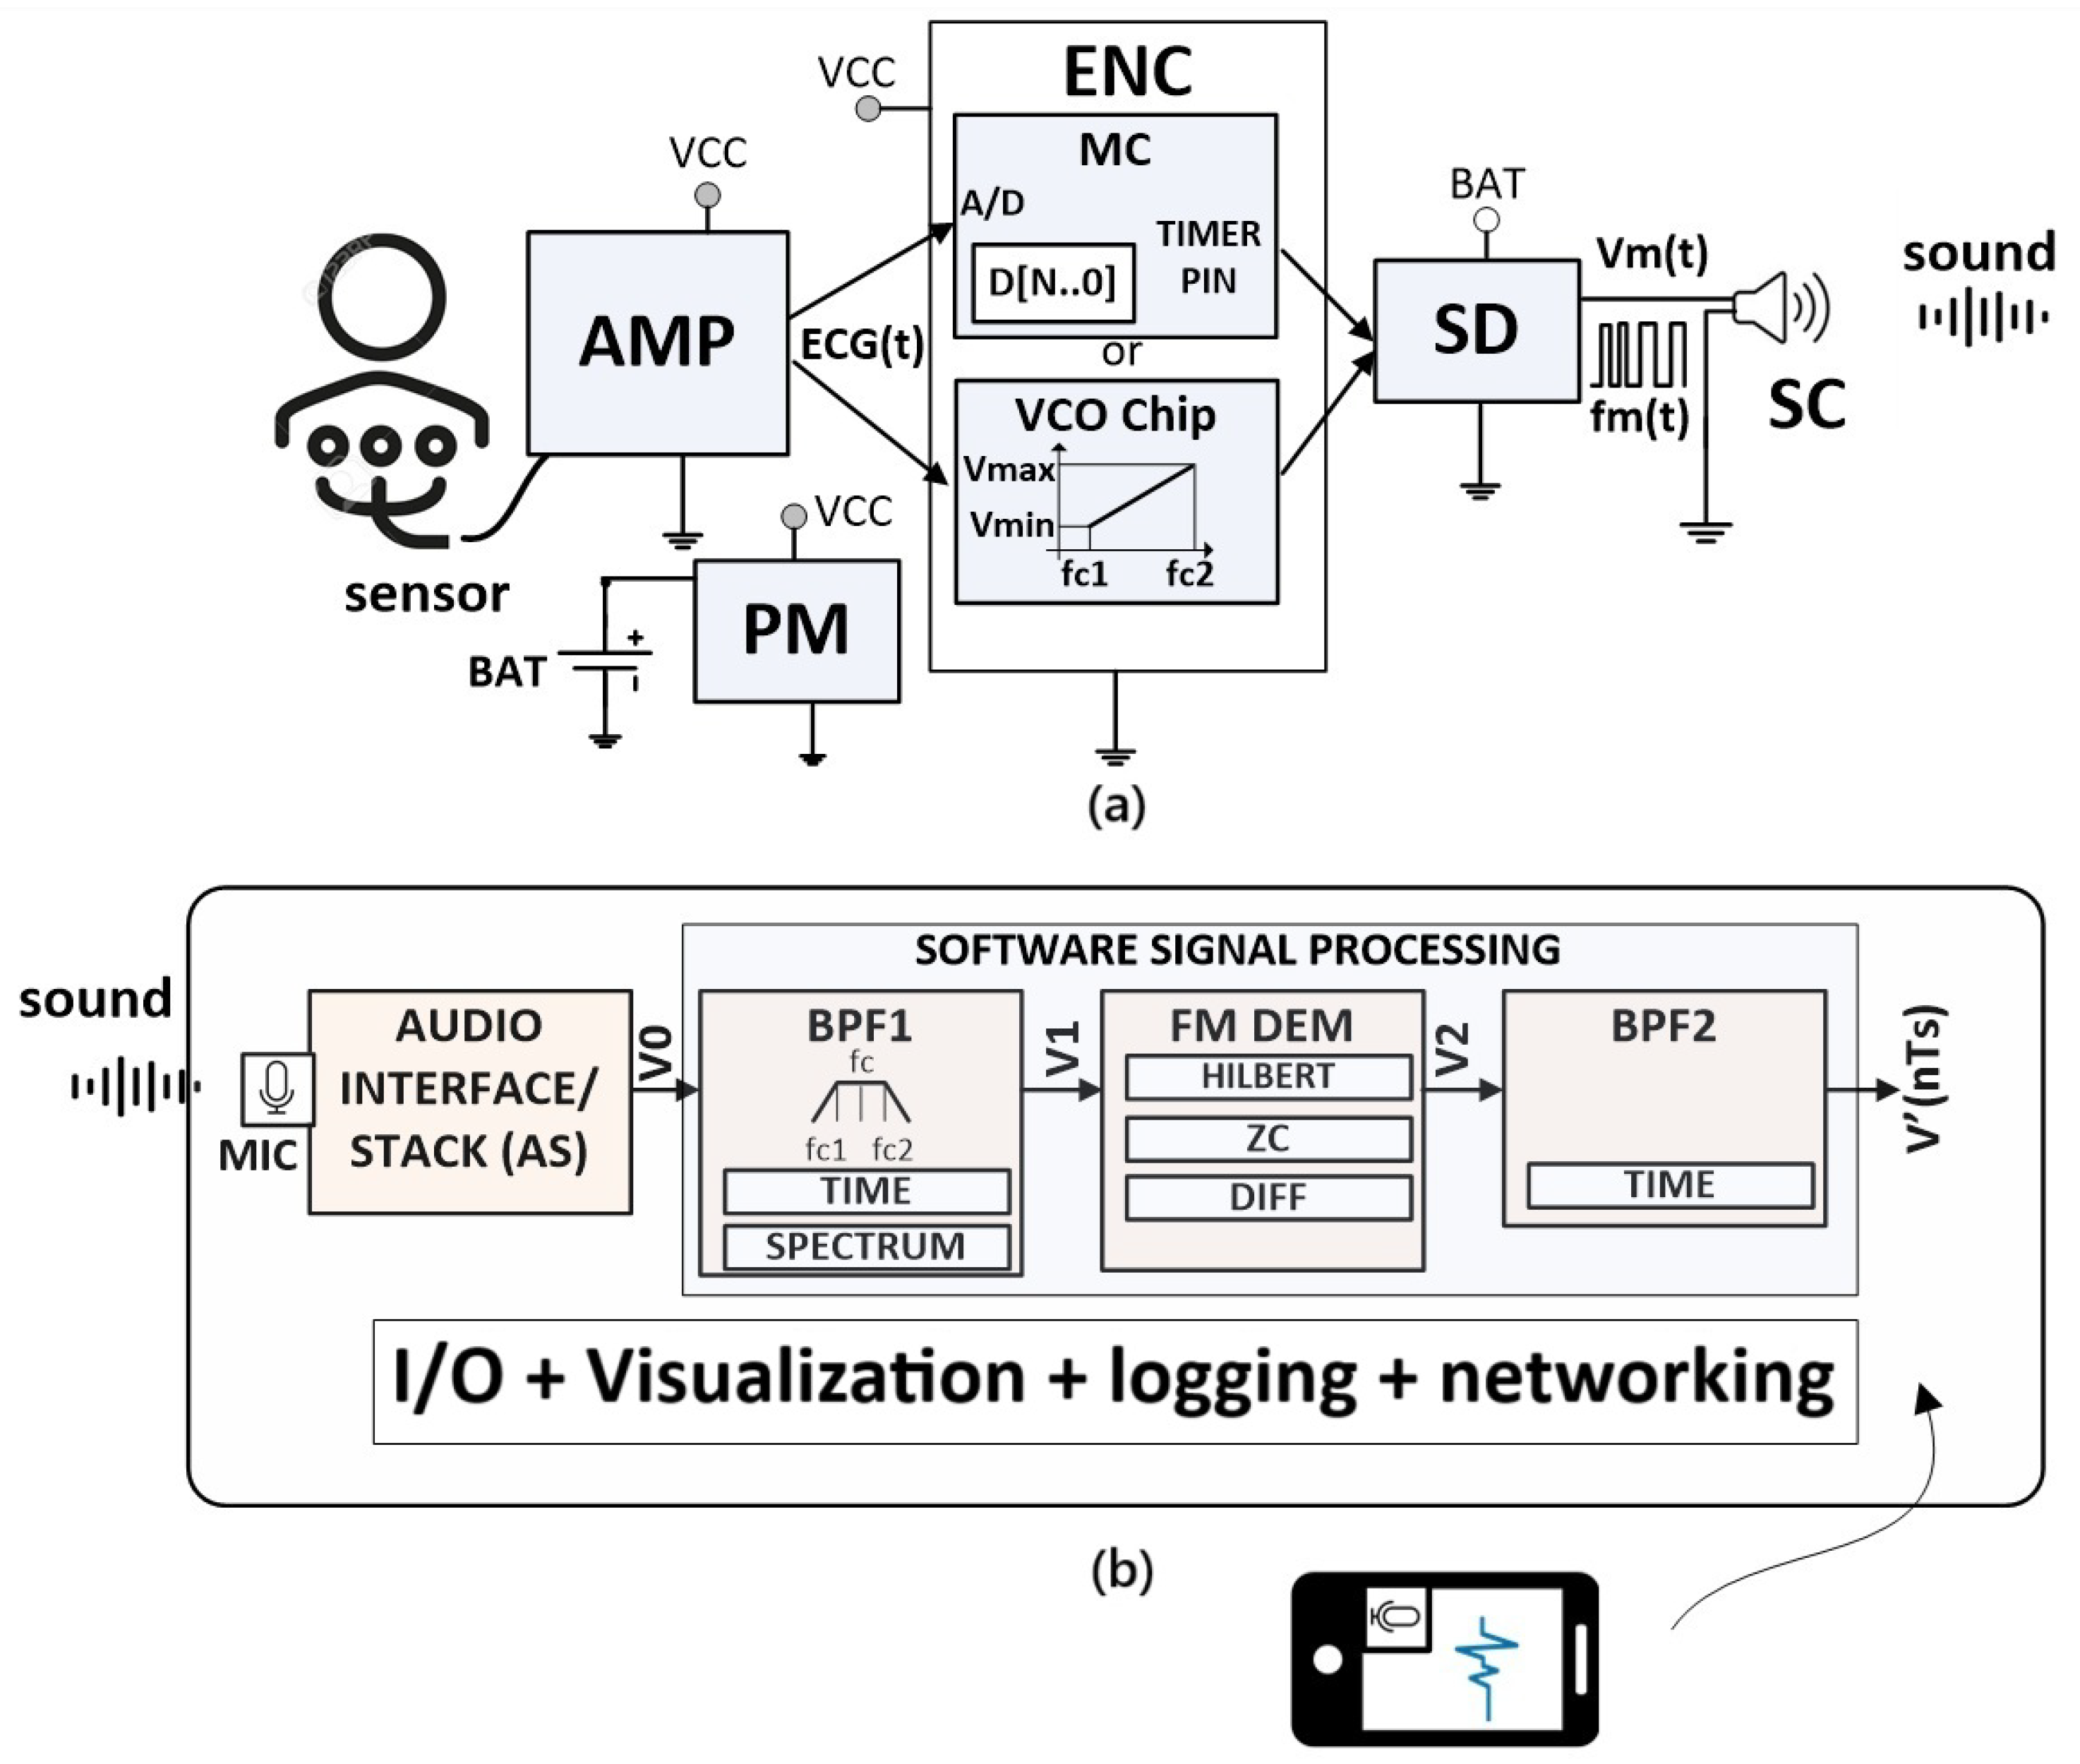
2.1. Transmitter
2.2. Receiver
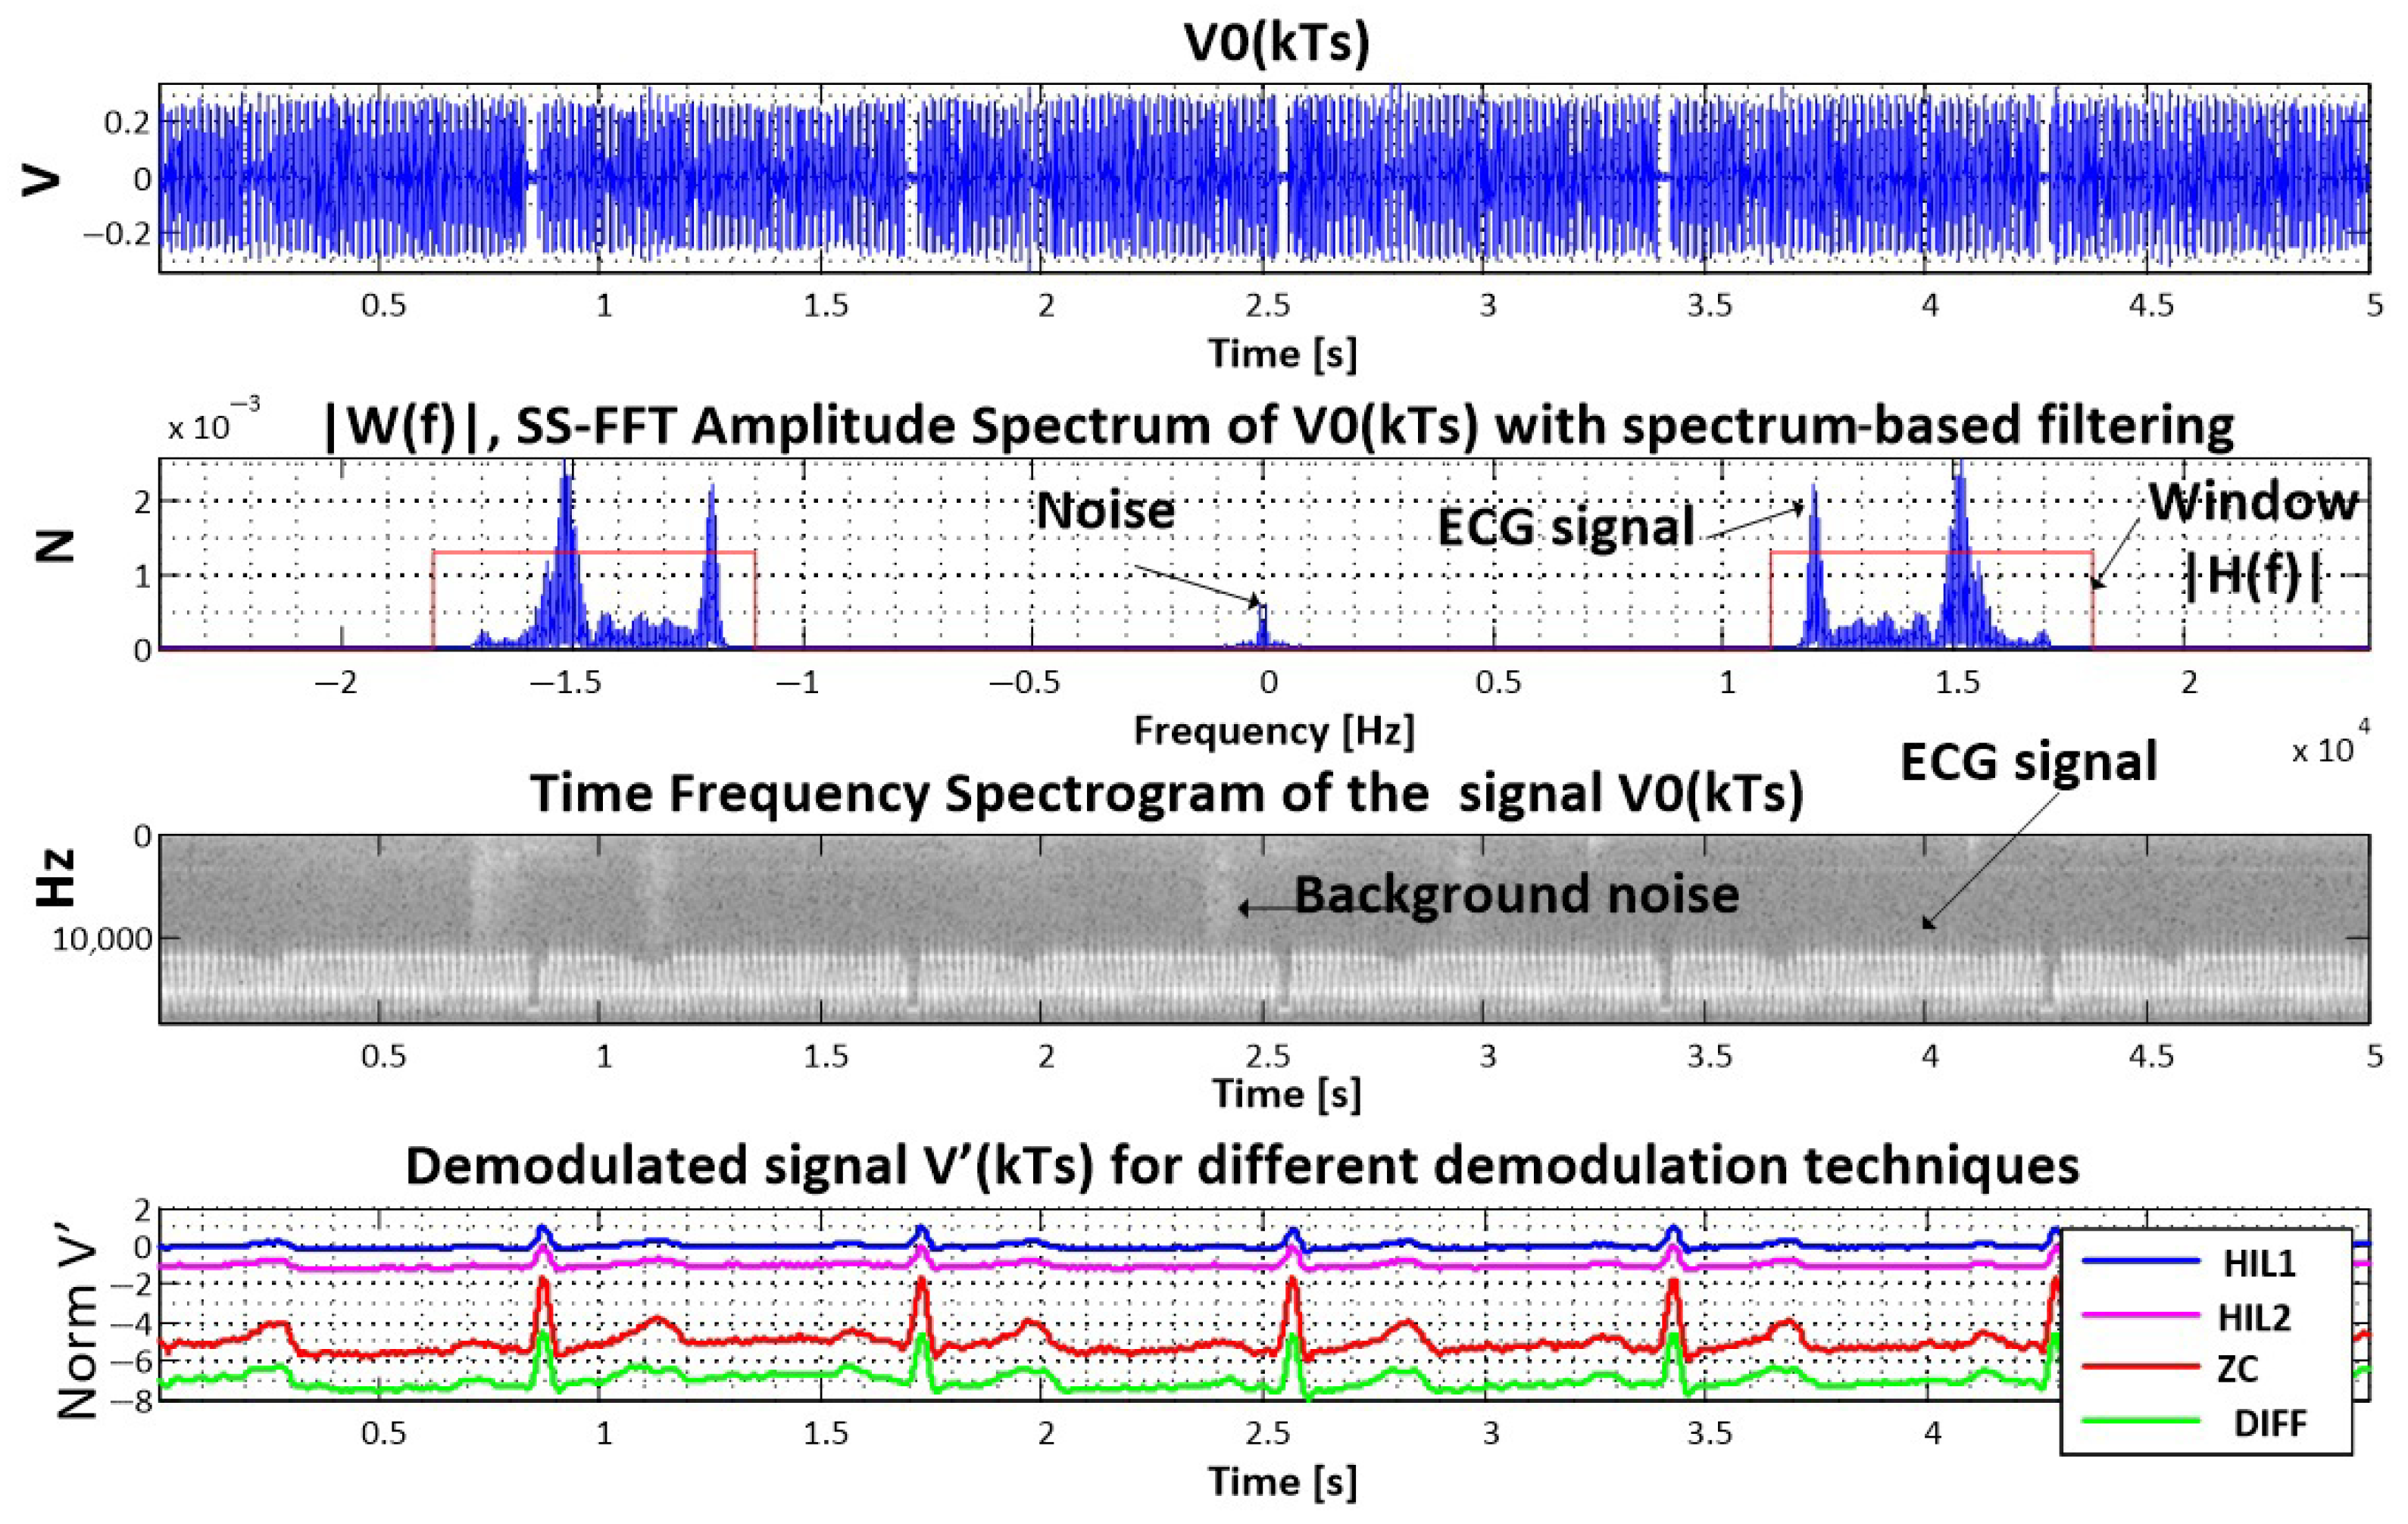
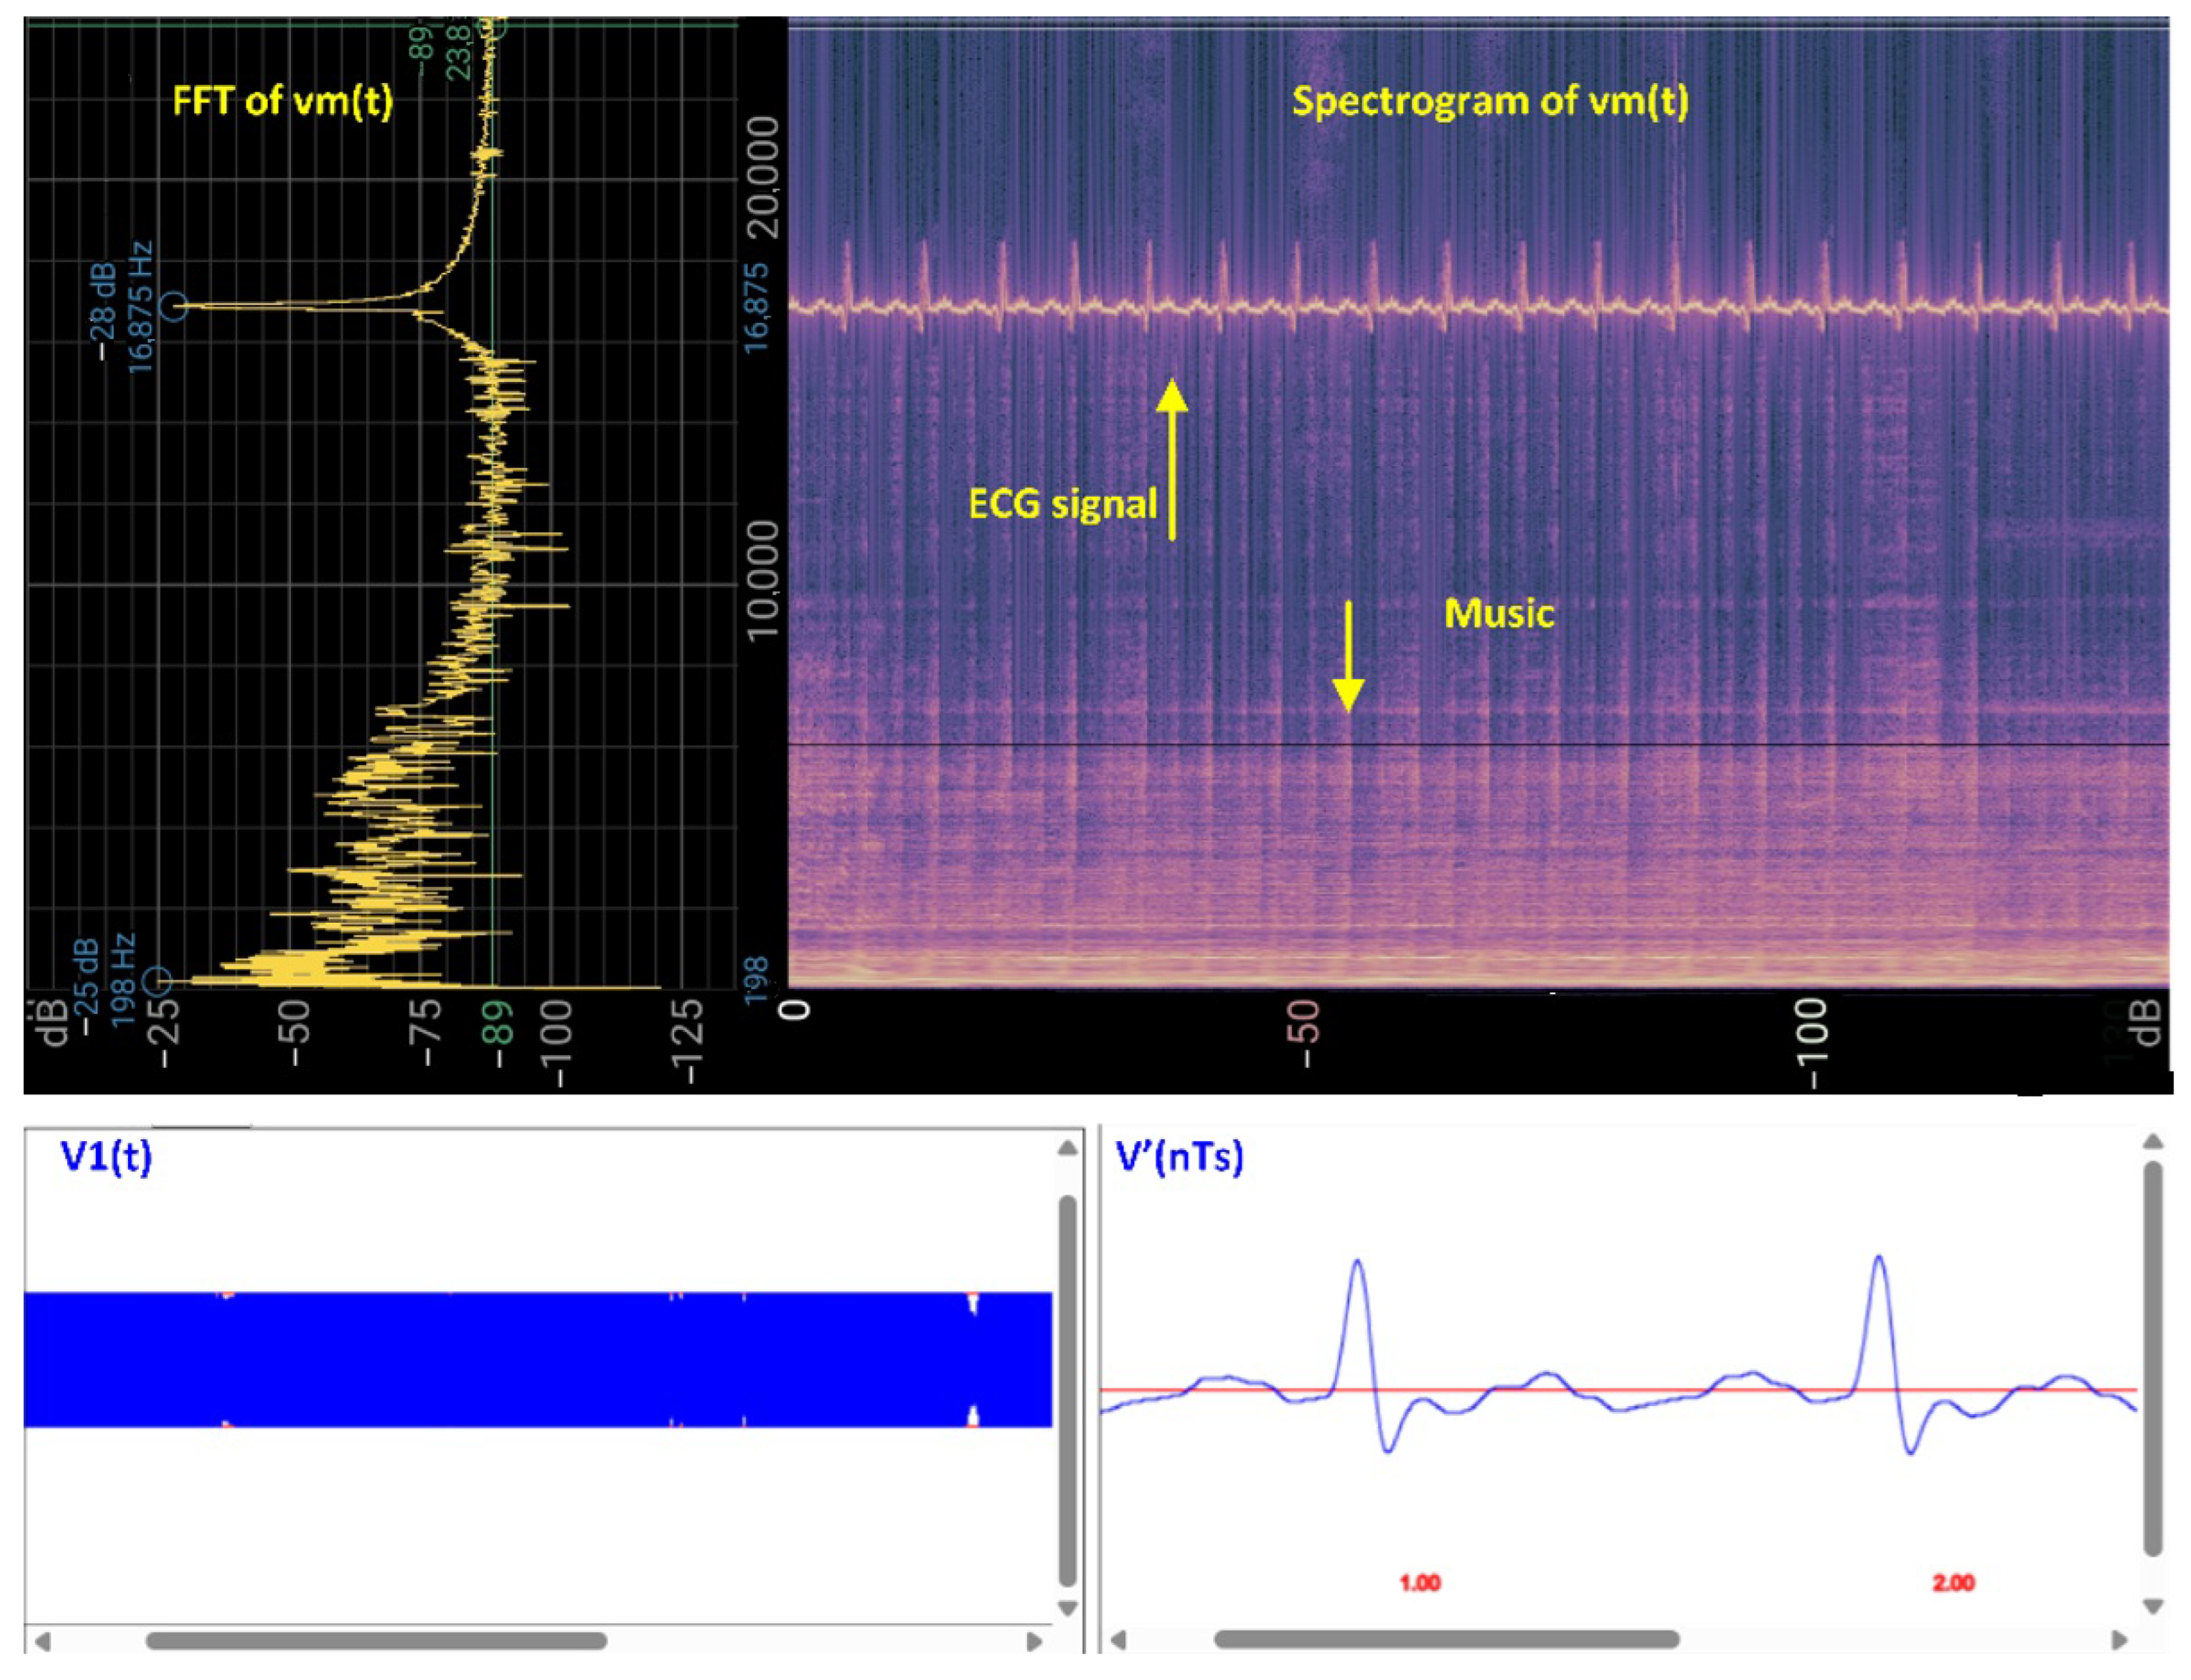
2.3. Signal Processing Approach
- Sampling Frequency: 48 kHz;
- Passband: 16–20 kHz.
- Filter Type: IIR Butterworth, order 4 or 6.
- Design Method: Bilinear transform with digital frequency pre-warping to preserve the sharpness of the band edges near the Nyquist frequency.
- Causality: The filter is fully causal, implemented in the standard direct form II transposed structure for efficiency.
- Zero-Phase Filtering: For offline MATLAB analysis (i.e., to demonstrate ideal performance), we sometimes apply zero-phase filtering using filtfilt to eliminate group delay; however, for real-time and browser-based applications, the filter is run in causal, single-pass mode.
- Transition Bands: With a 4 kHz wide passband at such a high frequency, filter order is a critical trade-off. We found that a 4th-order design provides acceptable attenuation (>30 dB) outside the 16–20 kHz band, but a 6th-order filter offers steeper roll-off if increased selectivity is required.
- Stability and Real-Time Suitability: The chosen implementation does not introduce instability or excessive group delay in the passband. Group delay at the upper edge (20 kHz) is moderate, and pre-detection of signal edges is not required for our application.
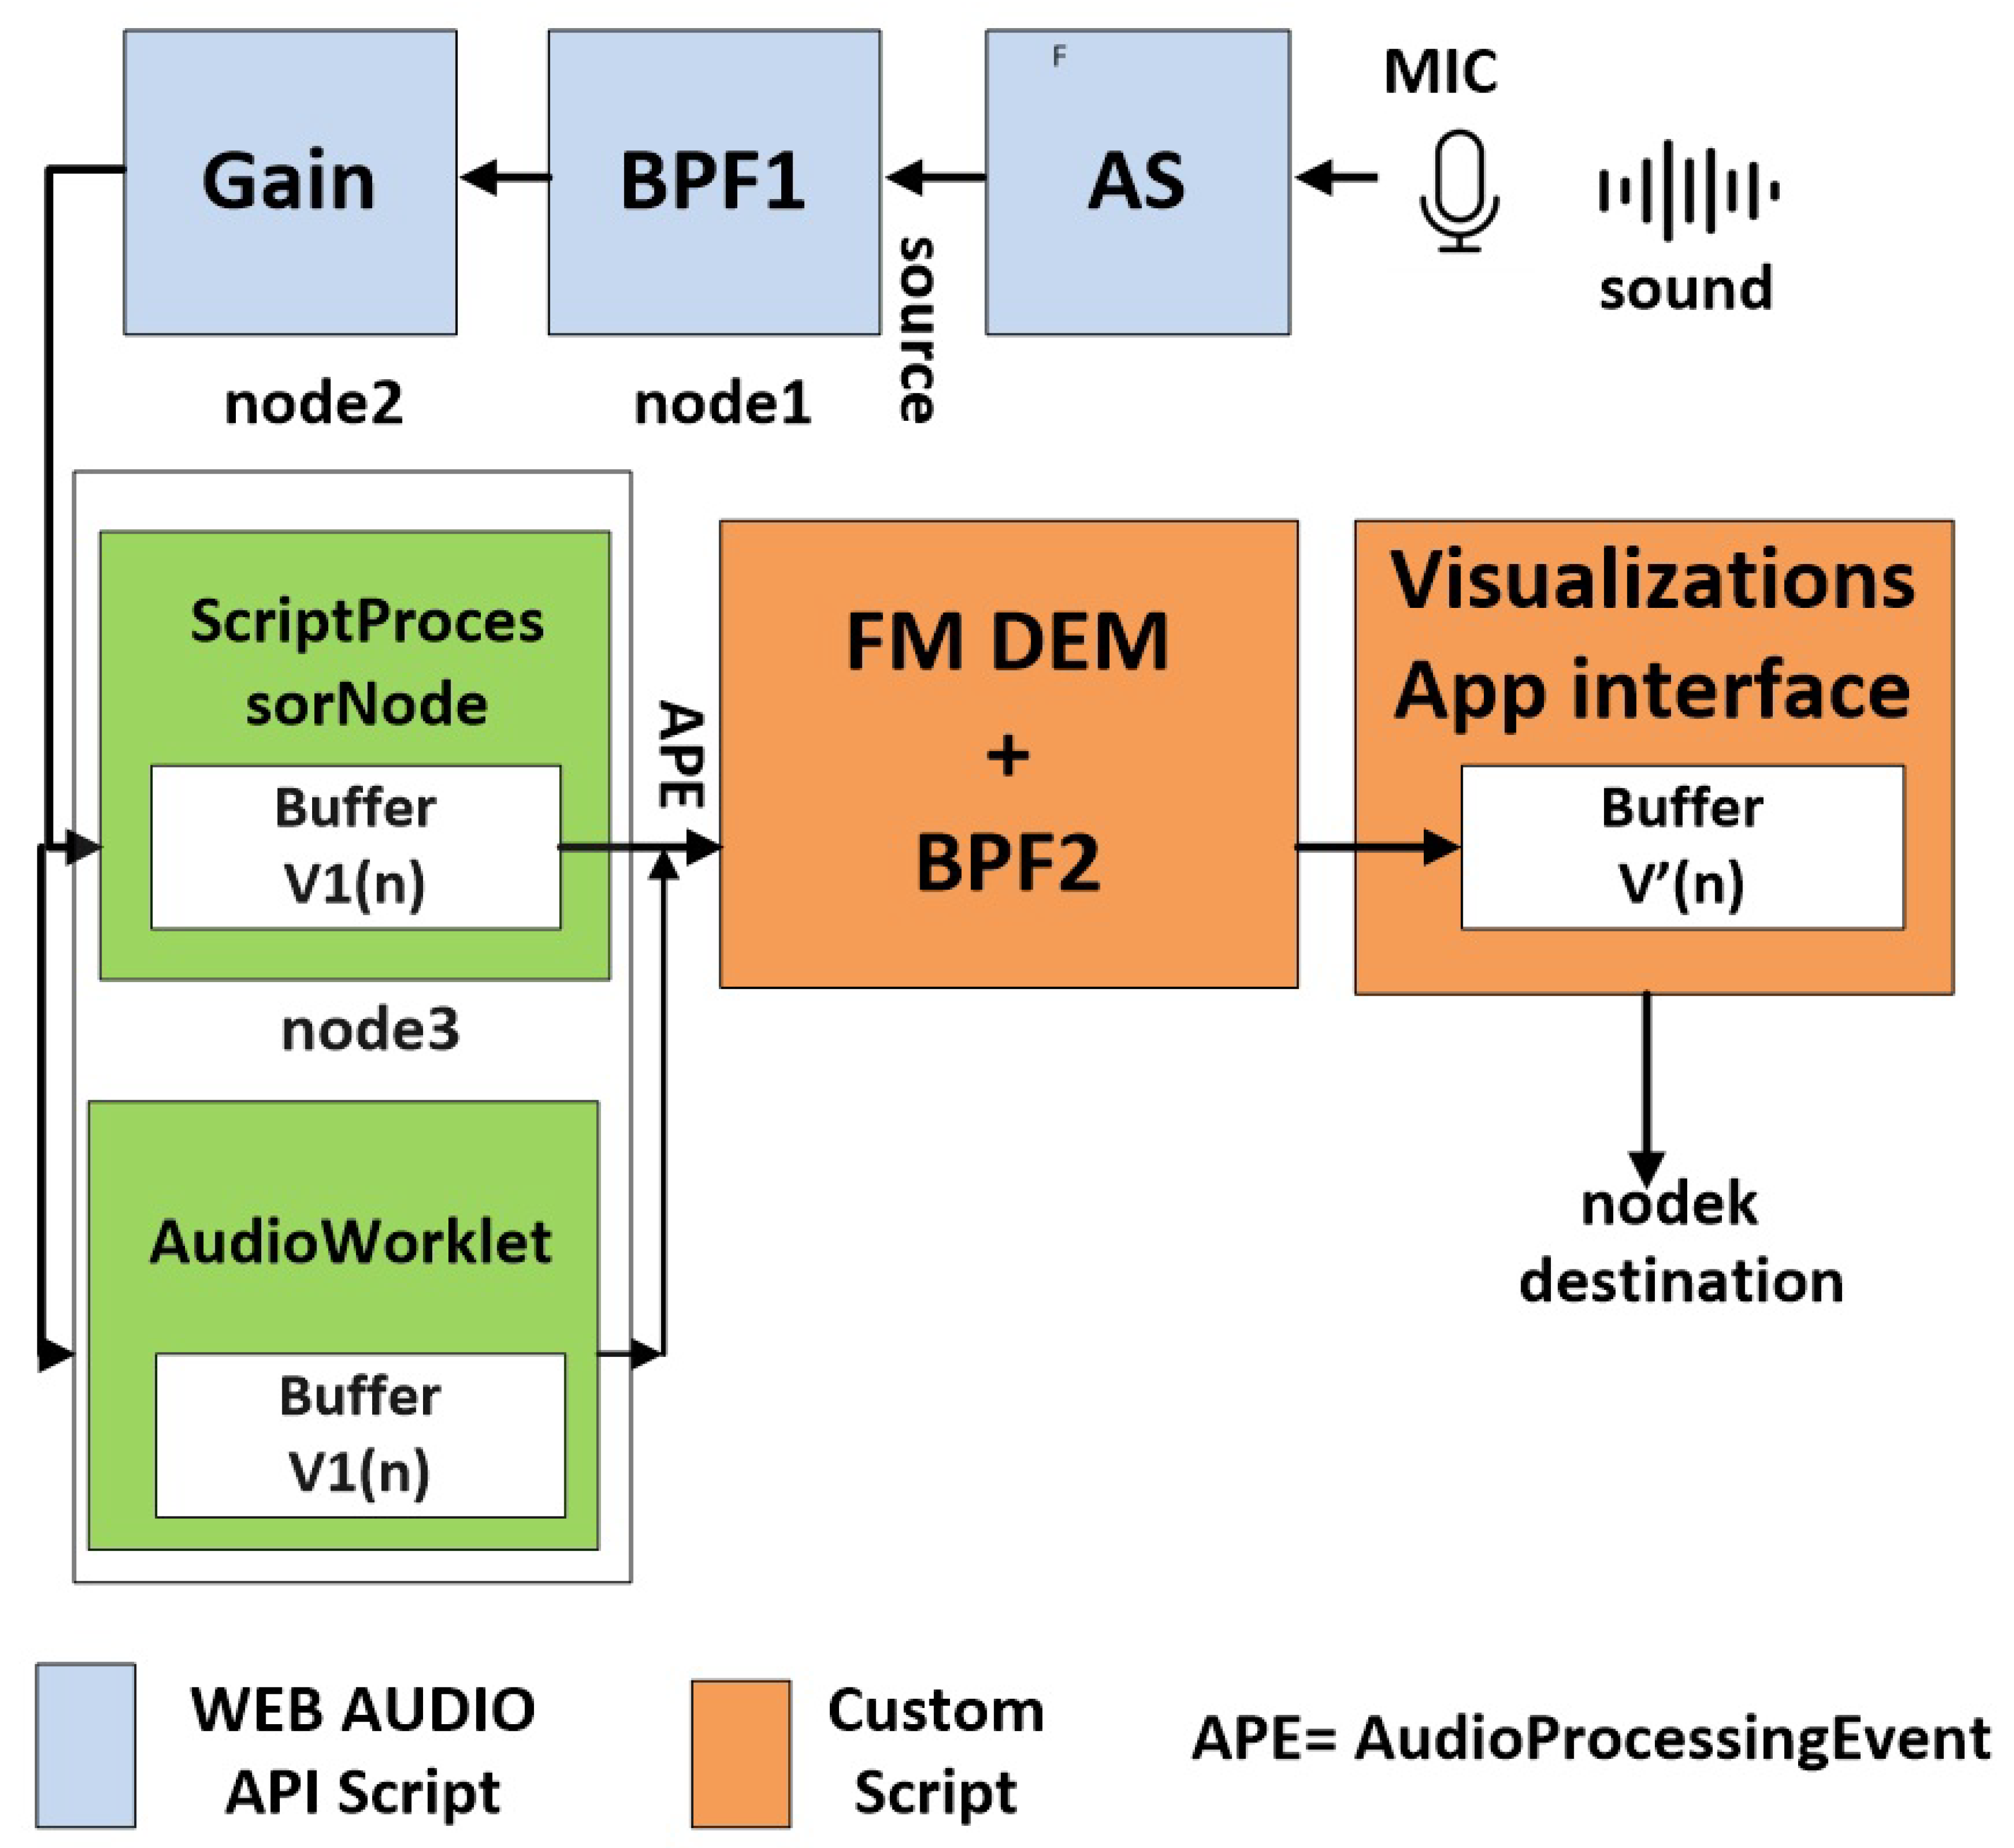
3. Real-Time Signal Processing Implementation
| source → node1 → node2 → … →nodek → →custom audio processing script → destination [19]. |
4. Verification and Testing
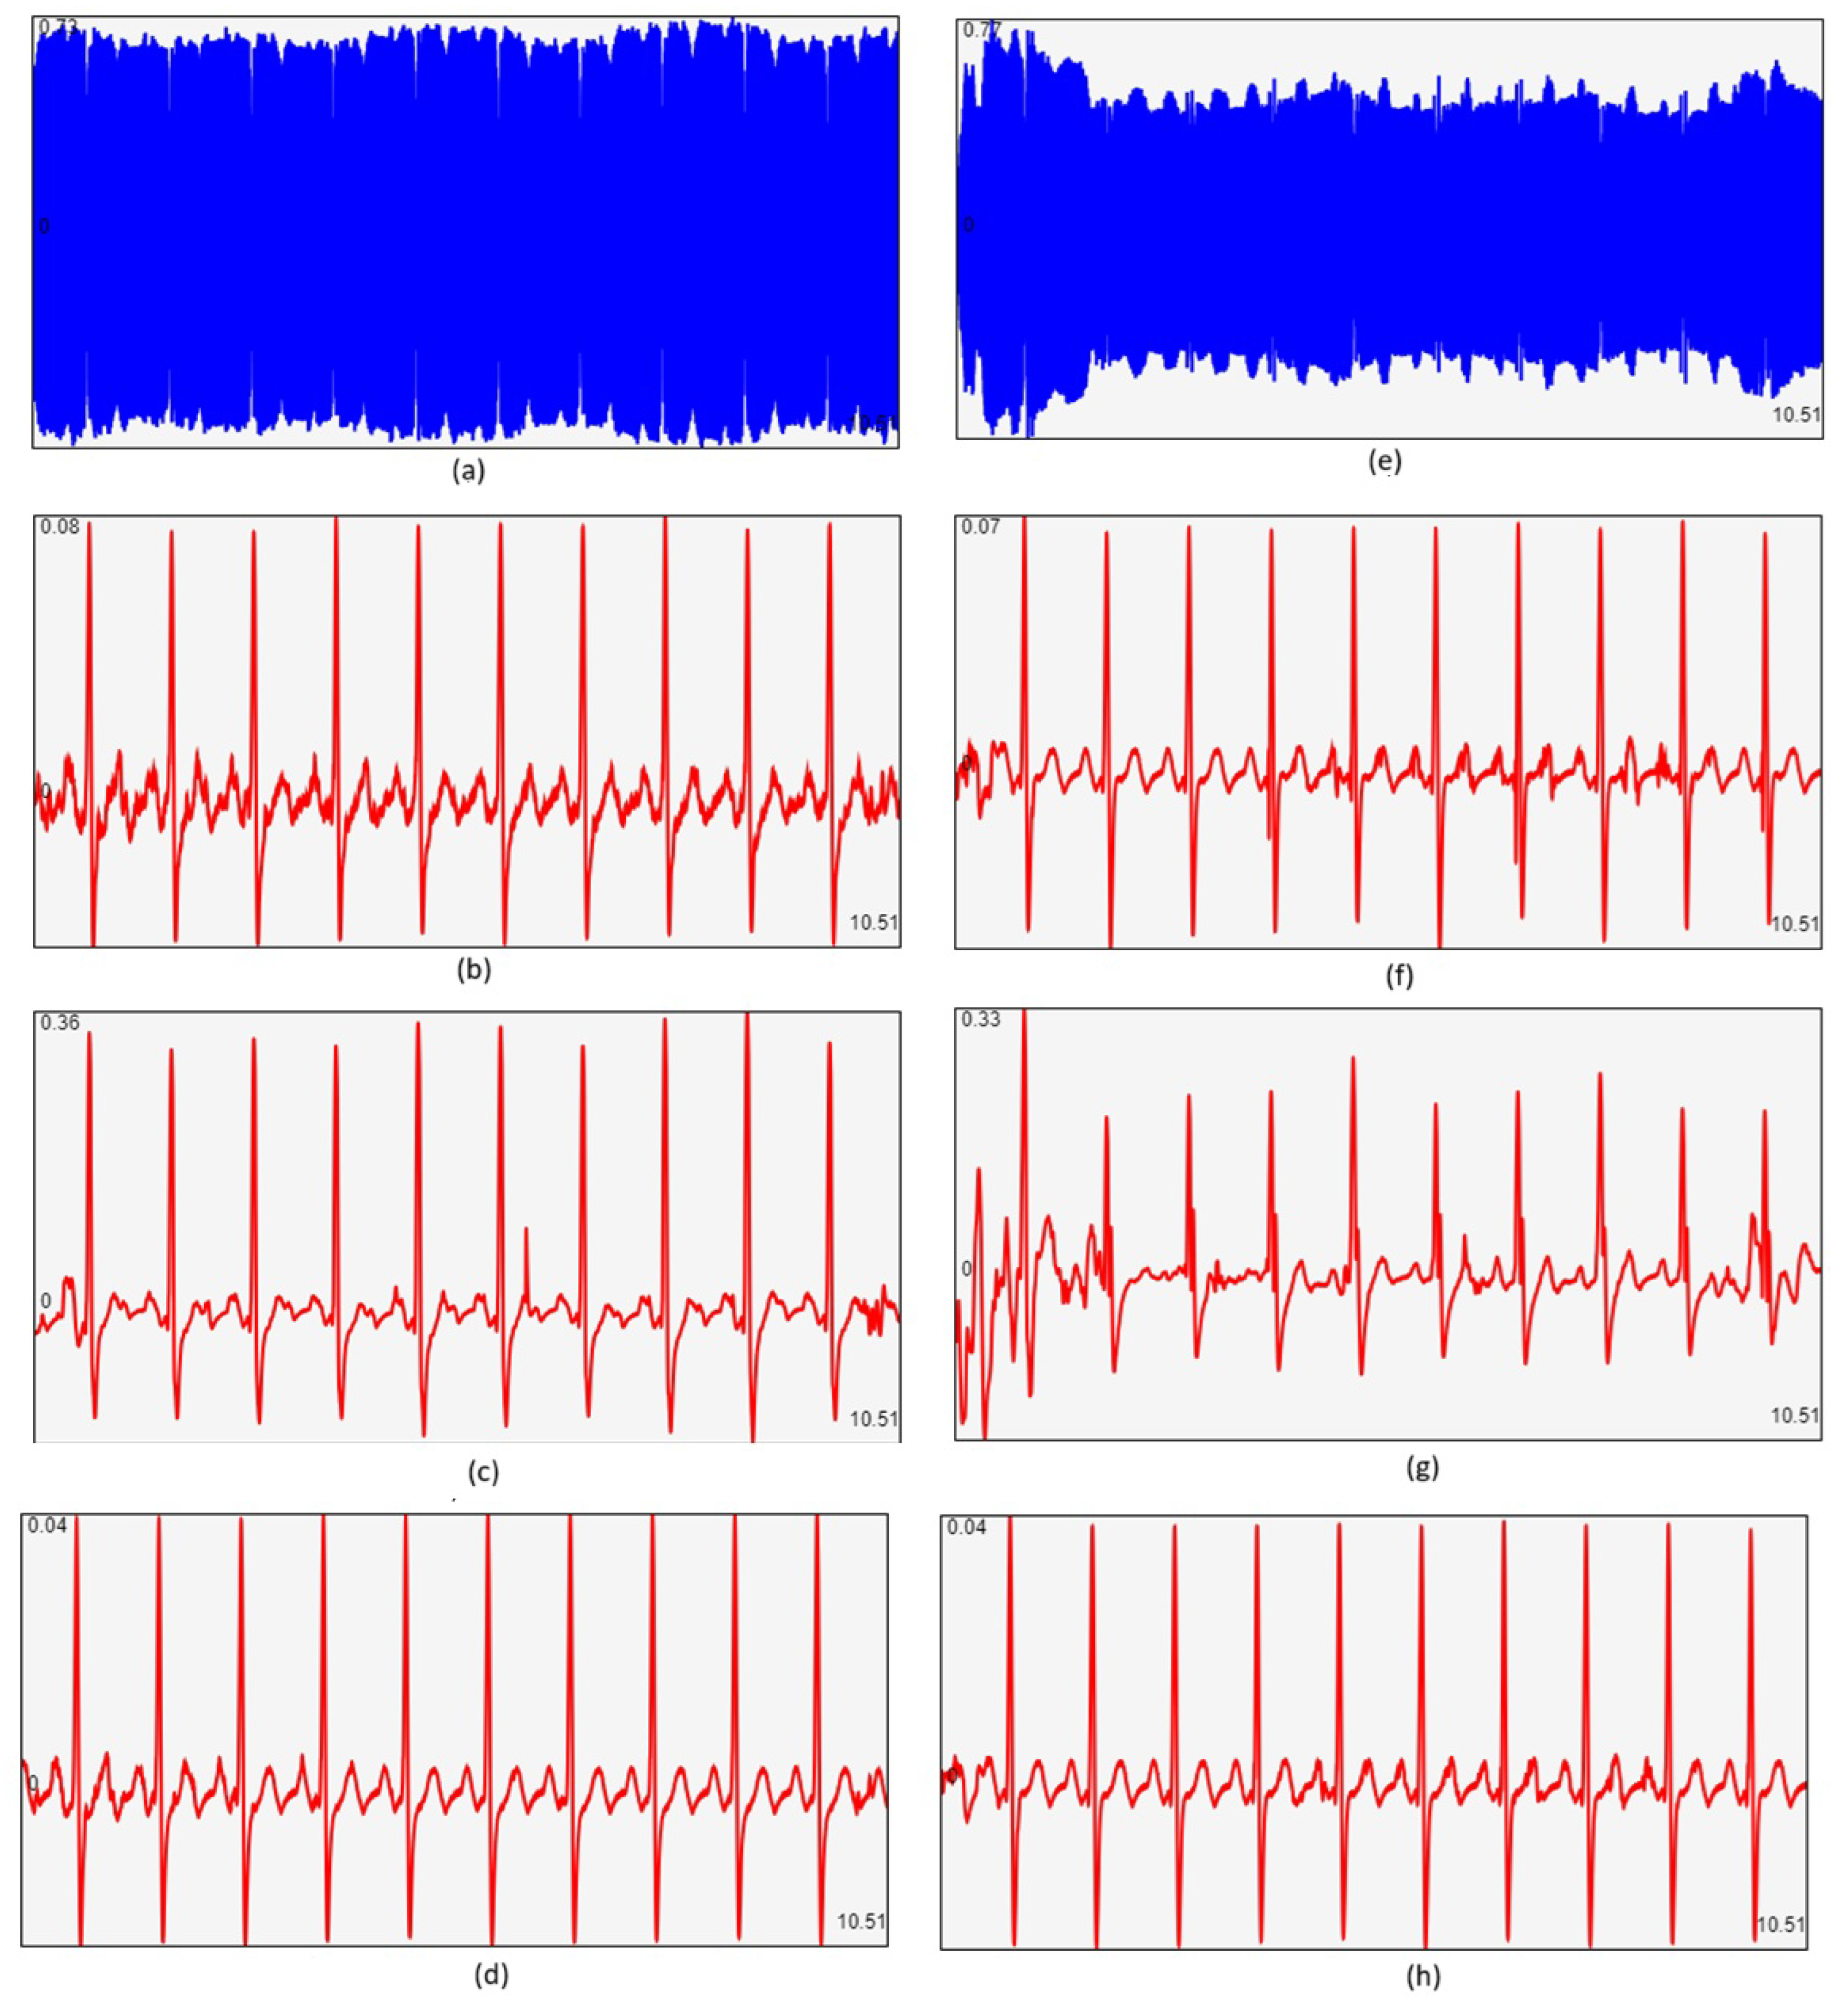
4.1. Functionality
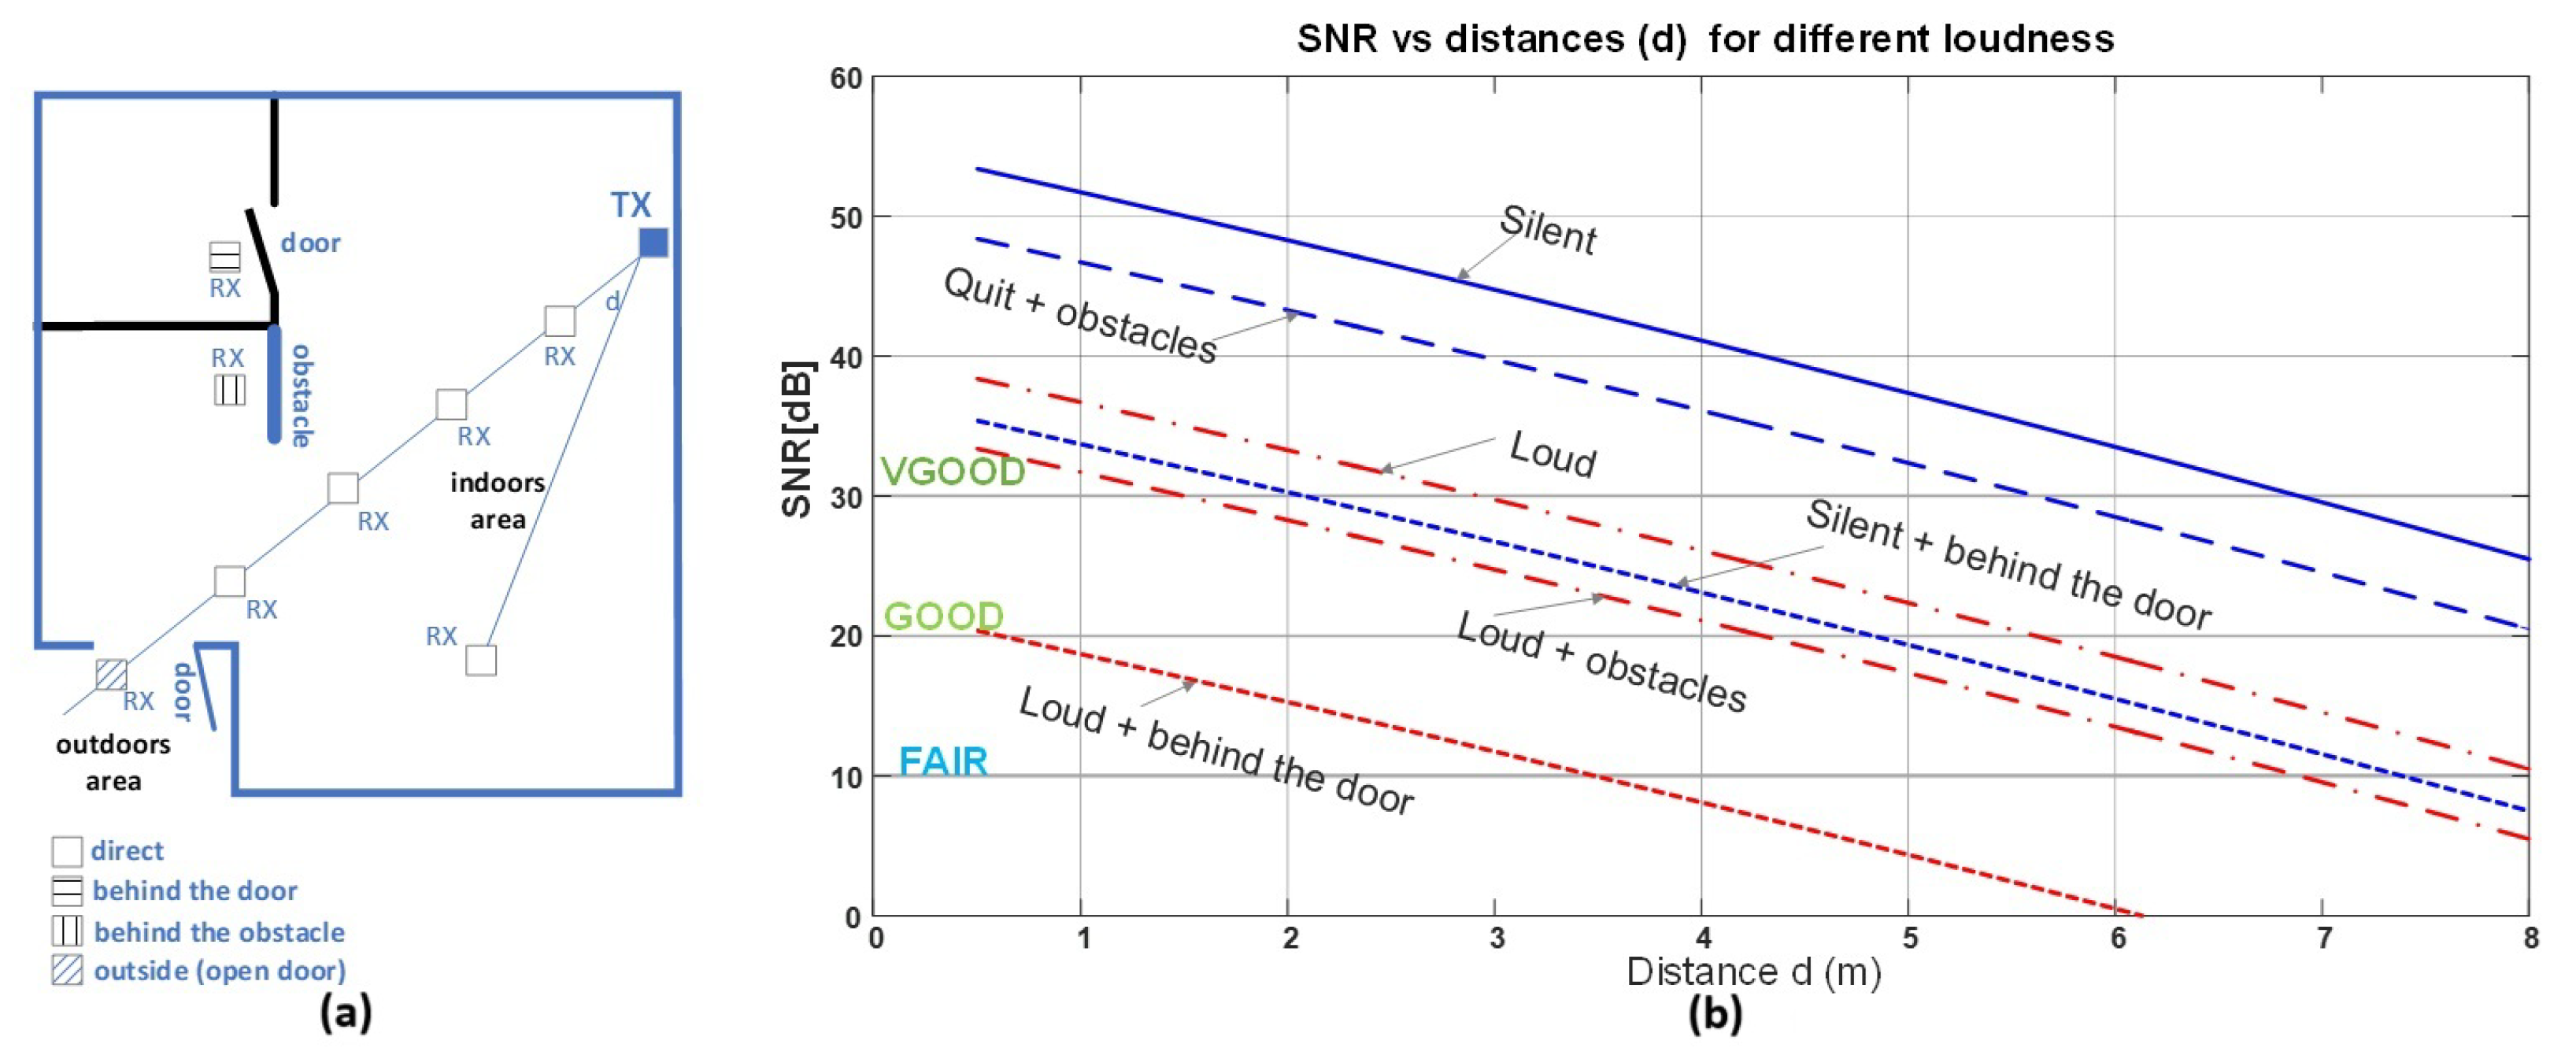
4.2. Signal Quality and SNR Measurements in Indoor Environments
4.3. Platform-Independent Implementation
4.4. Power Consumption
4.5. Range
5. Discussion
- The classic concept of “data over sound” can be extended to include medical data over sound, or indeed any sensor data over sound. Data may be analog, digital, or mixed.
- Air, fluids, and wires can all serve as transmission media, although the effective range is typically limited to around – indoors, depending on transmitter power and receiver sensitivity.
- Transmission of analog signals supports 2–3 channels, while digital transmission allows up to 4 channels, albeit at low data rates (tens of bits per second).
- One-way communication is preferred, although duplex communication is possible.
- Transmitters can be simple piezo speakers powered by basic circuits, and receivers can be inexpensive and based on widely available microphones (e.g., electret). MEMS microphones utilizing pulse density modulation (PDM) are currently very effective and promising.
- The system is subject to noise from ambient sound, physical obstacles, movement, and, rarely, electrical interference.
- Very low power is required: transmitters operate with only a few milliwatts, and receivers can function with low power consumption—modern MEMS microphones can operate in the tens of microwatts to milliwatt range, depending on the implementation.
- Signal encoding is typically implemented via frequency or phase modulation; amplitude modulation is impractical in air but viable over wire. Square waves may be used in place of sinusoids for simplicity.
- Receivers can employ software-based filter banks and real-time demodulation methods, ranging from basic zero-crossing detection to more advanced techniques.
- The system is safe for health at low power levels.
- Applications in medicine are numerous, including but not limited to
- -
- Passive sensing (e.g., stethoscope, cough detection);
- -
- In-body ultrasound communication;
- -
- Communication for setting or reading implant devices;
- -
- Near-field alerting (e.g., sleep apnea detection, fall alerts);
- -
- Local broadcasting of events (e.g., arrhythmia alerts, rhythm disorder notifications);
- -
- Vital sign visualization (ECG, PPG, ACC) in time, frequency, and time-frequency domains;
- -
- Haptic signaling via smart wearables (e.g., alerting nearby devices using a speaker in clothing);
- -
- Zero-configuration monitoring of vital signs via web browser interfaces, accessible from any device;
- -
- Fall and presence detection;
- -
- etc.
6. Conclusions
Author Contributions
Funding
Institutional Review Board Statement
Informed Consent Statement
Data Availability Statement
Conflicts of Interest
Abbreviations
| ACC | Acceleration |
| AMP | Amplifier |
| AS | Audio Stack/Interface |
| BPF | Band-Pass Filter |
| BTLE | Bluetooth Low Energy |
| CSS | Cascading Style Sheets |
| DC | Direct Current |
| DIFF | Derivative-Based Demodulation |
| DoS | Data over Sound |
| ECG | Electrocardiogram |
| EM | Electromagnetic |
| EMI | Electromagnetic Interference |
| ENC | Encoder |
| FFT | Fast Fourier Transform |
| FM | Frequency Modulation |
| FSK | Frequency-Shift Keying |
| HIL | Hilbert Transform |
| HTML | HyperText Markup Language |
| HW/SW | Hardware/Software |
| IIR | Infinite Impulse Response |
| IoT | Internet of Things |
| MC | Microcontroller |
| MDoS | Medical Data over Sound |
| MEMS | Micro-Electro-Mechanical Systems |
| MIC | Microphone |
| OFDM | Orthogonal Frequency-Division Multiplexing |
| PLL | Phase-Locked Loop |
| PPG | Photoplethysmogram |
| PSK | Phase-Shift Keying |
| RF | Radio Frequency |
| RR | Respiratory Rate |
| RX | Receiver |
| SNR | Signal-to-Noise Ratio |
| SC | Speaker |
| SD | Speaker Driver |
| STFT | Short-Time Fourier Transform |
| TX | Transmitter |
| UART | Universal Asynchronous Receiver/Transmitter |
| VCO | Voltage-Controlled Oscillator |
| WORA | Write Once, Run Anywhere |
| ZC | Zero Crossing |
References
- Kong, F.; Zou, Y.; Li, Z.; Deng, Y. Advances in Portable and Wearable Acoustic Sensing Devices for Human Health Monitoring. Sensors 2024, 24, 5354. [Google Scholar] [CrossRef] [PubMed]
- Perez, A.J.; Zeadally, S. Recent advances in wearable sensing technologies. Sensors 2021, 21, 6828. [Google Scholar] [CrossRef] [PubMed]
- Lee, N.K.; Kim, J.S. Status and Trends of the Digital Healthcare Industry. Healthc. Inform. Res. 2024, 30, 172–183. [Google Scholar] [CrossRef] [PubMed]
- Stojanović, R.; Škraba, A.; Lutovac, B. A headset like wearable device to track COVID-19 symptoms. In Proceedings of the 2020 9th Mediterranean Conference on Embedded Computing (MECO), Budva, Montenegro, 8–11 June 2020; IEEE: New York, NY, USA, 2020; pp. 1–4. [Google Scholar]
- Mukhopadhyay, S.C.; Suryadevara, N.K.; Nag, A. Wearable sensors for healthcare: Fabrication to application. Sensors 2022, 22, 5137. [Google Scholar] [CrossRef] [PubMed]
- Ambrosanio, M.; Franceschini, S.; Grassini, G.; Baselice, F. A multi-channel ultrasound system for non-contact heart rate monitoring. IEEE Sens. J. 2019, 20, 2064–2074. [Google Scholar] [CrossRef]
- Van der Togt, R.; Van Lieshout, E.J.; Hensbroek, R.; Beinat, E.; Binnekade, J.; Bakker, P. Electromagnetic interference from radio frequency identification inducing potentially hazardous incidents in critical care medical equipment. JAMA 2008, 299, 2884–2890. [Google Scholar] [CrossRef] [PubMed]
- Rahimpour, S.; Kiyani, M.; Hodges, S.E.; Turner, D.A. Deep brain stimulation and electromagnetic interference. Clin. Neurol. Neurosurg. 2021, 203, 106577. [Google Scholar] [CrossRef] [PubMed]
- Chung, M. Short distance data transmission method using inaudible high-frequencies between smart devices. Telecommun. Syst. 2019, 70, 583–594. [Google Scholar] [CrossRef]
- Fade, A.; Suprayogi; Azmi, F.; Sutari, W. Simple Data Transfer Over Audio Using Smart Phones. Proc. J. Phys. Conf. Ser. 2023, 2673, 012038. [Google Scholar] [CrossRef]
- Iannacci, F.; Huang, Y. ChirpCast: Data transmission via audio. arXiv 2015. [Google Scholar] [CrossRef]
- Mehrabi, A.; Mazzoni, A.; Jones, D.; Steed, A. Evaluating the user experience of acoustic data transmission: A study of sharing data between mobile devices using sound. Pers. Ubiquitous Comput. 2020, 24, 655–668. [Google Scholar] [CrossRef]
- Fletcher, M.D.; Lloyd Jones, S.; White, P.R.; Dolder, C.N.; Leighton, T.G.; Lineton, B. Effects of very high-frequency sound and ultrasound on humans. Part I: Adverse symptoms after exposure to audible very-high frequency sound. J. Acoust. Soc. Am. 2018, 144, 2511–2520. [Google Scholar] [CrossRef] [PubMed]
- Fletcher, M.D.; Lloyd Jones, S.; White, P.R.; Dolder, C.N.; Leighton, T.G.; Lineton, B. Effects of very high-frequency sound and ultrasound on humans. Part II: A double-blind randomized provocation study of inaudible 20-kHz ultrasound. J. Acoust. Soc. Am. 2018, 144, 2521–2531. [Google Scholar] [CrossRef] [PubMed]
- The MathWorks, Inc. MATLAB Version: 24.1.0 (R2024a); The MathWorks, Inc.: Natick, MA, USA, 2024; Available online: https://www.mathworks.com (accessed on 16 July 2025).
- Stojanović, R.; Djurković, J.; Škraba, A. ECG and PPG Signals Monitoring by Using Web Audio API. In Proceedings of the 2024 13th Mediterranean Conference on Embedded Computing (MECO), Budva, Montenegro, 11–14 June 2024; IEEE: New York, NY, USA, 2024; pp. 1–6. [Google Scholar]
- Stojanović, R.; Djurković, J. An Appendix to the Design of Feasible Health Care Wearables. In Proceedings of the 5th Summer School on Cyber Physical Systems and Internet of Things (SS-CPSIoT’2024), Budva, Montenegro, 11–14 June 2024; pp. 840–862. [Google Scholar]
- Smus, B. Web Audio API: Advanced Sound for Games and Interactive Apps; O’Reilly Media, Inc.: Sebastopol, CA, USA, 2013. [Google Scholar]
- Jaafar, B.; Neasham, J.; Degenaar, P. What ultrasound can and cannot do in implantable medical device communications. IEEE Rev. Biomed. Eng. 2021, 16, 357–370. [Google Scholar] [CrossRef] [PubMed]
- Choi, H. AudioWorklet: The future of web audio. In Proceedings of the ICMC, Daegu, Republic of Korea, 5–10 August 2018. [Google Scholar]
- Reinke, C. Spectroid. 2024. Available online: https://play.google.com/store/apps/details?id=org.intoorbit.spectrum (accessed on 2 November 2024).
- Analog Devices, Inc. AD8232: Single Lead, Heart Rate Monitor Front End. 2024. Available online: https://www.analog.com/media/en/technical-documentation/data-sheets/ad8232.pdf (accessed on 2 November 2024).
- Texas Instruments. CD4046B: Phase-Locked Loop (PLL) with Voltage-Controlled Oscillator (VCO). 2024. Available online: https://www.ti.com/lit/ds/symlink/cd4046b.pdf (accessed on 2 November 2024).
- Keuwlsoft. Spectrum Analyser [Mobile Application Software]. 2024. Available online: https://www.keuwl.com/SpectrumAnalyser/ (accessed on 11 July 2024).


| Method | ZC | DIFF | Hilbert (HIL2) |
|---|---|---|---|
| Average speed in ms for processing 524,160 length Float32 array | 16.7 | 22.4 | 760.5 |
| Demodulation Technique | Complexity | Implementation Suitability | Noise Immunity | Artifact Resistance | Real-Time Suitability |
|---|---|---|---|---|---|
| HIL1 (Hilbert-based) | High | Complex in JavaScript, feasible in Python and MATLAB | High | High | Suitable |
| HIL2 (Hilbert-based) | High | Complex in JavaScript, feasible in Python and MATLAB | High | High | Suitable |
| ZC (Zero Crossing) | Low | Simple and suitable for JavaScript | Moderate | Moderate | Suitable |
| DIFF (Slope-based) | Low | Moderate complexity; less suitable due to noise and artifacts | Low | Low | Suitable |
| Configuration | VCO 4046-Based Modulator | ATMEGA328-Based Modulator |
|---|---|---|
| 3.3 Vpp on piezo speaker | 15.5 mW | 34 mW |
| 5 Vpp on piezo speaker | 20 mW | 70 mW |
| 9 Vpp on piezo speaker | 35 mW | 90 mW |
Disclaimer/Publisher’s Note: The statements, opinions and data contained in all publications are solely those of the individual author(s) and contributor(s) and not of MDPI and/or the editor(s). MDPI and/or the editor(s) disclaim responsibility for any injury to people or property resulting from any ideas, methods, instructions or products referred to in the content. |
© 2025 by the authors. Licensee MDPI, Basel, Switzerland. This article is an open access article distributed under the terms and conditions of the Creative Commons Attribution (CC BY) license (https://creativecommons.org/licenses/by/4.0/).
Share and Cite
Stojanović, R.; Đurković, J.; Vukmirović, M.; Babić, B.; Miranović, V.; Škraba, A. Medical Data over Sound—CardiaWhisper Concept. Sensors 2025, 25, 4573. https://doi.org/10.3390/s25154573
Stojanović R, Đurković J, Vukmirović M, Babić B, Miranović V, Škraba A. Medical Data over Sound—CardiaWhisper Concept. Sensors. 2025; 25(15):4573. https://doi.org/10.3390/s25154573
Chicago/Turabian StyleStojanović, Radovan, Jovan Đurković, Mihailo Vukmirović, Blagoje Babić, Vesna Miranović, and Andrej Škraba. 2025. "Medical Data over Sound—CardiaWhisper Concept" Sensors 25, no. 15: 4573. https://doi.org/10.3390/s25154573
APA StyleStojanović, R., Đurković, J., Vukmirović, M., Babić, B., Miranović, V., & Škraba, A. (2025). Medical Data over Sound—CardiaWhisper Concept. Sensors, 25(15), 4573. https://doi.org/10.3390/s25154573