

Review of Acoustic Emission Detection Technology for Valve Internal Leakage: Mechanisms, Methods, Challenges, and Application Prospects
Abstract
1. Introduction
2. Overview of Acoustic Emission Detection Technology
3. The Processing Method of Acoustic Emission Signals
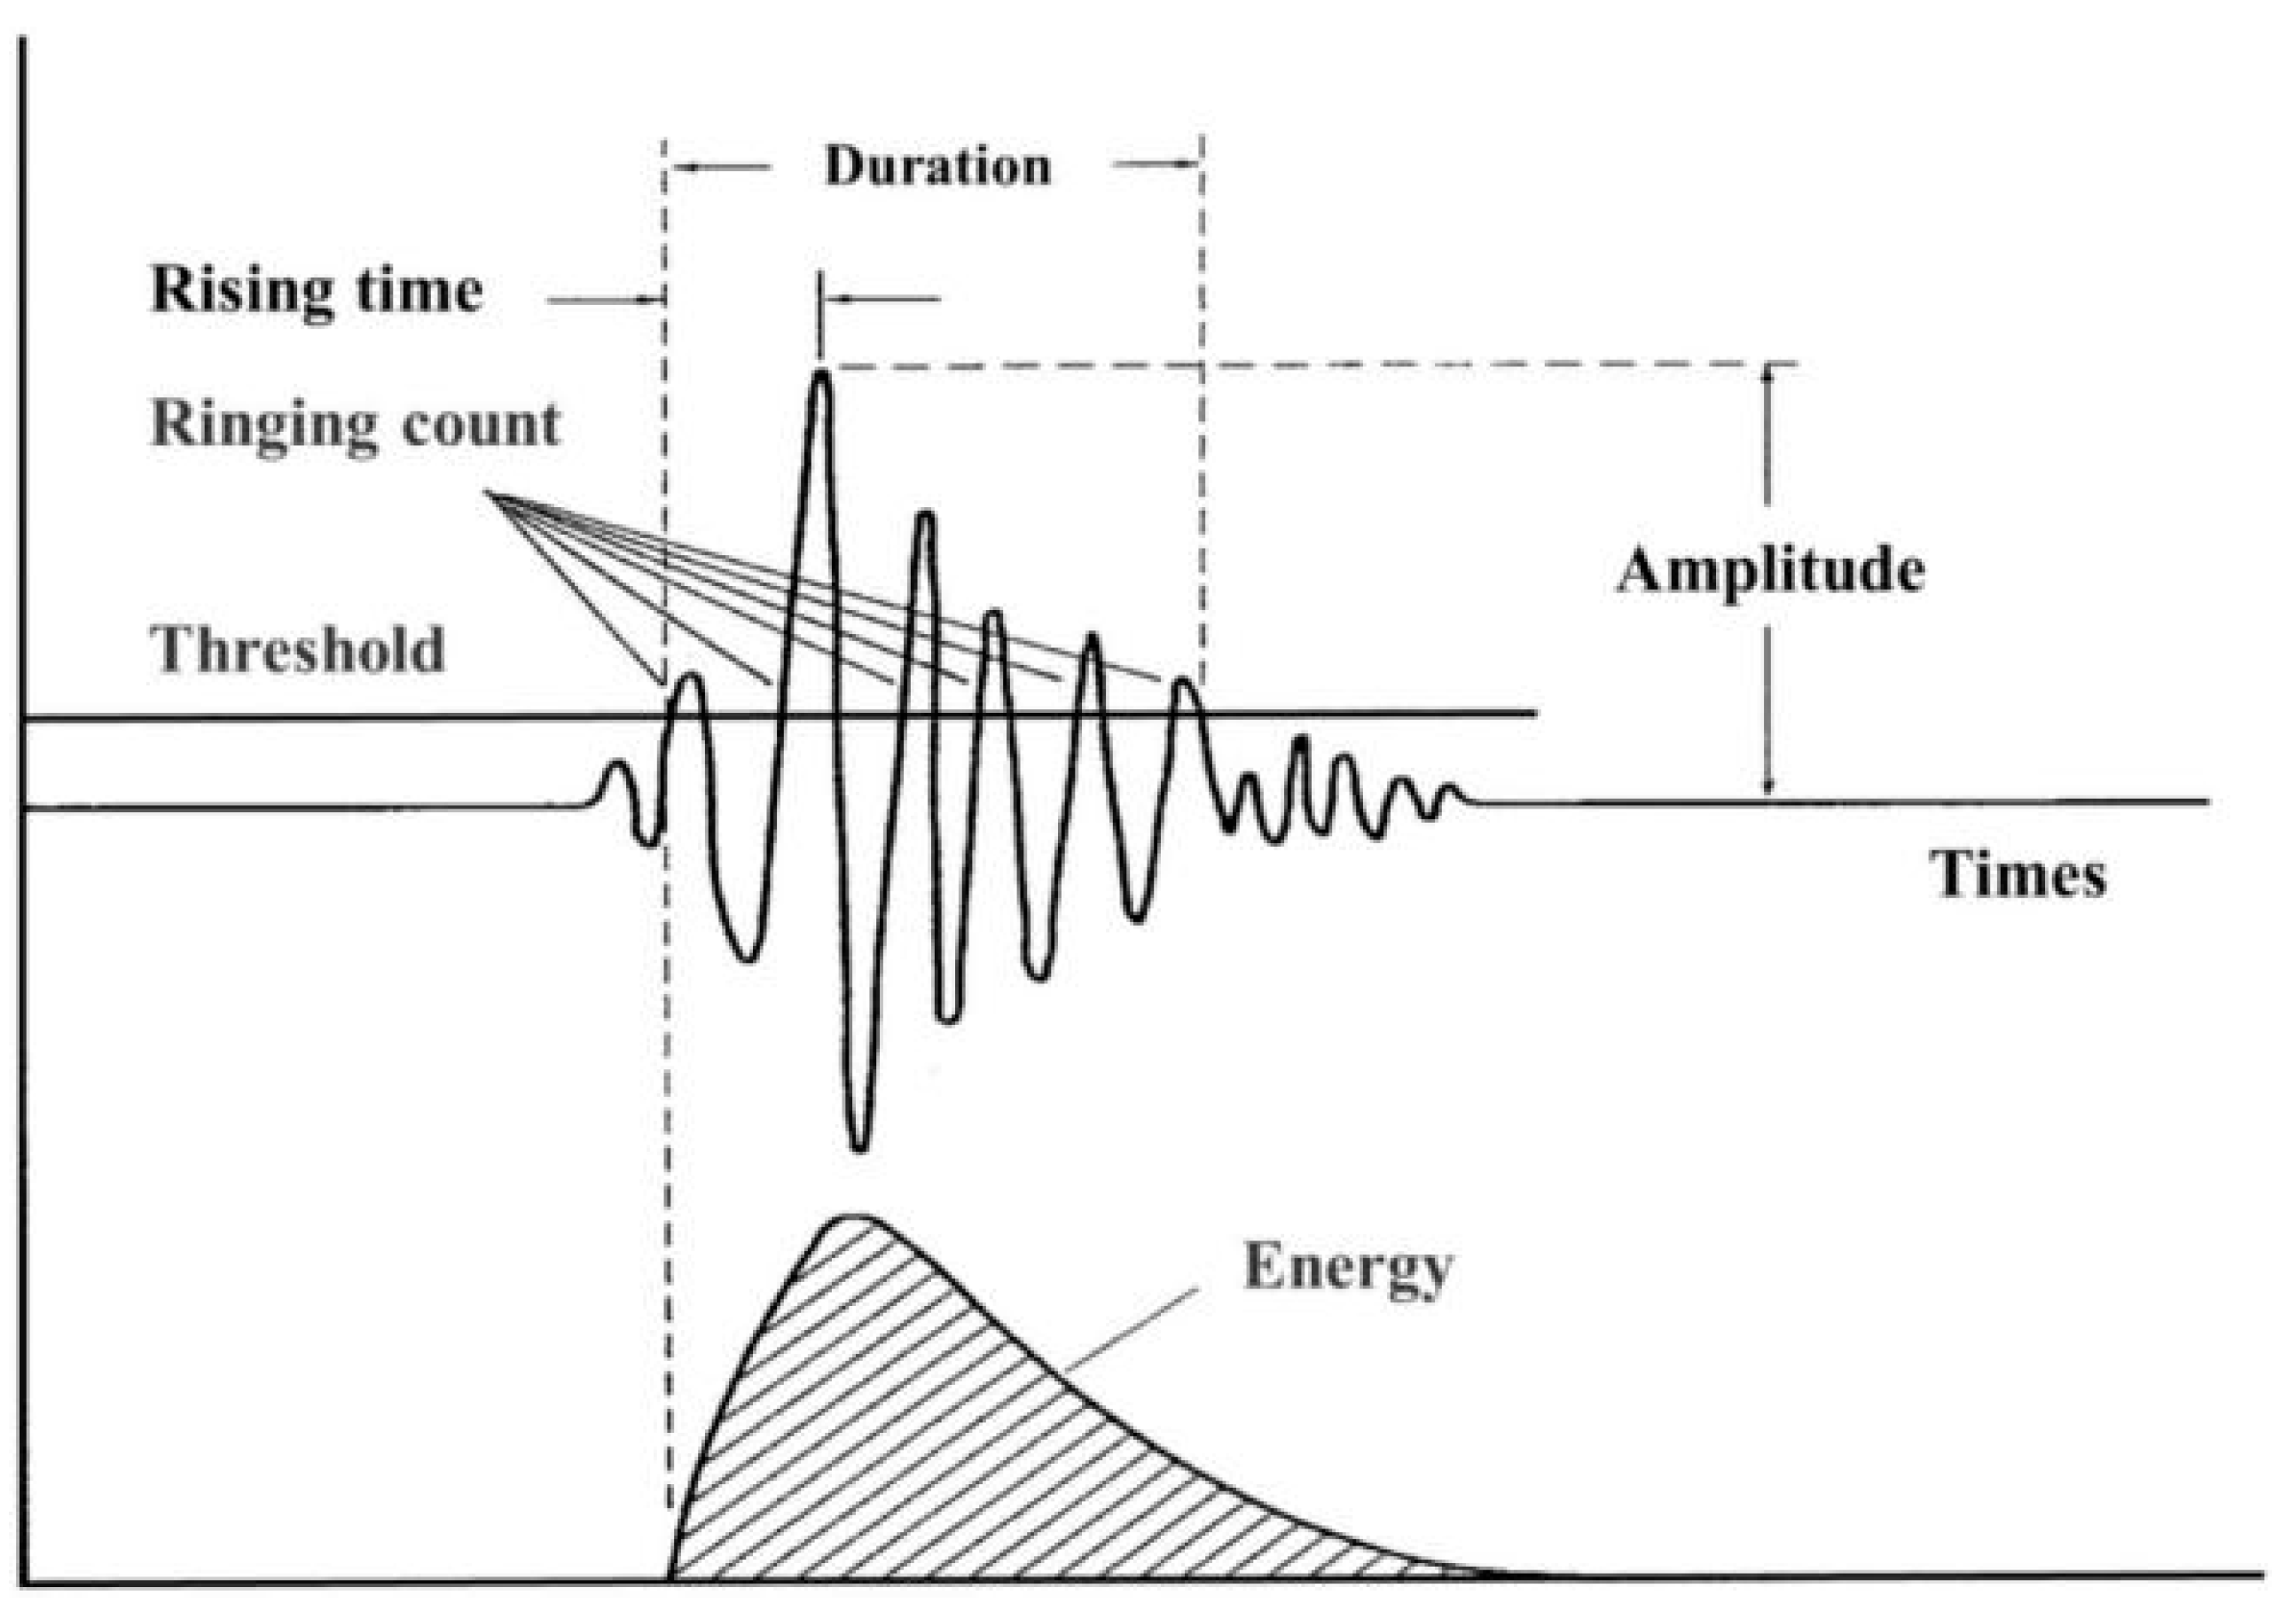
3.1. Parameter Analysis Method
3.2. Time–Frequency Analysis
3.2.1. Fourier Transform
3.2.2. Wavelet Transforms
3.2.3. Other Adaptive Signal Decomposition Methods
3.3. Nonlinear Dynamic Analysis Method
3.4. Traditional Machine Learning
- (1)
- Convolutional Neural Networks (CNNs) autonomously extract discriminative time–frequency features;
- (2)
- Long Short-Term Memory (LSTM) networks effectively model complex temporal dependencies between signals and damage states.
3.4.1. The Application of Support Vector Machine
3.4.2. Optimization and Extension of Traditional Machine Learning Methods
3.5. Deep Learning Method
3.5.1. Deep Learning Methods Based on Time–Frequency Feature Extraction
3.5.2. Convolutional Neural Network Method Based on Graphical Processing
3.5.3. Semi-Supervised and Unsupervised Learning Methods
3.5.4. Cross-Domain Adaptation Method
3.6. Summary of Acoustic Emission Signal Processing Methods
4. Concluding Remarks
Author Contributions
Funding
Institutional Review Board Statement
Informed Consent Statement
Data Availability Statement
Conflicts of Interest
References
- Lai, Z.Q. Research on Internal Leakage Detection Technology of Gas Valves Based on Acoustic Emission. Master’s Thesis, Chongqing University, Chongqing, China, 2025. [Google Scholar] [CrossRef]
- Yao, H.Y.; Jiang, C.H.; Jin, Z.J.; Qian, J. Research Progress on Valve Failure. Fluid Mach. 2021, 49, 74–83, 90. [Google Scholar]
- Liu, M.N. Analysis of the Sealing Principle and Leakage Causes of Valves in Petrochemical Plants. China Pet. Chem. Ind. Stand. Qual. 2024, 44, 93–95. [Google Scholar]
- Hu, Z.Y.; Tariq, S.; Zayed, T. A Comprehensive Review of Acoustic Based Leak Localization Method in Pressurized Pipelines. Mech. Syst. Signal Process. 2021, 161, 107994. [Google Scholar] [CrossRef]
- Zhang, D.; Yang, B.; Tan, J.; Jin, Y.; Xiao, B.; Xian, G.; Xue, X.; Li, Y. Impact Damage Localization and Mode Identification of CFRPs Panels Using an Electric Resistance Change Method. Compos. Struct. 2021, 276, 114587. [Google Scholar] [CrossRef]
- Ding, X.; Wang, X.; Chen, W. Sequential Quantification Strategy of Delamination in Composite Laminate via Collaborative Active and Passive Monitoring. Mech. Syst. Signal Process. 2022, 166, 108458. [Google Scholar] [CrossRef]
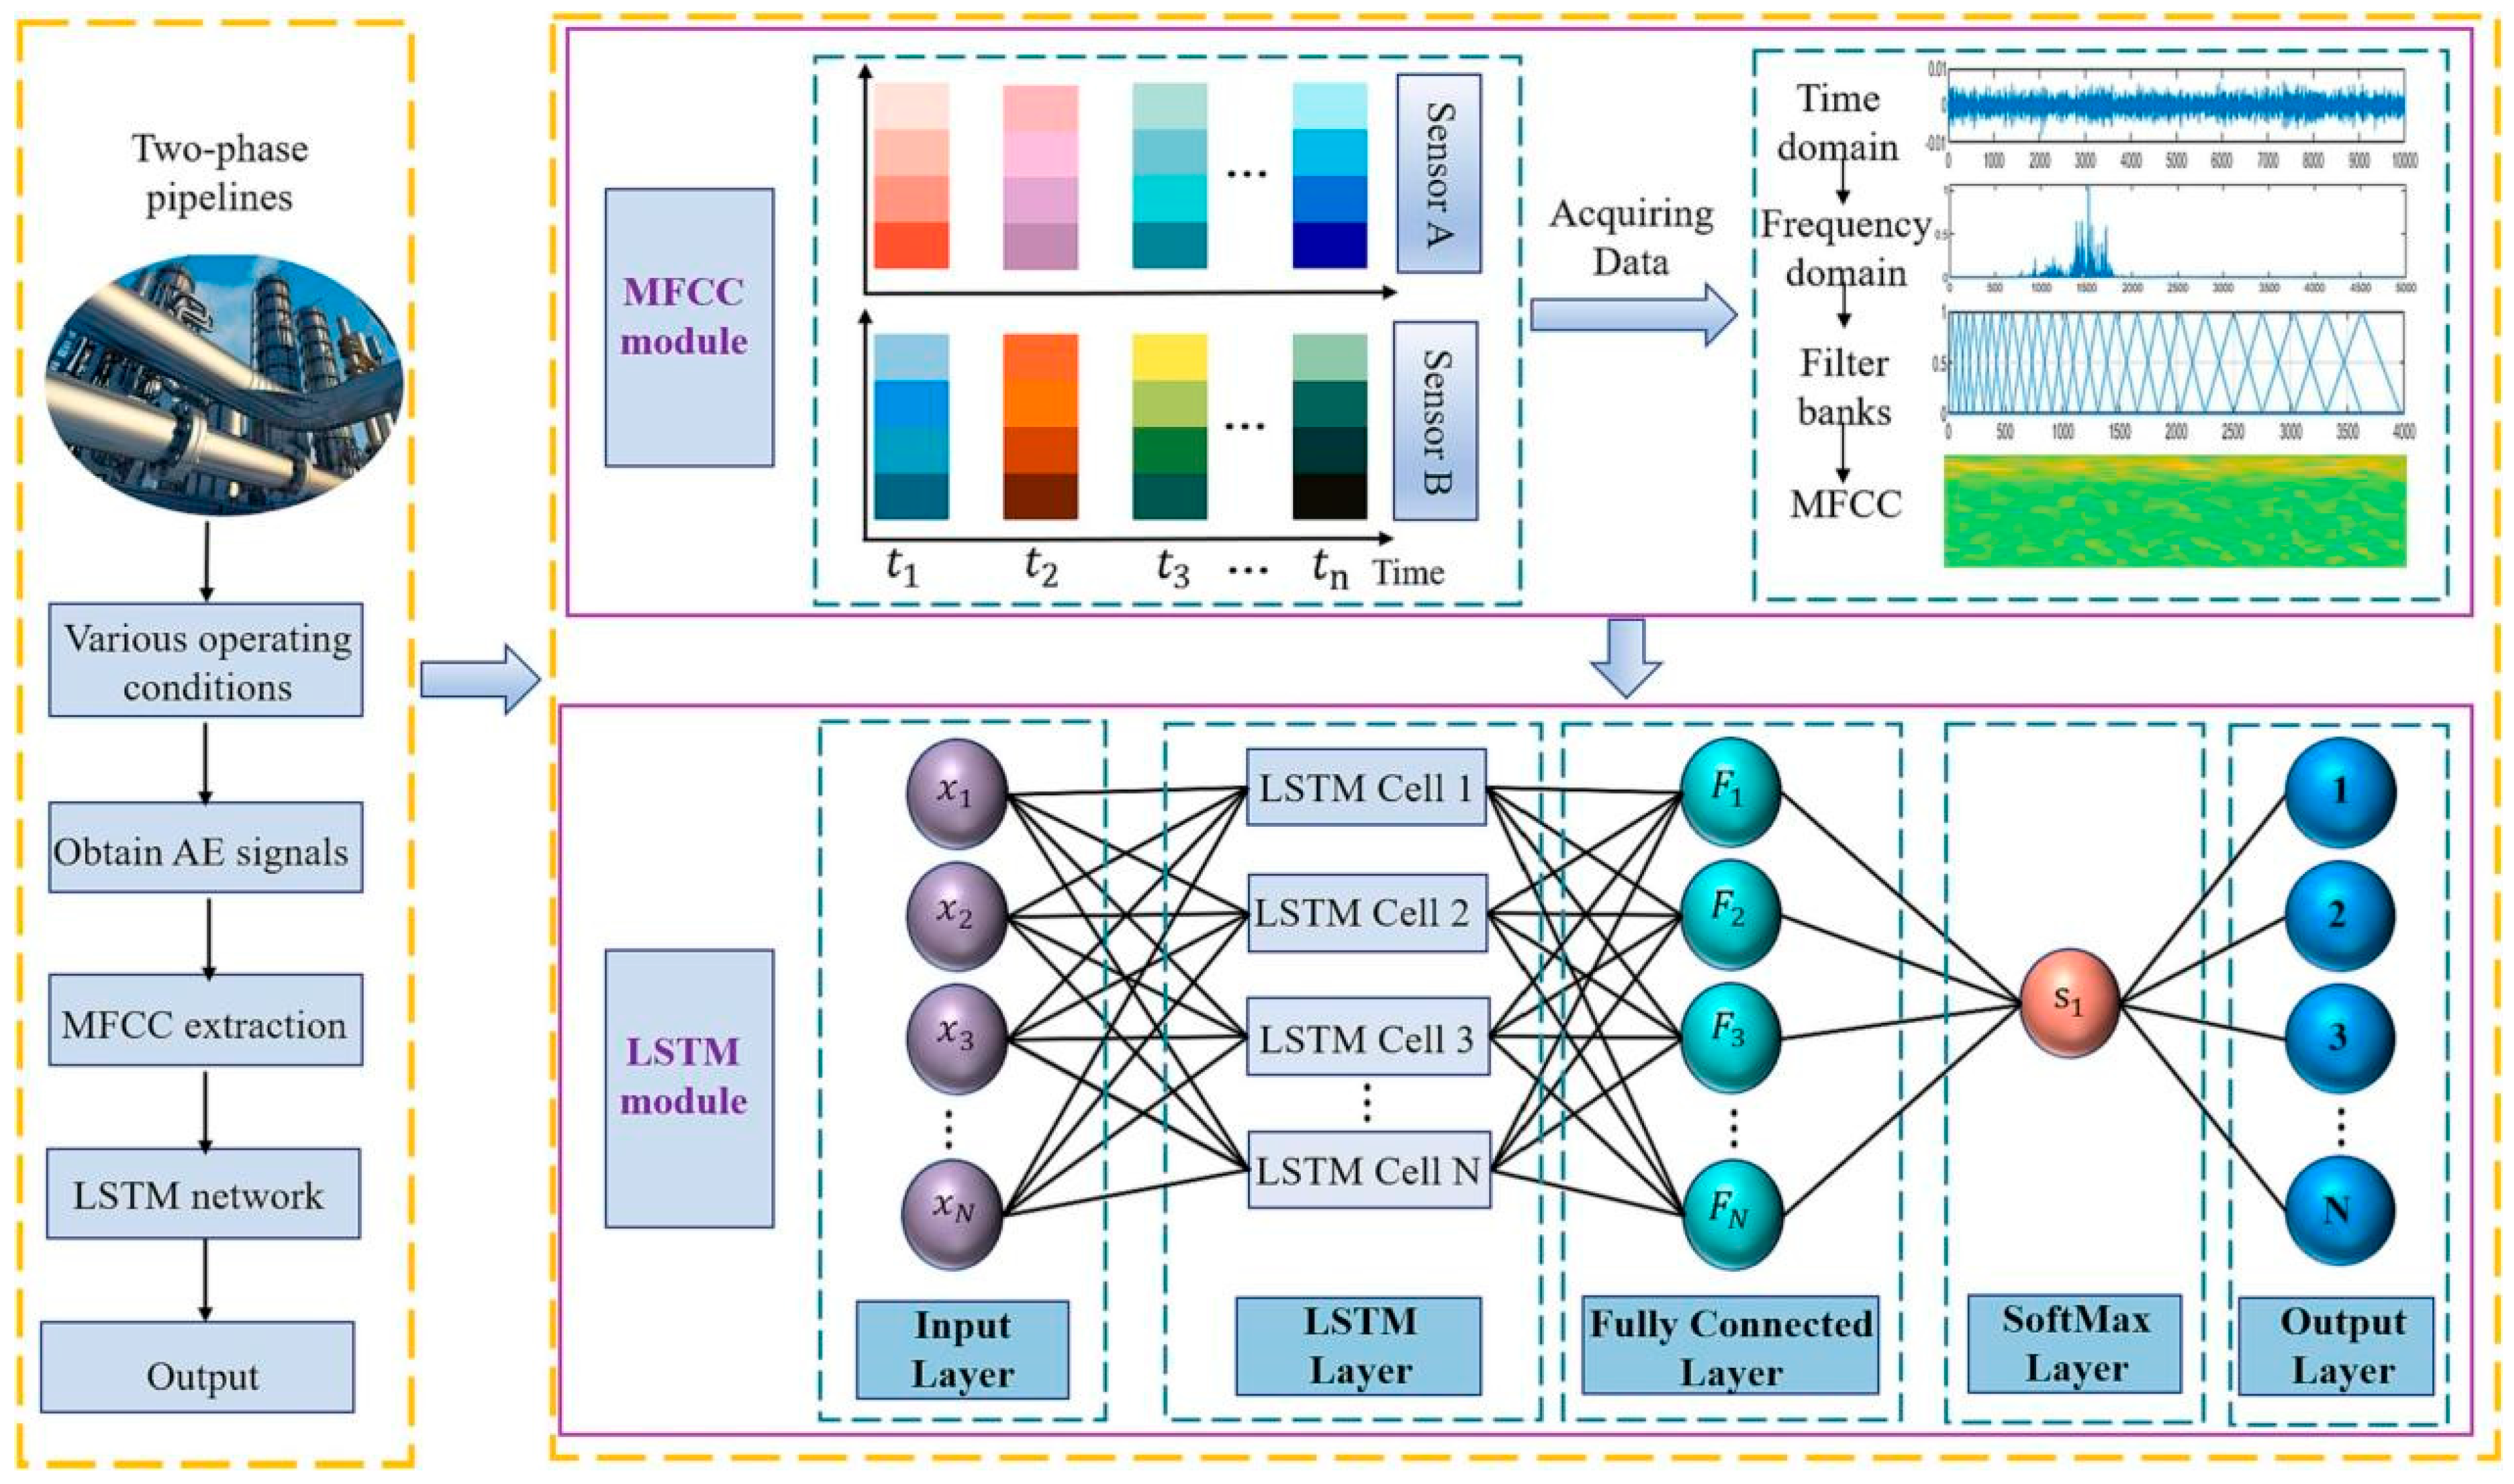
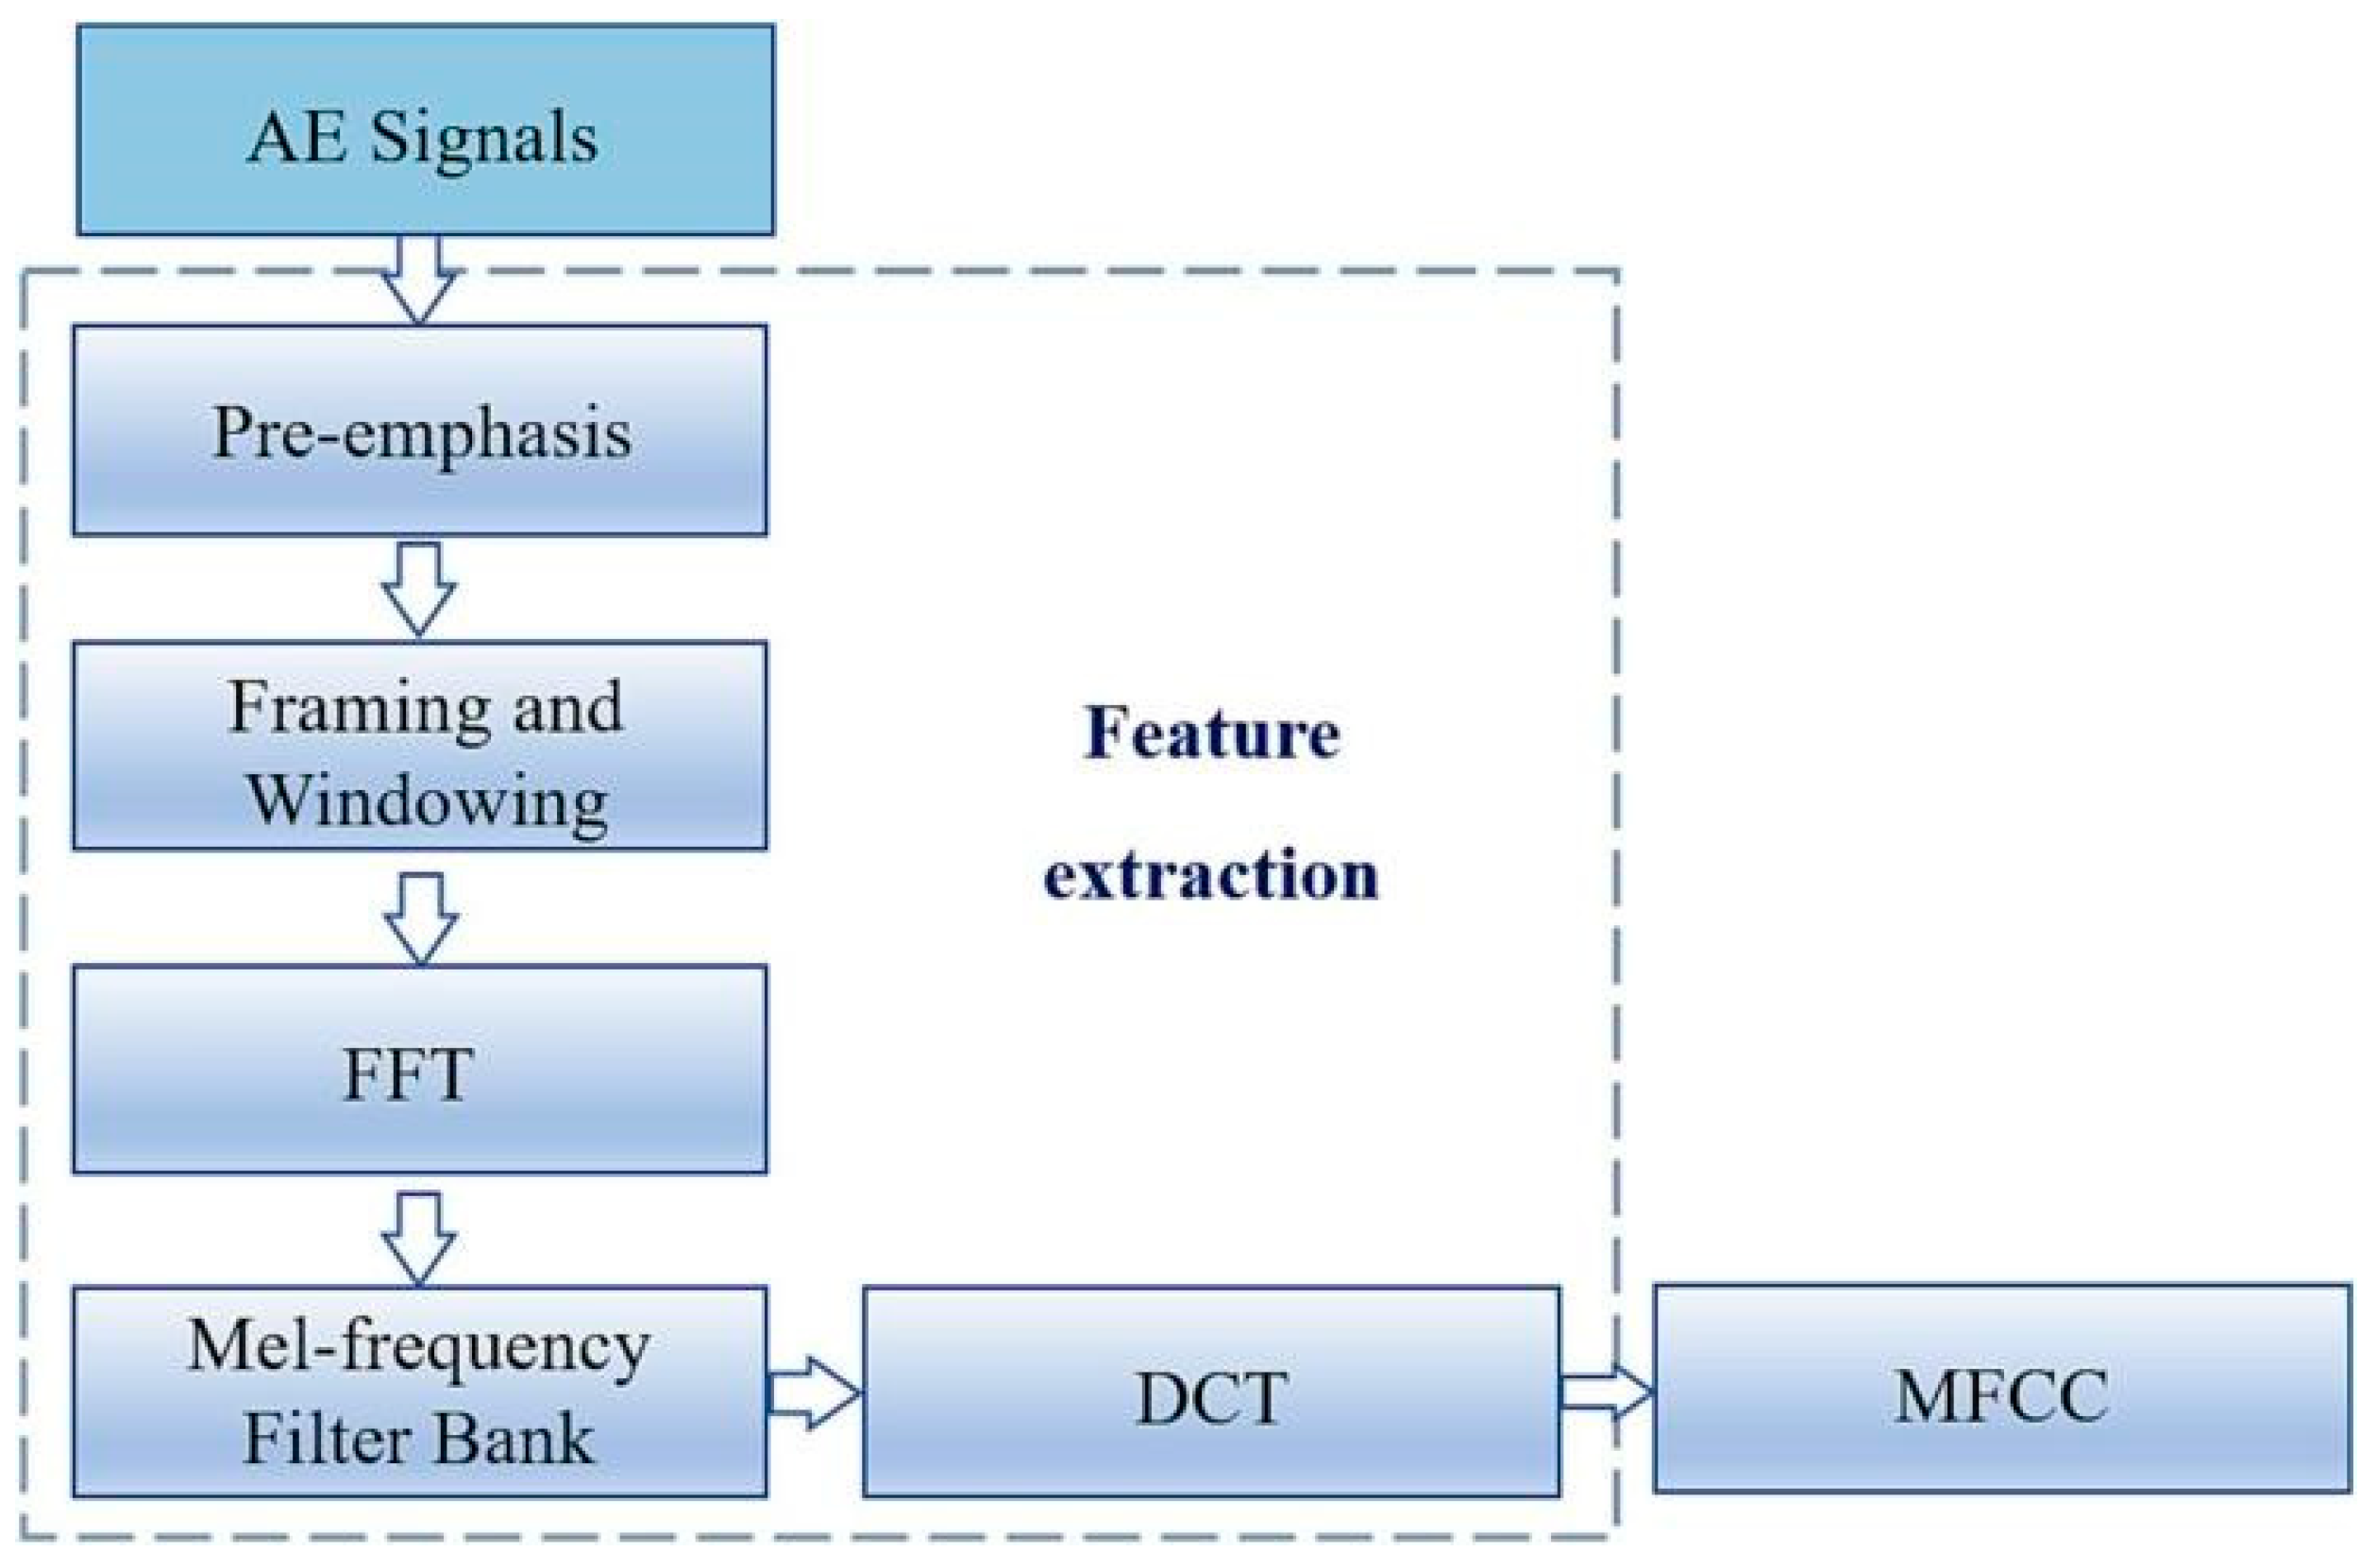
- Zhang, Z.; Xu, C.; Xie, J.; Zhang, Y.; Liu, P.; Liu, Z. MFCC-LSTM Framework for Leak Detection and Leak Size Identification in Gas-Liquid Two-Phase Flow Pipelines Based on Acoustic Emission. Measurement 2023, 219, 113238. [Google Scholar] [CrossRef]
- Li, Z.L.; Zhang, H.F.; Hao, Y.B.; Lei, H.X.; Chen, X.; Liu, Z. Internal leakage sound generation mechanism and detection test of natural Gas Pipeline Ball valve. Vibration 2017, 37, 525–531, 630. [Google Scholar] [CrossRef]
- Shi, M.; Liang, Y.; Qin, L.; Zheng, Z.; Huang, Z. Prediction Method of Ball Valve Internal Leakage Rate Based on Acoustic Emission Technology. Flow Meas. Instrum. 2021, 81, 102036. [Google Scholar] [CrossRef]
- Glegg, S.; Devenport, W. 4-Lighthill’s Acoustic Analogy. In Aeroacoustics of Low Mach Number Flows, 2nd ed.; Glegg, S., Devenport, W., Eds.; Academic Press: Cambridge, MA, USA, 2024; pp. 105–133. [Google Scholar] [CrossRef]
- Kim, K.H.; Yoon, G.H. Aeroacoustic Topology Optimization of Noise Barrier Based on Lighthill’s Acoustic Analogy. J. Sound Vib. 2020, 483, 115512. [Google Scholar] [CrossRef]
- Guasch, O.; Pont, A.; Baiges, J.; Codina, R. Concurrent Finite Element Simulation of Quadrupolar and Dipolar Flow Noise in Low Mach Number Aeroacoustics. Comput. Fluids 2016, 133, 129–139. [Google Scholar] [CrossRef]
- Yang, S.J. Notes on Green’s Function Method. College Physics 2023, 42, 1–5+10. [Google Scholar] [CrossRef]
- Goldstein, M. Unified Approach to Aerodynamic Sound Generation in the Presence of Solid Boundaries. J. Acoust. Soc. Am. 1974, 56, 497–509. [Google Scholar] [CrossRef]
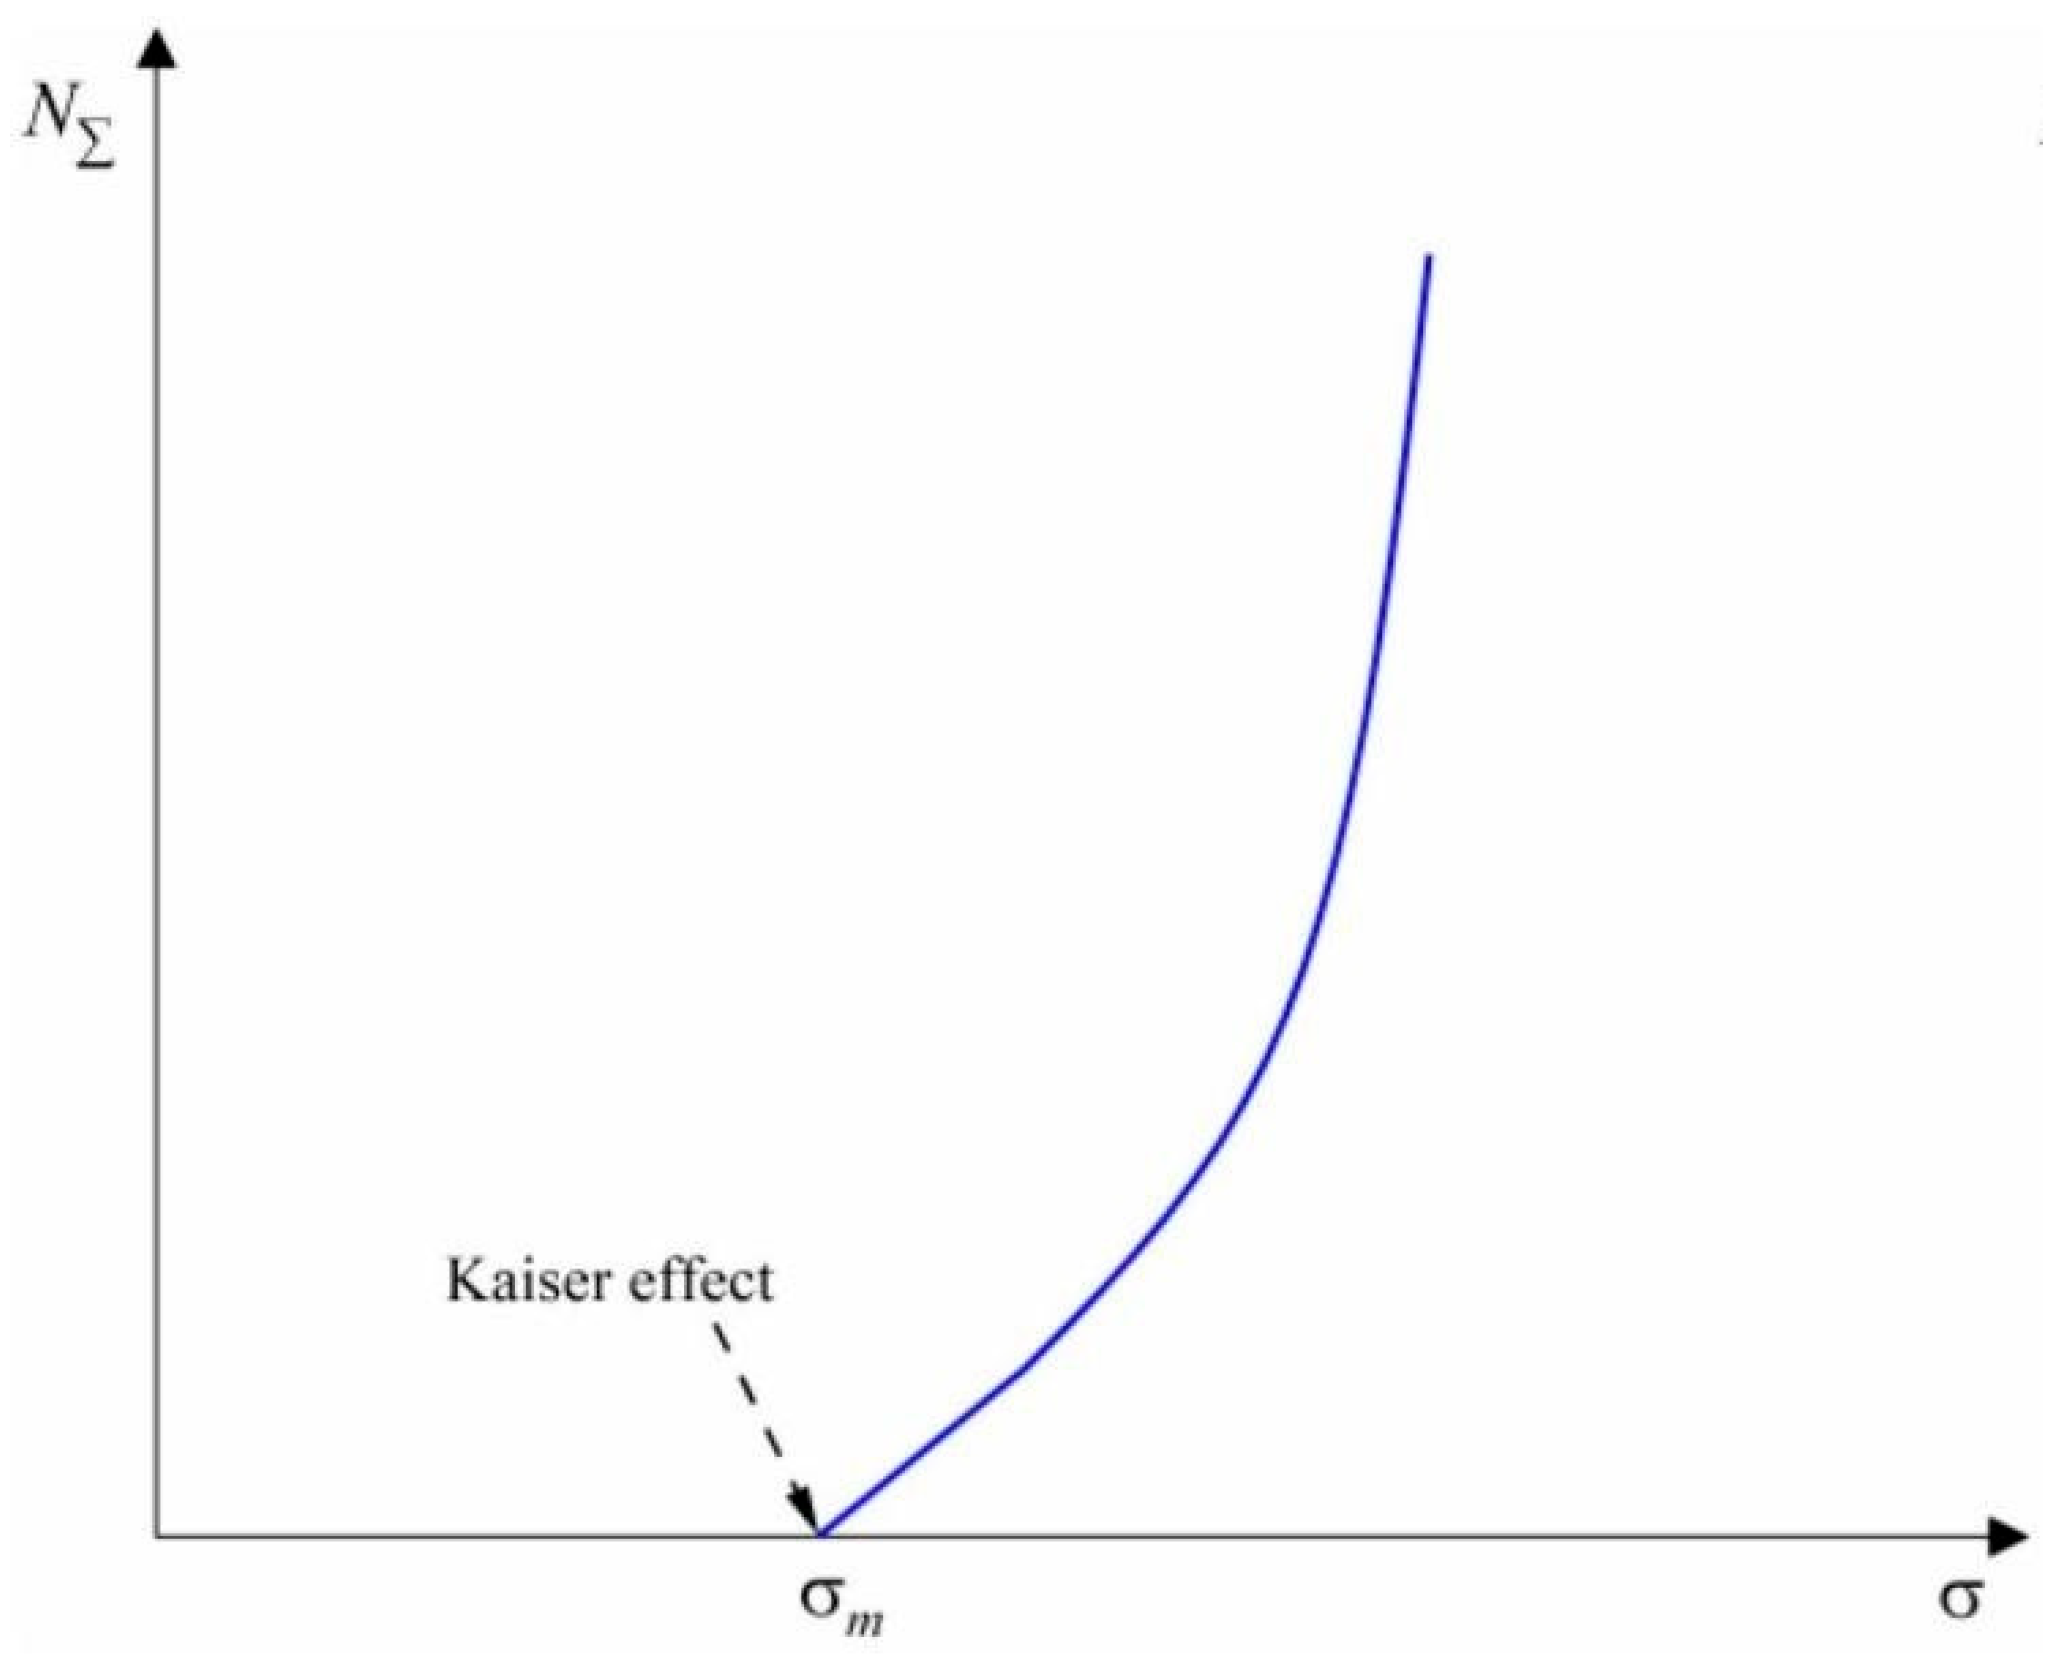
- Kaiser, J. Über das Auftreten von Geräuschen beim Schmelzen und Erstarren von Metallen. Forsch. Auf Dem Geb. Des Ingenieurwesens A 1957, 23, 38–42. [Google Scholar] [CrossRef]
- Zhao, K.; Yang, D.; Huang, Z.; Gong, C.; Zeng, P.; Wang, X.; Li, C.; Zhao, Y. Investigations and New Insights on the Relation between the Valid Interval of the Kaiser Effect and the Characteristic Stress. Earth-Sci. Rev. 2024, 249, 104673. [Google Scholar] [CrossRef]
- Nie, Q.; Liu, H.; Ma, T.; Cui, H. Experimental Study on Acoustic Emission of Steel Fiber Broken Pebble Recycled Concrete. Constr. Build. Mater. 2024, 452, 138942. [Google Scholar] [CrossRef]
- Shen, G.T.; Wu, Z.W.; Zhang, J.J. (Eds.) Advances in Acoustic Emission Technology. Proceedings of the World Conference on Acoustic Emission—2019; Springer Science and Business Media LLC.: Singapore, 2021. [Google Scholar]
- Lissek, F.; Kaufeld, M.; Tegas, J.; Hloch, S. Online-Monitoring for Abrasive Waterjet Cutting of CFRP via Acoustic Emission: Evaluation of Machining Parameters and Work Piece Quality Due to Burst Analysis. Procedia Eng. 2016, 149, 67–76. [Google Scholar] [CrossRef]
- Xie, J.; Wang, W.; Xu, C.; Fu, M.; Huang, W. Two-Step Feature Extraction of Acoustic Emission Signals for Leakage Detection of Valves in Gas Pipelines. Int. J. Press. Vessel. Pip. 2024, 212, 105364. [Google Scholar] [CrossRef]
- Braydi, A.; Fossat, P.; Ardabilian, M.; Bareille, O. Innovative Prognostic Methodology for Pipe Defect Detection Leveraging Acoustic Emissions Analysis and Computational Modeling Integration. Appl. Ocean Res. 2025, 158, 104521. [Google Scholar] [CrossRef]
- Yin, Z.Y.; Li, Z.Y.; Liu, E.Q. Research on the Failure Characteristics of Coal and Rock and Acoustic Emission Parameters under Uniaxial Loading Conditions. Mod. Min. 2024, 40, 36–39. [Google Scholar]
- Fan, H.; Tariq, S.; Zayed, T. Acoustic Leak Detection Approaches for Water Pipelines. Autom. Constr. 2022, 138, 104226. [Google Scholar] [CrossRef]
- Li, S.; Song, Y.; Zhou, G. Leak Detection of Water Distribution Pipeline Subject to Failure of Socket Joint Based on Acoustic Emission and Pattern Recognition. Measurement 2018, 115, 39–44. [Google Scholar] [CrossRef]
- Fleischmann, P.; Rouby, D.; Lakestani, F.; Baboux, J.C. A Spectrum Analysis of Acoustic Emission. Non-Destr. Test. 1975, 8, 241–244. [Google Scholar] [CrossRef]
- Tang, B.Q.; Liu, P.; Wang, X. Research on Internal Leakage Detection of Gas Medium Valves Based on Acoustic Emission Theory. Yunnan Chem. Ind. 2017, 44, 17–19. [Google Scholar]
- Yang, L.H. Wavelet Analysis Overview: From the Perspective of Signal Processing. J. Sun Yat-Sen Univ. (Nat. Sci. Ed. Chin. Engl.) 2024, 63, 202–223. [Google Scholar] [CrossRef]
- Li, H.Y.; Zhu, H.H.; Wu, J. Monitoring of Acoustic Emission of Internal Leakage in Valves and Extraction and Analysis of Signal Characteristics. China Ship Repair 2024, 37, 48–53. [Google Scholar] [CrossRef]
- Wang, Y.G.; Song, D.D.; Li, B.B.; Qi, J.N. A Review of Research on Detecting Gas Pipeline Leakage by Acoustic Emission Method. J. Saf. Environ. 2024, 24, 1114–1127. [Google Scholar] [CrossRef]
- Guan, Y.N.; Wang, C.; Song, B.Y. Processing and Analysis of Acoustic Emission Signals from Wind Turbine Blades Using Wavelet Analysis. J. Xi’an Jiaotong Univ. 2025, 59, 209–216. [Google Scholar]
- Juhani, J.M.; Ibrahim, R. Mother Wavelet Selection for Control Valve Leakage Detection Using Acoustic Emission. In Proceedings of the 2018 IEEE Conference on Systems, Process and Control (ICSPC), Melaka, Malaysia, 14–15 December 2018; pp. 224–227. [Google Scholar] [CrossRef]
- Sim, H.Y.; Ramli, R.; Saifizul, A.; Soong, M.F. Detection and Estimation of Valve Leakage Losses in Reciprocating Compressor Using Acoustic Emission Technique. Measurement 2020, 152, 107315. [Google Scholar] [CrossRef]
- Gupta, A.; Duke, J.C. Identifying the Arrival of Extensional and Flexural Wave Modes Using Wavelet Decomposition of Ultrasonic Signals. Ultrasonics 2018, 82, 261–271. [Google Scholar] [CrossRef]
- Gao, J.; Liu, Y.; Duan, C.; Ding, P.; Song, J. Research on Fault Diagnosis of Electric Gate Valve in Nuclear Power Plant Based on the VMD-MDI-ISSA-RF Model. Ann. Nucl. Energy 2024, 207, 110701. [Google Scholar] [CrossRef]
- Li, J.; Chen, Y.; Qian, Z.; Lu, C. Research on VMD Based Adaptive Denoising Method Applied to Water Supply Pipeline Leakage Location. Measurement 2020, 151, 107153. [Google Scholar] [CrossRef]
- Li, Z.X.; Wang, C.P.; Bao, H.R. Improve the Application of the Combined Method of VMD and Envelope Spectrum in Pipeline Leakage. Mech. Des. Manuf. 2022, 7, 102–107. [Google Scholar] [CrossRef]
- Igor, R.; Dmitry, M.; Inna, R.; Alexei, V. A Time-Frequency Based Approach for Acoustic Emission Assessment of Sliding Wear. Lubricants 2020, 8, 52. [Google Scholar] [CrossRef]
- Zhao, D.; Liu, S.; Gu, D.; Sun, X.; Wang, L.; Wei, Y.; Zhang, H. Improved Multi-Scale Entropy and It’s Application in Rolling Bearing Fault Feature Extraction. Measurement 2020, 152, 107361. [Google Scholar] [CrossRef]
- Agletdinov, E.A.; Yasnikov, I.S. Application of Recurrence Quantification Analysis of Acoustic Emission Time Series to Analysis of a Plastic Flow of Metals. Phys. Rev. E 2023, 108, 044217. [Google Scholar] [CrossRef]
- Zagretdinov, A.; Ziganshin, S.; Izmailova, E.; Vankov, Y.; Klyukin, I.; Alexandrov, R. Monitoring Pipeline Leaks Using Fractal Analysis of Acoustic Signals. Fractal Fract. 2025, 9, 178. [Google Scholar] [CrossRef]
- Gou, Y.F. Research on Acoustic Emission Recognition of Valve Internal Leakage Based on Optimized Support Vector Machine Algorithm. Master’s Thesis, Chongqing University, Chongqing, China, 2024. [Google Scholar] [CrossRef]
- Gong, J.L.; Cao, L.H.; Li, D.C.; Si, H.Y. Research on Valve Internal Leakage Diagnosis Based on Sparrow Algorithm Optimization of Support Vector. Mach. Steam Turbine Technol. 2025, 67, 110–112+126. [Google Scholar]
- Zhou, S.T.; Zhang, L.; Nie, C.H.; Fan, W.Y.T.; Huang, Y.P.; Liu, J.; Yuan, K. Research on Efficient Verification and Status Identification Methods for the Action Reliability of Manual Stop Valves. Nucl. Power Eng. 2024, 45, 190–195. [Google Scholar] [CrossRef]
- Chen, C.H.; Shi, Z.B.; Cao, L.H. Turbine Rotor Fault Diagnosis Based on Cloud Particle Swarm Optimization (SVM). Steam Turbine Technol. 2018, 60, 201–204+207. [Google Scholar]
- Mysorewala, M.F.; Cheded, L.; Ali, I.M. Leak Detection Using Flow-Induced Vibrations in Pressurized Wall-Mounted Water Pipelines. IEEE Access 2020, 8, 188673–188687. [Google Scholar] [CrossRef]
- Liu, Y.; Ma, X.; Li, Y.; Tie, Y.; Zhang, Y.; Gao, J. Water Pipeline Leakage Detection Based on Machine Learning and Wireless Sensor Networks. Sensors 2019, 19, 5086. [Google Scholar] [CrossRef] [PubMed]
- Xie, W.; Liu, Y.; Wang, X.; Wang, J. The Pipeline Leak Detection Algorithm Based on D-S Evidence Theory and Signal Fusion Mechanism. Alex. Eng. J. 2023, 85, 218–235. [Google Scholar] [CrossRef]
- Liang, L.-P.; Zhang, J.; Xu, K.-J.; Ye, G.-Y.; Yang, S.-L.; Yu, X.-L. Classification Modeling of Valve Internal Leakage Acoustic Emission Signals Based on Optimal Wavelet Scattering Coefficients. Measurement 2024, 236, 115112. [Google Scholar] [CrossRef]
- Ma, F.; Fan, J.; Yang, Y.; Fang, Y.; Tian, C.; Ding, J. Evaluation Method of Tubing Leakage Flow Rate Based on Acoustic Detection Technology. Flow Meas. Instrum. 2025, 102, 102786. [Google Scholar] [CrossRef]
- Cui, J.; Du, J. Investigation into Acoustic Emission-Based Methodology for Precise Localization of Pipeline Leakage Sources. Measurement 2025, 250, 117194. [Google Scholar] [CrossRef]
- Zhou, W. Research on Fault Diagnosis of Electric Valves Based on IPSO-SVM and DBN. Master’s Thesis, Harbin Engineering University, Harbin, China, 2019. [Google Scholar]
- Shukla, H.; Piratla, K. Leakage Detection in Water Pipelines Using Supervised Classification of Acceleration Signals. Autom. Constr. 2020, 117, 103256. [Google Scholar] [CrossRef]
- Du, J.; Zeng, J.; Chen, C.; Ni, M.; Guo, C.; Zhang, S.; Wang, H.; Ding, H. Acoustic Emission Monitoring for Damage Diagnosis in Composite Laminates Based on Deep Learning with Attention Mechanism. Mech. Syst. Signal Process. 2025, 222, 111770. [Google Scholar] [CrossRef]
- Song, Y.; Li, S. Gas Leak Detection in Galvanised Steel Pipe with Internal Flow Noise Using Convolutional Neural Network. Process Saf. Environ. Prot. 2021, 146, 736–744. [Google Scholar] [CrossRef]
- Ruiz-Vanoye, J.A.; Diaz-Parra, O.; Marroquín-Gutiérrez, F.; Salgado-Ramírez, J.C.; Ramos-Fernández, J.C.; Xicotencatl-Pérez, J.M.; Ortiz-Suarez, L.A. Foundations of Smart Water and Artificial Intelligence Technologies. In Smart Water Technology for Sustainable Management in Modern Cities; IGI Global Scientific Publishing: Hershey, PA, USA, 2025; pp. 1–30. [Google Scholar] [CrossRef]
- Cody, R.; Harmouche, J.; Narasimhan, S. Leak Detection in Water Distribution Pipes Using Singular Spectrum Analysis. Urban Water J. 2018, 15, 636–644. [Google Scholar] [CrossRef]
- Mishra, A.; Dhebar, J.; Das, B.; Patel, S.S.; Rai, A. Leak Detection in Pipelines Based on Acoustic Emission and Growing Neural Gas Network Utilizing Unlabeled Healthy Condition Data. Flow Meas. Instrum. 2025, 102, 102816. [Google Scholar] [CrossRef]
- Guo, G.C.; Yu, X.P.; Liu, S.M.; Ma, Z.Q.; Wu, Y.P.; Xu, X.Y.; Wang, X.T.; Smith, K.; Wu, X. Leakage Detection in Water Distribution Systems Based on Time–Frequency Convolutional Neural Network. J. Water Resour. Plan. Manag. 2021, 147, 04020101. [Google Scholar] [CrossRef]
- Hu, J.; Yu, Y.; Yang, J.; Jia, H. Research on the Generalisation Method of Diesel Engine Exhaust Valve Leakage Fault Diagnosis Based on Acoustic Emission. Measurement 2023, 210, 112560. [Google Scholar] [CrossRef]
- Sun, J.D.; Wang, L.X.; Wen, J.T.; Xiao, Q. Improve the Pipeline Leakage Aperture Identification of the Dense Block Lightweight Neural Network. Instrum. Meters 2022, 43, 98–108. [Google Scholar] [CrossRef]
- Yao, L.; Zhang, Y.; He, T.; Luo, H. Natural Gas Pipeline Leak Detection Based on Acoustic Signal Analysis and Feature Reconstruction. Appl. Energy 2023, 352, 121975. [Google Scholar] [CrossRef]
- Ali, A.; Xinhua, W.; Razzaq, I. Pipeline Leak Detection through Implementation of Empirical Mode Decomposition and Cluster Analysis. Measurement 2025, 248, 116873. [Google Scholar] [CrossRef]
- Quy, T.B.; Kim, J.-M. Crack Detection and Localization in a Fluid Pipeline Based on Acoustic Emission Signals. Mech. Syst. Signal Process. 2021, 150, 107254. [Google Scholar] [CrossRef]
- Motahari-Nezhad, M.; Jafari, S.M. Bearing Remaining Useful Life Prediction under Starved Lubricating Condition Using Time Domain Acoustic Emission Signal Processing. Expert Syst. Appl. 2021, 168, 114391. [Google Scholar] [CrossRef]


| Comparison Dimension | The Lighthill Equation (Quadrupole Sound Source) | Curle Extension (Dipole Sound Source) |
|---|---|---|
| Physical meaning | It is generated by the turbulent stress (velocity pulsation) within the fluid, with the sound source symmetrically distributed and no net force acting on it | It is generated by the pressure pulsation at the boundary between the fluid and the solid. The sound source is asymmetric, and there is a net force effect |
| Mathematical form | In the previous text, (1) | In the previous text, (2) |
| Sound source type | Quadrupole (two pairs of inverse force couples, similar to “dual speaker” radiation) | Dipole (a pair of reverse forces, similar to the vibration of a “single speaker”) |
| Acoustic radiation efficiency | low | high |
| Typical application scenarios | Free turbulent noise (valve jet noise) | Solid boundary noise (such as pipe wall vibration, valve internal leakage, and valve seat collision noise) |
| Schematic diagram description |  |  |
| Technology Category | Processing Algorithm/Model | Optimization Algorithm Combination | Application Scenarios | Performance Index | Performance Index |
|---|---|---|---|---|---|
| Parameter analysis method | Time domain parameters (ringing count, energy) | No. | Rapid screening of valve status | Has high real-time performance but low accuracy | [17,20,22,24] |
| Frequency domain parameters (peak frequency, centroid) | No. | Identification of leakage frequency bands | The energy distribution in the frequency domain is significant | [20,26] | |
| Mel–GAN two-step feature extraction | No. | Classification of Valve leakage | The misjudgment rate of micro-opening leakage was 7.18% | [20] | |
| Time–frequency analysis | Short-time Fourier Transform (STFT | No. | Preliminary analysis of non-stationary signals | The time–frequency resolution is limited by the window length | [25] |
| Continuous Wavelet Transform (CWT | No. | High-precision time–frequency positioning | Adjustable scale parameters adapt to different frequencies | [27,28] | |
| Discrete Wavelet Transform (DWT) | No. | Signal denoising for valve internal leakage | The db wavelet is optimal, and the entropy sensitivity is increased by 30% | [31,32] | |
| Wavelet Packet Decomposition (WPD) | No. | Complex frequency band feature extraction | Higher-frequency band resolution | [28,30] | |
| Empirical Mode Decomposition (EMD) | No. | Nonlinear signal processing | The modal aliasing is severe | [34,62] | |
| Local Mean Decomposition (LMD) | No. | Alleviate modal aliasing | The endpoint effect still exists | [34] | |
| Variational Mode Decomposition (VMD) | ISSA optimizes the number of layers/penalty factor | Diagnosis of valve faults in nuclear power plants | The average accuracy rate is high, superior to LMD and EMD | [34,35,36] | |
| Nonlinear analysis | Multi-scale Entropy (MSE) | No. | Complexity assessment | Sensitive to noise | [38] |
| Improved multi-scale entropy (LMMSE/EMSE) | No. | Bearing fault diagnosis | The feature recognition rate is 92% and the noise robustness is strong | [38] | |
| Time difference of arriva (TDOA) | No. | Location of cracks in liquid pipelines | The false alarm rate decreased from 35% in the traditional method to 8% | [63] | |
| Recursive Quantitative Analysis (RQA) | No. | Metal dislocation dynamics | The prediction error of plastic instability is less than 10% | [39] | |
| Traditional machine learning | Support Vector Machine (SVM) | SSA optimizes nuclear parameters | Classification of internal leakage in valves | The accuracy rate of SSA-SVM is 99% | [41] |
| K-nearest Neighbor (KNN) | No. | Simple leakage classification | The accuracy rate is 90–93% | [32,63,64] | |
| Random Forest (RF) | ISSA optimizes the feature subset and tree parameters | Pipeline leakage flow prediction | R2 = 0.894, MAE = 8.22 L/min | [49] | |
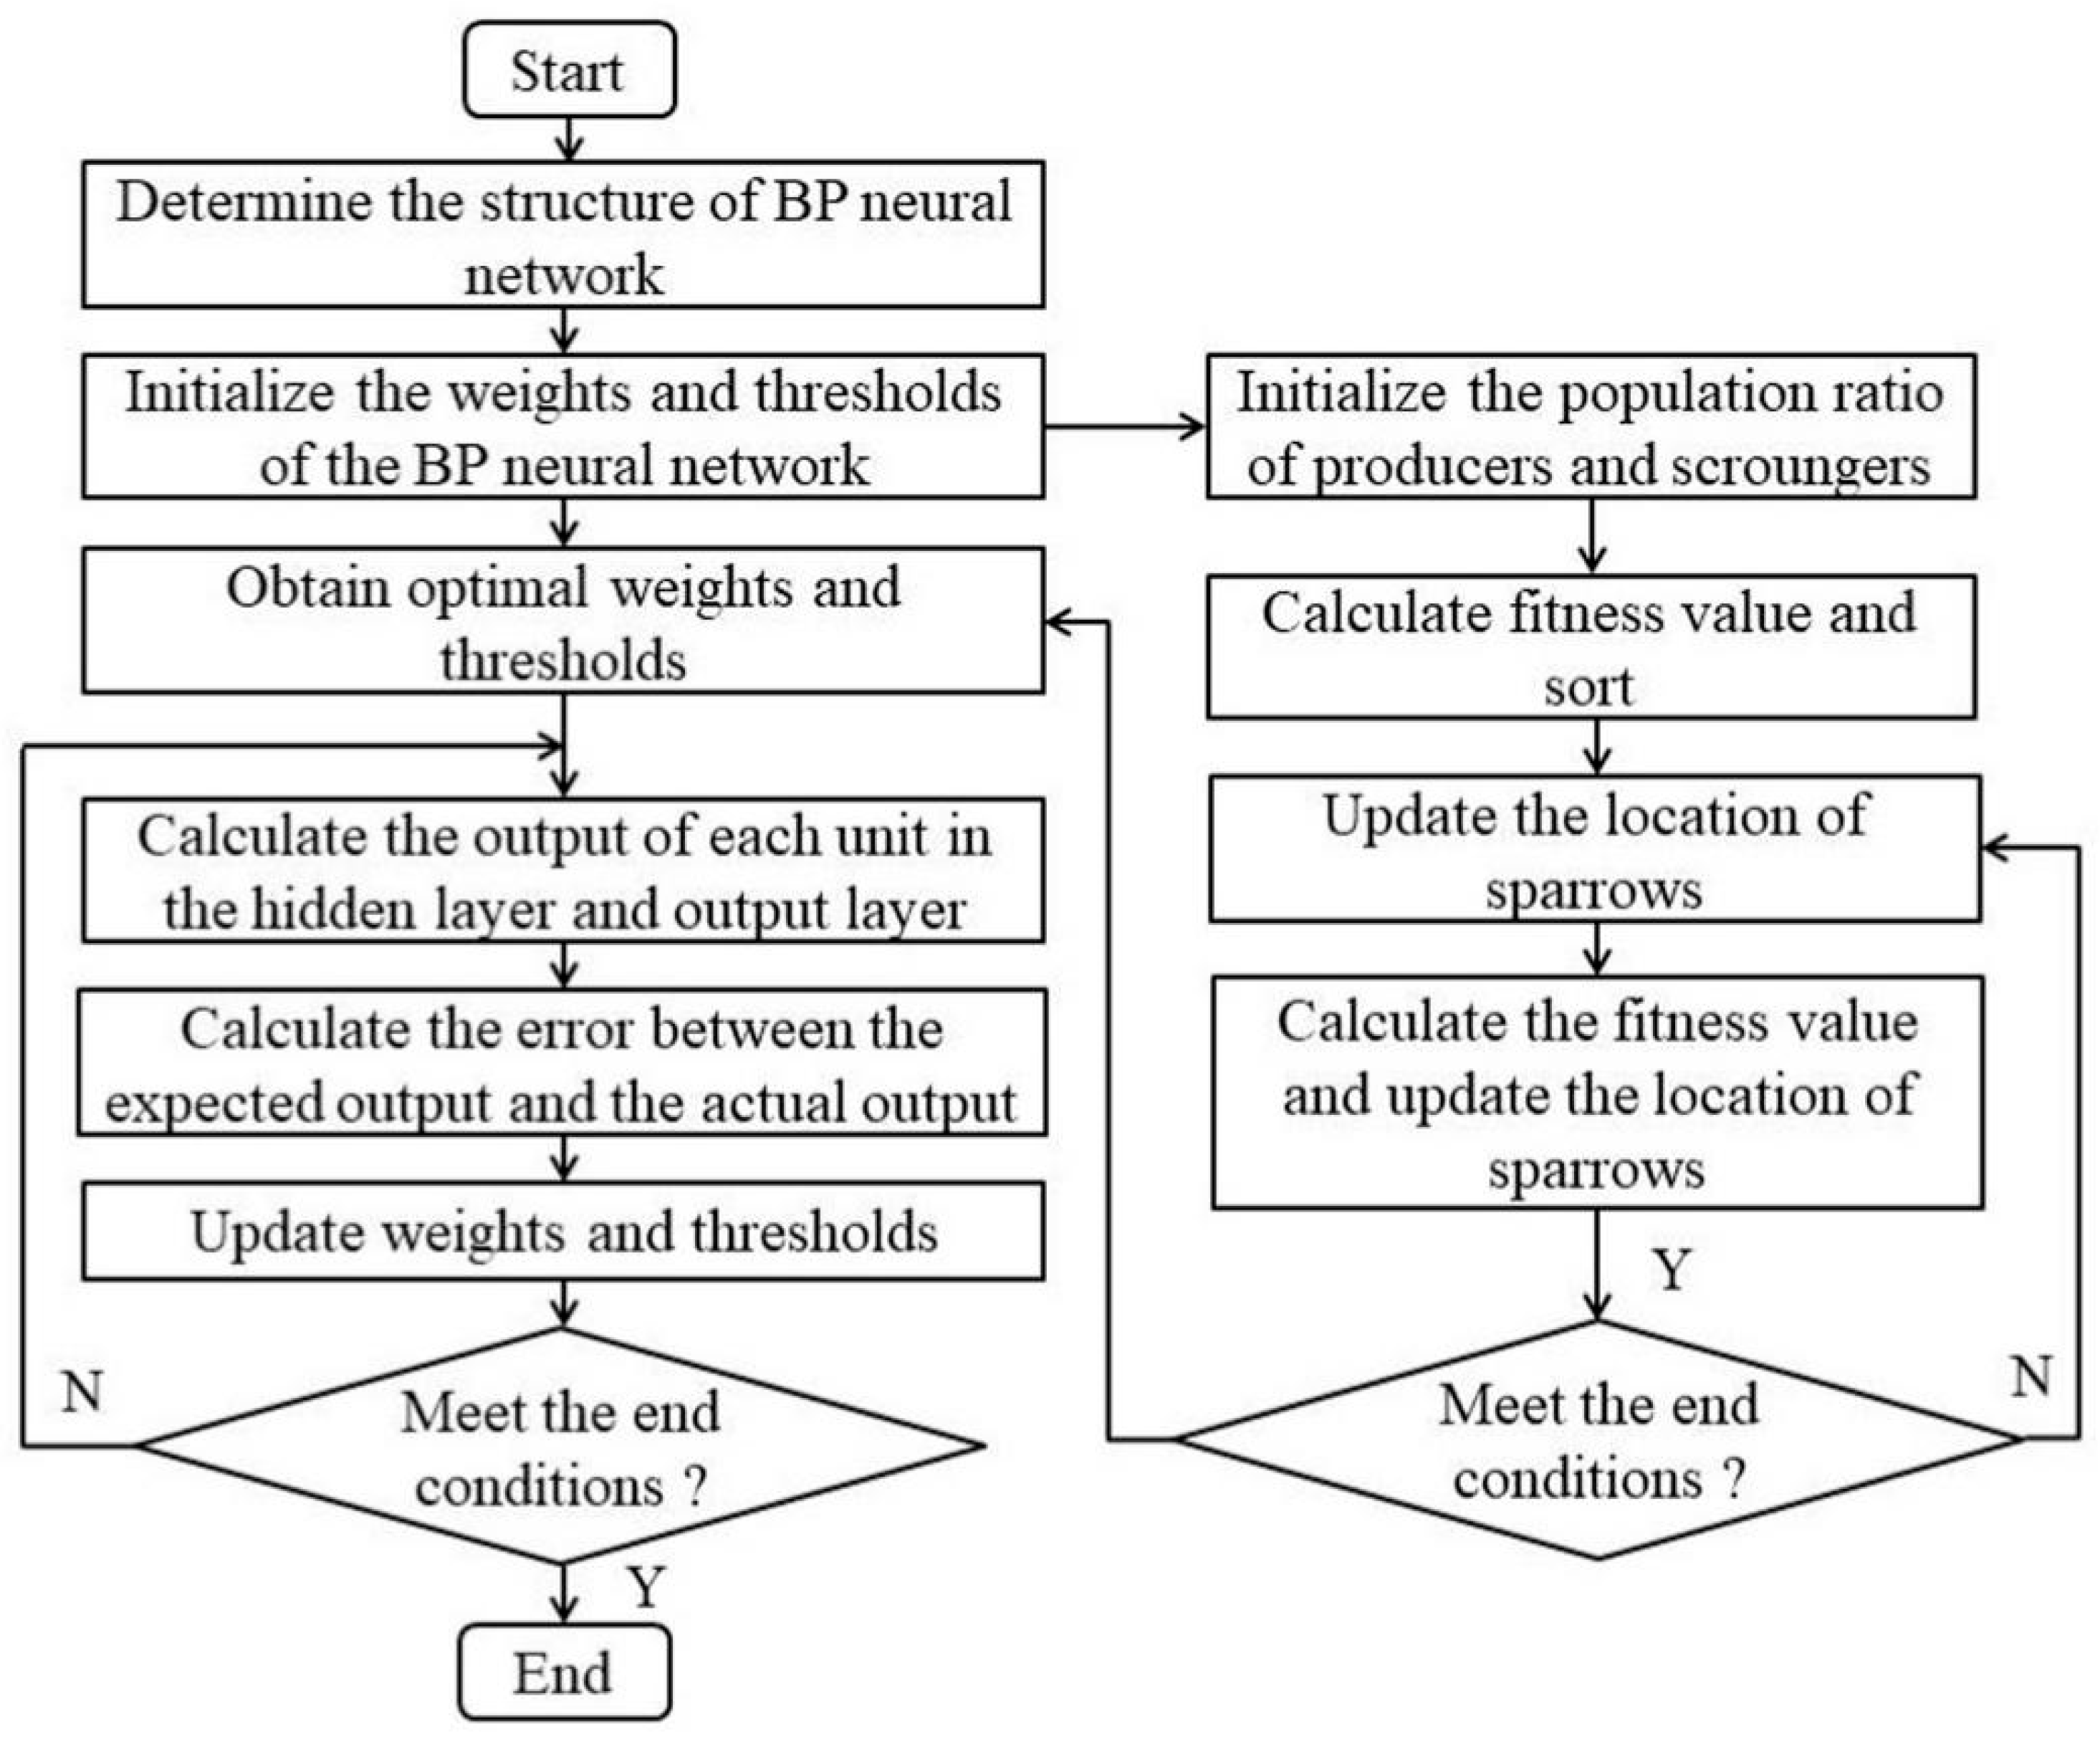
| BP neural network | SSA optimizes the initial weights | Prediction of internal leakage rate of ball valves | Error <6% | [50] | |
| AdaBoost.M1 | Relief-F feature selection | Classification of internal leakage status of valves | Small-sample overfitting control | [48] | |
| Deep learning | Deep Belief Network (DBN) | No. | Fault diagnosis of electric valves | The input effect of time-domain features is the best | [51] |
| Convolutional Neural Network (CNN) | No. | Classification of pipeline leakage images | Accuracy rate: 95% | [52] | |
| CBAM-CNN | No. | Classification of damage to composite materials | Accuracy rate: 98.87% | [53] | |
| 1D-CNN | Domain Adaptation (MDD/DANN) | Cross-model diagnosis of diesel engine exhaust valve faults | The accuracy rate of MDD is the best | [59] | |
| LSTM | No. | Leakage in the gas–liquid two-phase flow pipeline | Accuracy rate: 98.4% | [7] | |
| MFCC-LSTM | No. | Leakage detection in complex working conditions | The identification rate of crack leakage is 100% | [7] | |
| Variational Autoencoder (VAE) | No. | Small-sample leakage detection | The reconstruction error detection is abnormal | [56] | |
| Growth Neural Gas Network (GNG) | No. | Unlabeled pipeline leakage detection | The leakage sensitivity of 0.3mm is 96.5% | [57] | |
| Optimization algorithm | Sparrow Search Algorithm (SSA) | Independent optimizer | General hyperparameter optimization | The convergence speed is 20% faster than that of PSO | [9,28,42,49] |
| Improve SSA (ISSA) | Reverse learning + random walk | Complex nonlinear optimization | Avoid premature convergence and increase R2 by 5% | [34,49] | |
| Particle Swarm Optimization (PSO) | Optimize the parameters of SVM | Replace the comparison benchmark of SSA | Prone to fall into local optimum | [36] |
Disclaimer/Publisher’s Note: The statements, opinions and data contained in all publications are solely those of the individual author(s) and contributor(s) and not of MDPI and/or the editor(s). MDPI and/or the editor(s) disclaim responsibility for any injury to people or property resulting from any ideas, methods, instructions or products referred to in the content. |
© 2025 by the authors. Licensee MDPI, Basel, Switzerland. This article is an open access article distributed under the terms and conditions of the Creative Commons Attribution (CC BY) license (https://creativecommons.org/licenses/by/4.0/).
Share and Cite
Zheng, D.; Wang, X.; Yang, L.; Li, Y.; Xia, H.; Zhang, H.; Xiang, X. Review of Acoustic Emission Detection Technology for Valve Internal Leakage: Mechanisms, Methods, Challenges, and Application Prospects. Sensors 2025, 25, 4487. https://doi.org/10.3390/s25144487
Zheng D, Wang X, Yang L, Li Y, Xia H, Zhang H, Xiang X. Review of Acoustic Emission Detection Technology for Valve Internal Leakage: Mechanisms, Methods, Challenges, and Application Prospects. Sensors. 2025; 25(14):4487. https://doi.org/10.3390/s25144487
Chicago/Turabian StyleZheng, Dongjie, Xing Wang, Lingling Yang, Yunqi Li, Hui Xia, Haochuan Zhang, and Xiaomei Xiang. 2025. "Review of Acoustic Emission Detection Technology for Valve Internal Leakage: Mechanisms, Methods, Challenges, and Application Prospects" Sensors 25, no. 14: 4487. https://doi.org/10.3390/s25144487
APA StyleZheng, D., Wang, X., Yang, L., Li, Y., Xia, H., Zhang, H., & Xiang, X. (2025). Review of Acoustic Emission Detection Technology for Valve Internal Leakage: Mechanisms, Methods, Challenges, and Application Prospects. Sensors, 25(14), 4487. https://doi.org/10.3390/s25144487