
Preliminary Quantitative Evaluation of the Optimal Colour System for the Assessment of Peripheral Circulation from Applied Pressure Using Machine Learning

 , , , , and
Abstract
1. Introduction
2. Theoretical Background
2.1. Colour Spaces
2.1.1. RGB
- R: Average of red pixel values within Region of Interest (ROI);
- G: Average of green pixel values within ROI;
- B: Average of blue pixel values within ROI;
- i: Row index of pixel;
- j: Column index of pixel;
- P: Set of all pixel coordinates contained in the area defined as ROI;
- N: Total number of pixels within ROI.
2.1.2. HSV
- H: Average of Hue pixel values within ROI;
- S: Average of Saturation pixel values within ROI;
- V: Average of Value pixel values within ROI;
- i: Row index of pixel;
- j: Column index of pixel;
- P: Set of all pixel coordinates contained in the area defined as ROI;
- N: Total number of pixels within ROI.

2.1.3. CIELAB
- : Range scaled from 0 to 255;
- : Range scaled from 0 to 255;
- : Range scaled from 0 to 255.

2.1.4. JCh
- A: Achromatic response—achromatic component of the observed object;
- : White point of the Achromatic response—achromatic component of the white reference;
- c: Scaling coefficient considering the surrounding conditions;
- z: Degree of adaptation—usually defined as (where , the relative luminance ratio between the background and white).
2.2. Fundamental Evaluation for Non-Invasive Detection of Early Circulatory Changes Using Colour Space Analysis
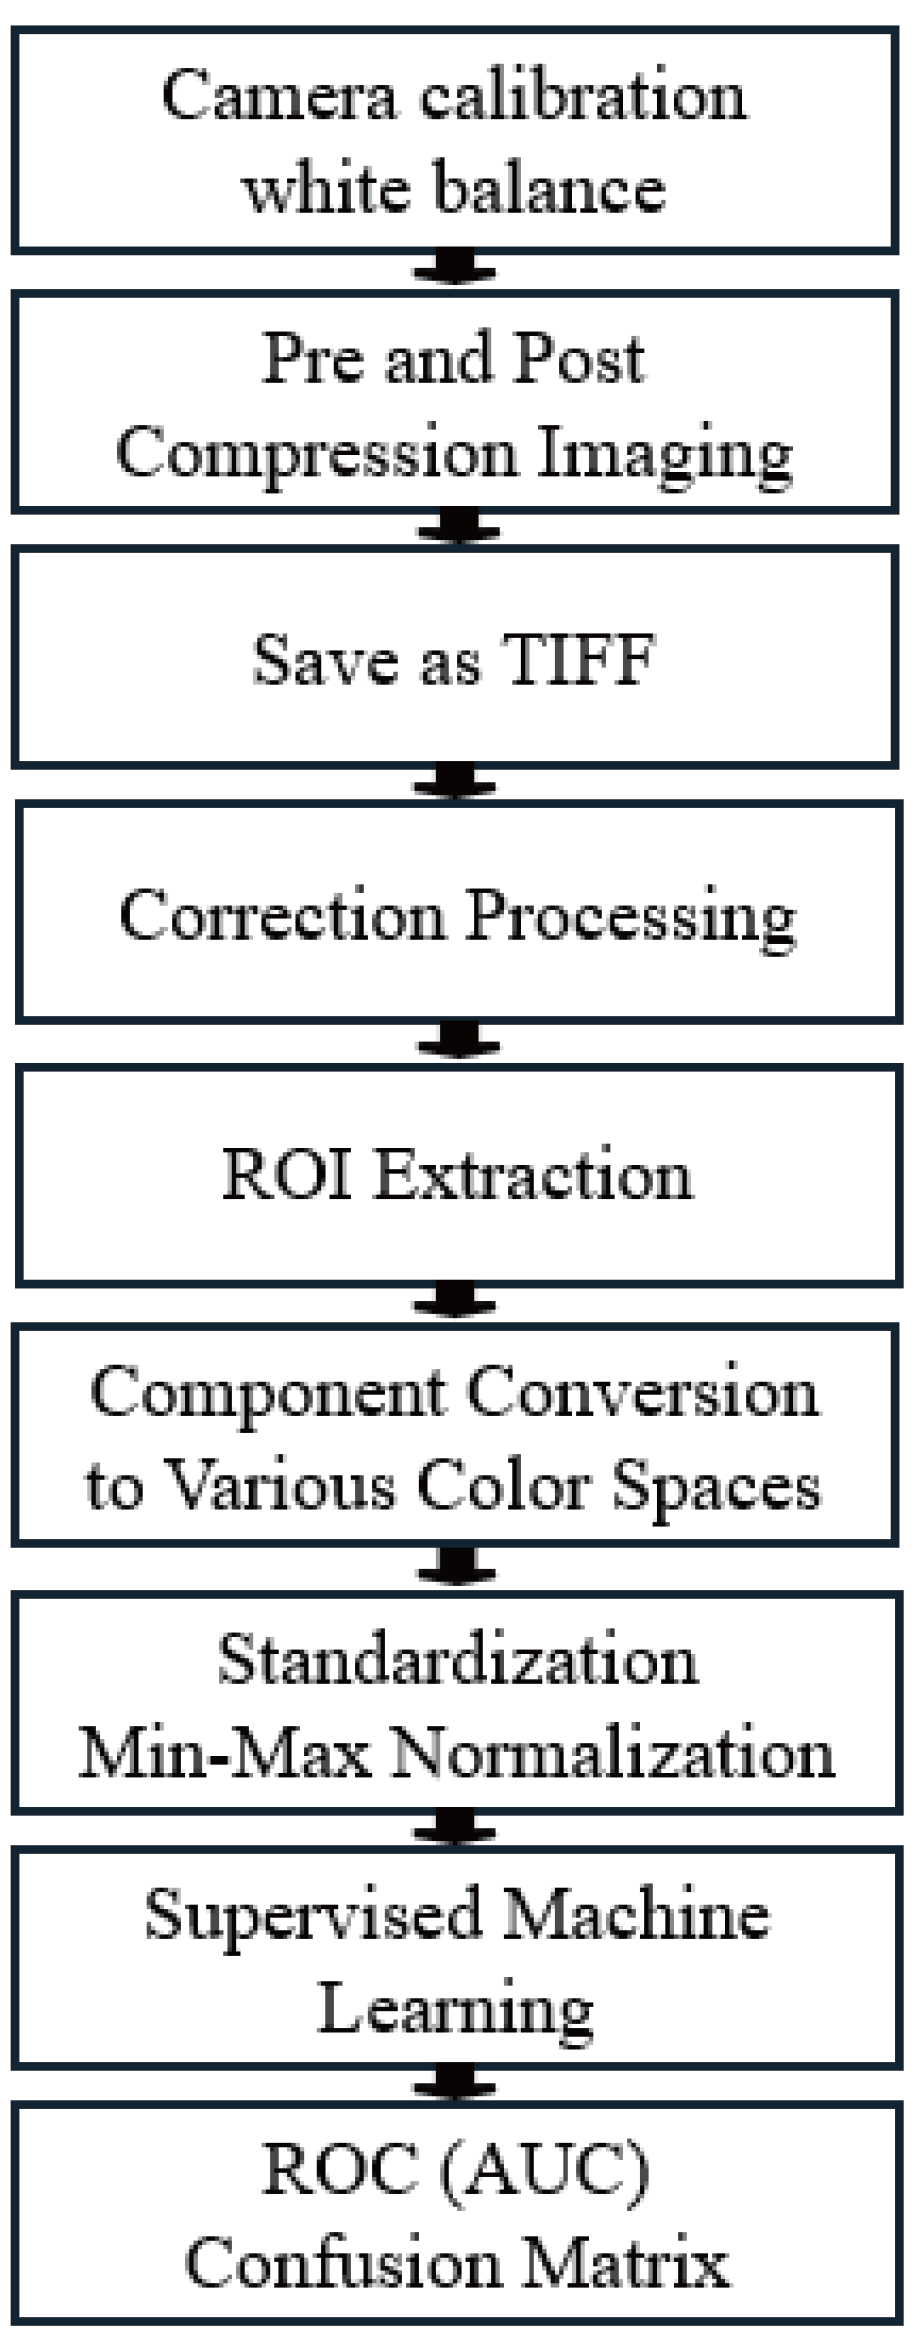
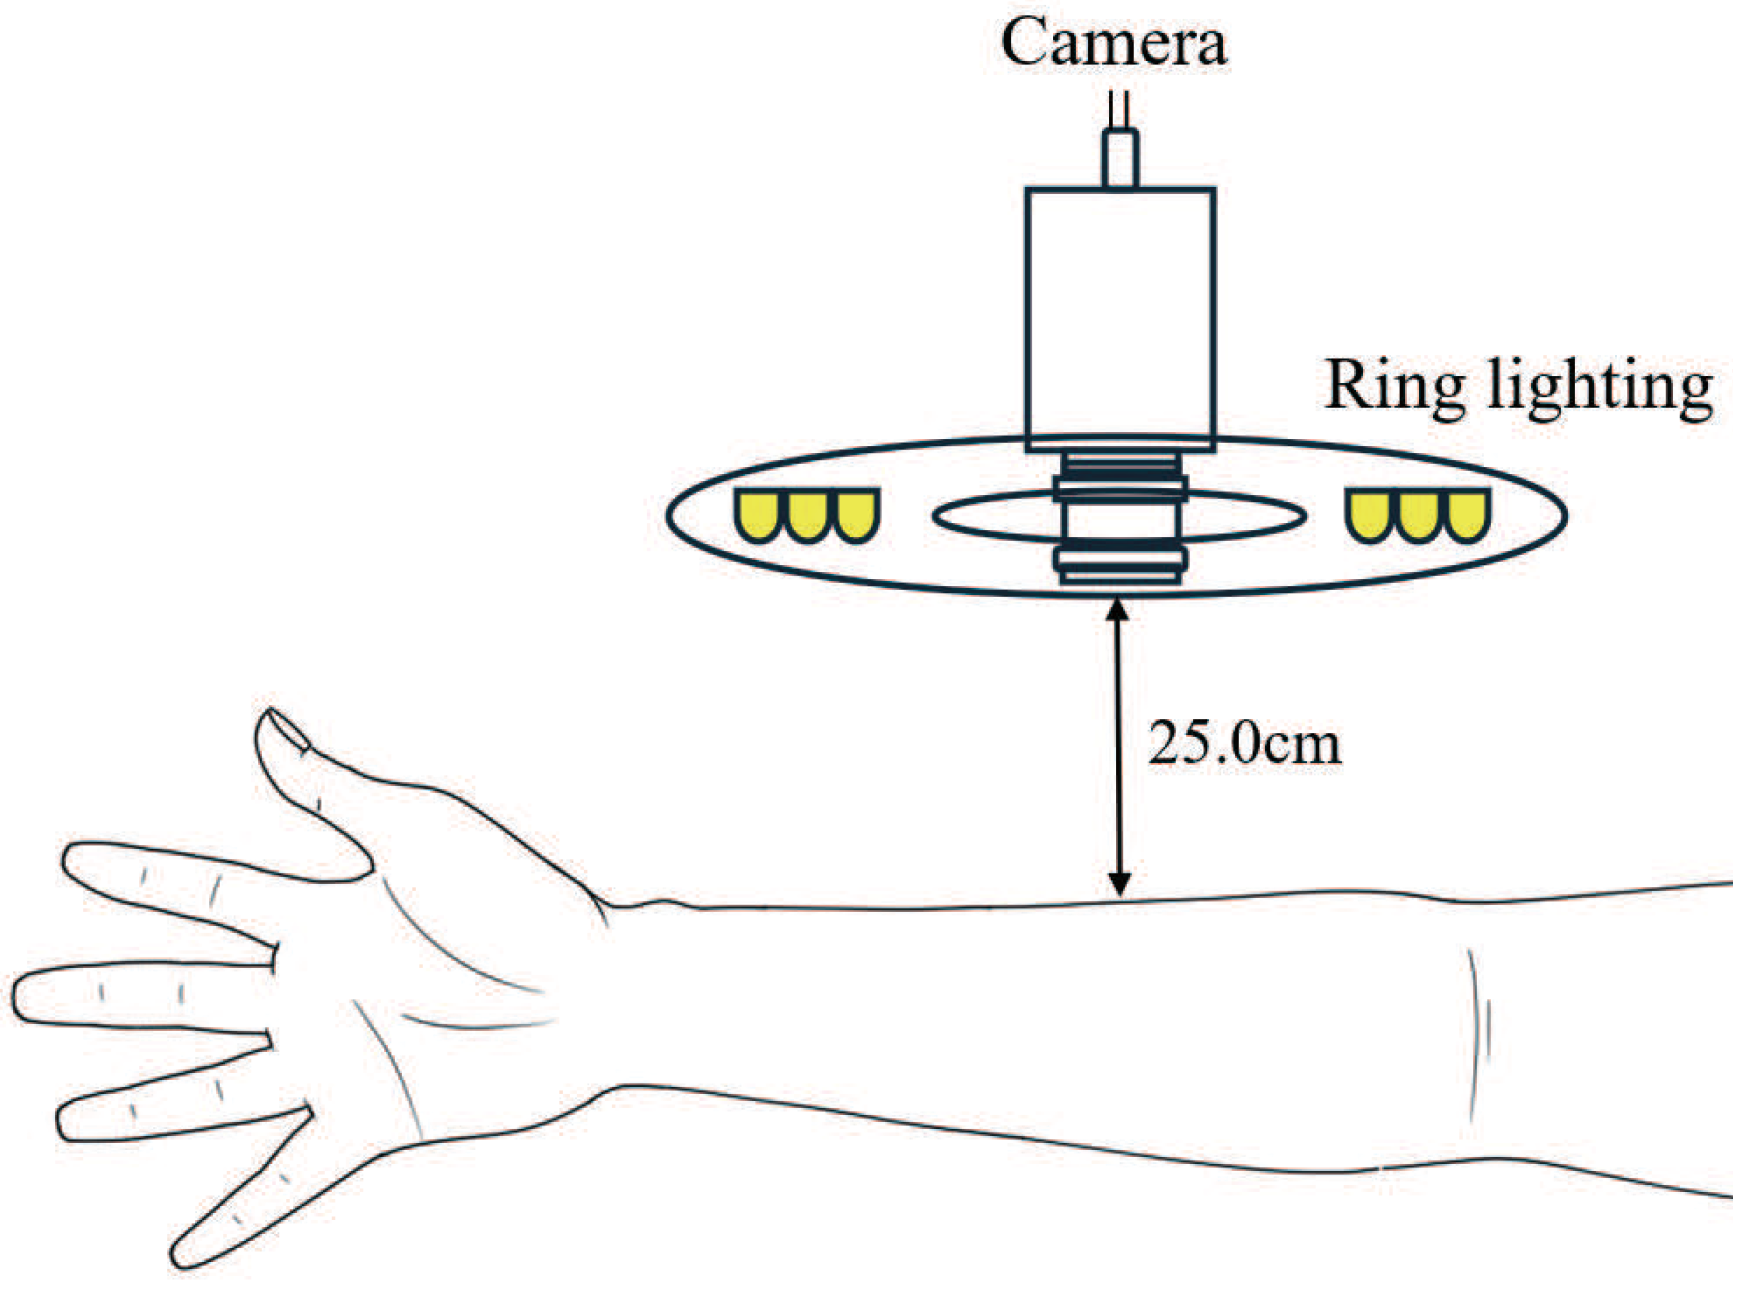
3. Experimental Environment
3.1. Protocols
3.2. Evaluation Index of the Performance of the Classification Models
3.2.1. Definition of Evaluation Index
3.2.2. Receiver Operating Characteristic (ROC) and Area Under the Curve (AUC)
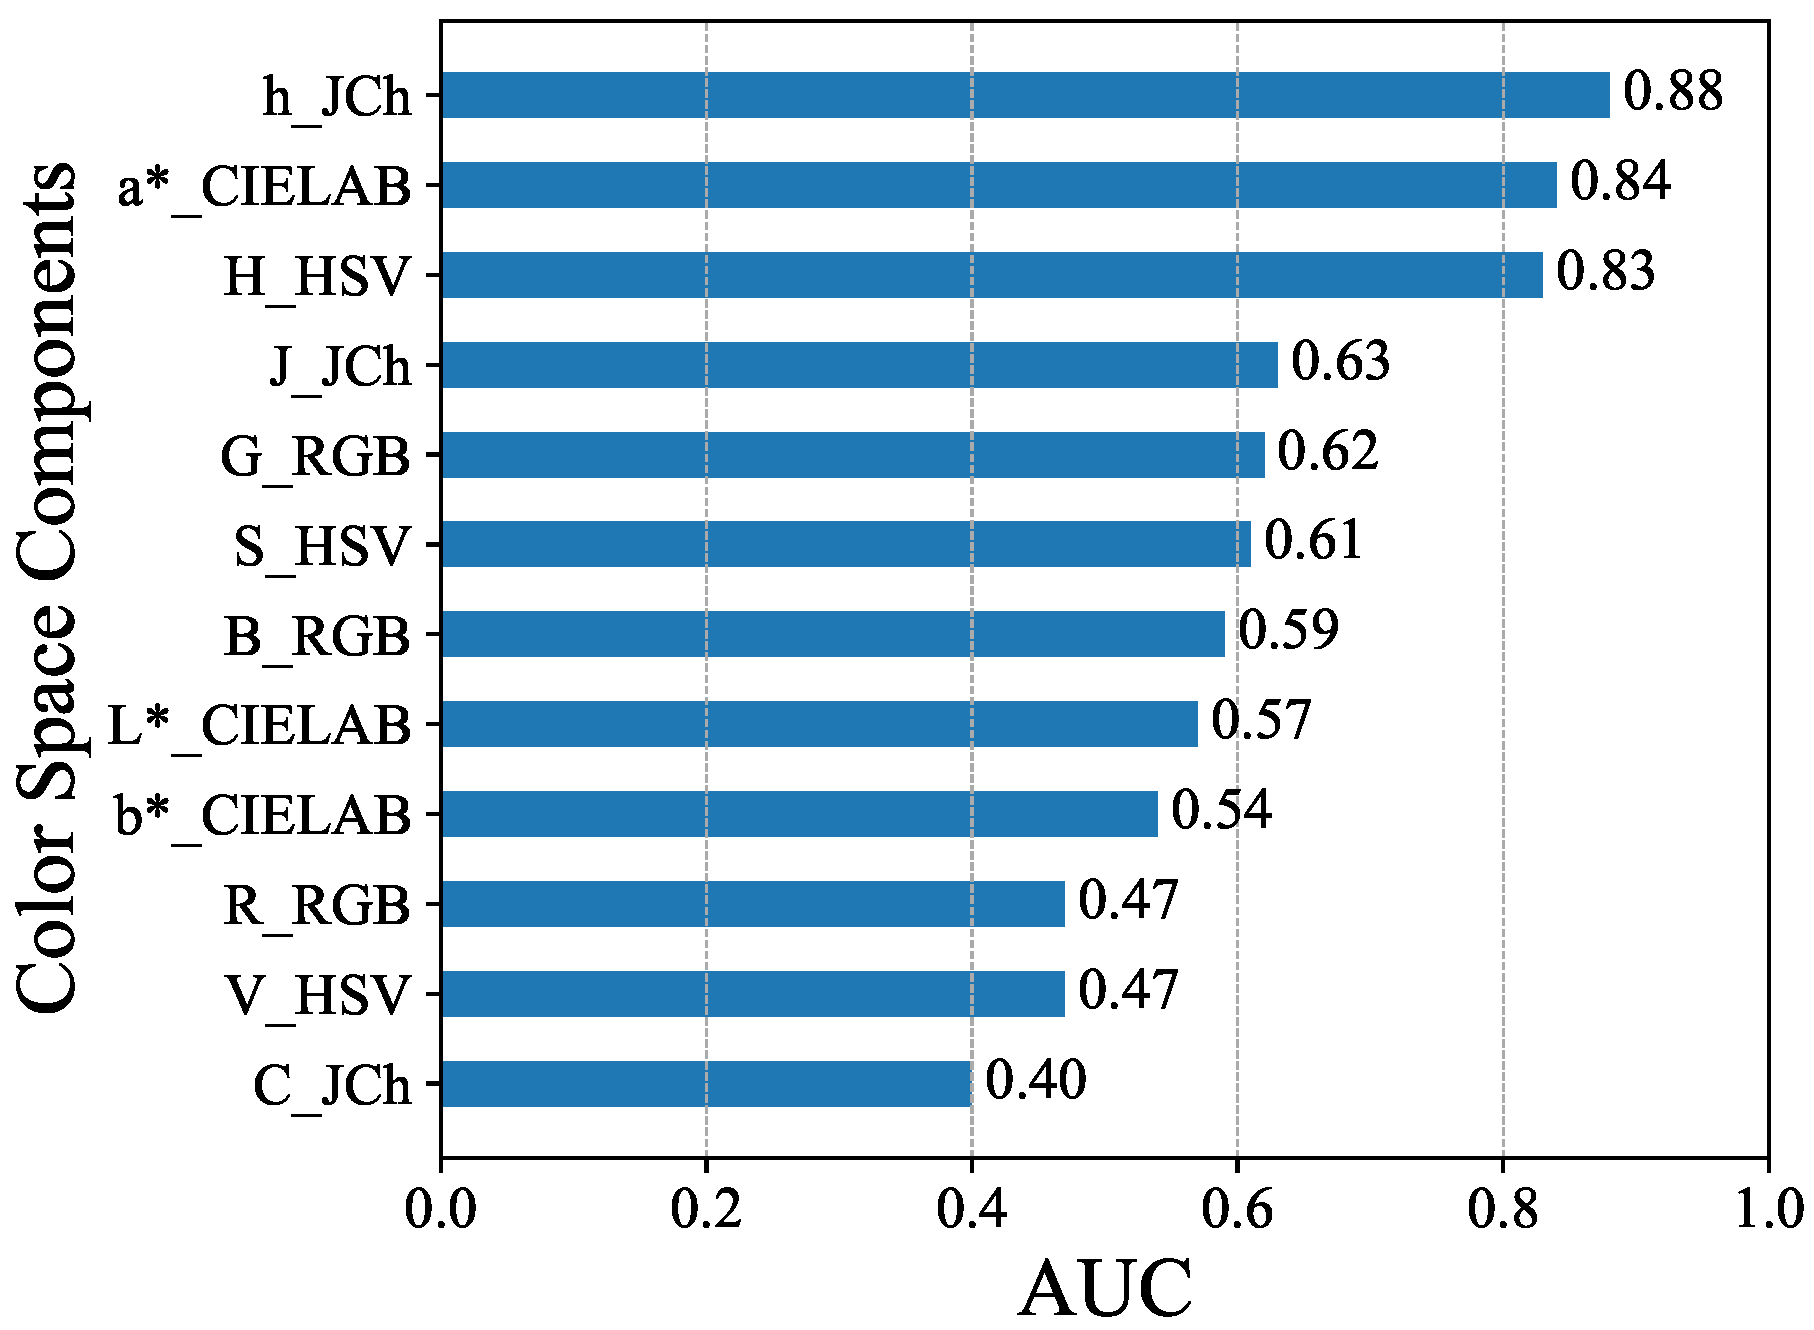
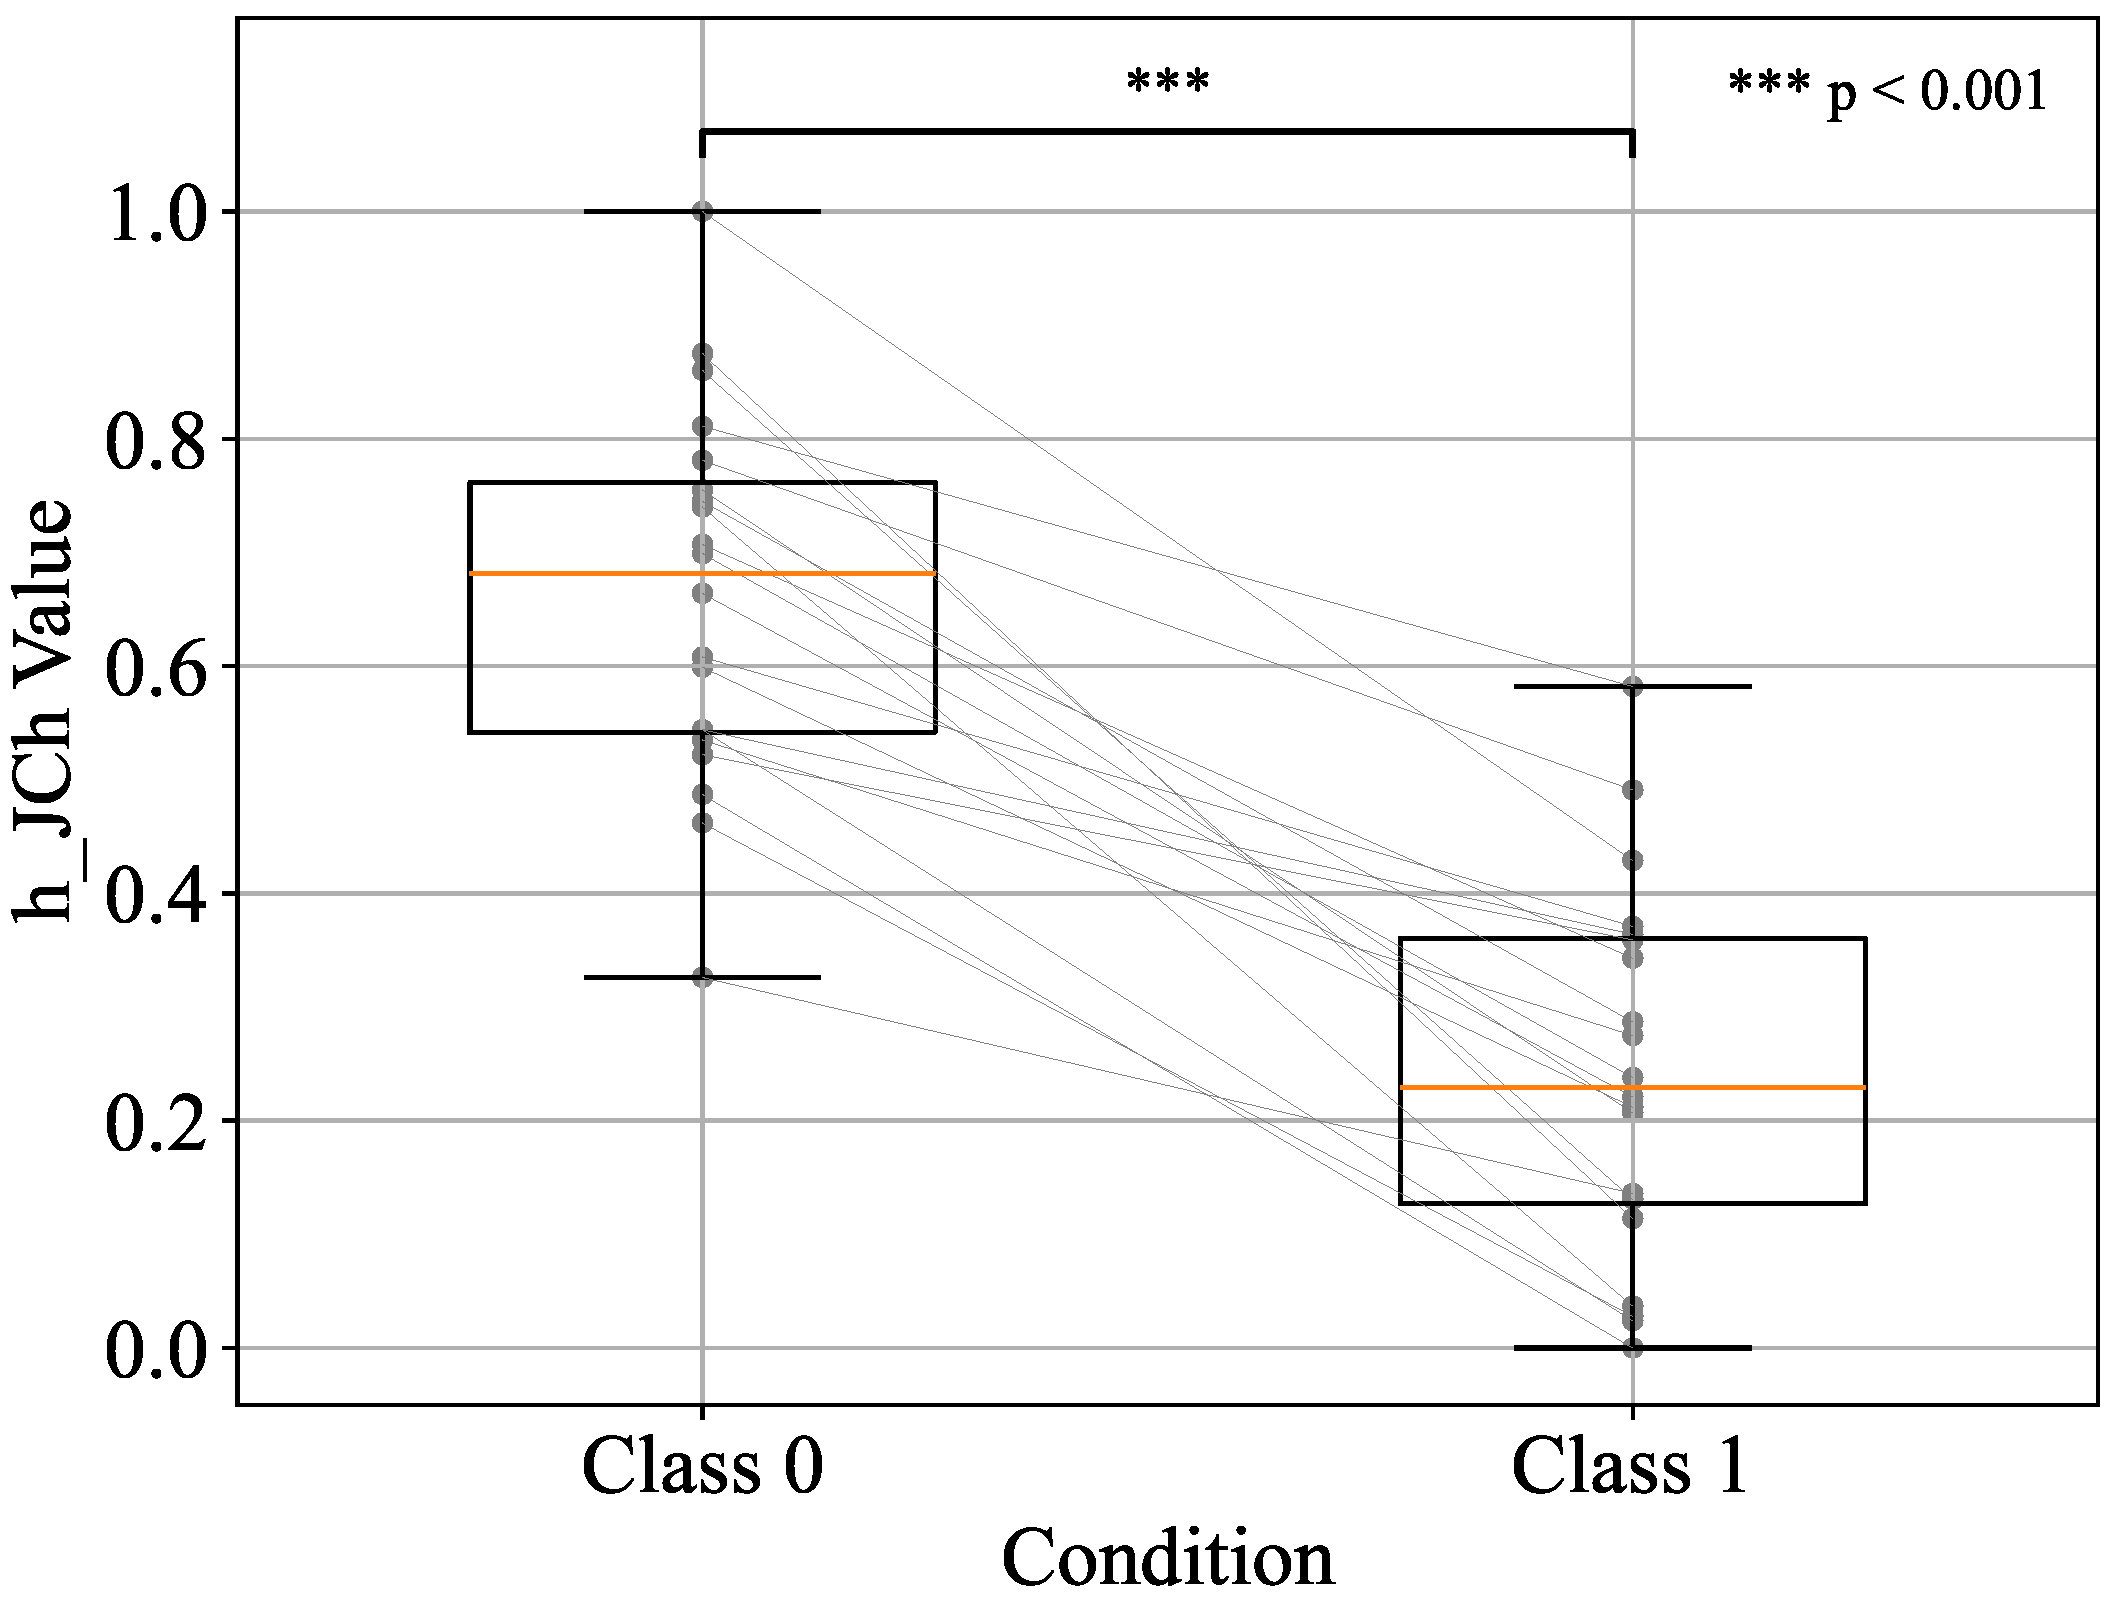
4. Results
5. Discussion
6. Conclusions
Author Contributions
Funding
Institutional Review Board Statement
Informed Consent Statement
Data Availability Statement
Conflicts of Interest
Abbreviations
| ROI | Region of Interest |
| TPR | True Positive Rate |
| FPR | False Positive Rate |
| ROC | Receiver Operating Characteristic |
| AUC | Area Under the Curve |
| IEC | International Electrotechnical Commission |
| RGB | Red, Green, Blue |
| sRGB | Standard RGB color space |
| HSV | Hue, Saturation, Value |
| CIE | International Commission on Illumination |
| CIECAM02 | CIE Color Appearance Model 2002 |
| CRT | Capillary Refill Time |
| WHO | World Health Organization |
| AHA | American Heart Association |
| PPG | Photoplethysmography |
| IPPG | Imaging Photoplethysmography |
| NIRS | Near-infrared Spectroscopy |
| ScvO2 | Central Venous Oxygen Saturation |
| ACM | Asymmetric Colour matching |
| GA | Genetic Algorithm |
| RF | Random Forest |
| VIF | Variance Inflation Factor |
| PCA | Principal Component Analysis |
References
- Regier, T.; Kay, P.; Khetarpal, N. Color naming reflects optimal partitions of color space. Proc. Natl. Acad. Sci. USA 2007, 104, 1436–1441. [Google Scholar] [CrossRef] [PubMed]
- Popovic, E.; Zeger, I.; Grgic, M.; Grgic, S. Evaluation of Color Saturation and Hue Effects on Image Quality. In Proceedings of the 2023 International Symposium ELMAR, Zadar, Croatia, 11–13 September 2023; IEEE: Piscataway, NJ, USA, 2023; pp. 7–12. [Google Scholar]
- Lima, A.; Bakker, J. Clinical assessment of peripheral circulation. Curr. Opin. Crit. Care 2015, 21, 226–231. [Google Scholar] [CrossRef] [PubMed]
- Xia, Y.; Guo, Z.; Wang, X.; Wang, Z.; Wang, X.; Wang, Z. Research Progress on the Measurement Methods and Clinical Significance of Capillary Refill Time. Sensors 2024, 24, 7941. [Google Scholar] [CrossRef] [PubMed]
- Li, B.; Dai, Y.; Cai, W.; Sun, M.; Sun, J. Monitoring of perioperative tissue perfusion and impact on patient outcomes. J. Cardiothorac. Surg. 2025, 20, 100. [Google Scholar] [CrossRef] [PubMed]
- Rozhkova, G.; Belokopytov, A.; Gracheva, M.; Ershov, E.; Nikolaev, P. A simple method for comparing peripheral and central color vision by means of two smartphones. Behav. Res. Methods 2023, 55, 38–57. [Google Scholar] [CrossRef] [PubMed]
- Zhang, C.; Tian, J.; Li, D.; Hou, X.; Wang, L. Comparative study on the effect of color spaces and color formats on heart rate measurement using the imaging photoplethysmography (IPPG) method. Technol. Health Care 2022, 30, 391–402. [Google Scholar] [CrossRef] [PubMed]
- Kaur, A.; Kranthi, B. Comparison between YCbCr color space and CIELab color space for skin color segmentation. Int. J. Appl. Inf. Syst. 2012, 3, 30–33. [Google Scholar]
- Maktabdar Oghaz, M.; Maarof, M.A.; Zainal, A.; Rohani, M.F.; Yaghoubyan, S.H. A hybrid color space for skin detection using genetic algorithm heuristic search and principal component analysis technique. PLoS ONE 2015, 10, e0134828. [Google Scholar] [CrossRef] [PubMed]
- Abbas, Q.; Celebi, M.E.; Serrano, C.; Garcia, I.F.; Ma, G. Pattern classification of dermoscopy images: A perceptually uniform model. Pattern Recognit. 2013, 46, 86–97. [Google Scholar] [CrossRef]
- Akimbekov, N.S.; Digel, I.; Beeser, J.; Tepecik, A.; Sakhanova, S.K.; Altynbay, N.P.; Sherelkhan, D.K.; Kamenov, B.K.; Nussipov, D.A.; Arystanbekuly, B. An Overview of Quantitative Capillary Refill Time: Measurement and Application in Clinical Practice. Eng. Sci. 2025, 34, 1437. [Google Scholar] [CrossRef]
- Verkruysse, W.; Svaasand, L.O.; Nelson, J.S. Remote plethysmographic imaging using ambient light. Opt. Express 2008, 16, 21434–21445. [Google Scholar] [CrossRef] [PubMed]
- Baxes, G.A. Digital Image Processing: Principles and Applications; John Wiley & Sons, Inc.: New York, NY, USA, 1994. [Google Scholar]
- Süsstrunk, S.; Buckley, R.; Swen, S. Standard RGB color spaces. In Proceedings of the Color and Imaging Conference. Society of Imaging Science and Technology, Scottsdale, AZ, USA, 16–19 November 1999; Volume 7, pp. 127–134. [Google Scholar]
- Standard IEC 61966-2-1:1999; Multimedia Systems and Equipment—Colour Measurement and Management—Part 2-1: Colour Management—Default RGB Colour Space—sRGB. International Electrotechnical Commission: Geneva, Switzerland, 1999.
- Fairchild, M.D. Color Appearance Models; John Wiley & Sons: Chichester, UK, 2013. [Google Scholar]
- Loesdau, M.; Chabrier, S.; Gabillon, A. Hue and saturation in the RGB color space. In Proceedings of the International Conference on Image and Signal Processing, Cherbourg, France, 30 June–2 July 2014; Springer: Cham, Switzerland, 2014; pp. 203–212. [Google Scholar]
- Sural, S.; Qian, G.; Pramanik, S. Segmentation and histogram generation using the HSV color space for image retrieval. In Proceedings of the International Conference on Image Processing, Rochester, NY, USA, 22–25 September 2002; IEEE: Piscataway, NJ, USA, 2002; Volume 2, pp. II–II. [Google Scholar] [CrossRef]
- Olson, M.R.; Graham, E.; Hamad, S.; Uchupalanun, P.; Ramanathan, N.; Schauer, J.J. Quantification of elemental and organic carbon in atmospheric particulate matter using color space sensing—Hue, saturation, and value (HSV) coordinates. Sci. Total Environ. 2016, 548, 252–259. [Google Scholar] [CrossRef] [PubMed]
- Nikolskaia, K.; Ezhova, N.; Sinkov, A.; Medvedev, M. Skin detection technique based on HSV color model and SLIC segmentation method. In Proceedings of the 4th Ural Workshop on Parallel, Distributed, and Cloud Computing for Young Scientists, Ural-PDC 2018, Yekaterinburg, Russia, 15 November 2018; CEUR Workshop Proceedings; Volume 2281, pp. 123–135. [Google Scholar]
- Kuriki, I. Lightness dependence of achromatic loci in color-appearance coordinates. Front. Psychol. 2015, 6, 67. [Google Scholar] [CrossRef] [PubMed]
- Luo, M.R.; Cui, G.; Rigg, B. The development of the CIE 2000 colour-difference formula: CIEDE2000. Color Res. Appl. 2001, 26, 340–350. [Google Scholar] [CrossRef]
- Howse, J.; Minichino, J. Learning OpenCV 4 Computer Vision with Python 3: Get to Grips with Tools, Techniques, and Algorithms for Computer Vision and Machine Learning; Packt Publishing Ltd.: Birmingham, UK, 2020. [Google Scholar]
- Alessi, P.; Dispoto, G.; Fairchild, M.; Feng, X.F.; Hunt, R.; Komatsubara, H.; Li, C.; Luo, M.; Mahy, M.; Moroney, N.; et al. A Colour Appearance Model for Colour Management Systems: CIECAM02; Technical Report 159; International Commission on Illumination (CIE): Vienna, Austria, 2004. [Google Scholar]
- Moroney, N.; Fairchild, M.; Hunt, R.; Li, C. The CIECAM02 color appearance model. In Proceedings of the Color and Imaging Conference. Society for Imaging Science and Technology, Scottsdale, AZ, USA, 13–17 November 2002; Volume 2002, pp. 23–27. [Google Scholar]
- Luo, M.R.; Li, C. CIECAM02 and its recent developments. In Advanced Color Image Processing and Analysis; Springer: New York, NY, USA, 2012; pp. 19–58. [Google Scholar]
- Luo, M.R.; Cui, G.; Li, C. Uniform colour spaces based on CIECAM02 colour appearance model. Color Res. Appl. 2006, 31, 320–330. [Google Scholar] [CrossRef]
- Hellwig, L.; Fairchild, M.D. Brightness, lightness, colorfulness, and chroma in CIECAM02 and CAM16. Color Res. Appl. 2022, 47, 1083–1095. [Google Scholar] [CrossRef]
- Kim, Y.J.; Park, S. CIECAM02-UCS based evaluation of colorimetric characterization modeling for a liquid crystal display using a digital still camera. Opt. Rev. 2010, 17, 152–158. [Google Scholar] [CrossRef]
- Schanda, J. Colorimetry: Understanding the CIE System; John Wiley & Sons: Hoboken, NJ, USA, 2007. [Google Scholar]
- Cohen, J. Statistical Power Analysis for the Behavioral Sciences, 2nd ed.; Lawrence Erlbaum Associates: Hillsdale, NJ, USA, 1988. [Google Scholar]
- Hayakawa, T.; Watanabe, M.; Tomiyama, C.; Sasagawa, A.; Honma, T.; Inada, A.; Abo, T. Effects of Mild Hyperthermia Treatment Using Nano-Mist Sauna on Blood Gas Parameters and Skin Appearance. Health 2018, 10, 577. [Google Scholar] [CrossRef]
- Sharp, C.A.; McLaws, M.L. A discourse on pressure ulcer physiology: The implications of repositioning and staging. World Wide Wounds 2005, 2005. [Google Scholar]
- ISO/CIE 11664-4:2019; Colorimetry—Part 4: CIE 1976 L*a*b* Colour Space. International Organization for Standardization (ISO): Geneva, Switzerland; International Commission on Illumination (CIE): Vienna, Austria, 2019.
- Guyon, I.; Elisseeff, A. An introduction to variable and feature selection. J. Mach. Learn. Res. 2003, 3, 1157–1182. [Google Scholar]


| Abbreviation | Variable | Abbreviation | Variable | Abbreviation | Variable |
|---|---|---|---|---|---|
| R | R_RGB | G | G_RGB(G) | B | B_RGB(B) |
| H | H_HSV | S | S_HSV | V | V_HSV |
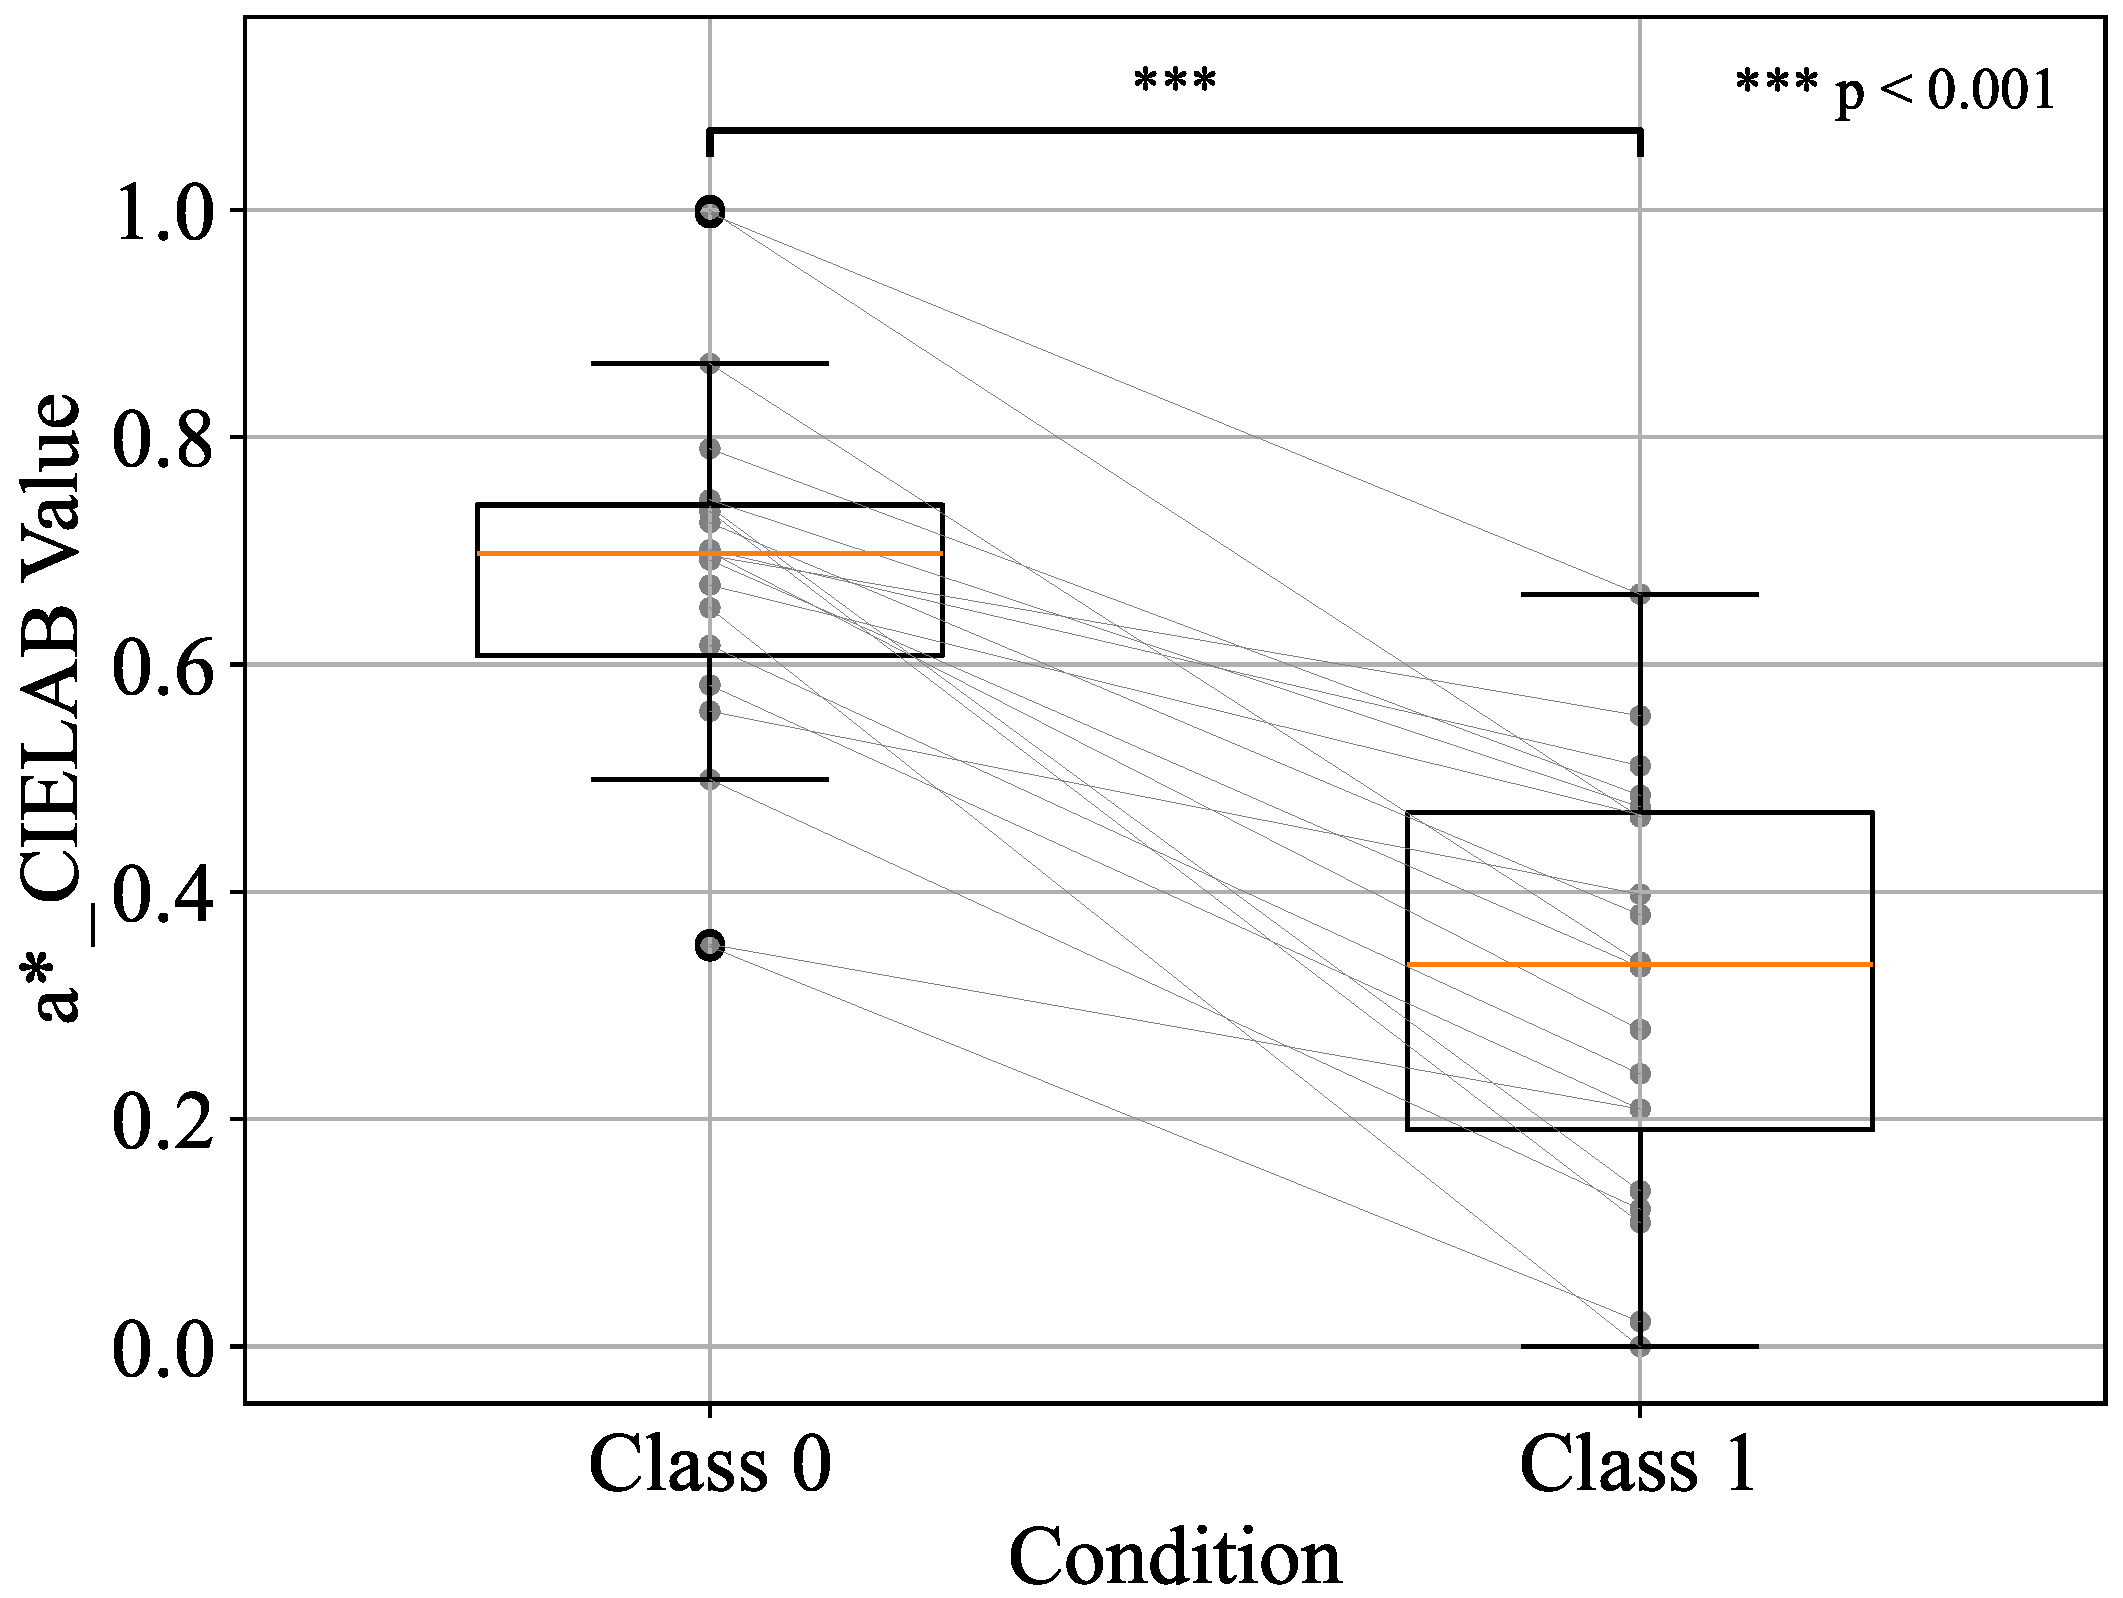
| L* | L*_CIELAB | a* | a*_CIELAB | b* | b*_CIELAB |
| J | J_JCh | C | C_JCh | h | h_JCh |
| Model | AUC | Precision | Recall | F1 Score |
|---|---|---|---|---|
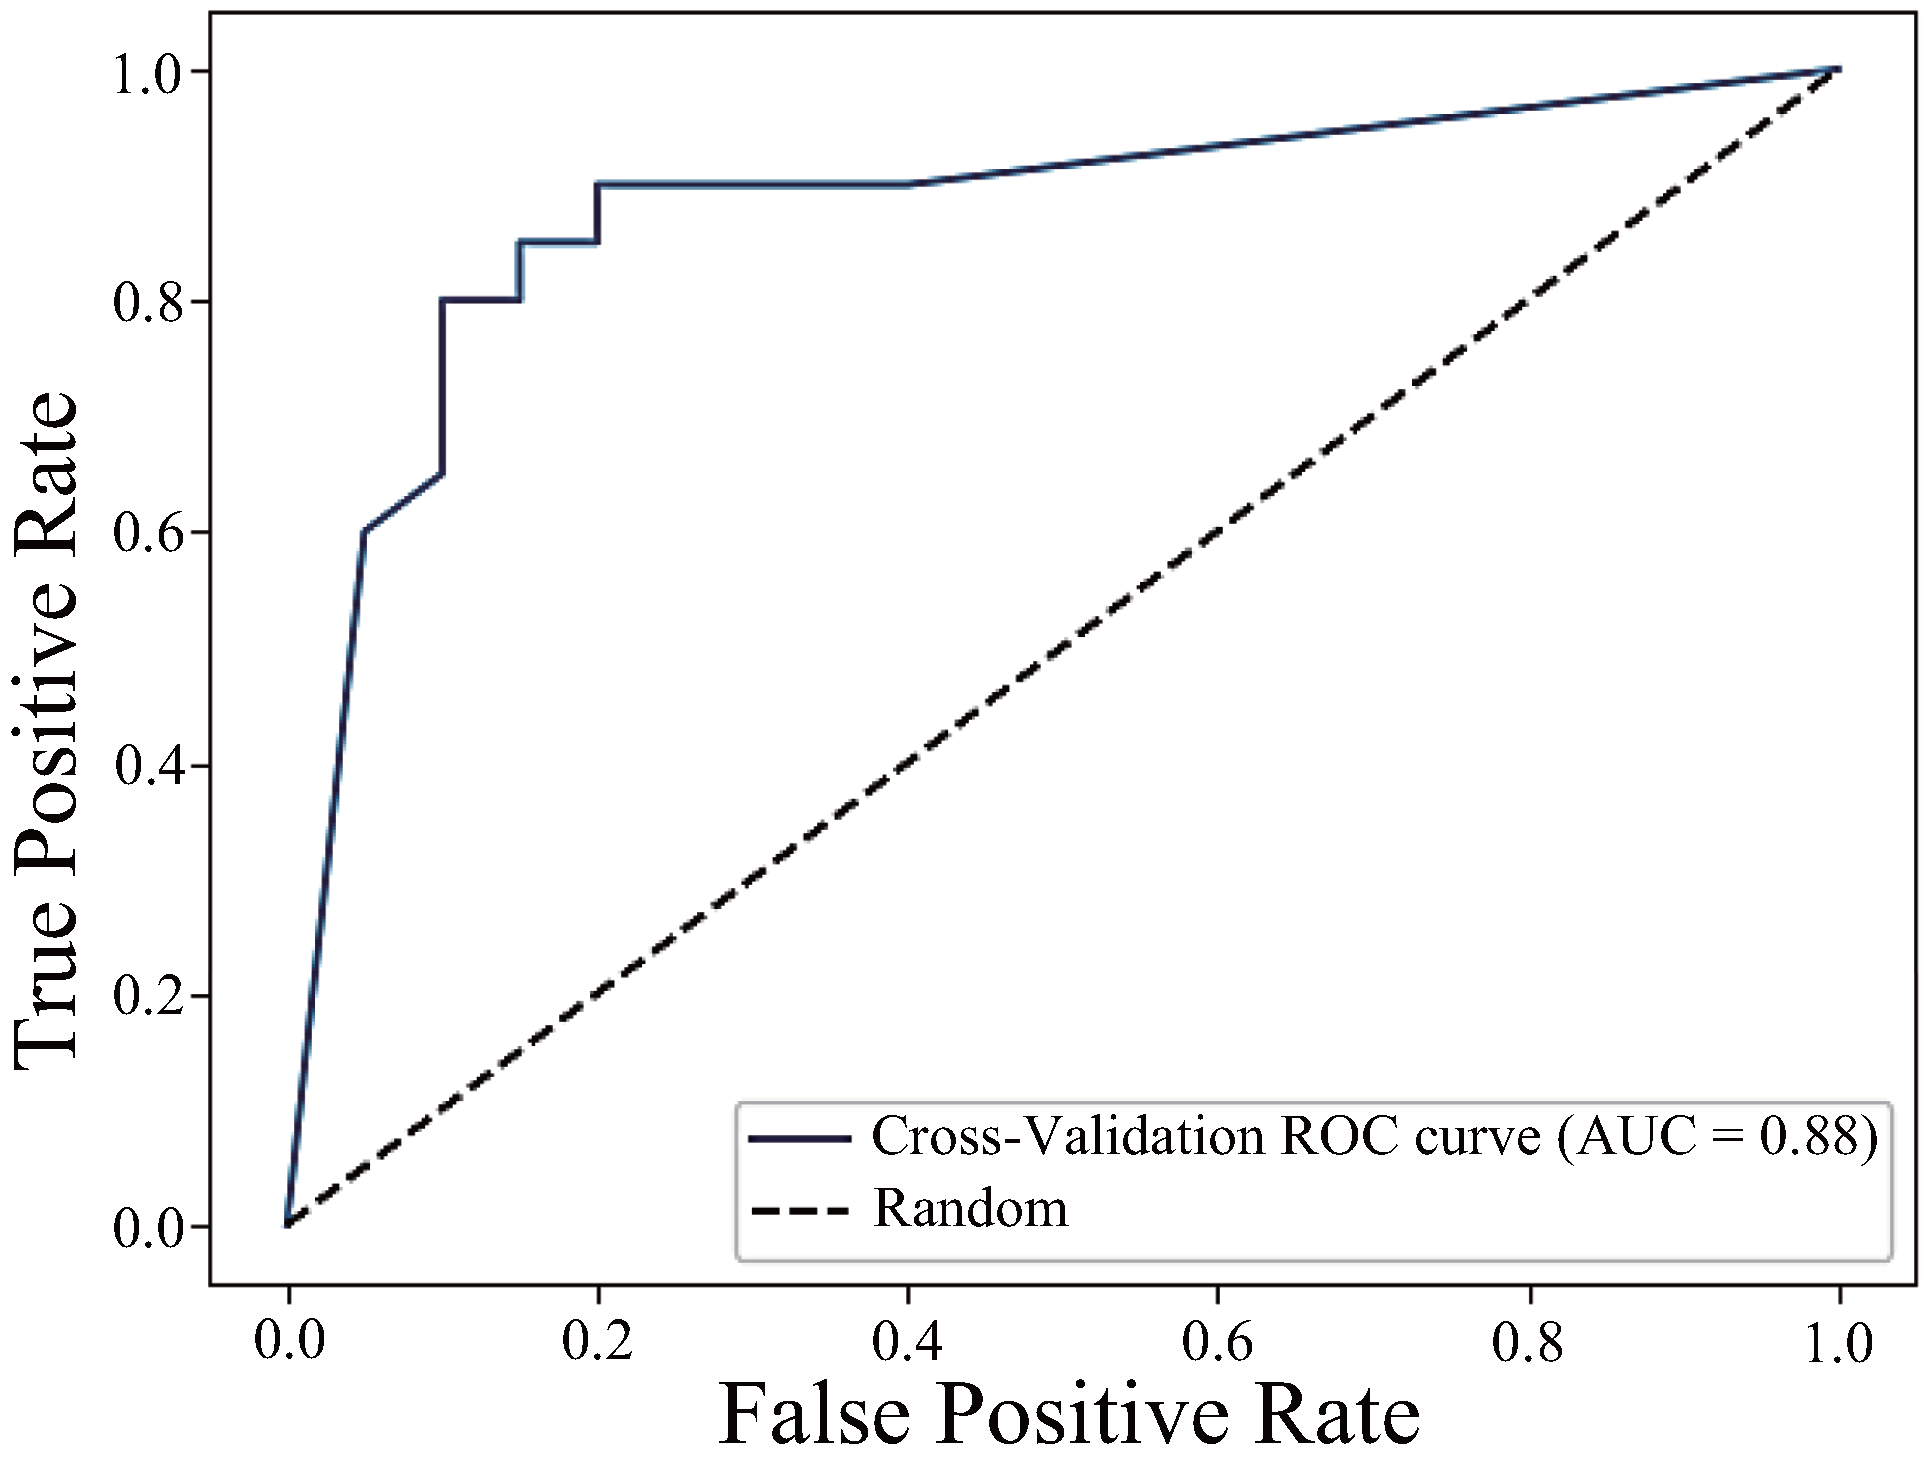
| h_JCh | 0.88 | 0.85 | 0.85 | 0.85 |
| h_JCh + a*_CIELAB | 0.91 | 0.83 | 0.83 | 0.83 |
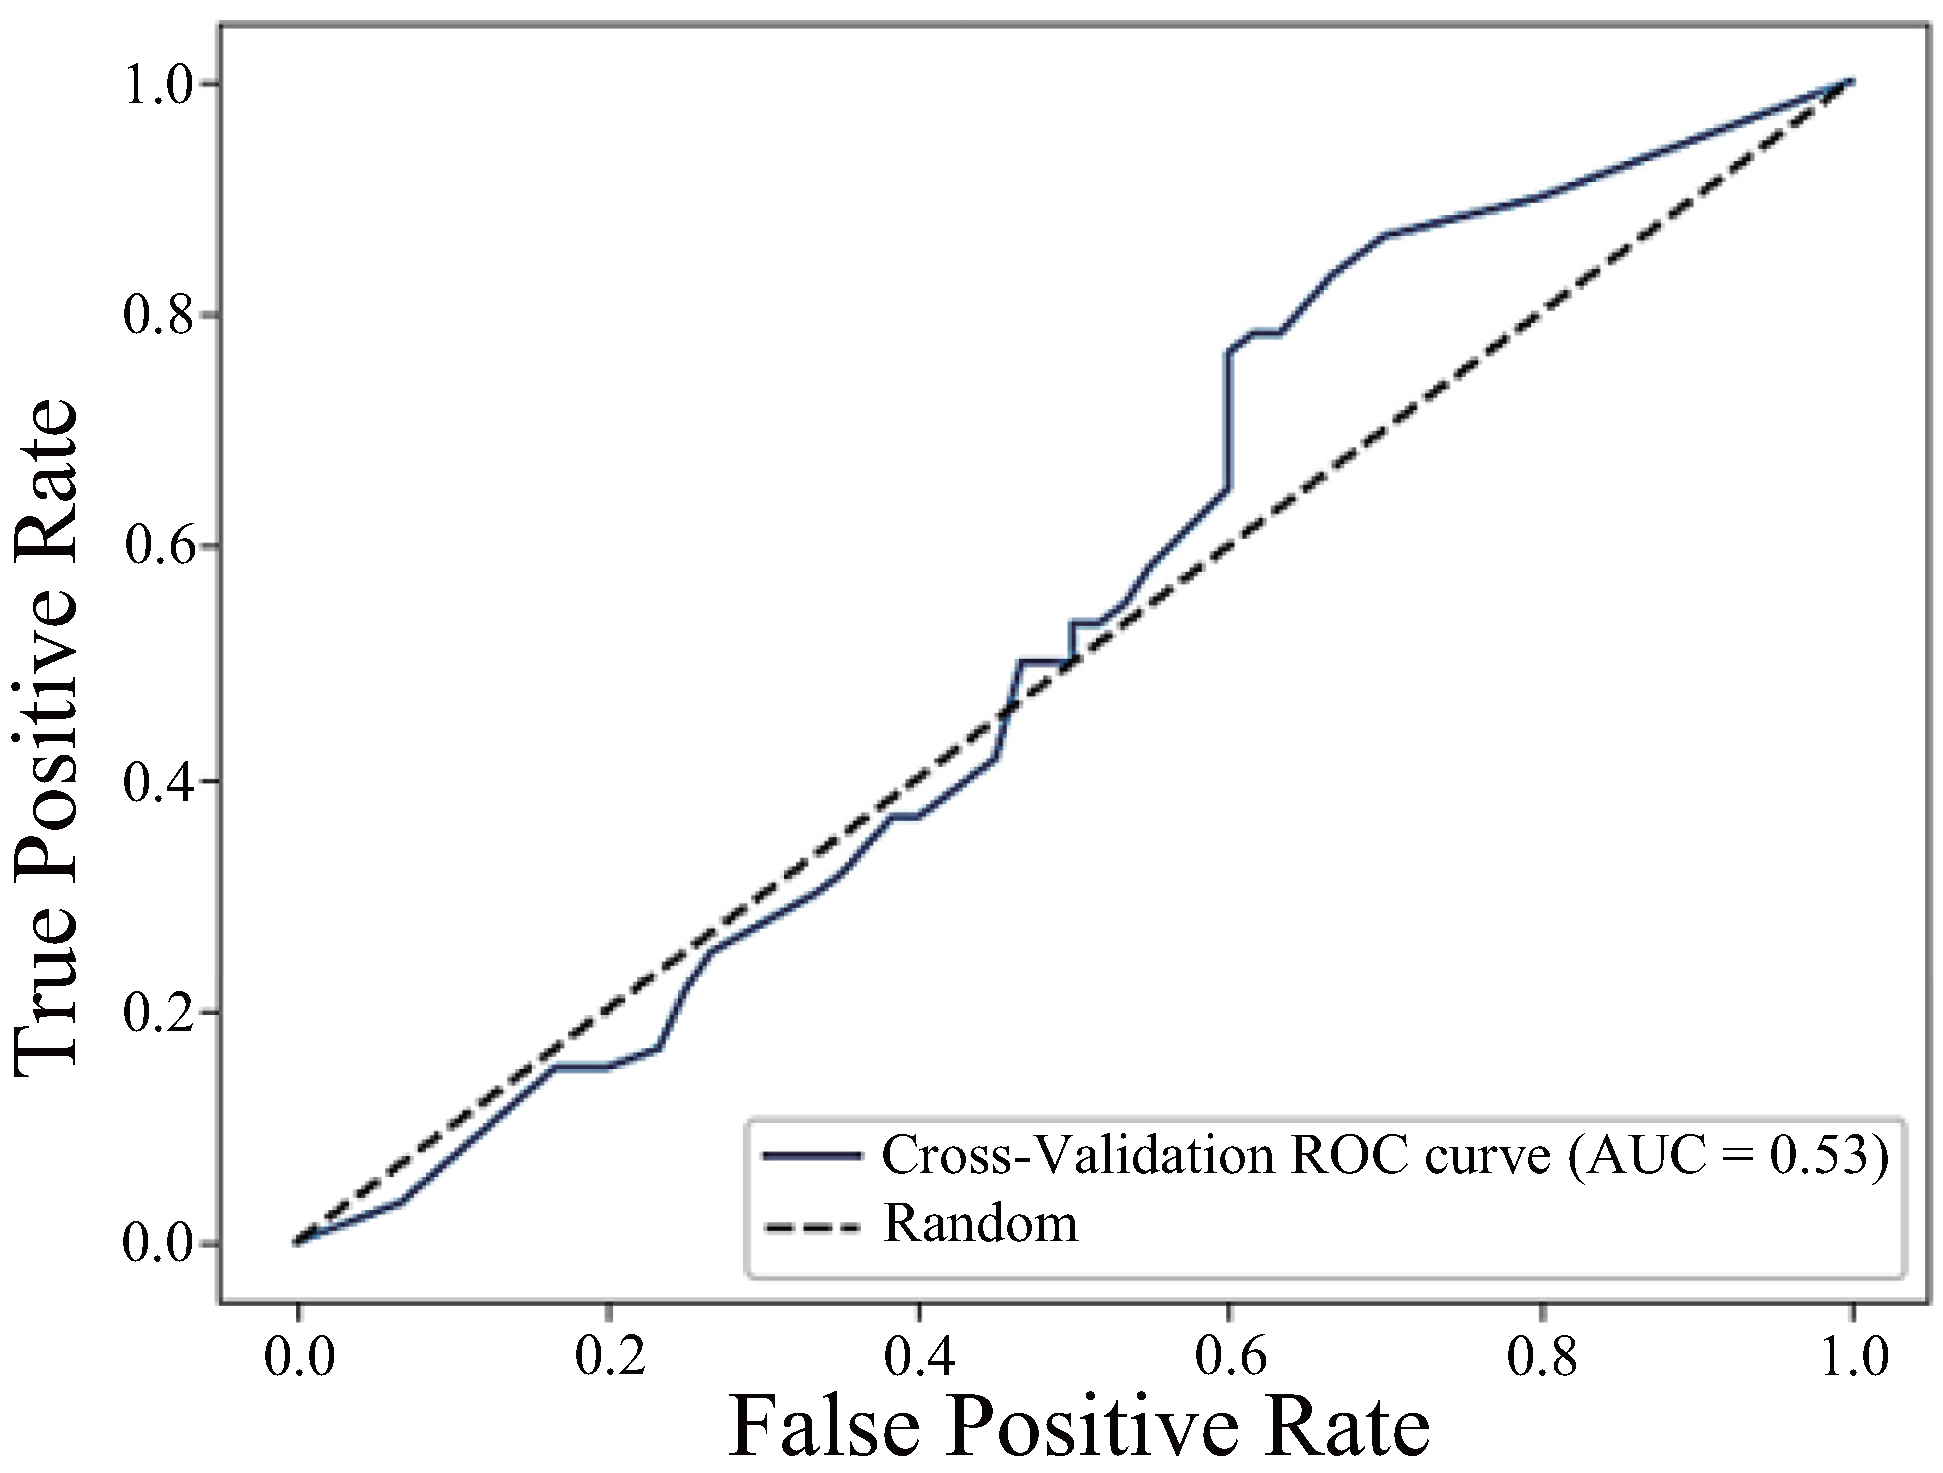
| h_JCh + a*_CIELAB + H_HSV | 0.53 | 0.52 | 0.50 | 0.51 |
| H_HSV | a*_CIELAB | h_JCh | |
|---|---|---|---|
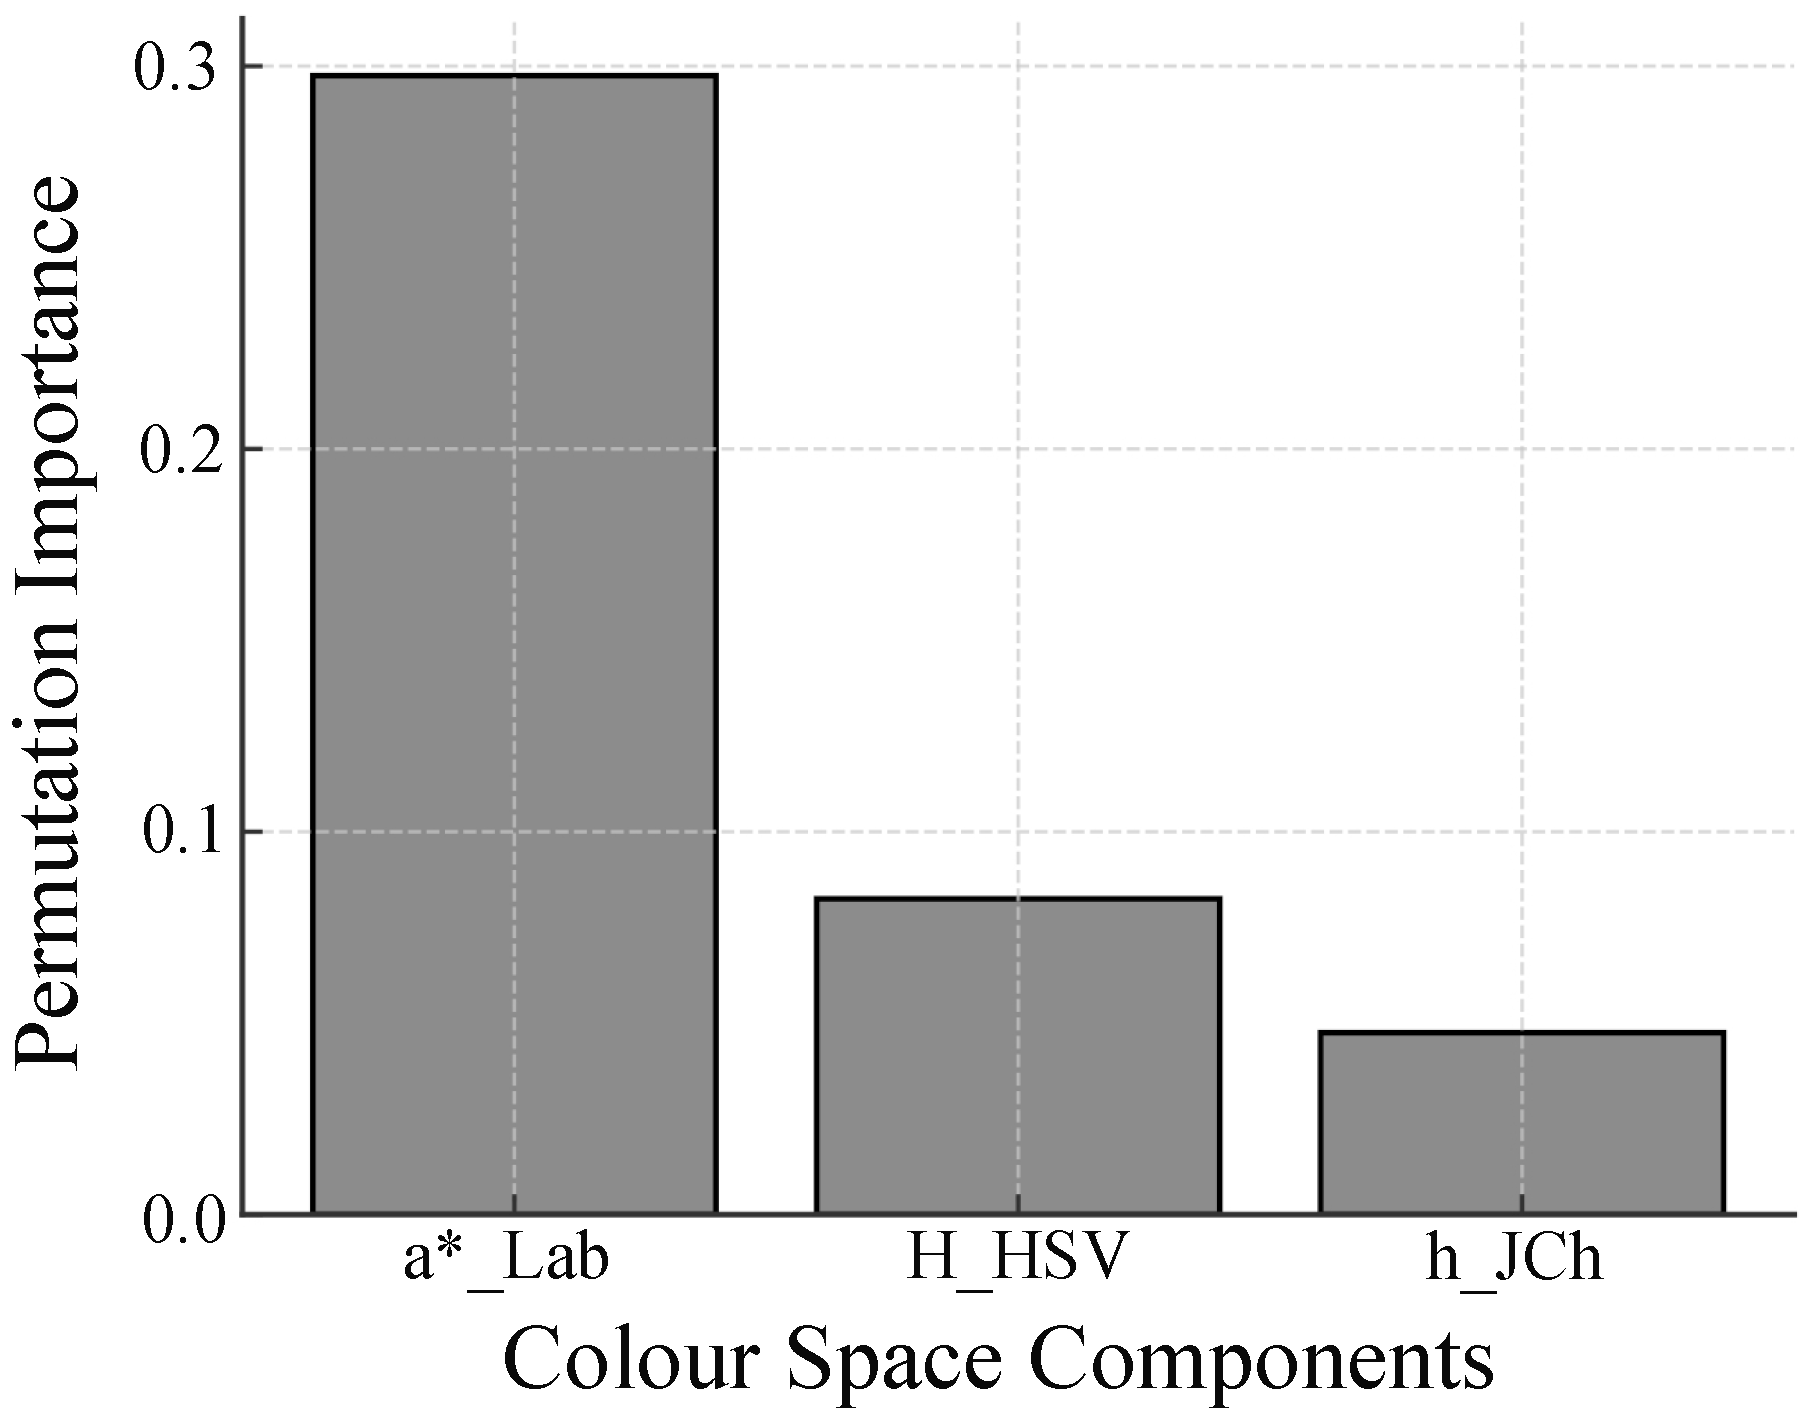
| H_HSV | 1.00 | −0.78 | −0.98 |
| a*_CIELAB | −0.78 | 1.00 | 0.78 |
| h_JCh | −0.98 | 0.78 | 1.00 |
| Method | Invasiveness | Temporal Characteristics | Reported Classification Performance |
|---|---|---|---|
| Semi-automatic CRT [4] | Contact (manual pressure application and release) | Limited to discrete post-compression response; typically observer-triggered | Not reported |
| Imaging PPG (iPPG) [7] | Non-contact (camera-based photoplethysmography) | Suitable for continuous monitoring of periodic signals; less responsive to transient events | Not reported |
| Proposed method (h_JCh + a*_CIELAB) | Non-contact (RGB image-based) | Capable of capturing frame-by-frame colour changes immediately after pressure release | AUC = 0.91 |
Disclaimer/Publisher’s Note: The statements, opinions and data contained in all publications are solely those of the individual author(s) and contributor(s) and not of MDPI and/or the editor(s). MDPI and/or the editor(s) disclaim responsibility for any injury to people or property resulting from any ideas, methods, instructions or products referred to in the content. |
© 2025 by the authors. Licensee MDPI, Basel, Switzerland. This article is an open access article distributed under the terms and conditions of the Creative Commons Attribution (CC BY) license (https://creativecommons.org/licenses/by/4.0/).
Share and Cite
Tsurumoto, M.; Shimazaki, T.; Hyry, J.; Kawakubo, Y.; Yokoyama, T.; Anzai, D. Preliminary Quantitative Evaluation of the Optimal Colour System for the Assessment of Peripheral Circulation from Applied Pressure Using Machine Learning. Sensors 2025, 25, 4441. https://doi.org/10.3390/s25144441
Tsurumoto M, Shimazaki T, Hyry J, Kawakubo Y, Yokoyama T, Anzai D. Preliminary Quantitative Evaluation of the Optimal Colour System for the Assessment of Peripheral Circulation from Applied Pressure Using Machine Learning. Sensors. 2025; 25(14):4441. https://doi.org/10.3390/s25144441
Chicago/Turabian StyleTsurumoto, Masanobu, Takunori Shimazaki, Jaakko Hyry, Yoshifumi Kawakubo, Takeshi Yokoyama, and Daisuke Anzai. 2025. "Preliminary Quantitative Evaluation of the Optimal Colour System for the Assessment of Peripheral Circulation from Applied Pressure Using Machine Learning" Sensors 25, no. 14: 4441. https://doi.org/10.3390/s25144441
APA StyleTsurumoto, M., Shimazaki, T., Hyry, J., Kawakubo, Y., Yokoyama, T., & Anzai, D. (2025). Preliminary Quantitative Evaluation of the Optimal Colour System for the Assessment of Peripheral Circulation from Applied Pressure Using Machine Learning. Sensors, 25(14), 4441. https://doi.org/10.3390/s25144441