
Increasing the Sensitivity of Aspergillus Galactomannan ELISA Using Silver Nanoparticle-Based Surface-Enhanced Raman Spectroscopy
 , , , and
Abstract

1. Introduction
2. Materials and Methods
2.1. Reagents
2.2. Preparing a Culture Medium Containing Galactomannan
2.3. Procedure for Coupling of Antibodies to HRP by Maleimide Method
2.4. Spiked Samples Preparation
2.5. Colorimetric ELISA on mAbs Coated Plate
2.6. Method of AgNPs Synthesis
2.7. SERS-Based ELISA
2.8. Processing of Calibration Curves
3. Results and Discussion
4. Conclusions
Supplementary Materials
Author Contributions
Funding
Institutional Review Board Statement
Informed Consent Statement
Data Availability Statement
Acknowledgments
Conflicts of Interest
Abbreviations
| AgNPs | Silver nanoparticles |
| BALF | Bronchoalveolar lavage fluid |
| CV | Coefficient of variation |
| DAP | 2,3-Diaminophenazine |
| EDTA | Ethylenediaminetetraacetic acid |
| ELISA | Enzyme-linked immunosorbent assay |
| FBS | Fetal bovine serum |
| GM | Galactomannan |
| HRP | Horseradish peroxidase |
| IA | Invasive aspergillosis |
| IPA | Invasive pulmonary aspergillosis |
| LOD | Limit of detection |
| mAbs | Monoclonal antibodies |
| ODI | Optical density index |
| oPD | o-Phenylenediamine |
| SATP | N-succinimidyl S-acetylthiopropionate |
| SD | Standard deviation |
| SERS | Surface-enhanced Raman scattering |
| Sulfo-SMCC | Sulfosuccinimidyl 4-[N-maleimidomethyl] cyclohexane-1-carboxylate |
| TBST | 100 mM Tris-HCl, 150 mM NaCl, pH 8 containing 0.05% Tween-20 |
| TMB | 3,3′,5,5′-Tetramethylbenzidine |
Appendix A
Reagents Used for Buffers and Stop Solutions Preparations
Appendix B
Selection of Optimal Conditions for ELISA
- (1)
- 100 mM Tris-HCl, 150 mM NaCl, pH 8 containing 0.05% Tween-20 (TBST) and 1% BSA;
- (2)
- Fetal bovine serum (F9665, Sigma Aldrich);
- (3)
- GM-depleted plasma, prepared by the treatment of healthy donors’ plasma with an excess (1 mg/mL) of magnetic beads modified with mAb 7B8 for 4 h at 4 °C with stirring. Captured native GM was removed with magnetic beads by the external magnetic field;
- (4)
- GM-depleted supernatant of boiled plasma. The plasma of healthy donors was pre-treated with 0.1 M EDTA and boiled for 3 min to dissociate complexes of polysaccharide with serum components and denature proteins. The mixture was centrifuged 20 min at 14,000× g, and the pellet was discarded. The supernatant was treated with magnetic beads carrying mAb 7B8 as described before in order to deplete the native GM.
References
- Kohno, S. High Mortality in Invasive Aspergillosis: What We Need to Know for Determination of Poor Prognosis and Next Countermeasures. Clin. Infect. Dis. 2008, 47, 1185–1187. [Google Scholar] [CrossRef] [PubMed]
- Matthaiou, D.K.; Dimopoulos, G.; Taccone, F.S.; Bulpa, P.; Van Den Abeele, A.M.; Misset, B.; Meersseman, W.; Spapen, H.; Cardoso, T.; Charles, P.E.; et al. Elderly versus Nonelderly Patients with Invasive Aspergillosis in the ICU: A Comparison and Risk Factor Analysis for Mortality from the AspICU Cohort. Med. Mycol. 2018, 56, 668–678. [Google Scholar] [CrossRef] [PubMed]
- Singh, N.; Paterson, D.L. Aspergillus Infections in Transplant Recipients. Clin. Microbiol. Rev. 2005, 18, 44–69. [Google Scholar] [CrossRef]
- Latgé, J.P. Aspergillus fumigatus and Aspergillosis. Clin. Microbiol. Rev. 1999, 12, 310–350. [Google Scholar] [CrossRef]
- Groll, A.H.; Shah, P.M.; Mentzel, C.; Schneider, M.; Just-Nuebling, G.; Huebner, K. Trends in the Postmortem Epidemiology of Invasive Fungal Infections at a University Hospital. J. Infect. 1996, 33, 23–32. [Google Scholar] [CrossRef] [PubMed]
- Dichtl, K.; Seybold, U.; Ormanns, S.; Horns, H.; Wagener, J. Evaluation of a Novel Aspergillus Antigen Enzyme-Linked Immunosorbent Assay. J. Clin. Microbiol. 2019, 57, e00136-19. [Google Scholar] [CrossRef]
- Marr, K.A.; Platt, A.; Tornheim, J.A.; Zhang, S.X.; Datta, K.; Cardozo, C.; Garcia-Vidal, C. Aspergillosis Complicating Severe Coronavirus Disease. Emerg. Infect. Dis. 2021, 27, 18–25. [Google Scholar] [CrossRef]
- Arastehfar, A.; Carvalho, A.; Van De Veerdonk, F.L.; Jenks, J.D.; Koehler, P.; Krause, R.; Cornely, O.A.; Perlin, D.S.; Lass-Flörl, C.; Hoenigl, M. COVID-19 Associated Pulmonary Aspergillosis (CAPA)—From Immunology to Treatment. J. Fungi 2020, 6, 91. [Google Scholar] [CrossRef]
- Ullmann, A.J.; Aguado, J.M.; Arikan-Akdagli, S.; Denning, D.W.; Groll, A.H.; Lagrou, K.; Lass-Flörl, C.; Lewis, R.E.; Munoz, P.; Verweij, P.E.; et al. Diagnosis and Management of Aspergillus Diseases: Executive Summary of the 2017 ESCMID-ECMM-ERS Guideline. Clin. Microbiol. Infect. 2018, 24, e1–e38. [Google Scholar] [CrossRef]
- Latgé, J.P.; Kobayashi, H.; Debeaupuis, J.P.; Diaquin, M.; Sarfati, J.; Wieruszeski, J.M.; Parra, E.; Bouchara, J.P.; Fournet, B. Chemical and Immunological Characterization of the Extracellular Galactomannan of Aspergillus fumigatus. Infect. Immun. 1994, 62, 5424–5433. [Google Scholar] [CrossRef]
- Loeffler, J.; Hafner, J.; Mengoli, C.; Wirth, C.; Heussel, C.P.; Löffler, C.; White, P.L.; Ullmann, A.J.; Michel, D.; Wiegering, V.; et al. Prospective Biomarker Screening for Diagnosis of Invasive Aspergillosis in High-Risk Pediatric Patients. J. Clin. Microbiol. 2017, 55, 101–109. [Google Scholar] [CrossRef] [PubMed]
- Pfeiffer, C.D.; Fine, J.P.; Safdar, N. Diagnosis of Invasive Aspergillosis Using a Galactomannan Assay: A Meta-Analysis. Clin. Infect. Dis. 2006, 42, 1417–1727. [Google Scholar] [CrossRef] [PubMed]
- Stynen, D.; Goris, A.; Sarfati, J.; Latgé, J.P. A New Sensitive Sandwich Enzyme-Linked Immunosorbent Assay to Detect Galactofuran in Patients with Invasive Aspergillosis. J. Clin. Microbiol. 1995, 33, 497–500. [Google Scholar] [CrossRef]
- Leeflang, M.M.; Debets-Ossenkopp, Y.J.; Visser, C.E.; Scholten, R.J.; Hooft, L.; Bijlmer, H.A.; Reitsma, J.B.; Bossuyt, P.M.; Vandenbroucke-Grauls, C.M. Galactomannan Detection for Invasive Aspergillosis in Immunocompromized Patients. In Cochrane Database of Systematic Reviews; The Cochrane Collaboration, Ed.; John Wiley & Sons, Ltd.: Chichester, UK, 2008; p. CD007394. [Google Scholar]
- Siemann, M.; Koch-Dörfler, M.; Gaude, M. False-positive Results in Premature Infants with the Platelia® Aspergillus Sandwich Enzyme-linked Immunosorbent Assay: Falsch-positive Ergebnisse Bei Frühgeborenen Mit Dem Platelia®- Aspergillus-Sandwich-ELISA. Mycoses 1998, 41, 373–377. [Google Scholar] [CrossRef] [PubMed]
- Bonini, A.; Capatti, C.; Parmeggiani, M.; Gugliotta, L.; Micozzi, A.; Gentile, G.; Capria, S.; Girmenia, C. Galactomannan Detection in Geotrichum Capitatum Invasive Infections: Report of 2 New Cases and Review of Diagnostic Options. Diagn. Microbiol. Infect. Dis. 2008, 62, 450–452. [Google Scholar] [CrossRef]
- Kappe, R.; Schulze-Berge, A. New Cause for False-Positive Results with the Pastorex Aspergillus Antigen Latex Agglutination Test. J. Clin. Microbiol. 1993, 31, 2489–2490. [Google Scholar] [CrossRef]
- Stynen, D.; Sarfati, J.; Goris, A.; Prévost, M.C.; Lesourd, M.; Kamphuis, H.; Darras, V.; Latgé, J.P. Rat Monoclonal Antibodies against Aspergillus Galactomannan. Infect. Immun. 1992, 60, 2237–2245. [Google Scholar] [CrossRef]
- Swanink, C.M.; Meis, J.F.; Rijs, A.J.; Donnelly, J.P.; Verweij, P.E. Specificity of a Sandwich Enzyme-Linked Immunosorbent Assay for Detecting Aspergillus Galactomannan. J. Clin. Microbiol. 1997, 35, 257–260. [Google Scholar] [CrossRef]
- Xavier, M.O.; Pasqualotto, A.C.; Cardoso, I.C.E.; Severo, L.C. Cross-Reactivity of Paracoccidioides Brasiliensis, Histoplasma Capsulatum, and Cryptococcus Species in the Commercial Platelia Aspergillus Enzyme Immunoassay. Clin. Vaccine Immunol. 2009, 16, 132–133. [Google Scholar] [CrossRef]
- Wheat, L.J.; Hackett, E.; Durkin, M.; Connolly, P.; Petraitiene, R.; Walsh, T.J.; Knox, K.; Hage, C. Histoplasmosis-Associated Cross-Reactivity in the BioRad Platelia Aspergillus Enzyme Immunoassay. Clin. Vaccine Immunol. 2007, 14, 638–640. [Google Scholar] [CrossRef]
- Mennink-Kersten, M.A.S.H.; Ruegebrink, D.; Klont, R.R.; Warris, A.; Gavini, F.; Op den Camp, H.J.M.; Verweij, P.E. Bifidobacterial Lipoglycan as a New Cause for False-Positive Platelia Aspergillus Enzyme-Linked Immunosorbent Assay Reactivity. J. Clin. Microbiol. 2005, 43, 3925–3931. [Google Scholar] [CrossRef] [PubMed]
- Mennink-Kersten, M.A.; Klont, R.R.; Warris, A.; Op Den Camp, H.J.; Verweij, P.E. Bifidobacterium Lipoteichoic Acid and False ELISA Reactivity in Aspergillus Antigen Detection. Lancet 2004, 363, 325–327. [Google Scholar] [CrossRef] [PubMed]
- Matveev, A.L.; Krylov, V.B.; Emelyanova, L.A.; Solovev, A.S.; Khlusevich, Y.A.; Baykov, I.K.; Fontaine, T.; Latgé, J.-P.; Tikunova, N.V.; Nifantiev, N.E. Novel Mouse Monoclonal Antibodies Specifically Recognize Aspergillus fumigatus Galactomannan. PLoS ONE 2018, 13, e0193938. [Google Scholar] [CrossRef]
- Krylov, V.B.; Argunov, D.A.; Vinnitskiy, D.Z.; Verkhnyatskaya, S.A.; Gerbst, A.G.; Ustyuzhanina, N.E.; Dmitrenok, A.S.; Huebner, J.; Holst, O.; Siebert, H.; et al. Pyranoside-into-Furanoside Rearrangement: New Reaction in Carbohydrate Chemistry and Its Application in Oligosaccharide Synthesis. Chem. A Eur. J. 2014, 20, 16516–16522. [Google Scholar] [CrossRef] [PubMed]
- Karelin, A.A.; Tsvetkov, Y.E.; Nifantiev, N.E. Synthesis of Oligosaccharides Related to Cell Wall Polysaccharides of the Fungi Candida and Aspergillus. Russ. Chem. Rev. 2017, 86, 1073–1126. [Google Scholar] [CrossRef]
- Krylov, V.B.; Petruk, M.I.; Glushko, N.I.; Khaldeeva, E.V.; Mokeeva, V.L.; Bilanenko, E.N.; Lebedin, Y.S.; Eremin, S.A.; Nifantiev, N.E. Carbohydrate Specificity of Antibodies against Phytopathogenic Fungi of the Aspergillus Genus. Appl. Biochem. Microbiol. 2018, 54, 522–527. [Google Scholar] [CrossRef]
- Krylov, V.B.; Petruk, M.I.; Grigoryev, I.V.; Lebedin, Y.S.; Glushko, N.I.; Khaldeeva, E.V.; Argunov, D.A.; Khatuntseva, E.A.; Toplishek, M.V.; Komarova, B.S.; et al. Study of the Carbohydrate Specificity of Antibodies Against Aspergillus fumigatus Using the Library of Synthetic Mycoantigens. Russ. J. Bioorg. Chem. 2018, 44, 80–89. [Google Scholar] [CrossRef]
- Zhan, L.; Zhen, S.J.; Wan, X.Y.; Gao, P.F.; Huang, C.Z. A Sensitive Surface-Enhanced Raman Scattering Enzyme-Catalyzed Immunoassay of Respiratory Syncytial Virus. Talanta 2016, 148, 308–312. [Google Scholar] [CrossRef] [PubMed]
- Guo, W.; Hu, Y.; Wei, H. Enzymatically Activated Reduction-Caged SERS Reporters for Versatile Bioassays. Analyst 2017, 142, 2322–2326. [Google Scholar] [CrossRef]
- Fu, C.; Zhang, L.; Bao, M.; Zhang, Y.; Li, Y.; Wu, Y.; Jung, Y.M. Signal Amplification Surface-Enhanced Raman Scattering Immunosorbent Assay of Human Chorionic Gonadotrophin Based on Repeated Enzyme Biocatalytic Precipitation. Analyst 2022, 147, 5718–5724. [Google Scholar] [CrossRef]
- Evtushenko, E.G.; Gavrilina, E.S.; Vasilyeva, A.D.; Yurina, L.V.; Kurochkin, I.N. Highly Sensitive Measurement of Horseradish Peroxidase Using Surface-Enhanced Raman Scattering of 2,3-Diaminophenazine. Molecules 2024, 29, 793. [Google Scholar] [CrossRef] [PubMed]
- Krylov, V.B.; Argunov, D.A.; Solovev, A.S.; Petruk, M.I.; Gerbst, A.G.; Dmitrenok, A.S.; Shashkov, A.S.; Latgé, J.-P.; Nifantiev, N.E. Synthesis of Oligosaccharides Related to Galactomannans from Aspergillus fumigatus and Their NMR Spectral Data. Org. Biomol. Chem. 2018, 16, 1188–1199. [Google Scholar] [CrossRef] [PubMed]
- Pinel, C.; Fricker-Hidalgo, H.; Lebeau, B.; Garban, F.; Hamidfar, R.; Ambroise-Thomas, P.; Grillot, R. Detection of Circulating Aspergillus fumigatus Galactomannan: Value and Limits of the Platelia Test for Diagnosing Invasive Aspergillosis. J. Clin. Microbiol. 2003, 41, 2184–2186. [Google Scholar] [CrossRef]
- Leopold, N.; Lendl, B. A New Method for Fast Preparation of Highly Surface-Enhanced Raman Scattering (SERS) Active Silver Colloids at Room Temperature by Reduction of Silver Nitrate with Hydroxylamine Hydrochloride. J. Phys. Chem. B 2003, 107, 5723–5727. [Google Scholar] [CrossRef]
- Evtushenko, E.G.; Gavrilina, E.S.; Gusarova, D.Y.; Vasil’eva, A.D.; Yurina, L.V.; Kurochkin, I.N. Application of Hydroxylamine Sols of Silver Nanoparticles to Obtain Reference SERS Spectra. Bull. Lebedev Phys. Inst. 2023, 50, S547–S551. [Google Scholar] [CrossRef]
- Mercier, T.; Guldentops, E.; Lagrou, K.; Maertens, J. Galactomannan, a Surrogate Marker for Outcome in Invasive Aspergillosis: Finally Coming of Age. Front. Microbiol. 2018, 9, 661. [Google Scholar] [CrossRef]
- Verweij, P.E.; Stynen, D.; Rijs, A.J.; De Pauw, B.E.; Hoogkamp-Korstanje, J.A.; Meis, J.F. Sandwich Enzyme-Linked Immunosorbent Assay Compared with Pastorex Latex Agglutination Test for Diagnosing Invasive Aspergillosis in Immunocompromised Patients. J. Clin. Microbiol. 1995, 33, 1912–1914. [Google Scholar] [CrossRef] [PubMed]
- Ascioglu, S.; Rex, J.H.; De Pauw, B.; Bennett, J.E.; Bille, J.; Crokaert, F.; Denning, D.W.; Donnelly, J.P.; Edwards, J.E.; Erjavec, Z.; et al. Defining Opportunistic Invasive Fungal Infections in Immunocompromised Patients with Cancer and Hematopoietic Stem Cell Transplants: An International Consensus. Clin. Infect. Dis. 2002, 34, 7–14. [Google Scholar] [CrossRef]
- Viscoli, C.; Machetti, M.; Gazzola, P.; De Maria, A.; Paola, D.; Van Lint, M.T.; Gualandi, F.; Truini, M.; Bacigalupo, A. Aspergillus Galactomannan Antigen in the Cerebrospinal Fluid of Bone Marrow Transplant Recipients with Probable Cerebral Aspergillosis. J. Clin. Microbiol. 2002, 40, 1496–1499. [Google Scholar] [CrossRef]
- Dufresne, S.F.; Datta, K.; Li, X.; Dadachova, E.; Staab, J.F.; Patterson, T.F.; Feldmesser, M.; Marr, K.A. Detection of Urinary Excreted Fungal Galactomannan-like Antigens for Diagnosis of Invasive Aspergillosis. PLoS ONE 2012, 7, e42736. [Google Scholar] [CrossRef]
- Reiss, E.; Stockman, L.; Kuykendall, R.J.; Smith, S.J. Dissociation of Mannan--Serum Complexes and Detection of Candida Albicans Mannan by Enzyme Immunoassay Variations. Clin. Chem. 1982, 28, 306–310. [Google Scholar] [CrossRef]
- Clancy, C.J.; Jaber, R.A.; Leather, H.L.; Wingard, J.R.; Staley, B.; Wheat, L.J.; Cline, C.L.; Rand, K.H.; Schain, D.; Baz, M.; et al. Bronchoalveolar Lavage Galactomannan in Diagnosis of Invasive Pulmonary Aspergillosis among Solid-Organ Transplant Recipients. J. Clin. Microbiol. 2007, 45, 1759–1765. [Google Scholar] [CrossRef]
- Hosoda, H.; Takasaki, W.; Oe, T.; Tsukamoto, R.; Nambara, T. A Comparison of Chromogenic Substrates for Horseradish Peroxidase as a Label in Steroid Enzyme Immunoassay. Chem. Pharm. Bull. 1986, 34, 4177–4182. [Google Scholar] [CrossRef] [PubMed]
- Fornera, S.; Walde, P. Spectrophotometric Quantification of Horseradish Peroxidase with O-Phenylenediamine. Anal. Biochem. 2010, 407, 293–295. [Google Scholar] [CrossRef]
- Merck Life Science LLC. TMB/E Single Reagent, Blue Color, Horseradish Peroxidase Substrate (ES001). Description. Available online: https://www.sigmaaldrich.com/RU/en/product/mm/es001?mmredirect=1 (accessed on 12 November 2024).
- PanReac AppliChem. 3,3′,5,5′-Tetramethylbenzidine (TMB) BioChemica (54827-17-7). Product info. Available online: https://www.itwreagents.com/italy/en/product/3-3-5-5--tetramethylbenzidine-biochemica/A3840 (accessed on 12 November 2024).
- Jensen, H.E.; Stynen, D.; Sarfati, J.; Latgé, J.-P. Detection of Galactomannan and the 18 kDa Antigen from Aspergillus fumigatus in Serum and Urine from Cattle with Systemic Aspergillosis. J. Vet. Med. Ser. B 1993, 40, 397–408. [Google Scholar] [CrossRef] [PubMed]
- Pereyra, C.; Alonso, V.; Rosa, C.; Chiacchiera, S.; Dalcero, A.; Cavaglieri, L. Gliotoxin Natural Incidence and Toxigenicity of Aspergillus fumigatus Isolated from Corn Silage and Ready Dairy Cattle Feed. World Mycotoxin J. 2008, 1, 457–462. [Google Scholar] [CrossRef]
- Abrão, F.O.; Duarte, E.R.; Pessoa, M.S.; Santos, V.L.D.; Freitas Júnior, L.F.D.; Barros, K.D.O.; Hughes, A.F.D.S.; Silva, T.D.; Rodriguez, N.M. Notable Fibrolytic Enzyme Production by Aspergillus Spp. Isolates from the Gastrointestinal Tract of Beef Cattle Fed in Lignified Pastures. PLoS ONE 2017, 12, e0183628. [Google Scholar] [CrossRef]
- Hajibemani, A.; Sheikhalislami, H. Zoonotic Pathogens Cause of Animal Abortion and Fetal Loss. J. Zoonotic Dis. 2020, 4, 1–19. [Google Scholar] [CrossRef]
- Soltis, R.D.; Hasz, D.; Morris, M.J.; Wilson, I.D. The Effect of Heat Inactivation of Serum on Aggregation of Immunoglobulins. Immunology 1979, 36, 37–45. [Google Scholar]
- Triglia, R.P.; Linscott, W.D. Titers of Nine Complement Components, Conglutinin and C3b-Inactivator in Adult and Fetal Bovine Sera. Mol. Immunol. 1980, 17, 741–748. [Google Scholar] [CrossRef]
- Lee, D.Y.; Lee, S.Y.; Yun, S.H.; Jeong, J.W.; Kim, J.H.; Kim, H.W.; Choi, J.S.; Kim, G.-D.; Joo, S.T.; Choi, I.; et al. Review of the Current Research on Fetal Bovine Serum and the Development of Cultured Meat. Food Sci. Anim. Resour. 2022, 42, 775–799. [Google Scholar] [CrossRef] [PubMed]
- Gifford, A.H.T.; Klippenstein, J.R.; Moore, M.M. Serum Stimulates Growth of and Proteinase Secretion by Aspergillus fumigatus. Infect. Immun. 2002, 70, 19–26. [Google Scholar] [CrossRef] [PubMed]

| Detection Method | Colorimetry | SERS | |
|---|---|---|---|
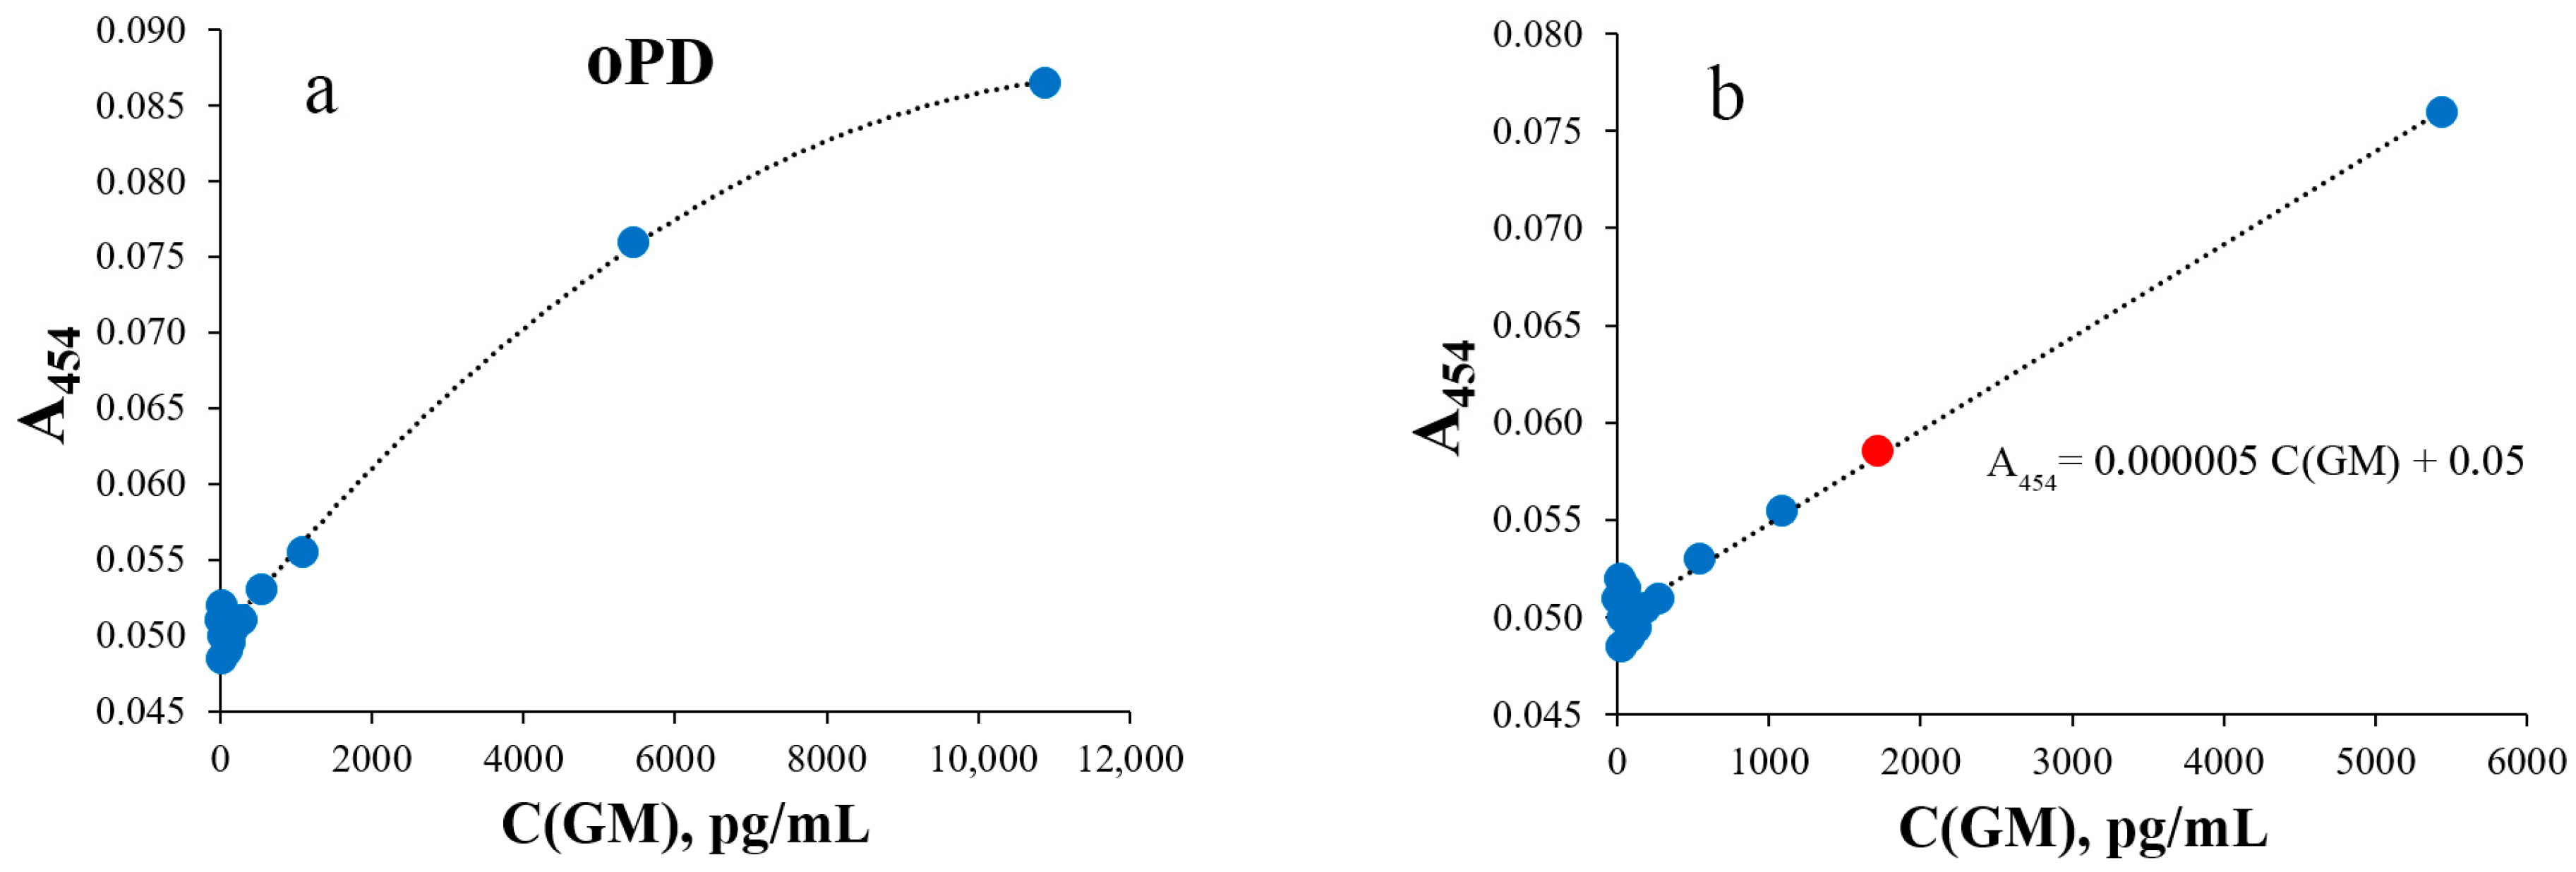
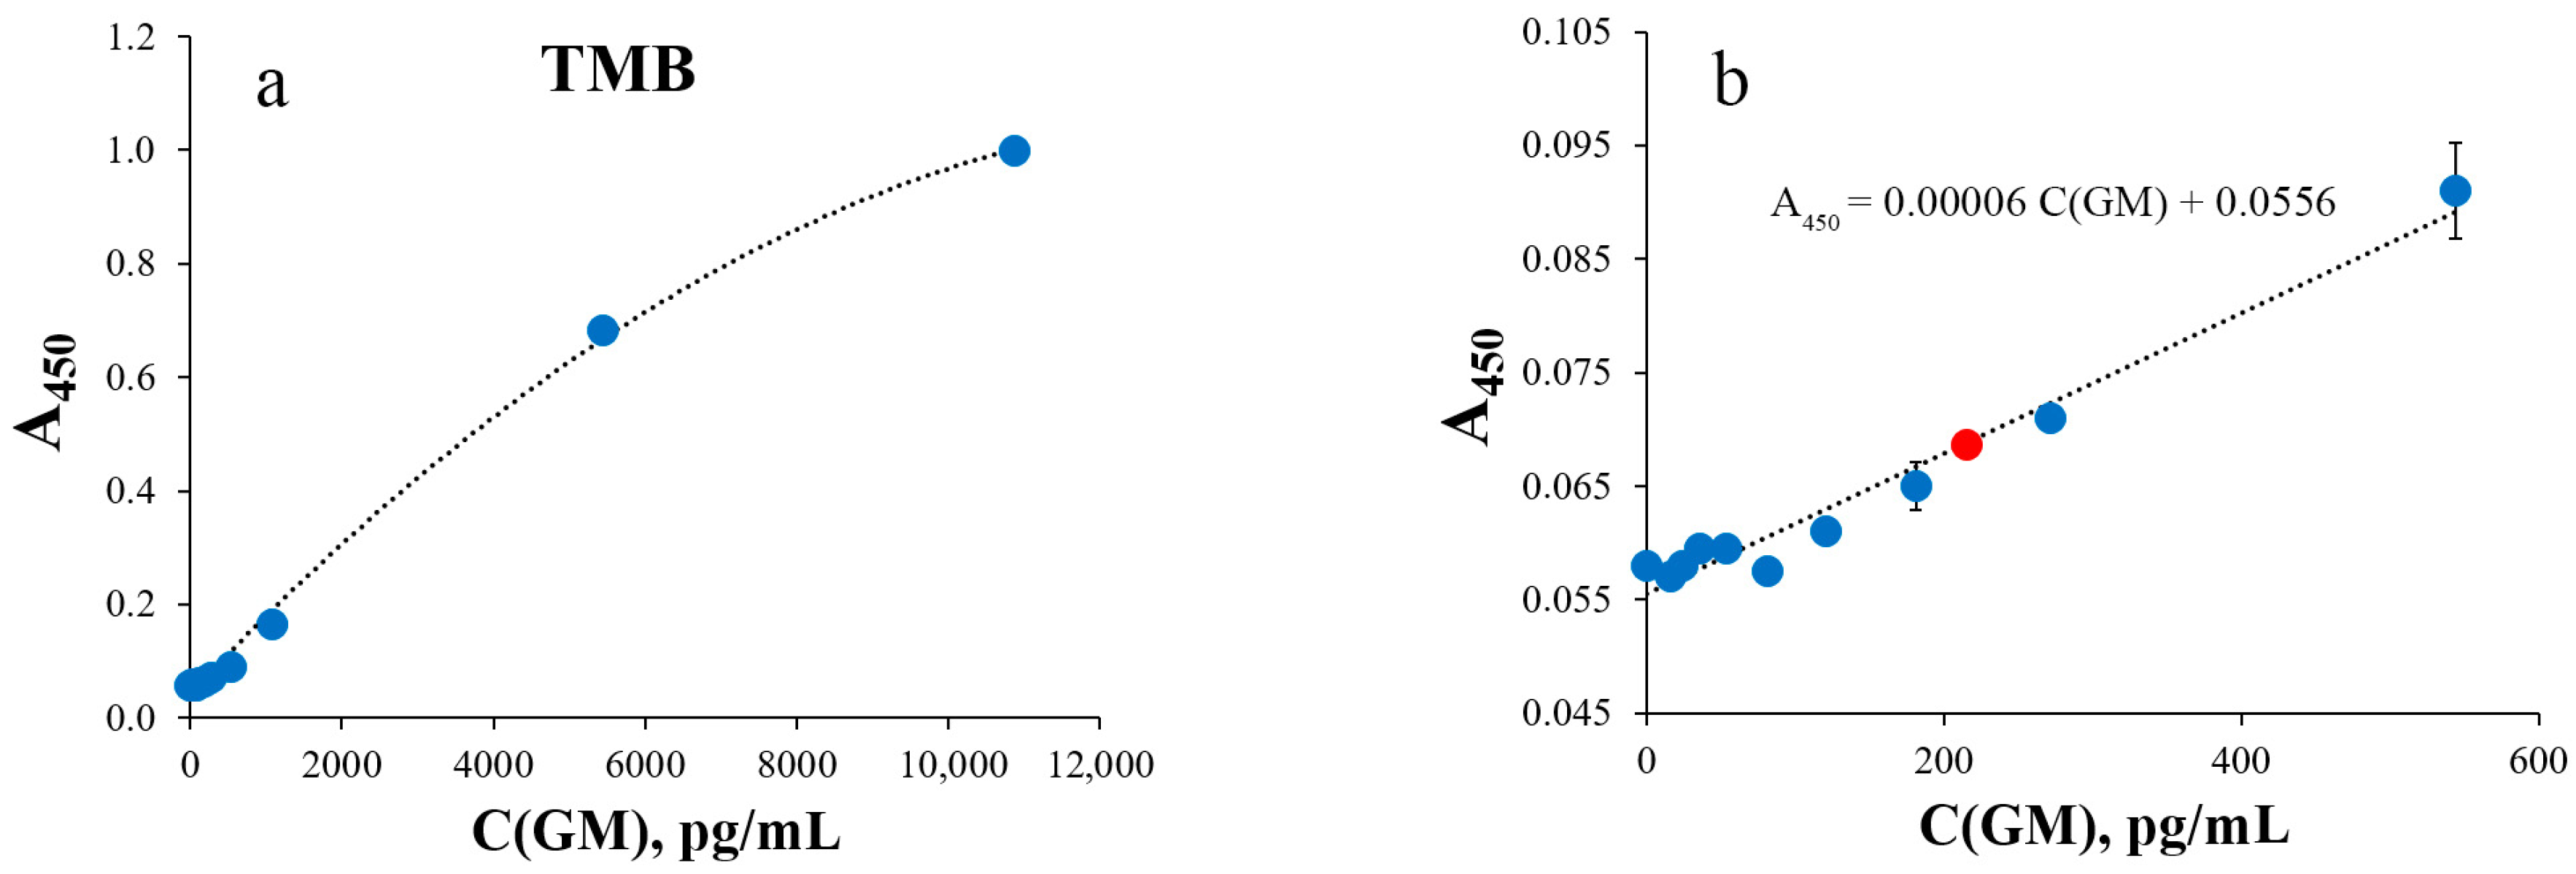
| Substrate | TMB | oPD | oPD |
| LOD, pg/mL | 216 | 2000 | 43 |
| CV, % | 3 | 5 | 11 |
Disclaimer/Publisher’s Note: The statements, opinions and data contained in all publications are solely those of the individual author(s) and contributor(s) and not of MDPI and/or the editor(s). MDPI and/or the editor(s) disclaim responsibility for any injury to people or property resulting from any ideas, methods, instructions or products referred to in the content. |
© 2025 by the authors. Licensee MDPI, Basel, Switzerland. This article is an open access article distributed under the terms and conditions of the Creative Commons Attribution (CC BY) license (https://creativecommons.org/licenses/by/4.0/).
Share and Cite
Vasilyeva, A.D.; Yurina, L.V.; Evtushenko, E.G.; Gavrilina, E.S.; Krylov, V.B.; Nifantiev, N.E.; Kurochkin, I.N. Increasing the Sensitivity of Aspergillus Galactomannan ELISA Using Silver Nanoparticle-Based Surface-Enhanced Raman Spectroscopy. Sensors 2025, 25, 4376. https://doi.org/10.3390/s25144376
Vasilyeva AD, Yurina LV, Evtushenko EG, Gavrilina ES, Krylov VB, Nifantiev NE, Kurochkin IN. Increasing the Sensitivity of Aspergillus Galactomannan ELISA Using Silver Nanoparticle-Based Surface-Enhanced Raman Spectroscopy. Sensors. 2025; 25(14):4376. https://doi.org/10.3390/s25144376
Chicago/Turabian StyleVasilyeva, A. D., L. V. Yurina, E. G. Evtushenko, E. S. Gavrilina, V. B. Krylov, N. E. Nifantiev, and I. N. Kurochkin. 2025. "Increasing the Sensitivity of Aspergillus Galactomannan ELISA Using Silver Nanoparticle-Based Surface-Enhanced Raman Spectroscopy" Sensors 25, no. 14: 4376. https://doi.org/10.3390/s25144376
APA StyleVasilyeva, A. D., Yurina, L. V., Evtushenko, E. G., Gavrilina, E. S., Krylov, V. B., Nifantiev, N. E., & Kurochkin, I. N. (2025). Increasing the Sensitivity of Aspergillus Galactomannan ELISA Using Silver Nanoparticle-Based Surface-Enhanced Raman Spectroscopy. Sensors, 25(14), 4376. https://doi.org/10.3390/s25144376