
Quantifying Mental Stress Using Cardiovascular Responses: A Scoping Review

 , , , , , , and
Abstract
1. Introduction
2. Materials and Methods
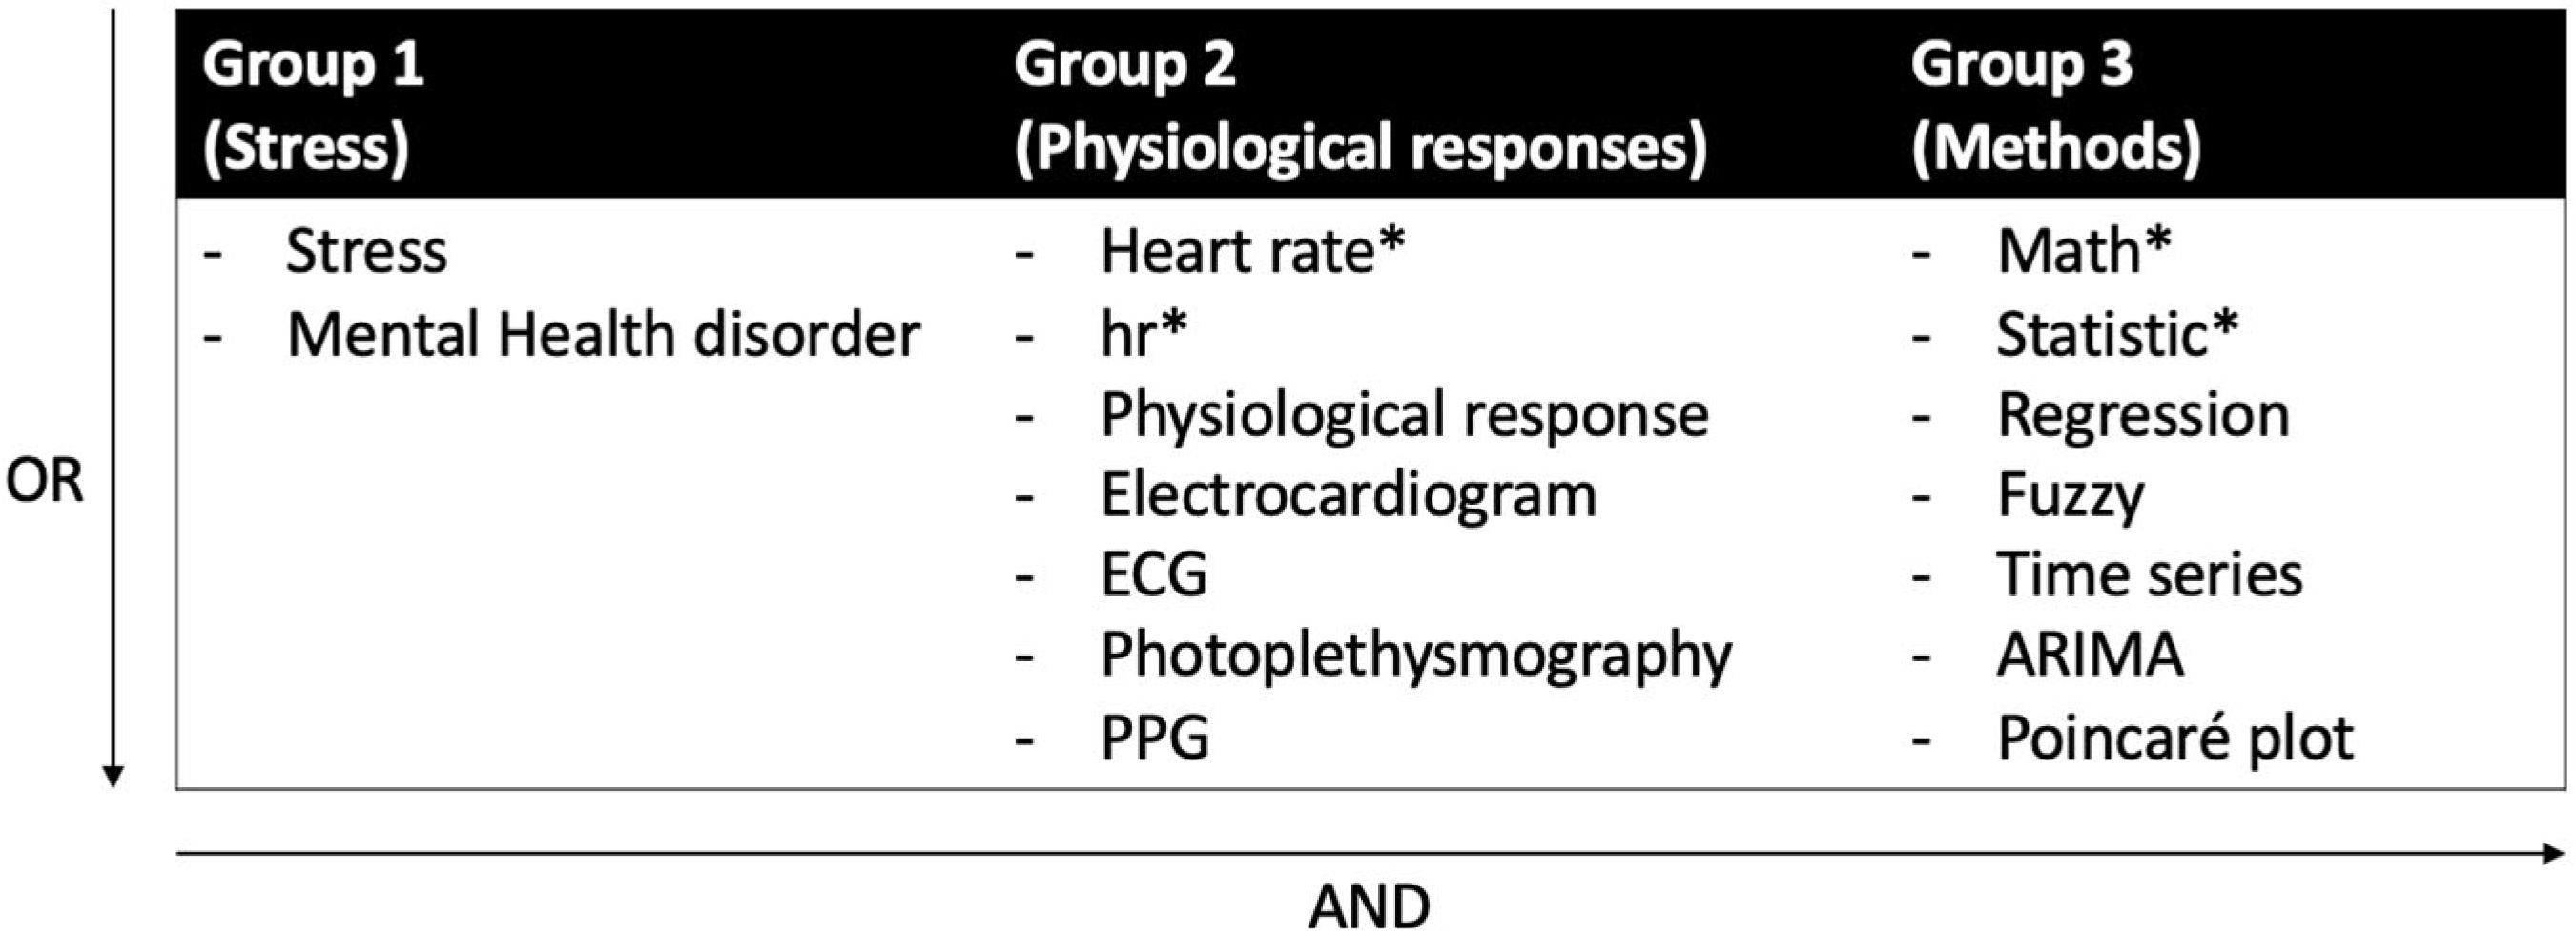
2.1. Search Strategy
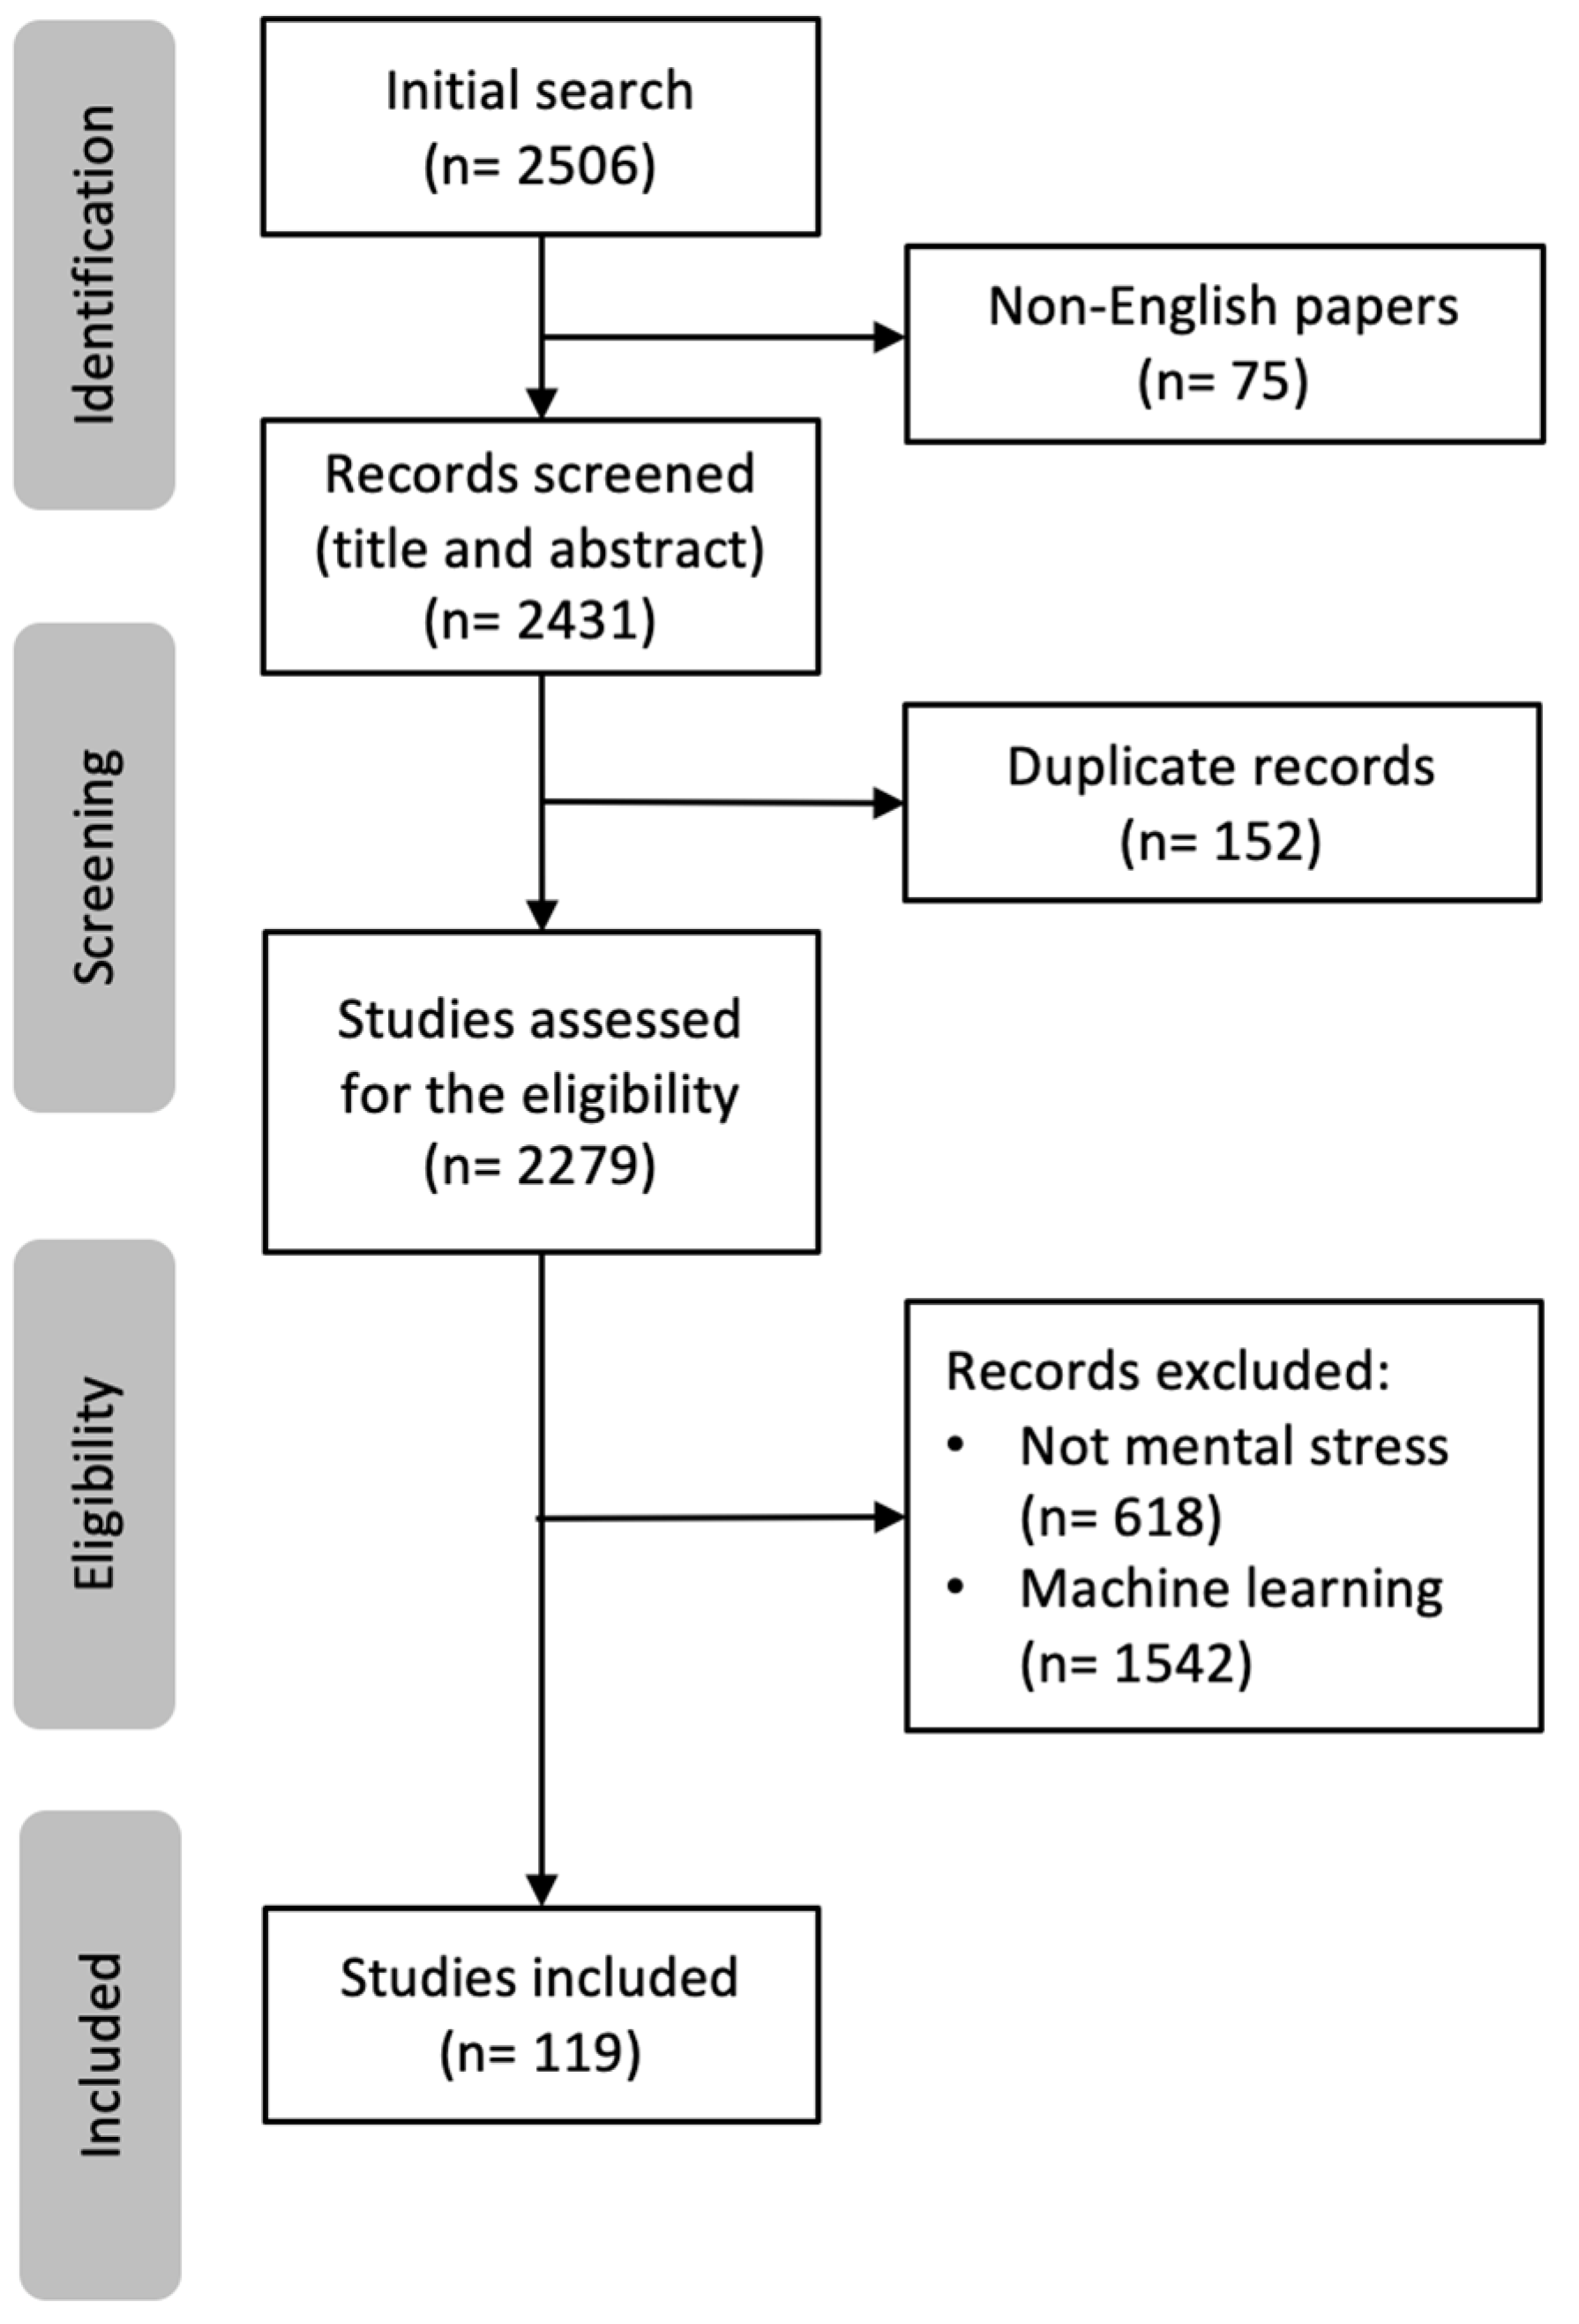
2.2. Study Selection, Inclusion, and Exclusion Criteria
3. Results
3.1. Heart Activity Measurements and Their Responses to Stress
3.2. Time-Domain HRV Measurements
3.3. Frequency-Domain HRV Measurements
3.4. Non-Linear HRV Measurements
3.5. Analysis Methods
3.5.1. t-Test and ANOVA (n = 36)
3.5.2. Correlation Analysis (n = 22)
3.5.3. Wilcoxon Signed-Rank Test (n = 14)
3.5.4. Regression Analysis (n = 12)
3.5.5. Poincare Plot (n = 10)
3.5.6. Fuzzy Logic (n = 6)
3.5.7. Detrended Fluctuation Analysis (n = 5)
3.5.8. Mann–Whitney U Test (n = 5)
3.5.9. ARIMA (Autoregressive Integrated Moving Average) Models (n = 3)
3.5.10. Autocorrelation Analysis (n = 1)
3.5.11. Other Methods (n = 6)
3.6. Experimental Settings
4. Discussion
4.1. Heart Rate Metrics: Promising Indicators for Mental Stress Detection
4.2. Statistical Analysis Methods or Models for Heart-Related Data
4.3. Utility of Time Series Analysis Methods
4.4. Experimental Settings: Naturalistic or Laboratory
4.5. Gaps and Limitations
5. Conclusions
Author Contributions
Funding
Institutional Review Board Statement
Informed Consent Statement
Data Availability Statement
Acknowledgments
Conflicts of Interest
Appendix A

| Article | Year | Population Type | Method Name | Environmental Setting | Stressors |
|---|---|---|---|---|---|
| [86] | 2010 | Human participants (N = 4) | - Pearson correlation - ARIMA | Lab | Target tracking and memory search tasks |
| [95] | 2010 | N = 1 | Cross-correlation | Lab | Mental calculation |
| [38] | 2011 | Healthy undergraduate students (N = 37) | - t-test - Wilcoxon signed-rank test - Mann–Whitney U test | Lab | - Negative performance feedback - Threat of not painful shock |
| [94] | 2011 | Male firefighters (N = 25) | Correlation analysis | Naturalistic | Self-designed questionnaire |
| [49] | 2011 | Freshman undergraduate students (N = 48) | - t-test - ANOVA | Lab | - Task switching - Color Stroop test |
| [102] | 2011 | Human participants (N = 28) | Wilcoxon signed-rank test | Lab | Oral answering |
| [87] | 2012 | Human participants (N = 19) | Pearson correlation | Lab | - Memory search - Dual tracking task - Mirror tracing - Color Stroop test - Public speech |
| [117] | 2012 | Human participants (N = 50) | Fuzzy logic | Lab | N/A |
| [46] | 2012 | Healthy subjects (N = 32) | - Wilcoxon signed-rank test - Mann–Whitney U test | Lab | - Perceived stress scale (PSS) - Minesweeper game |
| [106] | 2012 | Healthy participants (N = 21) | Regression analysis | Lab | - Color Stroop test |
| [85] | 2013 | Firefighter (N = 4) | Pearson correlation | Naturalistic | Emergency events during flights |
| [73] | 2014 | Students (N = 8) | t-test | Lab | Social Phobia Inventory (SPIN) |
| [115] | 2014 | Healthy volunteers | Fuzzy logic | Lab | Solving a 3D puzzle |
| [118] | 2014 | Males (N = 17) | Fuzzy logic | Naturalistic | - The Perceived Stress Scale (PSS) - Physical/mental stimuli |
| [11] | 2015 | healthy subjects (N = 42) | - Wilcoxon signed-rank test - ARIMA - DFA | Lab | Color Stroop test |
| [124] | 2015 | Healthy subjects (N = 11) | Mann–Whitney Wilcoxon test | Lab | Stroop color word test |
| [64] | 2015 | Public safety worker (N = 39) | - Poincaré plot - t-test | Lab | Color Stroop test |
| [111] | 2015 | Healthy students | Poincaré plot | Lab | Trier Social Stress Test |
| [80] | 2015 | Undergraduate students (N = 73) | ANOVA | Lab | - The Mini-Social Phobia Inventory (Mini-SPIN) self-report questionnaire - The Mini-Social Phobia Inventory (Mini-SPIN) self-report questionnaire |
| [31] | 2015 | Human participants (N = 1) | Descriptive Visualization analysis | Naturalistic | Keep a diary of stressful events |
| [54] | 2015 | Healthy engineering university students (N = 30) | t-test | Lab | Mental Arithmetic Task (MAT) |
| [77] | 2016 | Male participants (N = 34) | - t-test - Pearson correlation | Lab | Arithmetic Operations/tests/game |
| [114] | 2016 | Human participants (N = 68) | Fuzzy Logic | Lab | 3D Puzzle |
| [68] | 2016 | Human participants (N = 8) | t-test | Lab | Sing-a-Song Stress Test (SSST) |
| [98] | 2016 | Healthy volunteers (N = 46) | Wilcoxon signed-rank test | Lab | - Trier Social Stress Test - State/Trait Anxiety Inventory (STAI) |
| [137] | 2016 | Students (N = 13) | Data visualization | Lab | Multiple-choice questions exam |
| [53] | 2017 | Human participants (N = 9) | - Complex correlation - Poincaré plot | Lab | Arithmetic operations/tests/game |
| [83] | 2017 | Human participants (N = 65) | - Pearson correlation - Regression Analysis | Lab | Arithmetic operations/tests/game |
| [78] | 2017 | Twenty-two participants (N = 22) | ANOVA | Lab | Daily stressor and supportive events (DSSQ) test |
| [100] | 2017 | Human participants (N = 14) | - Wilcoxon signed-rank test - Poincaré plot - DFA | Lab | State/Trait Anxiety Inventory (STAI) |
| [134] | 2017 | Students (N = 46) | Friedman test | Lab | Trier Social Stress Test |
| [42] | 2017 | students (N = 30) | Poincaré plot | Lab | Exam |
| [109] | 2017 | Human participants (N = 7) | Poincaré plot | Lab | - Stroop color–word test (CWT) - Mental arithmetic test |
| [133] | 2018 | Human participants (N = 26) | Regression approach based on separability maximization | Lab | Trier Social Stress Test |
| [104] | 2018 | Healthy people (N = 8) | Linear regression model | Naturalistic | The Perceived Stress Scale (PSS) |
| [67] | 2018 | University students (N = 33) | - t-test - ANOVA | Lab | Exam |
| [82] | 2018 | Human participants (N = 47) | - Pearson correlation - Regression Analysis | Lab | - State/Trait Anxiety Inventory (STAI) - Shirom-Melamed Burnout questionnaire (SMBQ) |
| [55] | 2018 | Human participants (N = 35) | - t-test - Fuzzy logic | Lab | - Designed Questionnaire - Arithmetic Operations/tests/game |
| [97] | 2018 | Healthy subjects (N = 69) | Wilcoxon signed-rank test | Lab | Video game |
| [70] | 2018 | MDD patients and control group (N = 11 each) | t-test | Lab | - Diagnostic and Statistical Manual of Mental Disorders (DSM-5) - Hamilton Rating Scale for Depression |
| [131] | 2018 | Female participants(N = 75) | - Chi-squared test - Covariance analysis | Lab | Speech and math task |
| [56] | 2018 | healthy students (N = 40) | t-test | Lab | Trier Social Stress Test |
| [93] | 2018 | Male firefighters (N = 6) | - Spearman correlation - Wilcoxon signed-rank test | Naturalistic | - The Visual Analogue Scale (VAS) - Designed questionnaire |
| [81] | 2018 | Healthy students (N = 90) | - Poincaré plot - ANOVA | Lab | Exam |
| [66] | 2018 | Young adults (N = 98) Married couples (N = 60) | t-test Non-linear regression analysis | Lab | Semi-structured Social Competence Interview |
| [47] | 2019 | Male pilots (N = 11) | ANOVA | Naturalistic | Special training/flight |
| [129] | 2019 | Pilots | A quantitative analysis method using the area of HR waveform | Naturalistic | Special training/flight |
| [88] | 2019 | Students (N = 40) | Pearson correlation | Lab | State/Trait Anxiety Inventory (STAI) |
| [99] | 2019 | Healthy participants (N = 16) | - Wilcoxon signed-rank test - Mann–Whitney U test | Lab | Arithmetic tests |
| [101] | 2019 | young, healthy participants (N = 76) | - Wilcoxon signed-rank test - Regression Analysis | Lab | Mental arithmetic test |
| [79] | 2019 | Healthy participants (N = 6) | ANOVA | Lab | Mental arithmetic test |
| [58] | 2019 | Young, healthy participants (N = 10) | t-test | Lab | Color Stroop test |
| [57] | 2019 | Human participants (N = 16) | t-test | Naturalistic | Speech task |
| [92] | 2019 | Students (N = 42) | Spearman correlation Wilcoxon signed-rank test | Naturalistic | Oral Exam |
| [91] | 2019 | Healthy participants (N = 42) | - Spearman correlation - Wilcoxon signed-rank test | Naturalistic | Oral Exam |
| [139] | 2020 | Engineering student (N = 42) | Fuzzy logic | Lab | Solving 3D puzzle |
| [132] | 2020 | Students (N = 50) | Descriptive statistical analysis | Naturalistic | Exam |
| [105] | 2020 | Healthy male (N = 5) | Stepwise regression method | Lab | Driving Simulator |
| [37] | 2020 | Healthy volunteers (N = 36) | t-test | Lab | - Speech task - The Montreal Imaging Stress Task (MIST) - Color Stroop test |
| [62] | 2020 | Moderately stressed participants (N = 13) | - t-test - Pearson correlation | Lab and naturalistic | - State/Trait Anxiety Inventory (STAI) - The NASA Task Load Index (NASA-TLX) - The Perceived Stress Scale (PSS) |
| [74] | 2020 | Patient (N = 1) | t-test | Lab | Rehabilitation sessions |
| [135] | 2020 | volunteers and colleagues (N = 6) | Descriptive statistical analysis | Lab | Physical/mental stimuli |
| [72] | 2020 | Male firefighters (N = 26) | - t-test - Spearman correlation | Naturalistic | Designed questionnaire |
| [76] | 2020 | Healthy and depressed patients (N = 82, 36 healthy volunteers, 46 patients with moderate depression) | - t-test - Wilcoxon signed-rank test | Lab | Hamilton Depression Rating Scale (HDRS) |
| [89] | 2020 | High-school student (N = 139) | - Pearson correlation - Regression Analysis | Naturalistic | Math test |
| [84] | 2020 | Human participants (N = 29) | Pearson Correlation | Lab | Arithmetic operations/tests/game |
| [110] | 2020 | Human participants (N = 14) | - Poincaré plot | Lab | Virtual reality video game |
| [60] | 2020 | Healthy undergraduate students (N = 20) | - t-test - Wilcoxon signed-rank test - Poincaré plot - DFA | Lab | Arithmetic operations/tests/game |
| [63] | 2020 | Human participants (N = 27) | - t-test | Lab | - Exploring a virtual environment - Self-designed questionnaires |
| [130] | 2020 | Human participants (N = 6) | 3D phase space plot | Lab | - Sudoku puzzle - Chess game - Prisoners’ red and blue cap problem |
| [61] | 2020 | Human participants (N = 18) | - t-test - Pearson correlation | Lab | The Montreal Imaging Stress Task (MIST) |
| [65] | 2021 | Graduate students (N = 17) | - t-test - logistic regression | Lab | Trier Social Stress Test |
| [36] | 2021 | Healthy subjects (N = 10) | - Pearson correlation - Spearman correlation | Lab | - N-back test - Neuropsychological d2 Test of Attention |
| [69] | 2021 | Undergraduates and postgraduates (N = 16) | t-test | Lab | - Giving a sense of urgency with countdown screen - The Montreal Imaging Stress Task (MIST) |
| [59] | 2021 | Human participants (N = 48) | - t-test - Logistic regression | Lab | State/Trait Anxiety Inventory (STAI) |
| [75] | 2021 | Elderly people (N = 7) | - t-test - ANOVA | Lab | State/Trait Anxiety Inventory (STAI) |
| [71] | 2021 | Human participants (N = 5) | t-test | Lab | Playing loud one-second white noise |
| [45] | 2021 | Employees of a medical center (N = 44) | Descriptive statistical analysis | Lab | Oral presentation |
| [17] | 2021 | Veterans with PTSD (N = 99) | - Pearson correlation - Autocorrelation analysis - DFA - Regression Analysis | Naturalistic | Self-report by mobile/watch application |
| [90] | 2022 | Human participants (N = 2) | Correlation analysis | Lab | N/A |
| [40] | 2022 | Human participants (N = 24) | ANOVA | Naturalistic& Lab | - Sing-a-Song Stress Test (SSST) - Noise Exposure (Noise Test) - N-back test |
| [32] | 2022 | MD students and general people (N = 60, 30 MD students, 30 general people) | - t-test - Pearson correlation | Lab | - Depression Anxiety Stress Scale (DASS) - Trier Social Stress Test |
| [43] | 2023 | Students (N = 103) | - t-test | Lab | Depression Anxiety Stress Scale (DASS) |
| [44] | 2023 | Police officers (N = 8) | Vector Autoregression (VAR) modeling | Naturalistic | The Four-Dimensional Symptom Questionnaire (4DSQ) |
| [39] | 2023 | Athlete students (N = 41) | - t-test - Mann–Whitney U test | Lab | Arithmetic operations/tests/game |
Appendix B
| Parameter | Unit | Description |
|---|---|---|
| SDNN | ms | Standard deviation of NN intervals |
| SDRR | ms | Standard deviation of RR intervals |
| SDSD | ms | Standard deviation of differences between adjacent NN intervals |
| SDANN | ms | Standard deviation of the average NN intervals for each 5 min segment of a 24 h HRV recording |
| SDNN index (SDNNI) | ms | Mean of the standard deviations of all the NN intervals for each 5 min segment of a 24 h HRV recording |
| NN50 count | The total count of adjacent NN interval pairs that are more than 50 ms apart over the whole recording. | |
| pNN50 | % | Percentage of successive RR intervals that differ by more than 50 ms |
| HRmax–HRmin | bpm | Average difference between the highest and lowest heart rates during each respiratory cycle |
| RMSSD | ms | Root mean square of successive RR interval differences |
| HRV triangular index | - | The integral of the density of the RR interval histogram divided by its height |
| TINN | ms | Baseline width of the RR interval histogram |
| SDANN | ms | Standard deviation of the average NN intervals for each 5 min segment of a 24 h HRV recording |
| Parameter | Unit | Description |
|---|---|---|
| ULF power | ms2 | Absolute power of the ultra-low-frequency band (≤0.003 Hz) |
| VLF power | ms2 | Absolute power of the very-low-frequency band (0.0033–0.04 Hz) |
| LF peak | Hz | Peak frequency of the low-frequency band (0.04–0.15 Hz) |
| LF power | ms2 | Absolute power of the low-frequency band (0.04–0.15 Hz) |
| LF power | nu | Relative power of the low-frequency band (0.04–0.15 Hz) in normal units |
| LF power | % | Relative power of the low-frequency band (0.04–0.15 Hz) |
| HF peak | Hz | Peak frequency of the high-frequency band (0.15–0.4 Hz) |
| HF power | ms2 | Absolute power of the high-frequency band (0.15–0.4 Hz) |
| HF power | nu | Relative power of the high-frequency band (0.15–0.4 Hz) in normal units |
| HF power | % | Relative power of the high-frequency band (0.15–0.4 Hz) |
| LF/HF | % | Ratio of LF-to-HF power |
| Parameter | Unit | Description |
|---|---|---|
| S | ms | Area of the Poincaré plot ellipse, representing total HRV |
| SD1 | ms | Poincaré plot standard deviation, perpendicular to the line of identity; indicator of parasympathetic activity |
| SD2 | ms | Poincaré plot standard deviation, along the line of identity; indicator of sympathetic activity |
| SD1/SD2 | % | Ratio of SD1 to SD2; an indicator of sympathetic activity |
| ApEn | Approximate entropy, which measures the regularity and complexity of a time series | |
| SampEn | Sample entropy, which measures the regularity and complexity of a time series | |
| DFA α1 | Detrended fluctuation analysis parameter, which describes short-term fluctuations | |
| DFA α2 | Detrended fluctuation analysis parameter, which describes long-term fluctuations | |
| DFA α | Detrended fluctuation analysis scaling component |
References
- Stress in America 2022: Concerned for the future, Beset by Inflation. Available online: https://www.apa.org/news/press/releases/stress/2022/concerned-future-inflation (accessed on 28 July 2023).
- Al Houri, H.N.; Jomaa, S.; Arrouk, D.M.N.; Nassif, T.; Al Ata Allah, M.J.; Al Houri, A.N.; Latifeh, Y. The prevalence of stress among medical students in Syria and its association with social support: A cross-sectional study. BMC Psychiatry 2023, 23, 97. [Google Scholar] [CrossRef] [PubMed]
- World Health Organization Stress. Available online: https://www.who.int/news-room/questions-and-answers/item/stress (accessed on 28 July 2023).
- I’m So Stressed Out! Fact Sheet. National Institute of Mental Health (NIMH). Available online: https://www.nimh.nih.gov/health/publications/so-stressed-out-fact-sheet (accessed on 20 August 2022).
- Stress Symptoms: Effects on Your Body and Behavior-Mayo Clinic. Available online: https://www.mayoclinic.org/healthy-lifestyle/stress-management/in-depth/stress-symptoms/art-20050987 (accessed on 20 August 2022).
- Mental Health Foundation What Is Stress? Available online: https://www.mentalhealth.org.uk/explore-mental-health/a-z-topics/stress (accessed on 6 January 2023).
- Hu, B.; Liu, X.; Yin, S.; Fan, H.; Feng, F.; Yuan, J. Effects of Psychological Stress on Hypertension in Middle-Aged Chinese: A Cross-Sectional Study. PLoS ONE 2015, 10, e0129163. [Google Scholar] [CrossRef] [PubMed]
- Liu, M.-Y.; Li, N.; Li, W.A.; Khan, H. Association between psychosocial stress and hypertension: A systematic review and meta-analysis. Neurol. Res. 2017, 39, 573–580. [Google Scholar] [CrossRef] [PubMed]
- Spruill, T.M. Chronic Psychosocial Stress and Hypertension. Curr. Hypertens. Rep. 2010, 12, 10–16. [Google Scholar] [CrossRef]
- Tafet, G.E.; Nemeroff, C.B. The Links Between Stress and Depression: Psychoneuroendocrinological, Genetic, and Environmental Interactions. JNP 2016, 28, 77–88. [Google Scholar] [CrossRef]
- Castaldo, R.; Melillo, P.; Pecchia, L. Acute Mental Stress Detection via Ultra-short term HRV Analysis. In Proceedings of the World Congress on Medical Physics and Biomedical Engineering, Toronto, ON, Canada, 7–12 June 2015; IFMBE Proceedings. Jaffray, D.A., Ed.; Springer International Publishing: Cham, Switzerland, 2015; Volume 51, pp. 1068–1071, ISBN 978-3-319-19386-1. [Google Scholar] [CrossRef]
- Cleveland Clinic Sympathetic Nervous System (SNS): What It Is & Function. Available online: https://my.clevelandclinic.org/health/body/23262-sympathetic-nervous-system-sns-fight-or-flight (accessed on 20 August 2022).
- American Psychological Association Stress Effects on the Body. Available online: https://www.apa.org/topics/stress/body (accessed on 7 January 2023).
- Kim, H.-G.; Cheon, E.-J.; Bai, D.-S.; Lee, Y.H.; Koo, B.-H. Stress and Heart Rate Variability: A Meta-Analysis and Review of the Literature. Psychiatry Investig. 2018, 15, 235–245. [Google Scholar] [CrossRef]
- Razavi, M.; Ziyadidegan, S.; Sasangohar, F. Machine Learning Techniques for Prediction of Stress-Related Mental Disorders: A Scoping Review. Proc. Hum. Factors Ergon. Soc. Annu. Meet. 2022, 66, 300–304. [Google Scholar] [CrossRef]
- Ziyadidegan, S.; Razavi, M.; Sasangohar, F. Analyzing physiological responses to quantify anxiety disorders: A scoping review. Proc. Hum. Factors Ergon. Soc. Annu. Meet. 2022, 66, 2183–2187. [Google Scholar] [CrossRef]
- Sadeghi, M.; Sasangohar, F.; McDonald, A.D.; Hegde, S. Understanding heart rate reactions to post-traumatic stress disorder (ptsd) among veterans: A naturalistic study. Hum. Factors 2022, 64, 173–187. [Google Scholar] [CrossRef]
- Wang, C.-A.; Baird, T.; Huang, J.; Coutinho, J.D.; Brien, D.C.; Munoz, D.P. Arousal Effects on Pupil Size, Heart Rate, and Skin Conductance in an Emotional Face Task. Front. Neurol. 2018, 9, 1029. [Google Scholar] [CrossRef]
- Castaldo, R.; Melillo, P.; Bracale, U.; Caserta, M.; Triassi, M.; Pecchia, L. Acute mental stress assessment via short term HRV analysis in healthy adults: A systematic review with meta-analysis. Biomed. Signal Process. Control 2015, 18, 370–377. [Google Scholar] [CrossRef]
- Jesmin, S.; Kaiser, M.S.; Mahmud, M. Towards Artificial Intelligence Driven Stress monitoring for mental wellbeing tracking During COVID-19. In Proceedings of the 2020 IEEE/WIC/ACM International Joint Conference on Web Intelligence and Intelligent Agent Technology (WI-IAT), Melbourne, Australia, 14–17 December 2020; pp. 845–851. [Google Scholar] [CrossRef]
- Pluntke, U.; Gerke, S.; Sridhar, A.; Weiss, J.; Michel, B. Evaluation and Classification of Physical and Psychological Stress in Firefighters using Heart Rate Variability. In Proceedings of the 2019 41st Annual International Conference of the IEEE Engineering in Medicine and Biology Society (EMBC), Berlin, Germany, 23–27 July 2019; IEEE: Piscataway, NJ, USA, 2019; pp. 2207–2212. [Google Scholar] [CrossRef]
- Can, Y.S.; Chalabianloo, N.; Ekiz, D.; Ersoy, C. Continuous stress detection using wearable sensors in real life: Algorithmic programming contest case study. Sensors 2019, 19, 1849. [Google Scholar] [CrossRef] [PubMed]
- Giannakakis, G.; Marias, K.; Tsiknakis, M. A stress recognition system using HRV parameters and machine learning techniques. In Proceedings of the 2019 8th International Conference on Affective Computing and Intelligent Interaction Workshops and Demos (ACIIW), Cambridge, UK, 3–6 September 2019; pp. 269–272. [Google Scholar] [CrossRef]
- Sakri, O.; Godin, C.; Vila, G.; Labyt, E.; Charbonnier, S.; Campagne, A. A Multi-User Multi-Task Model For Stress Monitoring From Wearable Sensors. In Proceedings of the 2018 21st International Conference on Information Fusion (FUSION), Cambridge, UK, 10–13 July 2018; pp. 761–766. [Google Scholar] [CrossRef]
- Choi, Y.; Jeon, Y.-M.; Wang, L.; Kim, K. A Biological Signal-Based Stress Monitoring Framework for Children Using Wearable Devices. Sensors 2017, 17, 1936. [Google Scholar] [CrossRef] [PubMed]
- Sadeghi, M.; McDonald, A.D.; Sasangohar, F. Posttraumatic stress disorder hyperarousal event detection using smartwatch physiological and activity data. PLoS ONE 2022, 17, e0267749. [Google Scholar] [CrossRef]
- Sadeghi, M.; Sasangohar, F.; McDonald, A.D. Toward a Taxonomy for Analyzing the Heart Rate as a Physiological Indicator of Posttraumatic Stress Disorder: Systematic Review and Development of a Framework. JMIR Ment. Health 2020, 7, e16654. [Google Scholar] [CrossRef] [PubMed]
- Tricco, A.C.; Lillie, E.; Zarin, W.; O’Brien, K.K.; Colquhoun, H.; Levac, D.; Moher, D.; Peters, M.D.J.; Horsley, T.; Weeks, L.; et al. PRISMA Extension for Scoping Reviews (PRISMA-ScR): Checklist and Explanation. Ann. Intern. Med. 2018, 169, 467–473. [Google Scholar] [CrossRef]
- Razavi, M.; Ziyadidegan, S.; Jahromi, R.; Kazeminasab, S.; Janfaza, V.; Mahmoudzadeh, A.; Baharlouei, E.; Sasangohar, F. Machine Learning, Deep Learning and Data Preprocessing Techniques for Detection, Prediction, and Monitoring of Stress and Stress-related Mental Disorders: A Scoping Review. arXiv 2023, arXiv:2308.04616. [Google Scholar] [CrossRef]
- Zontone, P.; Affanni, A.; Bernardini, R.; Del Linz, L.; Piras, A.; Rinaldo, R. Stress Evaluation in Simulated Autonomous and Manual Driving through the Analysis of Skin Potential Response and Electrocardiogram Signals. Sensors 2020, 20, 2494. [Google Scholar] [CrossRef]
- Garcia-Mancilla, J.; Gonzalez, V.M. Stress Quantification Using a Wearable Device for Daily Feedback to Improve Stress Management. In Proceedings of the Smart Health: International Conference, ICSH 2015, Phoenix, AZ, USA, 17–18 November 2015; Springer International Publishing: Cham, Switzerland, 2015; pp. 204–209. Available online: https://link.springer.com/chapter/10.1007/978-3-319-29175-8_19 (accessed on 13 September 2022).
- Chalmers, T.; Hickey, B.A.; Newton, P.; Lin, C.-T.; Sibbritt, D.; McLachlan, C.S.; Clifton-Bligh, R.; Morley, J.; Lal, S. Stress Watch: The Use of Heart Rate and Heart Rate Variability to Detect Stress: A Pilot Study Using Smart Watch Wearables. Sensors 2021, 22, 151. [Google Scholar] [CrossRef]
- Shaffer, F.; Ginsberg, J.P. An Overview of Heart Rate Variability Metrics and Norms. Front. Public Health 2017, 5, 258. [Google Scholar] [CrossRef]
- Stein, P.K.; Reddy, A. Non-Linear Heart Rate Variability and Risk Stratification in Cardiovascular Disease. Indian Pacing Electrophysiol. J. 2005, 5, 210–220. [Google Scholar] [PubMed]
- Chen, S.-W.; Liaw, J.-W.; Chang, Y.-J.; Chuang, L.-L.; Chien, C.-T. Combined heart rate variability and dynamic measures for quantitatively characterizing the cardiac stress status during cycling exercise. Comput. Biol. Med. 2015, 63, 133–142. [Google Scholar] [CrossRef] [PubMed]
- Gündoğdu, S.; Çolak, Ö.H.; Doğan, E.A.; Gülbetekin, E.; Polat, Ö. Assessment of mental fatigue and stress on electronic sport players with data fusion. Med. Biol. Eng. Comput. 2021, 59, 1691–1707. [Google Scholar] [CrossRef] [PubMed]
- Reali, P.; Brugnera, A.; Compare, A.; Bianchi, A.M. Efficacy of Time- and Frequency-Domain Heart Rate Variability Features in Stress Detection and Their Relation with Coping Strategies. In Proceedings of the XV Mediterranean Conference on Medical and Biological Engineering and Computing–MEDICON 2019, Coimbra, Portugal, 26–28 September 2019; IFMBE Proceedings. Henriques, J., Neves, N., de Carvalho, P., Eds.; Springer International Publishing: Cham, Switzerland, 2020; Volume 76, pp. 209–216, ISBN 978-3-030-31634-1. [Google Scholar] [CrossRef]
- Lee, D.S.; Jo, N.Y.; Lee, K.C. A Physiological Approach to Creativity under Stress and Non-stress Conditions. In Proceedings of the U- and E-Service, Science and Technology, Jeju Island, Republic of Korea, 8–10 December 2011; Communications in Computer and Information Science. Kim, T., Adeli, H., Ma, J., Fang, W., Kang, B.-H., Park, B., Sandnes, F.E., Lee, K.C., Eds.; Springer: Berlin/Heidelberg, Germany, 2011; pp. 197–206. [Google Scholar] [CrossRef]
- Vurgun, N.; Eler, N.; Eler, S.; Şentürk, A. The Effect of Short-Term Mental and Physical Stress on Heart Rate Variability. PONTE 2023, 79. [Google Scholar] [CrossRef]
- Mathissen, M.; Hennes, N.; Faller, F.; Leonhardt, S.; Teichmann, D. Investigation of Three Potential Stress Inducement Tasks During On-Road Driving. IEEE Trans. Intell. Transport. Syst. 2022, 23, 4823–4832. [Google Scholar] [CrossRef]
- Minarini, G. Root Mean Square of the Successive Differences as Marker of the Parasympathetic System and Difference in the Outcome after ANS Stimulation. In Autonomic Nervous System Monitoring-Heart Rate Variability; IntechOpen: London, UK, 2020; ISBN 978-1-83880-519-7. [Google Scholar] [CrossRef]
- Ramteke, R.; Thool, V.R. Stress Detection of Students at Academic Level from Heart Rate Variability. In Proceedings of the 2017 International Conference on Energy, Communication, Data Analytics and Soft Computing (ICECDS), Chennai, India, 1–2 August 2017; IEEE: Piscataway, NJ, USA, 2017; pp. 2154–2157. [Google Scholar]
- Garg, A.; Tripathi, K.; Goyal, S.; Behera, L.; Dutt, V. The impact of Odissi dance on stress, anxiety, and depression levels among young adults. In Proceedings of the 16th International Conference on PErvasive Technologies Related to Assistive Environments, Corfu, Greece, 5–7 July 2023; Association for Computing Machinery: New York, NY, USA, 2023; pp. 754–759. [Google Scholar] [CrossRef]
- de Vries, H.J.; Pennings, H.J.M.; van der Schans, C.P.; Sanderman, R.; Oldenhuis, H.K.E.; Kamphuis, W. Wearable-Measured Sleep and Resting Heart Rate Variability as an Outcome of and Predictor for Subjective Stress Measures: A Multiple N-of-1 Observational Study. Sensors 2023, 23, 332. [Google Scholar] [CrossRef]
- Raj, A.; B, V.; Vagish, D.; V, S.; Sp, P.; Sivaprakasam, M. Statistical Analysis of Mental Stress During Oral Presentation. In Proceedings of the 2021 IEEE International Symposium on Medical Measurements and Applications (MeMeA), Lausanne, Switzerland, 23–25 June 2021; IEEE: Piscataway, NJ, USA, 2021; pp. 1–6. [Google Scholar] [CrossRef]
- Jo, N.Y.; Lee, K.C.; Lee, D.S. Task Performance under Stressed and Non-stressed Conditions: Emphasis on Physiological Approaches. In Intelligent Information and Database Systems; Lecture Notes in Computer Science; Pan, J.-S., Chen, S.-M., Nguyen, N.T., Eds.; Springer: Berlin/Heidelberg, Germany, 2012; Volume 7198, pp. 19–26. ISBN 978-3-642-28492-2. [Google Scholar] [CrossRef]
- Shao, S.; Zhou, Q.; Liu, Z. A new assessment method of the pilot stress using ecg signals during complex special flight operation. IEEE Access 2019, 7, 185360–185368. [Google Scholar] [CrossRef]
- Mae, Y.; Yuki, R.; Kojima, M.; Arai, T. Extraction of Mental Stress Scene in Driving Car by Wearable Heart Rate Sensor. In Proceedings of the 2018 IEEE International Conference on Intelligence and Safety for Robotics (ISR), Shenyang, China, 24–27 August 2018; IEEE: Piscataway, NJ, USA, 2018; pp. 480–485. [Google Scholar] [CrossRef]
- Kofman, O.; Meiran, N.; Greenberg, E.; Balas, M.; Cohen, H. Enhanced performance on executive functions associated with examination stress: Evidence from task-switching and Stroop paradigms. Cogn. Emot. 2006, 20, 577–595. [Google Scholar] [CrossRef]
- Ghista, D.N. Cardiology Science and Technology; CRC Press: Boca Raton, FL, USA, 2016; ISBN 978-0-429-13720-4. [Google Scholar] [CrossRef]
- Jelinek, H.F.; Cornforth, D.J.; Khandoker, A.H. (Eds.) ECG Time Series Variability Analysis: Engineering and Medicine; CRC Press: Boca Raton, FL, USA, 2017; ISBN 978-1-315-37292-1. [Google Scholar] [CrossRef]
- Salcedo-Martínez, A.; Pérez-López, N.G.; Zamora-Justo, J.A.; Gálvez-Coyt, G.; Muñoz-Diosdado, A. The detrended fluctuation analysis of heartbeat intervals in time series during stress tests. In Proceedings of the 1st International Conference on Bioinformatics Biotechnology, and Biomedical Engineering (BIOMIC 2018), Yogyakarta, Indonesia, 19–20 October 2018. [Google Scholar] [CrossRef]
- Bu, N. A stress analysis method for heart rate data of mHealth devices using poincare plot and complex correlation measures. In Proceedings of the 2017 International Conference on Intelligent Informatics and Biomedical Sciences (ICIIBMS), Okinawa, Japan, 24–26 November 2017; IEEE: Piscataway, NJ, USA, 2017; pp. 87–91. [Google Scholar] [CrossRef]
- Saidatul, A.; Pandiyan, P.M.; Yaacob, S. The Assessment of Developed Mental Stress Elicitation Protocol Based on Heart Rate and EEG Signals. IJCTE 2015, 7, 207–213. [Google Scholar] [CrossRef]
- Airij, A.G.; Sudirman, R.; Sheikh, U.U. GSM and GPS based Real-Time Remote Physiological Signals Monitoring and Stress Levels Classification. In Proceedings of the 2018 2nd International Conference on BioSignal Analysis, Processing and Systems (ICBAPS), Kuching, Malaysia, 24–26 July 2018; pp. 130–135. [Google Scholar] [CrossRef]
- Arza, A.; Garzón-Rey, J.M.; Lázaro, J.; Gil, E.; Lopez-Anton, R.; de la Camara, C.; Laguna, P.; Bailon, R.; Aguiló, J. Measuring acute stress response through physiological signals: Towards a quantitative assessment of stress. Med. Biol. Eng. Comput. 2019, 57, 271–287. [Google Scholar] [CrossRef]
- Baek, H.J.; Cho, J. Novel heart rate variability index for wrist-worn wearables subject to motion artifacts that complicate measurement of continuous pulse interval. Physiol. Meas. 2019, 40, 105010. [Google Scholar] [CrossRef] [PubMed]
- Celka, P.; Charlton, P.H.; Farukh, B.; Chowienczyk, P.; Alastruey, J. Influence of mental stress on the pulse wave features of photoplethysmograms. Healthc. Technol. Lett. 2020, 7, 7–12. [Google Scholar] [CrossRef] [PubMed]
- Chatterjee, M.; Stratou, G.; Scherer, S.; Morency, L.-P. Context-based signal descriptors of heart-rate variability for anxiety assessment. In Proceedings of the 2014 IEEE International Conference on Acoustics, Speech and Signal Processing (ICASSP), Florence, Italy, 4–9 May 2014; IEEE: Piscataway, NJ, USA, 2014; pp. 3631–3635. [Google Scholar] [CrossRef]
- Chen, Y.; Zhang, L.; Zhang, B.; Zhan, C.A. Short-term HRV in young adults for momentary assessment of acute mental stress. Biomed. Signal Process. Control 2020, 57, 101746. [Google Scholar] [CrossRef]
- Correia, B.; Dias, N.; Costa, P.; Pêgo, J.M. Validation of a Wireless Bluetooth Photoplethysmography Sensor Used on the Earlobe for Monitoring Heart Rate Variability Features during a Stress-Inducing Mental Task in Healthy Individuals. Sensors 2020, 20, 3905. [Google Scholar] [CrossRef]
- Deschodt-Arsac, V.; Blons, E.; Gilfriche, P.; Spiluttini, B.; Arsac, L.M. Entropy in Heart Rate Dynamics Reflects How HRV-Biofeedback Training Improves Neurovisceral Complexity during Stress-Cognition Interactions. Entropy 2020, 22, 317. [Google Scholar] [CrossRef]
- Hirt, C.; Eckard, M.; Kunz, A. Stress generation and non-intrusive measurement in virtual environments using eye tracking. J. Ambient. Intell. Human. Comput. 2020, 11, 5977–5989. [Google Scholar] [CrossRef]
- Huerta-Franco, M.R.; Vargas-Luna, F.M.; Delgadillo-Holtfort, I. Effects of psychological stress test on the cardiac response of public safety workers: Alternative parameters to autonomic balance. J. Phys. Conf. Ser. 2015, 582, 012040. [Google Scholar] [CrossRef]
- Iqbal, T.; Redon-Lurbe, P.; Simpkin, A.J.; Elahi, A.; Ganly, S.; Wijns, W.; Shahzad, A. A Sensitivity Analysis of Biophysiological Responses of Stress for Wearable Sensors in Connected Health. IEEE Access 2021, 9, 93567–93579. [Google Scholar] [CrossRef]
- Jati, A.; Williams, P.G.; Baucom, B.; Georgiou, P. Towards Predicting Physiology from Speech During Stressful Conversations: Heart Rate and Respiratory Sinus Arrhythmia. In Proceedings of the 2018 IEEE International Conference on Acoustics, Speech and Signal Processing (ICASSP), Calgary, AB, Canada, 15–20 April 2018; IEEE: Piscataway, NJ, USA, 2018; pp. 4944–4948. [Google Scholar] [CrossRef]
- Jiménez, R.; Vera, J. Effect of examination stress on intraocular pressure in university students. Appl. Ergon. 2018, 67, 252–258. [Google Scholar] [CrossRef]
- Kelling, C.; Pitaro, D.; Rantala, J. Good vibes: The impact of haptic patterns on stress levels. In Proceedings of the 20th International Academic Mindtrek Conference, Tampere, Finland, 17–18 October 2016; ACM: New York, NY, USA, 2016; pp. 130–136. [Google Scholar]
- Kong, F.; Wen, W.; Liu, G.; Xiong, R.; Yang, X. Autonomic nervous pattern analysis of trait anxiety. Biomed. Signal Process. Control 2022, 71, 103129. [Google Scholar] [CrossRef]
- Kontaxis, S.; Orini, M.; Gil, E.; Posadas-de Miguel, M.; Luisa Bernal, M.; Aguiló, J.; de la Camara, C.; Laguna, P.; Bailón, R. Heart Rate Variability Analysis Guided by Respiration in Major Depressive Disorder. In Proceedings of the 2018 Computing in Cardiology Conference, Maastricht, The Netherlands, 23–26 September 2018. [Google Scholar] [CrossRef]
- Łysiak, A. Instantaneous Frequency of the EEG as a Stress Measure-A Preliminary Research. In Control, Computer Engineering and Neuroscience; Advances in Intelligent Systems and Computing; Paszkiel, S., Ed.; Springer International Publishing: Cham, Switzerland, 2021; Volume 1362, pp. 107–118. ISBN 978-3-030-72253-1. [Google Scholar] [CrossRef]
- Meina, M.; Ratajczak, E.; Sadowska, M.; Rykaczewski, K.; Dreszer, J.; Bałaj, B.; Biedugnis, S.; Węgrzyński, W.; Krasuski, A. Heart Rate Variability and Accelerometry as Classification Tools for Monitoring Perceived Stress Levels—A Pilot Study on Firefighters. Sensors 2020, 20, 2834. [Google Scholar] [CrossRef] [PubMed]
- Miranda, D.; Calderón, M.; Favela, J. Anxiety detection using wearable monitoring. In Proceedings of the 5th Mexican Conference on Human-Computer Interaction-MexIHC ’14, Oaxaca, Mexico, 3–5 November 2014; ACM Press: New York, NY, USA, 2014; pp. 34–41. [Google Scholar] [CrossRef]
- Selzler, R.; Smith, A.; Charih, F.; Boyle, A.; Holly, J.; Bridgewater, C.; Besemann, M.; Curran, D.; Chan, A.D.C.; Green, J.R. Exploratory Analysis of Ultra-Short-Term Heart Rate Variability Features in Virtual Rehabilitation Sessions. In Proceedings of the 2020 IEEE International Symposium on Medical Measurements and Applications (MeMeA), Bari, Italy, 1 June–1 July 2020; IEEE: Piscataway, NJ, USA, 2020; pp. 1–6. [Google Scholar] [CrossRef]
- Szakonyi, B.; Vassányi, I.; Schumacher, E.; Kósa, I. Efficient methods for acute stress detection using heart rate variability data from Ambient Assisted Living sensors. BioMed. Eng. OnLine 2021, 20, 73. [Google Scholar] [CrossRef] [PubMed]
- Wang, J.; Zhao, L.; Li, B. Heart Rate Variability Differences between Depression Patients with Different Severity and Healthy People. In Proceedings of the 2020 International Symposium on Artificial Intelligence in Medical Sciences, Beijing, China, 11–13 September 2020; ACM: New York, NY, USA; pp. 242–246. [Google Scholar] [CrossRef]
- Wang, X.; Liu, B.; Xie, L.; Yu, X.; Li, M.; Zhang, J. Cerebral and neural regulation of cardiovascular activity during mental stress. BioMed. Eng. OnLine 2016, 15, 160. [Google Scholar] [CrossRef] [PubMed]
- Heikoop, D.D.; de Winter, J.C.F.; van Arem, B.; Stanton, N.A. Effects of platooning on signal-detection performance, workload, and stress: A driving simulator study. Appl. Ergon. 2017, 60, 116–127. [Google Scholar] [CrossRef]
- Chen, C.; Li, C.; Tsai, C.-W.; Deng, X. Evaluation of Mental Stress and Heart Rate Variability Derived from Wrist-Based Photoplethysmography. In Proceedings of the 2019 IEEE Eurasia Conference on Biomedical Engineering, Healthcare and Sustainability (ECBIOS), Okinawa, Japan, 31 May–3 June 2019; IEEE: Piscataway, NJ, USA, 2019; pp. 65–68. [Google Scholar] [CrossRef]
- Shalom, J.G.; Israeli, H.; Markovitzky, O.; Lipsitz, J.D. Social anxiety and physiological arousal during computer mediated vs. face to face communication. Comput. Human. Behav. 2015, 44, 202–208. [Google Scholar] [CrossRef]
- Hammoud, S.; Karam, R.; Mourad, R.; Saad, I.; Kurdi, M. Stress and Heart Rate Variability during University Final Examination among Lebanese Students. Behav. Sci. 2018, 9, 3. [Google Scholar] [CrossRef]
- Anderson, R.; Jönsson, P.; Sandsten, M. Effects of Age, BMI, Anxiety and Stress on the Parameters of a Stochastic Model for Heart Rate Variability Including Respiratory Information. In Proceedings of the 11th International Joint Conference on Biomedical Engineering Systems and Technologies, Funchal, Portugal, 19–21 January 2018; SCITEPRESS-Science and Technology Publications: Setúbal, Portugal, 2018; pp. 17–25. [Google Scholar] [CrossRef]
- Brugnera, A.; Zarbo, C.; Adorni, R.; Tasca, G.A.; Rabboni, M.; Bondi, E.; Compare, A.; Sakatani, K. Cortical and cardiovascular responses to acute stressors and their relations with psychological distress. Int. J. Psychophysiol. 2017, 114, 38–46. [Google Scholar] [CrossRef]
- Chen, F.; Kong, L.; Zhao, Y.; Dong, L.; Liu, M.; Hui, M. Non-contact measurement of mental stress via heart rate variability. In Proceedings of the Applications of Digital Image Processing XLIII, Online, 24 August–4 September 2020; Tescher, A.G., Ebrahimi, T., Eds.; SPIE: Bellingham, WA, USA, 2020; p. 50. [Google Scholar] [CrossRef]
- Gomes, P.; Kaiseler, M.; Lopes, B.; Faria, S.; Queiros, C.; Coimbra, M. Are standard heart rate variability measures associated with the self-perception of stress of firefighters in action? In Proceedings of the 2013 35th Annual International Conference of the IEEE Engineering in Medicine and Biology Society (EMBC), Osaka, Japan, 3–7 July 2013; IEEE: Piscataway, NJ, USA, 2013; pp. 2571–2574. [Google Scholar] [CrossRef]
- Choi, J.; Gutierrez-Osuna, R. Estimating mental stress using a wearable cardio-respiratory sensor. In Proceedings of the 2010 IEEE Sensors, Kona, HI, USA, 1–4 November 2010; IEEE: Piscataway, NJ, USA, 2010; pp. 150–154. [Google Scholar] [CrossRef]
- Masood, K.; Ahmed, B.; Choi, J.; Gutierrez-Osuna, R. Consistency and Validity of Self-reporting Scores in Stress Measurement Surveys. In Proceedings of the 2012 Annual International Conference of the IEEE Engineering in Medicine and Biology Society, San Diego, CA, USA, 28 August–1 September 2012; IEEE: Piscataway, NJ, USA, 2012; pp. 4895–4898. [Google Scholar] [CrossRef]
- Nolan, K.; Bergin, S.; Mooney, A. An Insight Into the Relationship Between Confidence, Self-efficacy, Anxiety and Physiological Responses in a CS1 Exam-like Scenario. In Proceedings of the1st UK & Ireland Computing Education Research Conference on-UKICER, Canterbury, UK, 5–6 September 2019; ACM Press: New York, NY, USA, 2019; pp. 1–7. [Google Scholar] [CrossRef]
- Qu, Z.; Chen, J.; Li, B.; Tan, J.; Zhang, D.; Zhang, Y. Measurement of High-School Students’ Trait Math Anxiety Using Neurophysiological Recordings During Math Exam. IEEE Access 2020, 8, 57460–57471. [Google Scholar] [CrossRef]
- Unni, S.; Gowda, S.S.; Smeaton, A.F. An Investigation into Keystroke Dynamics and Heart Rate Variability as Indicators of Stress. In Proceedings of the MultiMedia Modeling, Phu Quoc, Vietnam, 6–10 June 2022; Lecture Notes in Computer Science. Springer International Publishing: Cham, Switzerland, 2022; pp. 379–391. [Google Scholar] [CrossRef]
- Castaldo, R.; Montesinos, L.; Melillo, P.; James, C.; Pecchia, L. Ultra-short term HRV features as surrogates of short term HRV: A case study on mental stress detection in real life. BMC Med. Inform. Decis. Mak. 2019, 19, 12. [Google Scholar] [CrossRef]
- Castaldo, R.; Montesinos, L.; Pecchia, L. Ultra-Short Entropy for Mental Stress Detection. In Proceedings of the World Congress on Medical Physics and Biomedical Engineering, Prague, Czech Republic, 3–8 June 2018; Lhotska, L., Sukupova, L., Lacković, I., Ibbott, G.S., Eds.; Springer: Singapore, 2019; pp. 287–291. [Google Scholar] [CrossRef]
- Rodrigues, S.; Dias, D.; Paiva, J.S.; Cunha, J.P.S. Psychophysiological Stress Assessment Among On-Duty Firefighters. In Proceedings of the 2018 40th Annual International Conference of the IEEE Engineering in Medicine and Biology Society (EMBC), Honolulu, HI, USA, 18–21 July 2018; IEEE: Piscataway, NJ, USA, 2018; pp. 4335–4338. [Google Scholar] [CrossRef]
- Pallauf, J.; Gomes, P.; Bras, S.; Cunha, J.P.S.; Coimbra, M. Associating ECG features with firefighter’s activities. In Proceedings of the 2011 Annual International Conference of the IEEE Engineering in Medicine and Biology Society, Boston, MA, USA, 30 August–3 September 2011; IEEE: Piscataway, NJ, USA, 2011; pp. 6009–6012. [Google Scholar] [CrossRef]
- Nagae, D.; Mase, A. Measurement of heart rate variability and stress evaluation by using microwave reflectometric vital signal sensing. Rev. Sci. Instrum. 2010, 81, 094301. [Google Scholar] [CrossRef]
- Woolson, R.F. Wilcoxon Signed-Rank Test. In Wiley Encyclopedia of Clinical Trials; John Wiley & Sons, Ltd.: Hoboken, NJ, USA, 2008; pp. 1–3. ISBN 978-0-471-46242-2. [Google Scholar] [CrossRef]
- Castaldo, R.; Montesinos, L.; Wan, S.; Serban, A.; Massaro, S.; Pecchia, L. Heart Rate Variability Analysis and Performance during a Repeated Mental Workload Task. In Proceedings of the EMBEC & NBC 2017: Joint Conference of the European Medical and Biological Engineering Conference (EMBEC) and the Nordic-Baltic Conference on Biomedical Engineering and Medical Physics (NBC), Tampere, Finland, 1–15 June 2017. [Google Scholar]
- Hernando, A.; Lazaro, J.; Gil, E.; Arza, A.; Garzon, J.M.; Lopez-Anton, R.; de la Camara, C.; Laguna, P.; Aguilo, J.; Bailon, R. Inclusion of Respiratory Frequency Information in Heart Rate Variability Analysis for Stress Assessment. IEEE J. Biomed. Health Inform. 2016, 20, 1016–1025. [Google Scholar] [CrossRef] [PubMed]
- Landreani, F.; Faini, A.; Martin-Yebra, A.; Morri, M.; Parati, G.; Caiani, E.G. Assessment of Ultra-Short Heart Variability Indices Derived by Smartphone Accelerometers for Stress Detection. Sensors 2019, 19, 3729. [Google Scholar] [CrossRef] [PubMed]
- Pereira, T.; Almeida, P.R.; Cunha, J.P.S.; Aguiar, A. Heart rate variability metrics for fine-grained stress level assessment. Comput. Methods Programs Biomed. 2017, 148, 71–80. [Google Scholar] [CrossRef] [PubMed]
- Pernice, R.; Javorka, M.; Krohova, J.; Czippelova, B.; Turianikova, Z.; Busacca, A.; Faes, L. Comparison of short-term heart rate variability indexes evaluated through electrocardiographic and continuous blood pressure monitoring. Med. Biol. Eng. Comput. 2019, 57, 1247–1263. [Google Scholar] [CrossRef]
- Taelman, J.; Vandeput, S.; Gligorijevic, I.; Spaepen, A.; Van Huffel, S. Time-frequency heart rate variability characteristics of young adults during physical, mental and combined stress in laboratory environment. In Proceedings of the 2011 Annual International Conference of the IEEE Engineering in Medicine and Biology Society, Boston, MA, USA, 30 August–3 September 2011; IEEE: Piscataway, NJ, USA, 2011; pp. 1973–1976. [Google Scholar] [CrossRef]
- Uyanık, G.K.; Güler, N. A Study on Multiple Linear Regression Analysis. Procedia-Social. Behav. Sci. 2013, 106, 234–240. [Google Scholar] [CrossRef]
- Park, J.; Kim, J.; Kim, S.-P. A Study on the Development of a Day-to-Day Mental Stress Monitoring System using Personal Physiological Data. In Proceedings of the 18th International Conference on Control, Automation and Systems (ICCAS), PyeongChang, Republic of Korea, 17–20 October 2018; IEEE: Piscataway, NJ, USA, 2018; pp. 900–903. [Google Scholar]
- Adha, M.S.; Igasaki, T. Concurrent Model for Three Negative Emotions Using Heart Rate Variability in a Driving Simulator Environment. In Proceedings of the 2020 42nd Annual International Conference of the IEEE Engineering in Medicine & Biology Society (EMBC), Montreal, QC, Canada, 20–24 July 2020; IEEE: Piscataway, NJ, USA, 2020; pp. 718–721. [Google Scholar] [CrossRef]
- Giakoumis, D.; Drosou, A.; Cipresso, P.; Tzovaras, D.; Hassapis, G.; Gaggioli, A.; Riva, G. Using Activity-Related Behavioural Features towards More Effective Automatic Stress Detection. PLoS ONE 2012, 7, e43571. [Google Scholar] [CrossRef]
- Brennan, M.; Palaniswami, M.; Kamen, P. Do existing measures of Poincare plot geometry reflect nonlinear features of heart rate variability? IEEE Trans. Biomed. Eng. 2001, 48, 1342–1347. [Google Scholar] [CrossRef]
- Rahman, S.; Habel, M.; Contrada, R.J. Poincaré plot indices as measures of sympathetic cardiac regulation: Responses to psychological stress and associations with pre-ejection period. Int. J. Psychophysiol. 2018, 133, 79–90. [Google Scholar] [CrossRef]
- Bu, N. Stress evaluation index based on Poincaré plot for wearable health devices. In Proceedings of the 2017 IEEE 19th International Conference on e-Health Networking, Applications and Services (Healthcom), Dalian, China, 12–15 October 2017; IEEE: Piscataway, NJ, USA, 2017; pp. 1–6. [Google Scholar] [CrossRef]
- Ishaque, S.; Rueda, A.; Nguyen, B.; Khan, N.; Krishnan, S. Physiological Signal Analysis and Classification of Stress from Virtual Reality Video Game. In Proceedings of the 2020 42nd Annual International Conference of the IEEE Engineering in Medicine & Biology Society (EMBC), Montreal, QC, Canada, 20–24 July 2020; IEEE: Piscataway, NJ, USA, 2020; pp. 867–870. [Google Scholar] [CrossRef]
- Scherz, W.D.; Ortega, J.A.; Madrid, N.M.; Seepold, R. Heart Rate Variability Indicating Stress Visualized by Correlations Plots. In Bioinformatics and Biomedical Engineering; Lecture Notes in Computer Science; Ortuño, F., Rojas, I., Eds.; Springer International Publishing: Cham, Switzerland, 2015; Volume 9044, pp. 710–719. ISBN 978-3-319-16479-3. [Google Scholar]
- Fuzzy Logic|Introduction. GeeksforGeeks. Available online: https://www.geeksforgeeks.org/fuzzy-logic-introduction/ (accessed on 25 August 2022).
- What is Fuzzy Logic?-Definition from SearchEnterpriseAI. Available online: https://www.techtarget.com/searchenterpriseai/definition/fuzzy-logic (accessed on 24 August 2022).
- Zalabarria, U.; Irigoyen, E.; Martínez, R.; Salazar-Ramirez, A. Detection of Stress Level and Phases by Advanced Physiological Signal Processing Based on Fuzzy Logic. In Proceedings of the International Joint Conference SOCO’16-CISIS’16-ICEUTE’16, San Sebastián, Spain, 19–21 October 2016; Advances in Intelligent Systems and Computing. Graña, M., López-Guede, J.M., Etxaniz, O., Herrero, Á., Quintián, H., Corchado, E., Eds.; Springer International Publishing: Cham, Switzerland, 2017; Volume 527, pp. 301–312, ISBN 978-3-319-47363-5. [Google Scholar] [CrossRef]
- Salazar-Ramirez, A.; Irigoyen, E.; Martinez, R. Enhancements for a Robust Fuzzy Detection of Stress. In Proceedings of the International Joint Conference SOCO’14-CISIS’14-ICEUTE’14, Bilbao, Spain, 25–27 June 2014; Advances in Intelligent Systems and Computing. de la Puerta, J.G., Ferreira, I.G., Bringas, P.G., Klett, F., Abraham, A., de Carvalho, A.C.P.L.F., Herrero, Á., Baruque, B., Quintián, H., Corchado, E., Eds.; Springer International Publishing: Cham, Switzerland, 2014; Volume 299, pp. 229–238, ISBN 978-3-319-07994-3. [Google Scholar] [CrossRef]
- Sul, A.; Shin, J.; Lee, C.; Yoon, Y.; Principe, J. Evaluation of stress reactivity and recovery using biosignals and fuzzy theory. In Proceedings of the Second Joint 24th Annual Conference and the Annual Fall Meeting of the Biomedical Engineering Society] [Engineering in Medicine and Biology, Houston, TX, USA, 23–26 October 2002; IEEE: Piscataway, NJ, USA, 2002; Volume 1, pp. 32–33. [Google Scholar] [CrossRef]
- Kumar, M.; Neubert, S.; Behrendt, S.; Rieger, A.; Weippert, M.; Stoll, N.; Thurow, K.; Stoll, R. Stress Monitoring Based on Stochastic Fuzzy Analysis of Heartbeat Intervals. IEEE Trans. Fuzzy Syst. 2012, 20, 746–759. [Google Scholar] [CrossRef]
- Chen, C.-C.; Lin, S.-C.; Young, M.-S.; Yang, C.-L. Quantifying the Accumulated Stress Level Using a Point-of-care Test Device. Biomed. Eng. Appl. Basis Commun. 2014, 26, 1450053. [Google Scholar] [CrossRef]
- Bryce, R.M.; Sprague, K.B. Revisiting detrended fluctuation analysis. Sci. Rep. 2012, 2, 315. [Google Scholar] [CrossRef] [PubMed]
- Hardstone, R.; Poil, S.-S.; Schiavone, G.; Jansen, R.; Nikulin, V.; Mansvelder, H.; Linkenkaer-Hansen, K. Detrended Fluctuation Analysis: A Scale-Free View on Neuronal Oscillations. Front. Physiol. 2012, 3, 450. [Google Scholar] [CrossRef] [PubMed]
- Kantelhardt, J.W.; Koscielny-Bunde, E.; Rego, H.H.A.; Havlin, S.; Bunde, A. Detecting long-range correlations with detrended fluctuation analysis. Phys. A Stat. Mech. Its Appl. 2001, 295, 441–454. [Google Scholar] [CrossRef]
- Kantelhardt, J.W.; Zschiegner, S.A.; Koscielny-Bunde, E.; Havlin, S.; Bunde, A.; Stanley, H.E. Multifractal detrended fluctuation analysis of nonstationary time series. Phys. A Stat. Mech. Its Appl. 2002, 316, 87–114. [Google Scholar] [CrossRef]
- Rosner, B.; Grove, D. Use of the Mann–Whitney U-test for clustered data. Stat. Med. 1999, 18, 1387–1400. [Google Scholar] [CrossRef]
- Salahuddin, L.; Kim, D. Detection of Acute Stress by Heart Rate Variability Using a Prototype Mobile ECG Sensor. In Proceedings of the 2006 International Conference on Hybrid Information Technology-Vol 2, Cheju Island, Republic of Korea, 9–11 November 2006; IEEE: Piscataway, NJ, USA, 2006; Volume 2, pp. 453–459. [Google Scholar] [CrossRef]
- Brownlee, J. How to Create an ARIMA Model for Time Series Forecasting in Python. Machine Learning Mastery. Available online: https://machinelearningmastery.com/arima-for-time-series-forecasting-with-python/ (accessed on 27 August 2022).
- Burr, R.L.; Cowan, M.J. Autoregressive spectral models of heart rate variability. Practical issues. J. Electrocardiol. 1992, 25, 224–233. [Google Scholar] [CrossRef]
- Takalo, R.; Hytti, H.; Ihalainen, H. Tutorial on univariate autoregressive spectral analysis. J. Clin. Monit. Comput. 2005, 19, 401–410. [Google Scholar] [CrossRef]
- Box, G.E.; Jenkins, G.M.; Reinsel, G.C. Time Series Analysis: Forecasting and Control, 4th ed.; Wiley: Hoboken, NJ, USA, 2008; ISBN 0-470-27284-8. [Google Scholar]
- Shao, S.; Zhou, Q.; Wang, Y.; Liu, Z. An ECG-Based Approach to Pilots’ Instantaneous High Stress. In Proceedings of the AHFE 2018 International Conference on Physical Ergonomics & Human Factors, Orlando, FL, USA, 21–25 July 2018; Springer International Publishing: Cham, Switzerland, 2019; pp. 468–475. [Google Scholar]
- Sarkar, S.; Dutta, P.; Chandra, A.; Dey, A. Study the Effect of Cognitive Stress on HRV Signal Using 3D Phase Space Plot in Spherical Coordinate System. In Computational Advancement in Communication Circuits and Systems; Lecture Notes in Electrical Engineering; Maharatna, K., Kanjilal, M.R., Konar, S.C., Nandi, S., Das, K., Eds.; Springer: Singapore, 2020; Volume 575, pp. 227–237. ISBN 9789811386862. [Google Scholar] [CrossRef]
- Hooker, E.D.; Campos, B.; Pressman, S.D. It just takes a text: Partner text messages can reduce cardiovascular responses to stress in females. Comput. Human. Behav. 2018, 84, 485–492. [Google Scholar] [CrossRef]
- Cubillos-Calvachi, J.; Piedrahita-Gonzalez, J.; Gutiérrez-Ardila, C.; Montenegro-Marín, C.; Gaona-García, P.; Burgos, D. Analysis of stress’s effects on cardiac dynamics: A case study on undergraduate students. Int. J. Med. Inform. 2020, 137, 104104. [Google Scholar] [CrossRef]
- Ribeiro, R.T.; Cunha, J.P.S. A regression approach based on separability maximization for modeling a continuous-valued stress index from electrocardiogram data. Biomed. Signal Process. Control 2018, 46, 33–45. [Google Scholar] [CrossRef]
- Varon, C.; Lazaro, J.; Sanz, A.H.; Caicedo, A.; Van Huffel, S.; Bailón, R. Removal of Respiratory Influences from Heart Rate During Emotional Stress. In Proceedings of the 2017 Computing in Cardiology Conference, Rennes, France, 24–27 September 2017. [Google Scholar] [CrossRef]
- Přibil, J.; Přibilová, A.; Frollo, I. First-Step PPG Signal Analysis for Evaluation of Stress Induced during Scanning in the Open-Air MRI Device. Sensors 2020, 20, 3532. [Google Scholar] [CrossRef] [PubMed]
- Pérez, C.; Pueyo, E.; Martínez, J.P.; Viik, J.; Laguna, P. Characterization of Impaired Ventricular Repolarization by Quantification of QT Delayed Response to Heart Rate Changes in Stress Test. In Proceedings of the 2020 Computing in Cardiology Conference, Rimini, Italy, 13–16 September 2020. [Google Scholar] [CrossRef]
- Sinha, A.; Das, P.; Gavas, R.; Chatterjee, D.; Saha, S.K. Physiological sensing based stress analysis during assessment. In Proceedings of the 2016 IEEE Frontiers in Education Conference (FIE), Erie, PA, USA, 12–15 October 2016; IEEE: Piscataway, NJ, USA, 2016; pp. 1–8. [Google Scholar] [CrossRef]
- Sufian, A.H.M.; Kamal, M.A.M. Stress Analysis Among University Students Using Psychometric Scale and Heart Rate Variability Approach. IOP Conf. Ser. Mater. Sci. Eng. 2021, 1051, 012013. [Google Scholar] [CrossRef]
- Zalabarria, U.; Irigoyen, E.; Martinez, R.; Larrea, M.; Salazar-Ramirez, A. A Low-Cost, Portable Solution for Stress and Relaxation Estimation Based on a Real-Time Fuzzy Algorithm. IEEE Access 2020, 8, 74118–74128. [Google Scholar] [CrossRef]
- Stress assessment by means of heart rate derived from functional near-infrared spectroscopy. J. Biomed. Opt. 2018, 23, 1. [CrossRef]
- Baumgartner, D.; Fischer, T.; Riedl, R.; Dreiseitl, S. Analysis of Heart Rate Variability (HRV) Feature Robustness for Measuring Technostress. In Information Systems and Neuroscience; Lecture Notes in Information Systems and Organisation; Davis, F.D., Riedl, R., vom Brocke, J., Léger, P.-M., Randolph, A.B., Eds.; Springer International Publishing: Cham, Switzerland, 2019; Volume 29, pp. 221–228. ISBN 978-3-030-01086-7. [Google Scholar] [CrossRef]
- Knorr, B.; Akay, M.; Mellman, A. Heart rate variability during sleep and the development of PTSD following traumatic injury. In Proceedings of the 25th Annual International Conference of the IEEE Engineering in Medicine and Biology Society (IEEE Cat. No.03CH37439), Cancun, Mexico, 17–21 September 2003; IEEE: Piscataway, NJ, USA, 2003; pp. 354–357. [Google Scholar] [CrossRef]
- Acharya, U.R.; Joseph, K.P.; Kannathal, N.; Lim, C.M.; Suri, J.S. Heart rate variability: A review. Med. Biol. Eng. Comput. 2006, 44, 1031–1051. [Google Scholar] [CrossRef]
- Munro, B.H. Statistical Methods for Health Care Research; Lippincott Williams & Wilkins: Philadelphia, PA, USA, 2005; ISBN 978-0-7817-4840-7. [Google Scholar]
- Hamilton, J.D. Time Series Analysis; Princeton University Press: Princeton, NJ, USA, 2020; ISBN 978-0-691-21863-2. [Google Scholar]
- Riffenburgh, R.H. Chapter 18-Sample Size Estimation and Meta-Analysis. In Statistics in Medicine, 3rd ed.; Academic Press: Cambridge, MA, USA, 2012; pp. 365–391. ISBN 978-0-12-384864-2. [Google Scholar] [CrossRef]

Disclaimer/Publisher’s Note: The statements, opinions and data contained in all publications are solely those of the individual author(s) and contributor(s) and not of MDPI and/or the editor(s). MDPI and/or the editor(s) disclaim responsibility for any injury to people or property resulting from any ideas, methods, instructions or products referred to in the content. |
© 2025 by the authors. Licensee MDPI, Basel, Switzerland. This article is an open access article distributed under the terms and conditions of the Creative Commons Attribution (CC BY) license (https://creativecommons.org/licenses/by/4.0/).
Share and Cite
Ziyadidegan, S.; Sadeghi, N.; Razavi, M.; Baharlouei, E.; Janfaza, V.; Kazeminasab, S.; Pesarakli, H.; Javid, A.H.; Sasangohar, F. Quantifying Mental Stress Using Cardiovascular Responses: A Scoping Review. Sensors 2025, 25, 4281. https://doi.org/10.3390/s25144281
Ziyadidegan S, Sadeghi N, Razavi M, Baharlouei E, Janfaza V, Kazeminasab S, Pesarakli H, Javid AH, Sasangohar F. Quantifying Mental Stress Using Cardiovascular Responses: A Scoping Review. Sensors. 2025; 25(14):4281. https://doi.org/10.3390/s25144281
Chicago/Turabian StyleZiyadidegan, Samira, Neda Sadeghi, Moein Razavi, Elaheh Baharlouei, Vahid Janfaza, Saber Kazeminasab, Homa Pesarakli, Amir Hossein Javid, and Farzan Sasangohar. 2025. "Quantifying Mental Stress Using Cardiovascular Responses: A Scoping Review" Sensors 25, no. 14: 4281. https://doi.org/10.3390/s25144281
APA StyleZiyadidegan, S., Sadeghi, N., Razavi, M., Baharlouei, E., Janfaza, V., Kazeminasab, S., Pesarakli, H., Javid, A. H., & Sasangohar, F. (2025). Quantifying Mental Stress Using Cardiovascular Responses: A Scoping Review. Sensors, 25(14), 4281. https://doi.org/10.3390/s25144281