Abstract
Microplastics in aqueous media can be detected through transient oxygen reduction from impacts with an electrified carbon-coated microwire. Each impact is recorded as a spike count in the time domain or as prominent peaks in the frequency domain. The spike count increased from approx. 60 s−1 (pure solution) to 90 s−1 (with microplastics) and 230 s−1 (microplastics in deoxygenated solutions), whereas the frequency domain revealed the presence of spikes in the 7, 21, and 24 Hz regions. The spike count showed a co-variance with the concentration of microparticles, with a linear detection range from 0.02% (w/v) to 0.04% (w/v). The electrochemical sensor, characterized by its simple and cost-effective design, may provide a rapid and user-friendly method for the detection of microplastics.
1. Introduction
Synthetic polymer materials such as plastics and their composites are the main ingredients in most industrial as well as consumer products being manufactured globally. Introduced as “Bakelite” in 1907, which was synthesized from a mixture of phenol and formaldehyde, this new class of materials was found to revolutionize the industry with their combined strength, light weight, corrosion resistance, and low cost [1,2]. Today, plastics are synthesized mainly from oil and gas, reaching production numbers as high as 390.7 million tons annually [3]. Such a quantity, combined with inadequate waste disposal routines, has created a significant pollution challenge affecting the global environment [4,5].
Plastics decompose by hydrolysis, as well as by photo-, thermal-, and thermo-oxidative degradation [6]. The photo-oxidative degradation of polymers, which frequently occurs on beaches or shorelines, is initiated by UV-B light and involves chemical processes such as chain scission and chain transfer, leading to the breakdown of polymer chains into smaller fragments [6]. The results are particles less than 5 mm in length called “microplastics” or “nanoplastics”, which may accumulate in soil, water, and the atmosphere for centuries before they are completely broken down into their base constituents [7]. Thus, health concerns are raised by the evidence of microplastics found in drinking water, with concentrations ranging from 1 × 10⁻² to over a million pieces/m3 [8,9]. When ingested and built up in the food chain, microplastics may pose a significant threat to human health as well as terrestrial and marine ecosystems [2,10,11] ranging from zooplankton to whales [12]. Further, the detection of microplastics in rainfall suggests that they have also become airborne, which may explain their presence in honey and beverages [13,14].
The effect of microplastics on living species is not known, but studies suggest that they may have an impact on gene expression, intestinal damage, and reproduction [15,16]. The impact is influenced by various parameters, such as the chemical composition, size, structure, and kind of polymer. For example, while polyethylene and polypropylene are less reactive, chemical additions in polymers like polyurethane and PVC have the potential to cause cancer or mutagenicity [17,18]. Because they can enter cells and tissues, smaller microplastics, especially nanoplastics, may pose a greater risk [19,20]. These have been shown to have the ability to penetrate intestinal membranes and accumulate in tissues, such as the human placenta [21], where they may lead to immunological reactions, oxidative stress, neurological impairments, reproductive issues, and transgenerational toxicity [16].
A study found that the microplastic ingestion rates in Neocalanus cristatus and Euphausia pacifica correlated with their dietary preferences and proximity to shore [22]. This trophic transfer allows microplastics to ascend the marine food chain. Microplastics were detected in 36.5% of the fish examined, with rayon and polyamide being the most prevalent types [23].
Similar to particulate air pollution, microplastics can induce oxidative stress, inflammation, and other adverse health effects [24]. Microplastics have the ability to spread throughout different tissues and enter the lymphatic and circulatory systems. There are serious health concerns regarding their potential to carry and release hazardous chemicals [25,26,27].
Most marine litter comes from land-based sources which are distributed through freshwater systems, and account for 80% of the plastic waste found in the oceans [6,28,29,30]. The origins of this plastic waste are listed in Table 1.

Table 1.
Different types of plastics that are commonly found in marine debris [6,18].
There are no current universal methods for identifying microplastics in water [9]. Most of the conventional detection is performed by Fourier Transform Infrared (FTIR) spectroscopy [31], which depends on the selective absorption of covalent bonds towards particular wavelengths. This results in changes in vibrational energy that are seen as transmittance patterns in the FTIR spectrum [32]. Another conventional method is Raman spectroscopy, which examines vibrational energy modes by using scattered light [33,34]. An overview of the various methods for detecting microplastics and their distinguishing features is presented in Table 2.
Beyond the conventional techniques, portable devices based on a CCD camera have been made to detect PET and LDPE polymers based on the evaluation of their curved shapes [35]. Combined with Raman spectroscopy, concentrations as low as 0.015% (w/v) have been detected [36]. In another study, polymer composition was analyzed through heat stability or degradation studies [37], and surface plasmon resonance (SPR) was used as a stand-alone detection system, primed with estrogen-sensitive capturing probes to identify particles as small as 20 µm. A chromatographic analysis revealed that estrogen receptors (ERs) on the SPR sensor influenced microplastic elution times based on the surface charge. Distinct patterns on the SPR sensorgram indicated microplastic interactions with ERs, and the linear relationship between the bound microplastics and SPR response units enabled an accurate quantification [38].
Table 2.
Traditional techniques for detecting and analyzing microplastics [9].
Table 2.
Traditional techniques for detecting and analyzing microplastics [9].
| Method | Technique | Methodology | Particle Size | Advantages | Disadvantages |
|---|---|---|---|---|---|
| Visual | Microscopic counting [39] | Particle count, hemocytometer | ~µm | Quick ID if large MP cons | Composition unknown |
| Spectroscopic | FTIR [40] | IR radiation, molecular struct | 20–500 µm | Fast, reliable, non-destructive | Requires IR-reactive samples |
| Raman spectroscopy [41] | Laser-induced Raman shift | 1–20 µm | Min. water interference, fast | Fluorescence, impurities error | |
| SEM [42] | Surface images electron beam | ~µm | High-resolution images | Conductive coating | |
| Chromatographic | Thermal (Pyrolysis) [43] | Heat releases gases by GC-MS | >500 µm | Analyzes plastics/additives | Single particle per run |
| HPLC [42] | Molar mass via chromatography | >mg | High recovery rates | Limited to specific polymers | |
| Other Methods | Tagging method [44] | Fluorescence | ~µm | Cost-effective screening | Error from other particles |
Given this global threat of pollution, tracking plastics in terms of their micro- and nanoparticle constituents will be paramount, and one needs to develop portable solutions that can be used on site. Developing low-cost solutions would enable adaptation in the developing world, where plastic waste is a particular problem. Hence, the goal of this research is to develop a cost-effective (portable) electrochemical sensor system that can detect microplastics in water. This research expands upon the “impact concept” proposed by Shimizu et al. [45], which detects microplastics through current spikes generated by particle collisions with the electrode. However, this study introduces novel signal processing techniques, including the Fast Fourier Transform (FFT) of the Fast Amperometry (FAM) response, as an additional verification of impact events using larger sensor electrodes.
2. Methodology
2.1. Materials
The following materials were sourced from Sigma-Aldrich (St. Louis, MO, USA): NaCl (S3014), KCl (P5405), Na2SO3 (71988), and micro particles (10 µm) based on polystyrene (72986). The carbon paste (C2180626D6) was obtained from Sun Chemical (South Normanton, UK). The silver (841-7226) and copper wires (779-0729) were supplied by RS Components (Oslo, Norway). The screen-printed electrodes (ZP-HVC-SPEs) were obtained from Zimmer and Peacock (Tonsberg, Norway). The PET particles (Melinex 339) were obtained from Polymershapes (Charlotte, NC, USA) and subsequently ground down to approx. 1 mm in the laboratory. The 10 µm particles were delivered dispersed in an aqueous suspension containing trace amounts of surfactant to prevent particle agglomeration. No additional surfactants were added during the experiments.
2.2. Aqueous Test Solution
The test solution was made according to Shimizu et al. [45], in which 1.491 gm of KCl were dissolved in 1 L of DI water to yield a 20 mM solution, which was then kept at room temperature. The 10 µm large microplastic particles were added in the corresponding volume fractions of 0.01%, 0.02%, 0.03%, and 0.04% (w/v). To ensure a uniform suspension of microplastics in the solution, a magnetic stirrer was initially used for dispersion, while an ultrasonic bath was later employed to achieve better homogeneity.
2.3. Carbon Working Electrodes
The core principle of detection is that microplastic particles act as oxygen carriers, and when a particle collides with the electrode, the oxygen is reduced, generating a measurable signal according to the oxygen reduction reaction, ORR (Equation (1)):
When the working electrode (WE) is biased at the reduction potential of oxygen, the presence of dissolved oxygen produces a current response that scales with the electrode area. However, oxygen reduction signals arising from impacts with oxygen-carrying microplastics will manifest as comparably tiny variations superimposed on this signal (tens of picoamps to nanoamps). Resolving these events requires fine resolution, whereas accommodating for the dissolved oxygen (or any other signal) requires a high dynamic range. Resolution and dynamic range are opposing parameters in electronic design, resulting in a trade-off between the two. Scaling down the sensor’s working area will sufficiently shrink the unwanted background signals to a size where a low dynamic range is acceptable, and resolution is sufficient. Consequently, a commercial SPCE (ZP-HVC-SPE sensor) was modified by reducing the geometrical area of the WE from 3.8 mm2 to 1 mm2 [46]. This was supplemented with individual microwire carbon-coated electrodes with diameters down to 40 µm and a surface area down to 0.125 mm2.
In contrast to the microwire electrode from carbon fiber (7 µm diameter, 1 mm length) utilized by Shimizu et al. [45], the present study explored the feasibility of employing readily available and cost-effective materials (copper or silver wire—commonly used in eye physiology—coated with carbon paste), mitigating the need for expensive carbon microfiber (see Table 3). Figure 1 shows the schematic diagrams of (a) the ZP-HVC-SPE and (b) the microwire carbon WE used in this project.
Table 3.
Diameters of fabricated electrodes before and after carbon coating.
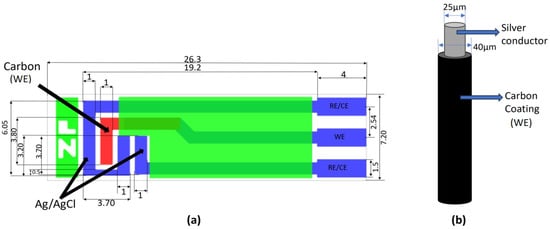
Figure 1.
(a) Schematic design with dimensions of ZP-HVC-SPE (in mm) [46], (b) microwire carbon-coated WE with conductive metal core.
2.4. Cyclic Voltammetry Analysis
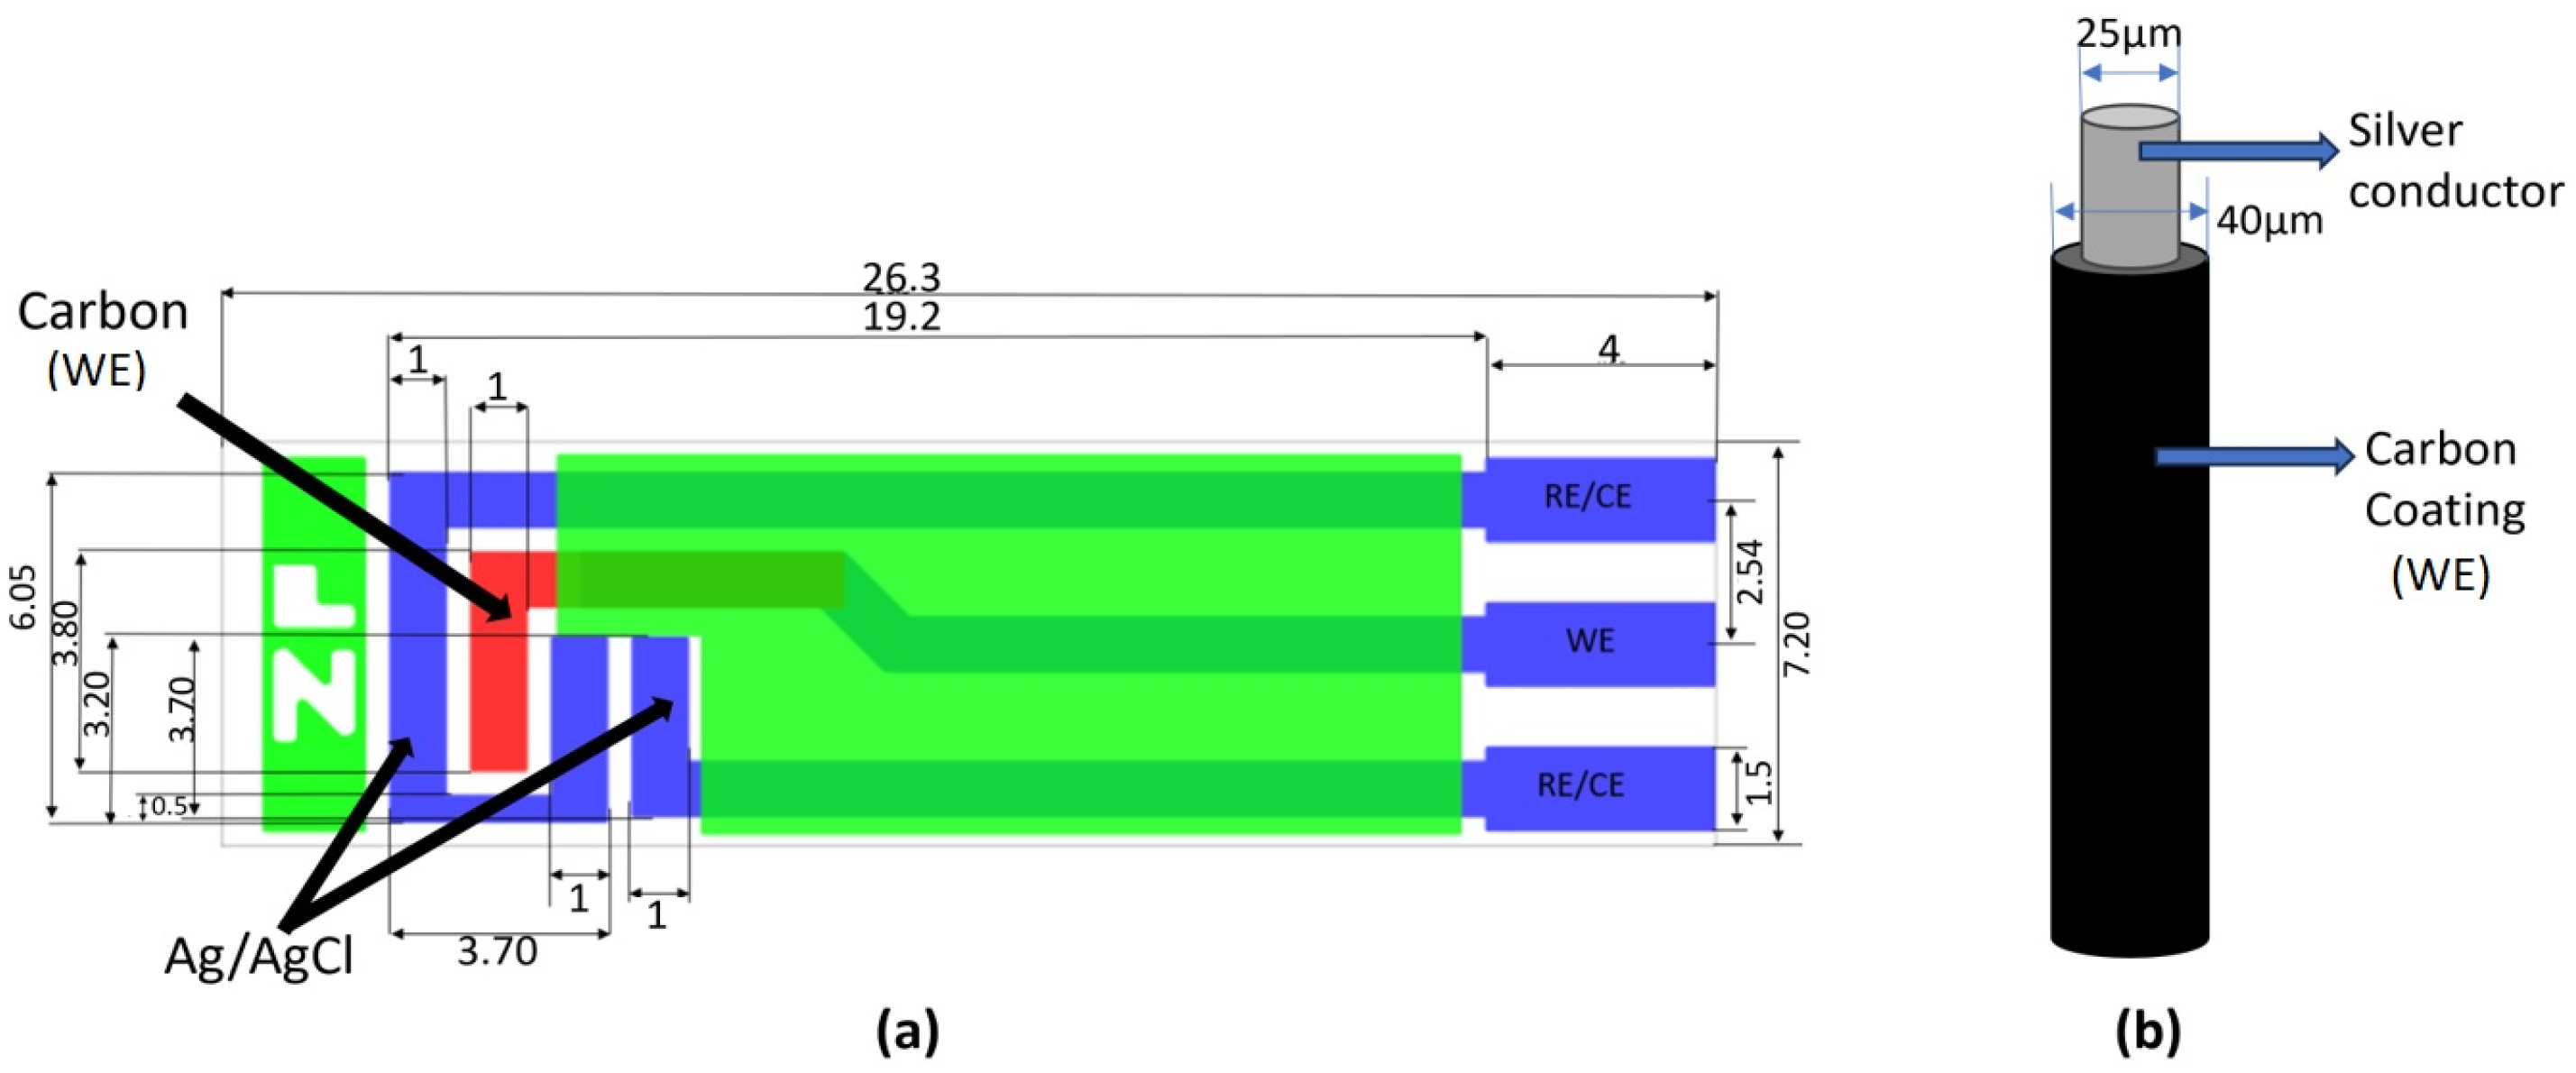
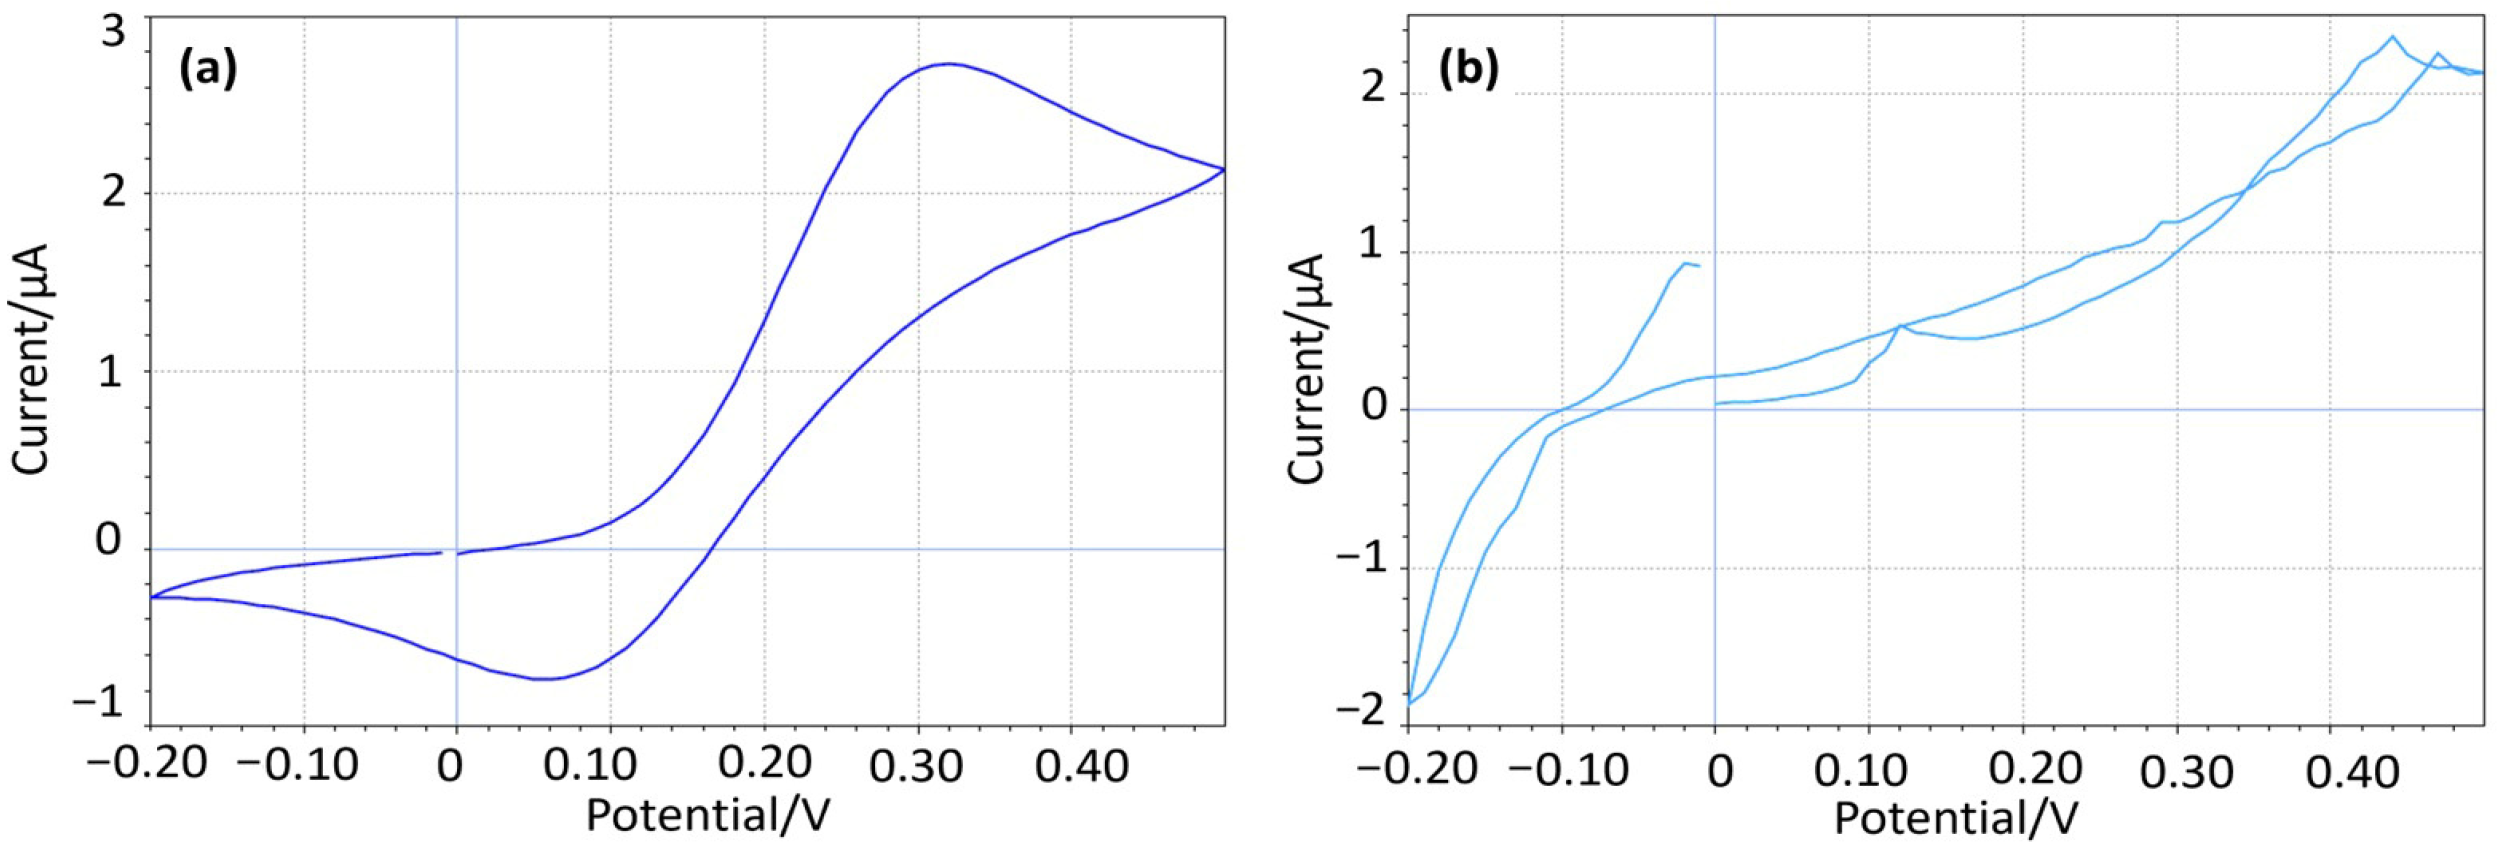
The integrity of the carbon coating was evaluated through cyclic voltammetry (CV) in a hexacyanoferrate solution characterized by the “duck-shaped” redox voltammogram. Any significant deviations, such as line intersects, suggested interference from the underlying metal substrate. Electrodes that failed to exhibit this expected “duck-shaped” response were discarded. Figure 2a shows the resultant cyclic voltammetry on an electrode with an intact carbon coating, while Figure 2b shows an equivalent curve from an electrode where the carbon coating has been compromised, permitting the exposed copper core to form oxide (Cu2O and CuO).

Figure 2.
(a) CV showing a perfect “duck-shaped” profile, (b) CV from a compromised coating.
The initial CV scans were conducted against the integrated Ag/AgCl/KCl (20 mM) reference electrode of the ZP-HPVC-SPE within a potential window of −0.2 V to 0.5 V to cover the redox peaks of the hexacyanoferrate.
2.5. Experimental Workflow
The microwire electrodes were fabricated by dip-coating the metal wire in carbon paste, which was baked in an oven at 100 °C for 40 min, yielding a 10–20 µm thick layer. The wire was then cooled to room temperature (RT) and validated using cyclic voltammetry (Section 2.4). The wire electrode was employed as the WE and used in combination with the ZP-HVC-SPE’s counter (CE) and Ag/AgCl pseudo-reference electrodes (REs). The WE was partially submerged (approx. 1 mm) in the 10 mL test solution (with the CE and RE fully immersed). The modified WE of the ZP-HVC-SPE (Section 2.3) was used for comparison. The microwire working electrodes were cleaned with DI water and dried with compressed air for reuse after each experiment. The ORR was run at −0.4 V to reduce the offset current magnitude seen at lower potentials.
Energy-dispersive X-ray spectroscopy (EDX), combined with scanning electron microscopy (SEM), was utilized to validate the different materials employed in the electrode fabrication. Both the material composition and the relative weight percentages (wt%s) of particular components were verified using an EDX analysis.
2.6. Impact Signal and Background Noise
Microplastic particles made from PET (1 mm in diameter) were applied for the feasibility study to permit real-time visual observation during the tests. Deoxygenated solutions made from Na2SO3 (0.1 mg/mL) were used as controls to remove the background signal from the dissolved oxygen. A statistical spike count and FFT analysis were performed in both the oxygenated and deoxygenated solutions.
2.7. Signal Processing and Data Analysis
The data analysis was performed using OriginPro 2023 [47] and the Julia programming language (Version 1.8.5) [48], employing statistical and Fast Fourier Transform (FFT) techniques. The Djuli library [49] was used for the data visualization and comparison.
2.8. Particle Counting
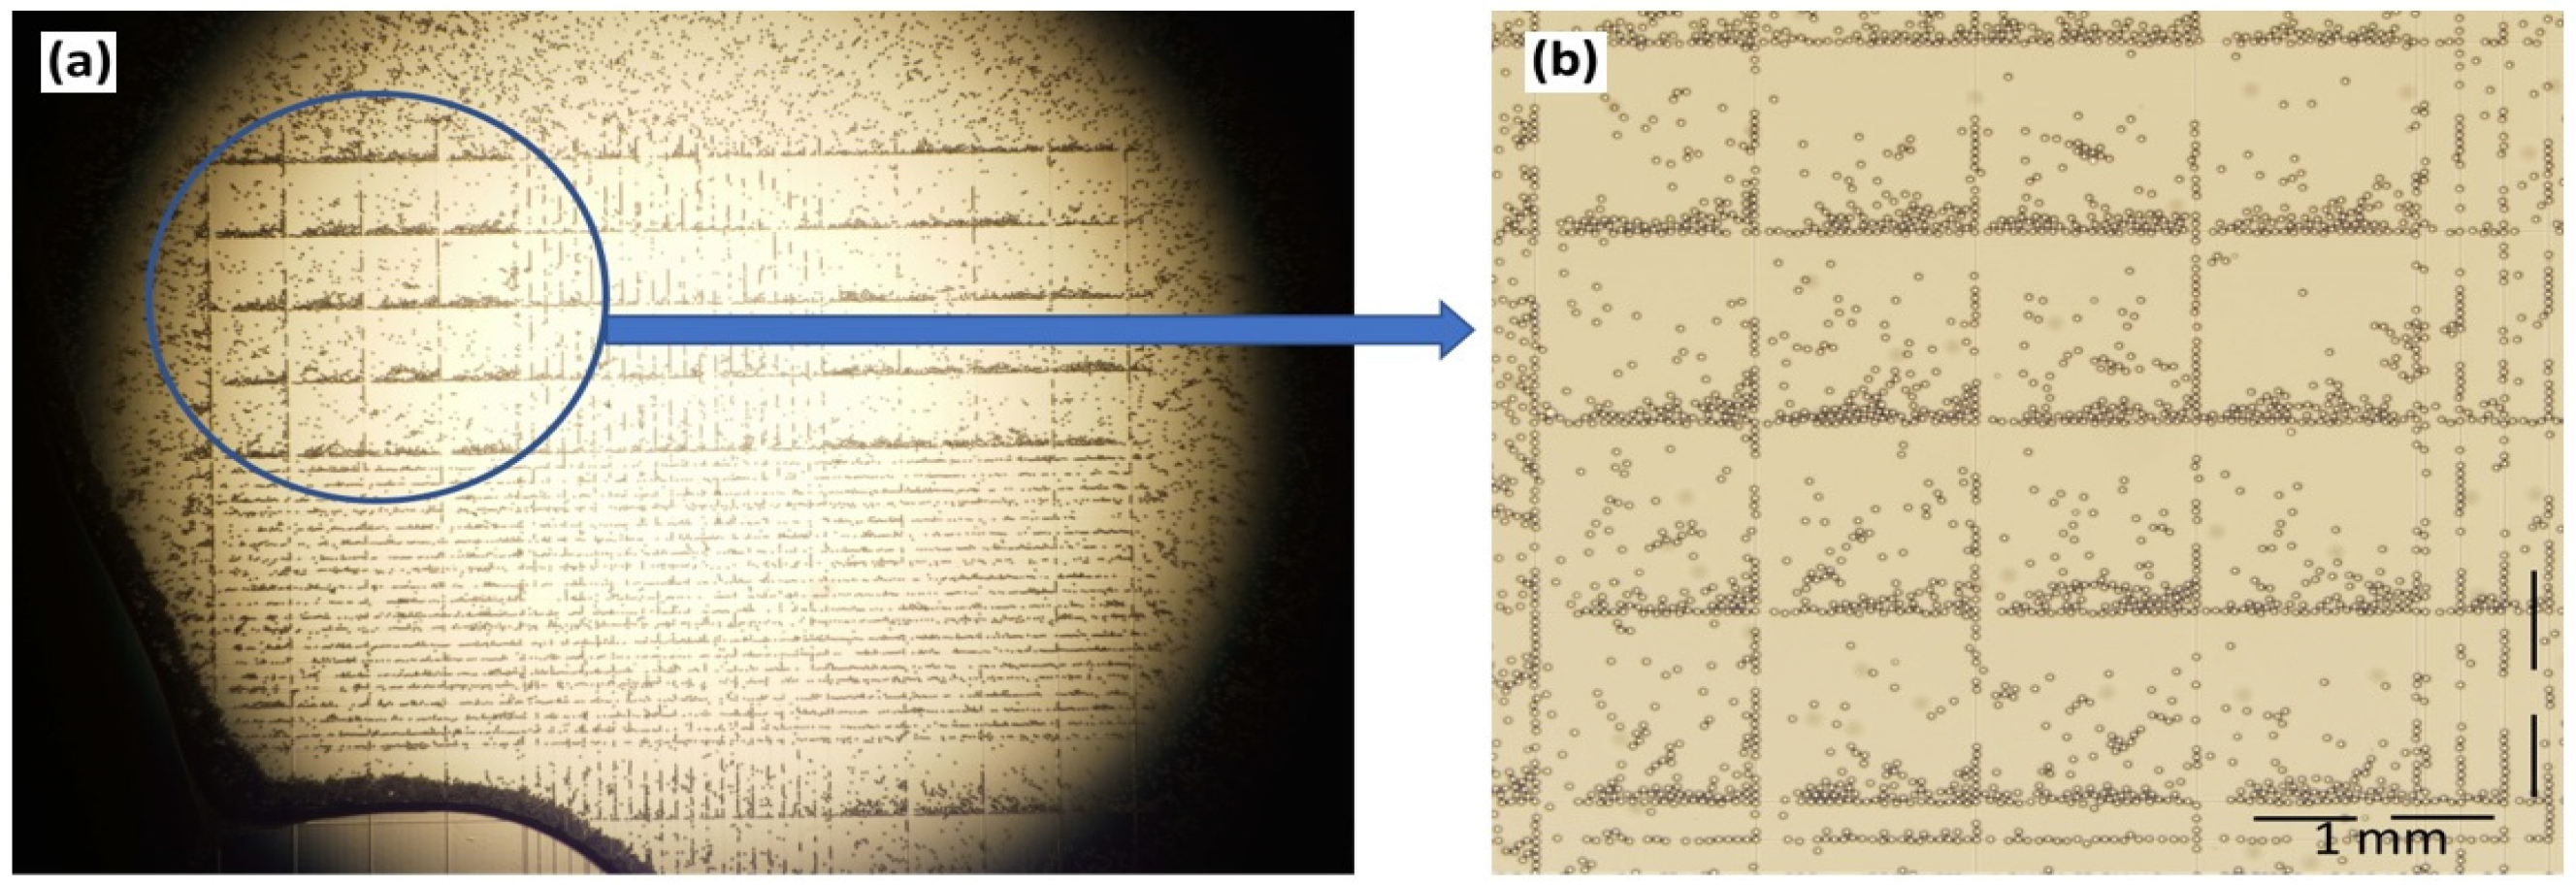
The concentration of microplastic particles is given in terms of the weight per volume, and a translation of this into absolute numbers was made using a hemocytometer (Figure 3). It works by diluting a 100 µL solution tenfold prior to counting. The particles were counted in blocks of four and then multiplied by four. The estimated particle count per volume increased proportionally with the microplastic concentration, and a 0.01% (w/v) solution corresponded to 1.64 × 10⁶ particles per mL.

Figure 3.
(a) Microplastic particles in a hemocytometer as seen under an optical microscope. (b) A close-up view of 16 blocks representing the statistical basis for counting.
3. Results
3.1. The WE Dimension
The ZP-HVC-SPE electrode exhibited a baseline current of 10 nA with a peak to peak noise of ±2.5 nA, rendering it difficult to directly observe the signals induced by the microplastic impacts. By reducing the electrode area, the baseline current was reduced to 2 nA with a peak to peak noise of ±0.25 nA, from which the current spikes due to the impact events could be extracted from the FAM signals and the FFT analysis of the frequency domain.
3.2. Comparative Analysis of Working Electrodes
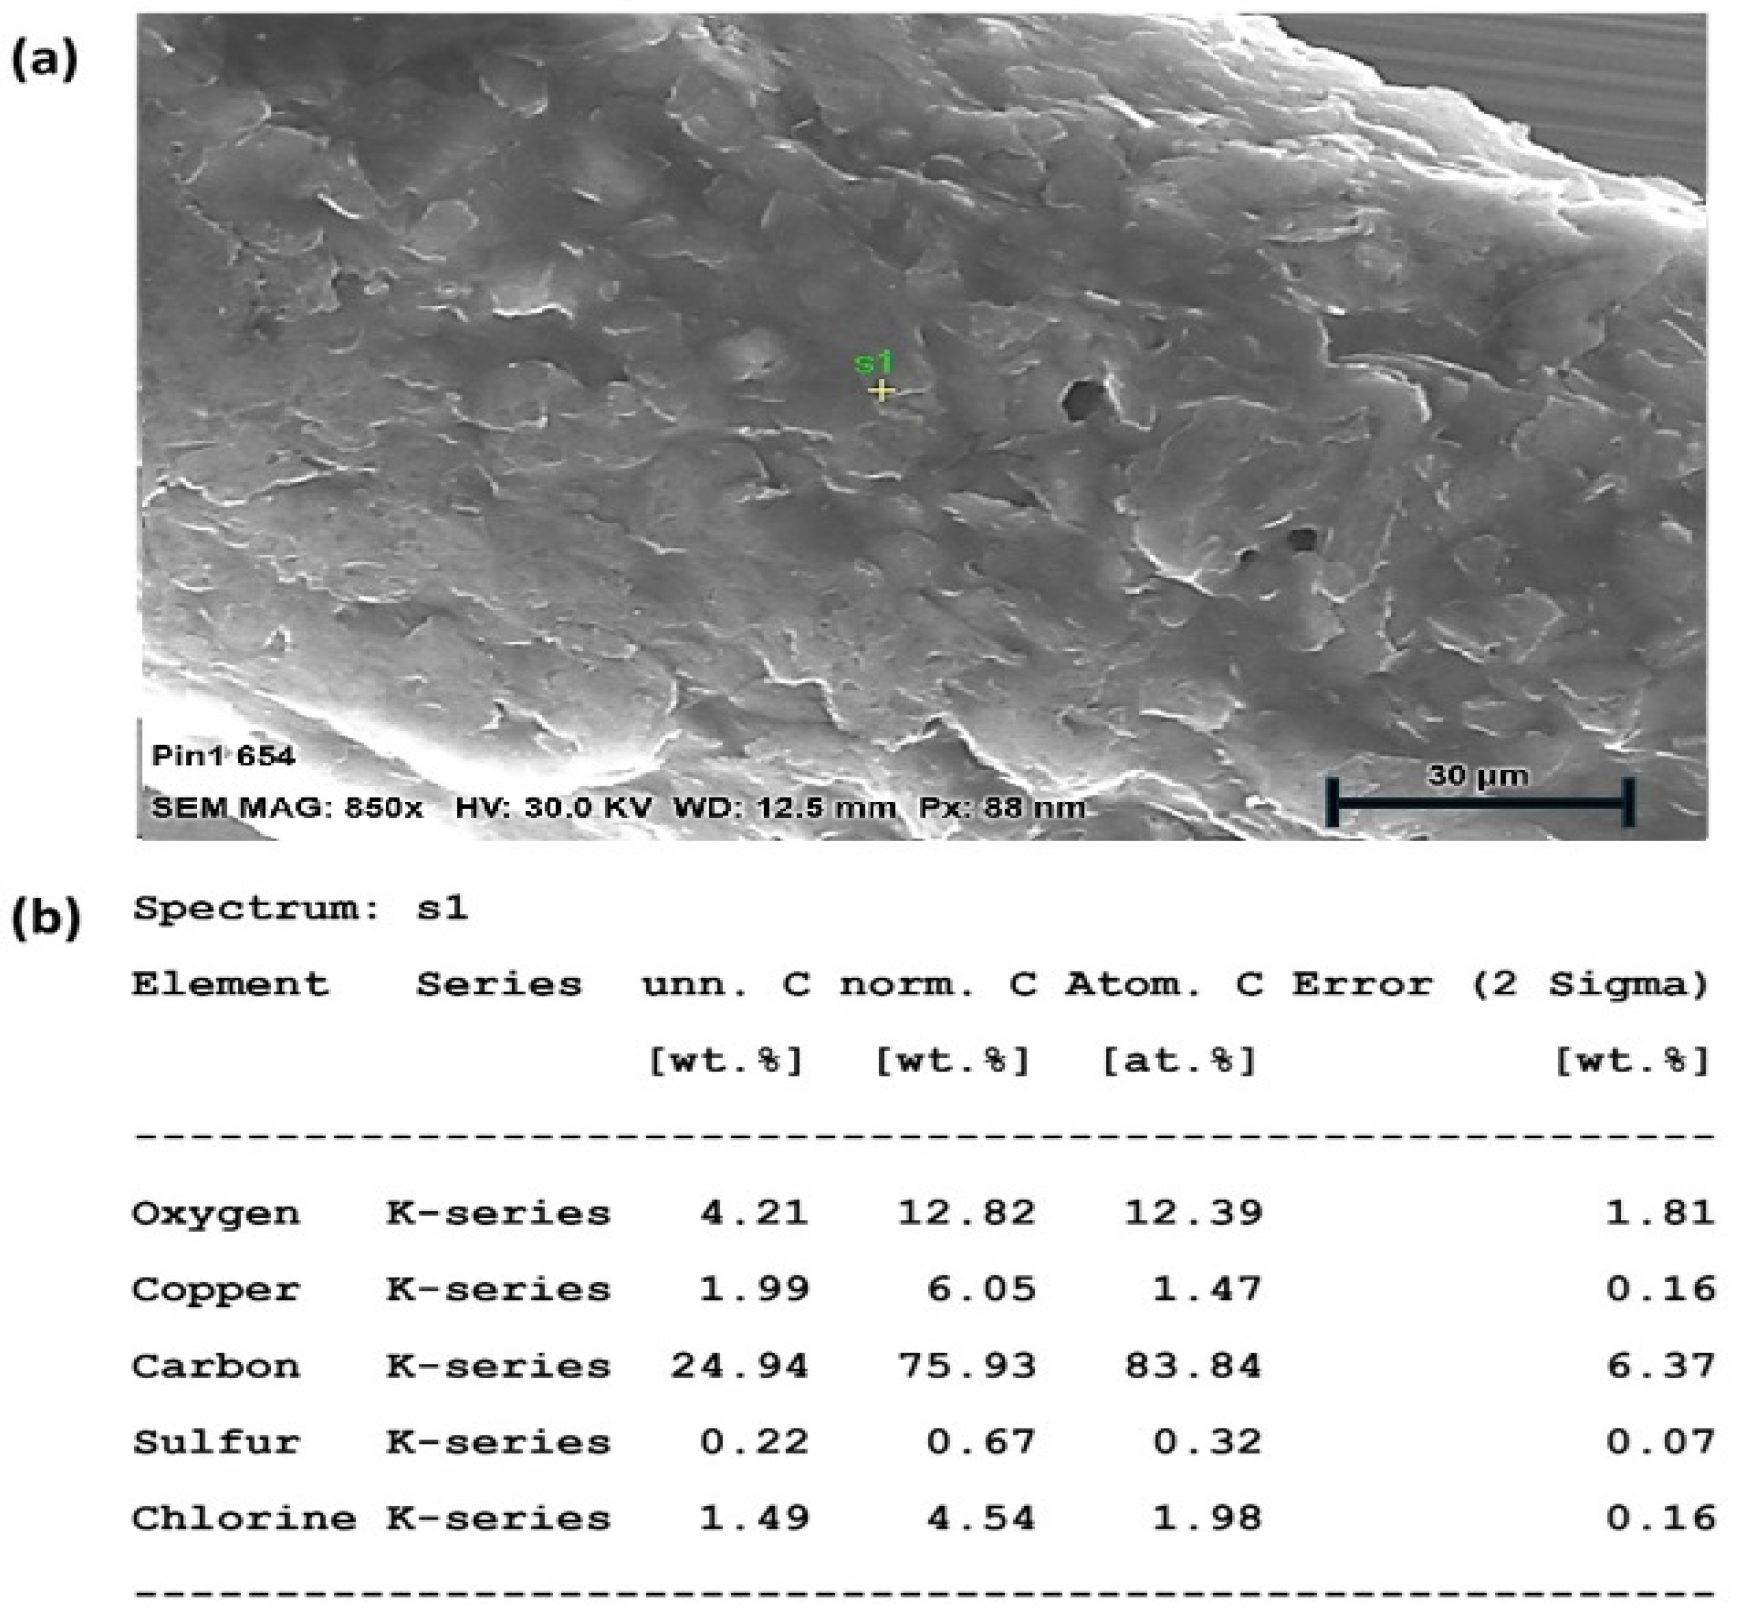
An SEM-EDX analysis was performed on all electrodes to confirm their material composition. The surface structure of a microwire electrode with carbon coating around a central copper conductor is shown in Figure 4. The EDX spectrum shows the presence of oxygen and carbon, which are the primary components of the carbon coating, with sulphur and chlorine as the residual components from the carbon paste and/or its solvent. The copper core is also visible, though less prominent than the carbon and oxygen, as it is buried deeper. The dimensions and material composition of the different microwire electrodes are shown in Table 3.

Figure 4.
(a) SEM-EDX analysis of WE composition with surface micrograph of carbon coating, (b) material data analysis.
The EDX spectrum was acquired from a single-point analysis. This approach was used to identify the elemental composition at a representative location; while full elemental mapping was not performed in this study, the single-point analysis served as a preliminary assessment to verify the elemental constituents relevant to the sample’s surface chemistry. Imperfections in the surface coating were instead investigated in the CV analysis (Section 2.4).
3.3. Impact Detection Verification
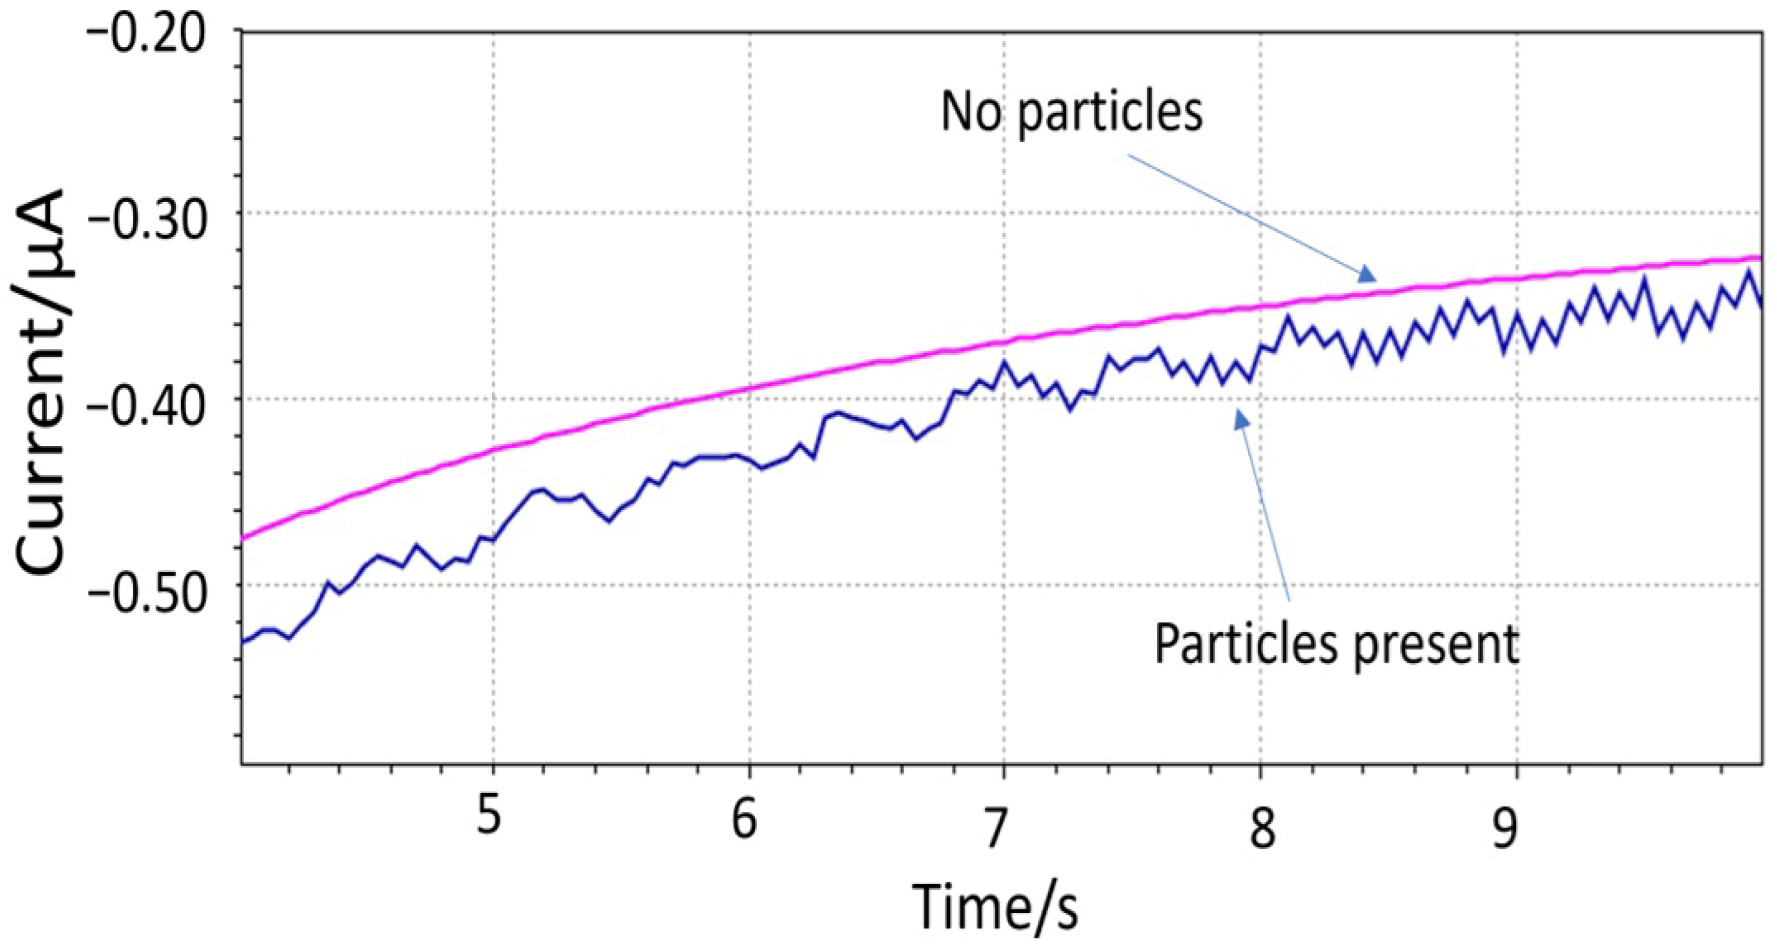
The hypothesis of the impact events was shown with the 150 µm diameter electrode (sample 2) immersed in a solution with 1 mm large PET particles (Figure 5). The PET particle concentration was estimated between 5.7 × 10⁵ and 2.8 × 10⁷ particles L−1. The presence of “spikes” was apparent from the noisier signal compared to the pure solution. The periodicity of the impact events is believed to be affected by the magnetic mixer. An ultrasound bath was later used for dispersing the 10 µm particles prior to the measurement. The Fast Amperometry analysis was carried out with a scan rate of 0.0005 s. The WE was biased at the lower cathodic end of where oxygen can be reduced (−0.4V vs. integrated Ag/AgCl/KCl (20 mM)) to minimize the contribution of the dissolved oxygen to the signal.
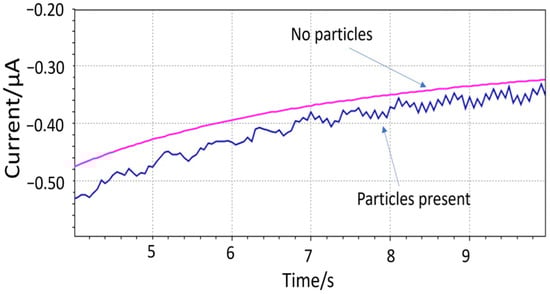
Figure 5.
Impact events detected by microfabricated electrodes using 1 mm PET particles.
3.4. Statistical Analysis of Spike Count
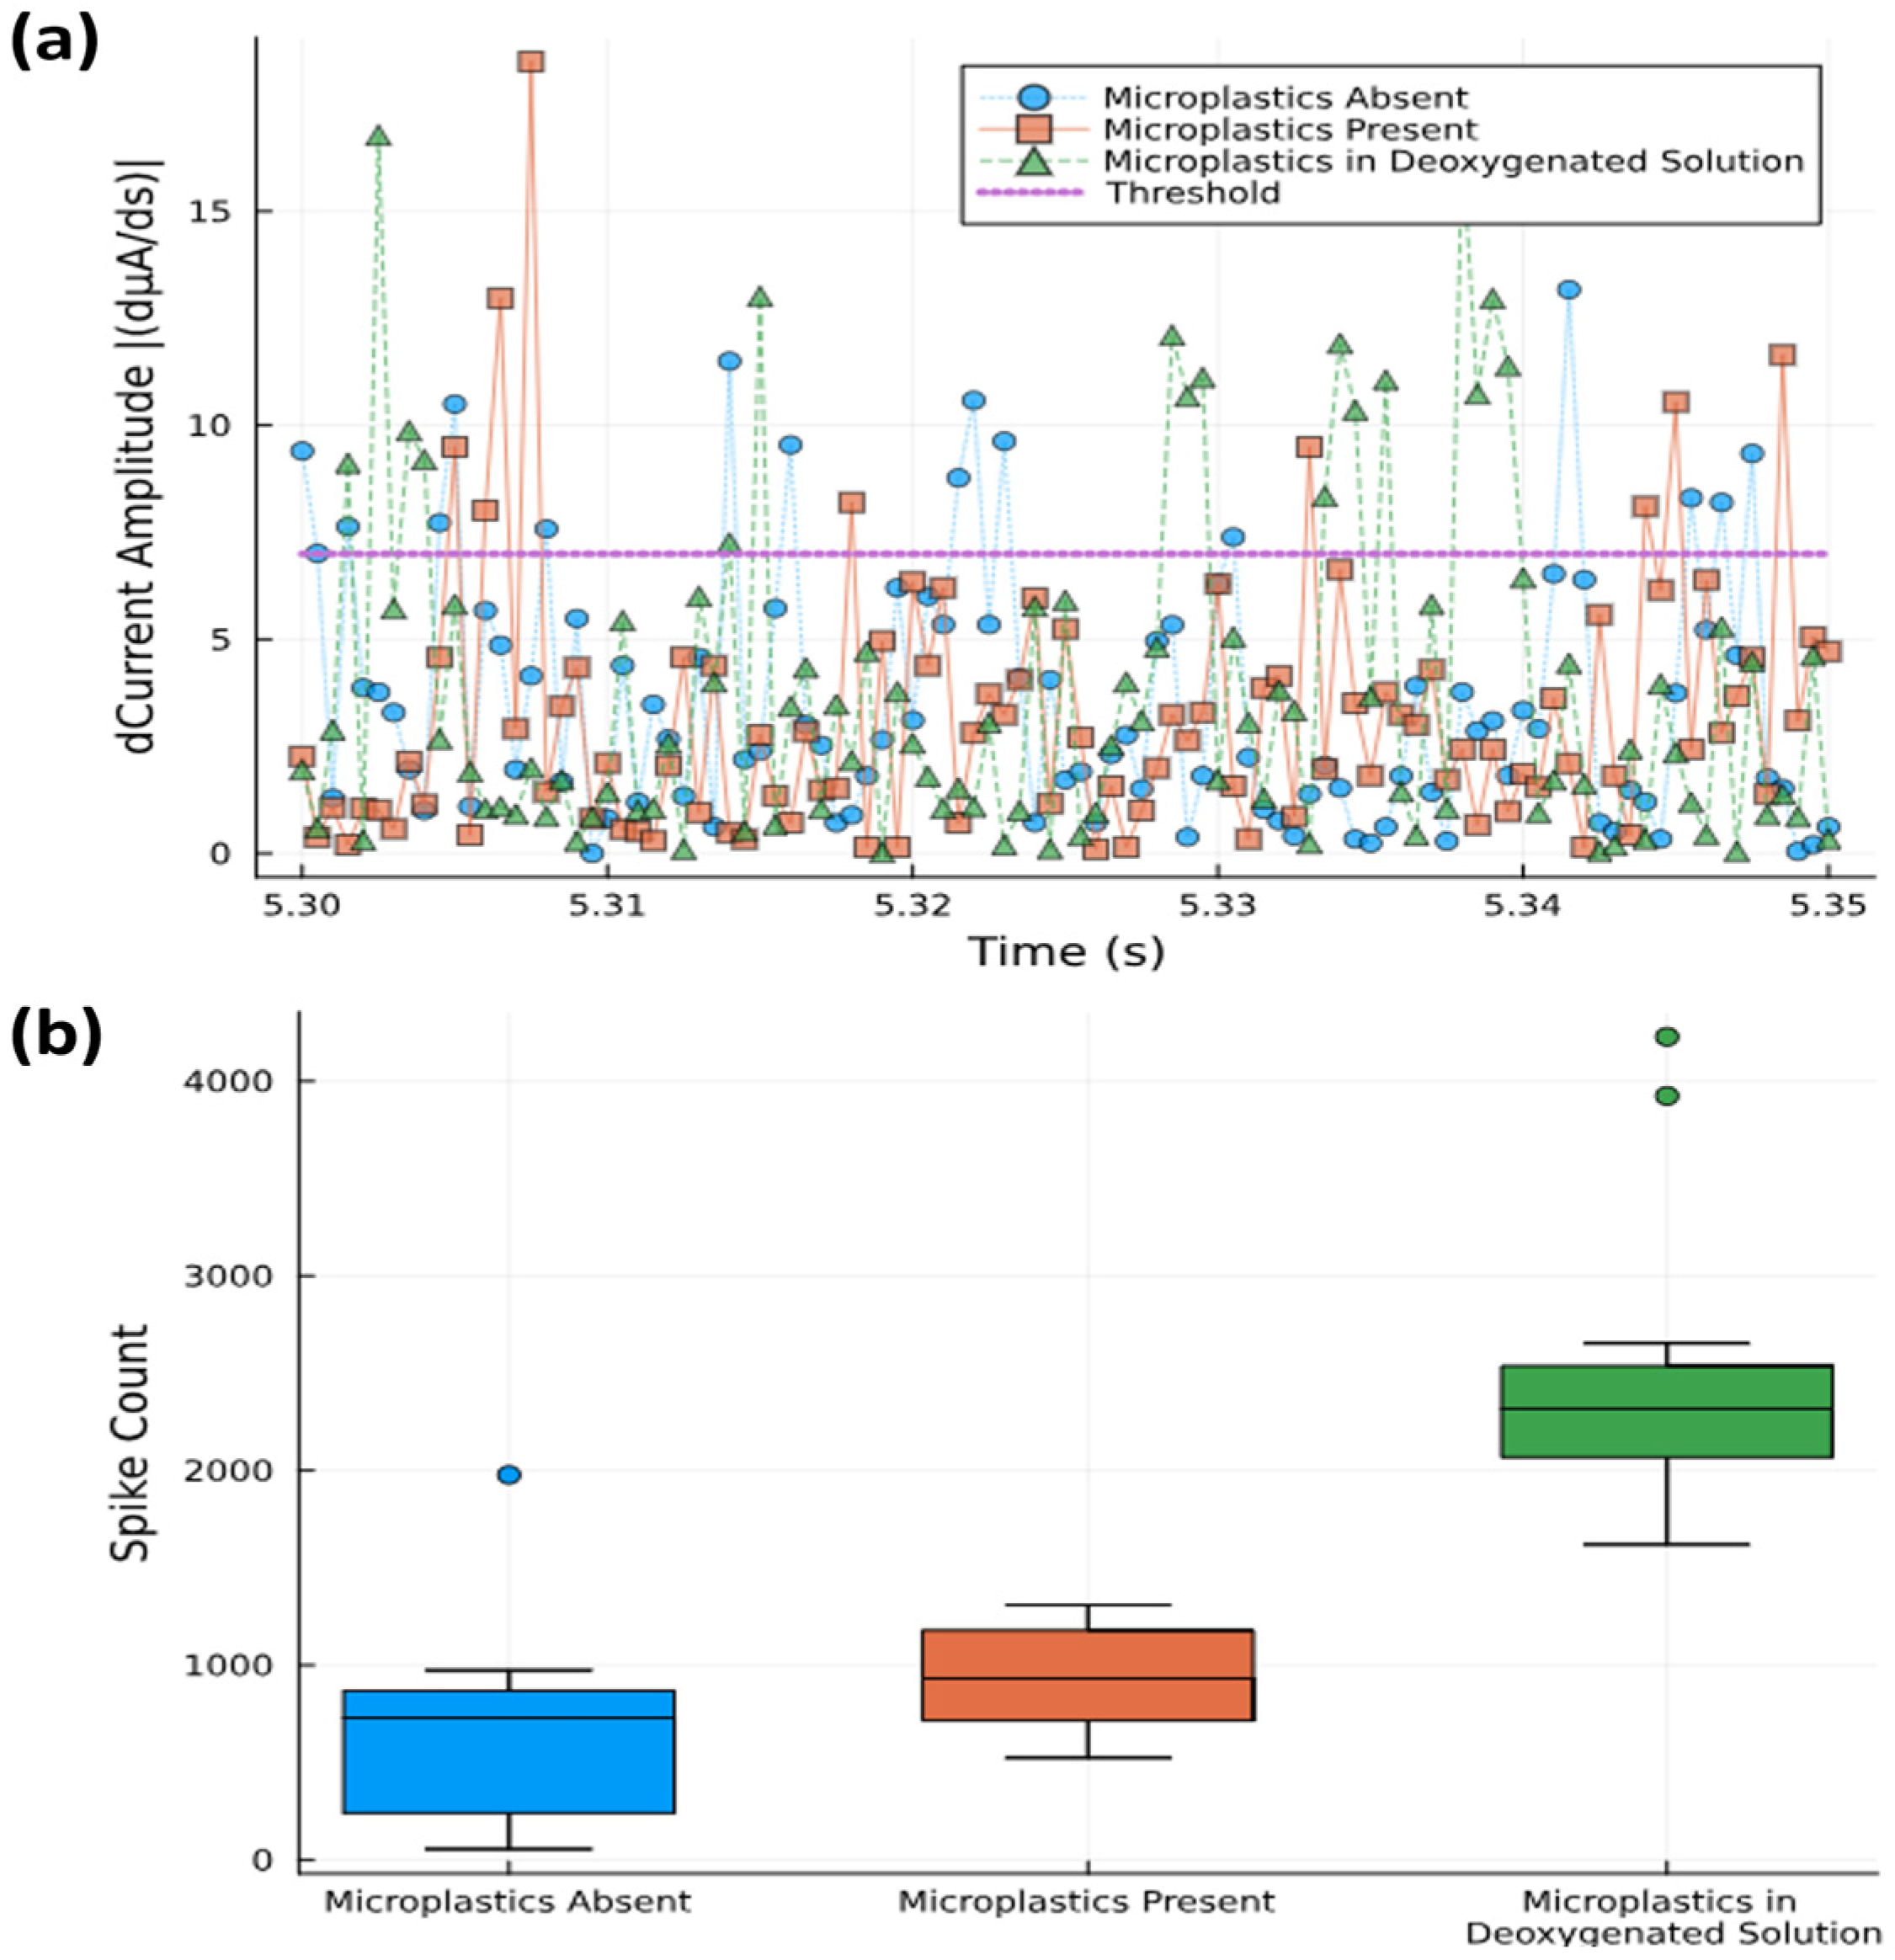
The FAM signals were recorded with a 40 μm diameter WE (sample 4) and analyzed over a 10 s time frame. The signals were time-differentiated to better distinguish fast variations within the signal concomitant with spikes (Figure 6a). The differentiation of data at 0.05 ms intervals shows spike magnitudes for three different solutions: (i) no microplastics (N = 20), (ii) with 0.02% (w/v) microplastics (N = 20), and (iii) a deoxygenated solution with 0.02% (w/v) microplastics (N = 20). The samples exceeding a threshold value were counted as spikes and statistically summarized using the Julia programming language.

Figure 6.
(a) Spike counts with threshold level of 7 dµA/ds separating out those that are counted from background noise (0.05 s time window shown). (b) Statistical box plot of spike counts above threshold level measured over 10 s time interval.
Box plots were used to show the total spike count within a 10 s time frame for the three different solutions used (Figure 6b). Although the mean values range from 60 counts s−1 (no microplastics) to 90 counts s−1 (with microplastics), the analysis suggests that spike counting alone does not fully differentiate between solutions with and without microplastics due to the overlapping confidence intervals. The aqueous media’s background oxygen may obscure the changes in the signal brought on by microplastics, and by removing this background through deoxygenation, the spike count was raised to 230 counts s−1. This shows that the use of oxygen scavengers to bind dissolved oxygen may not interact with oxygen bound to the microplastic particles themselves (and which is released upon contact with the electrode), thus effectively increasing the signal-to-noise ratio. Thus, although we can quantitatively see a difference between absence and presence, the spike count seems not to be sufficient for quantifying the microplastic concentrations in oxygenated solutions.
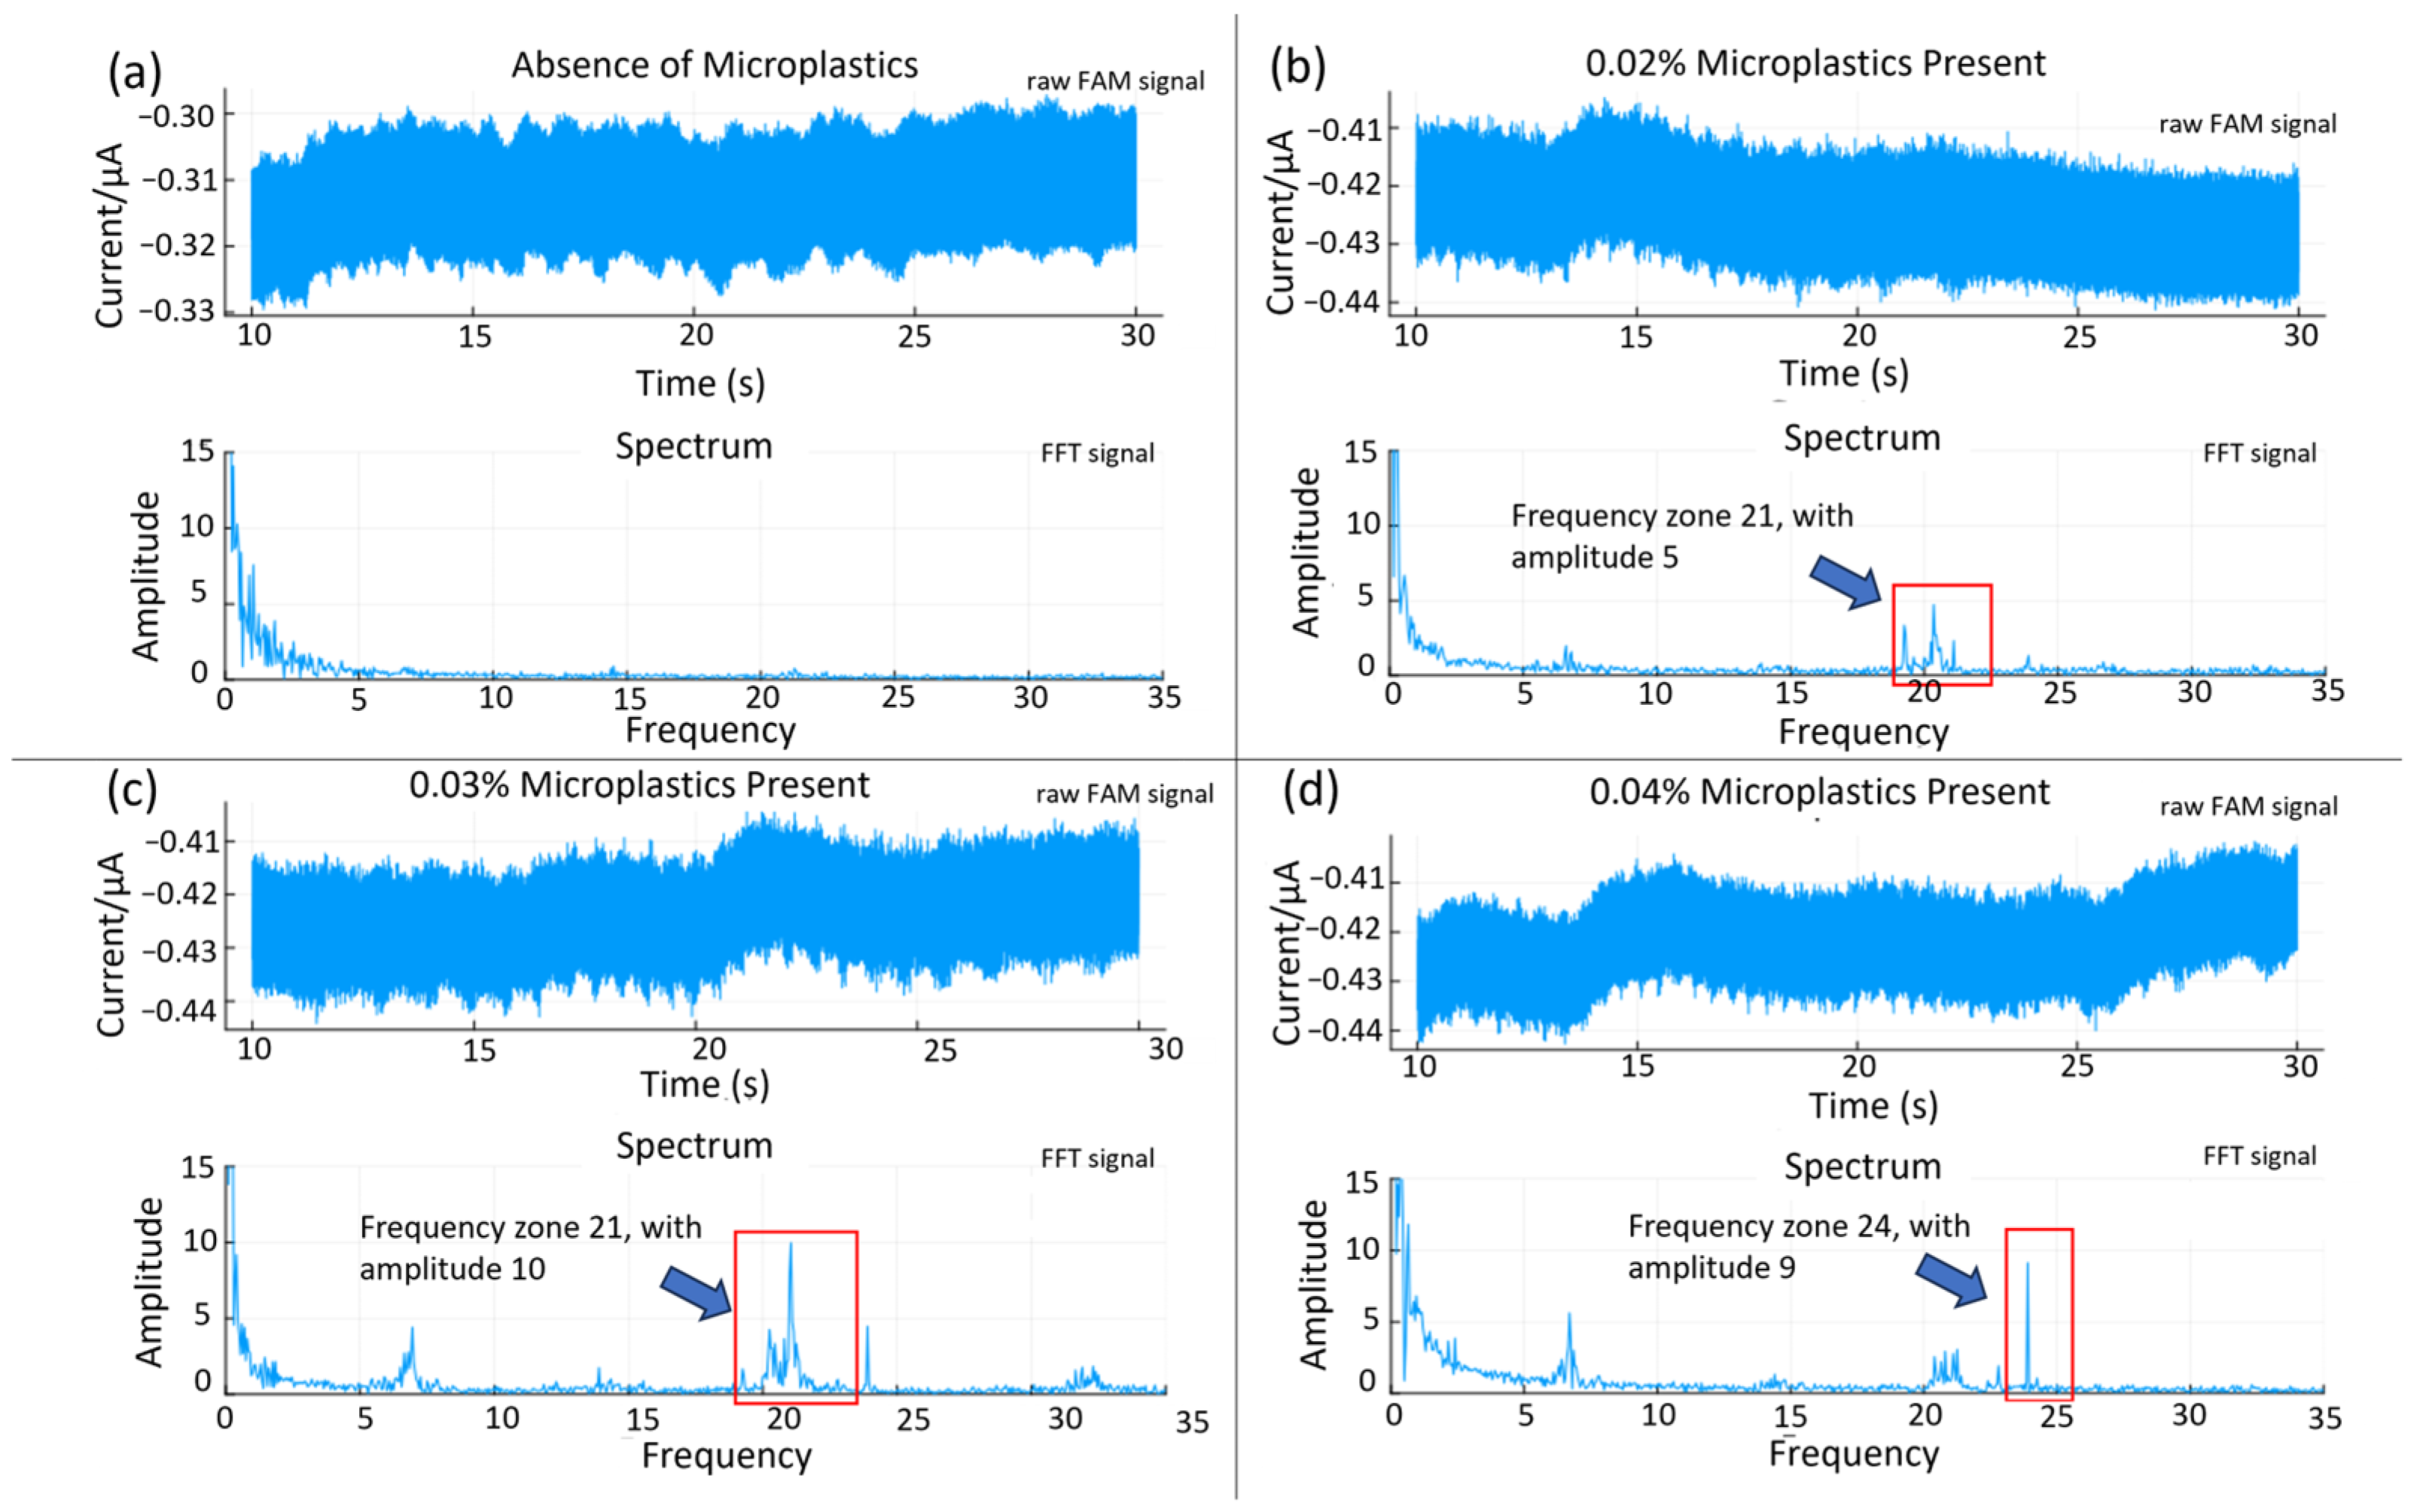
3.5. FFT Analysis of Resultant Signals
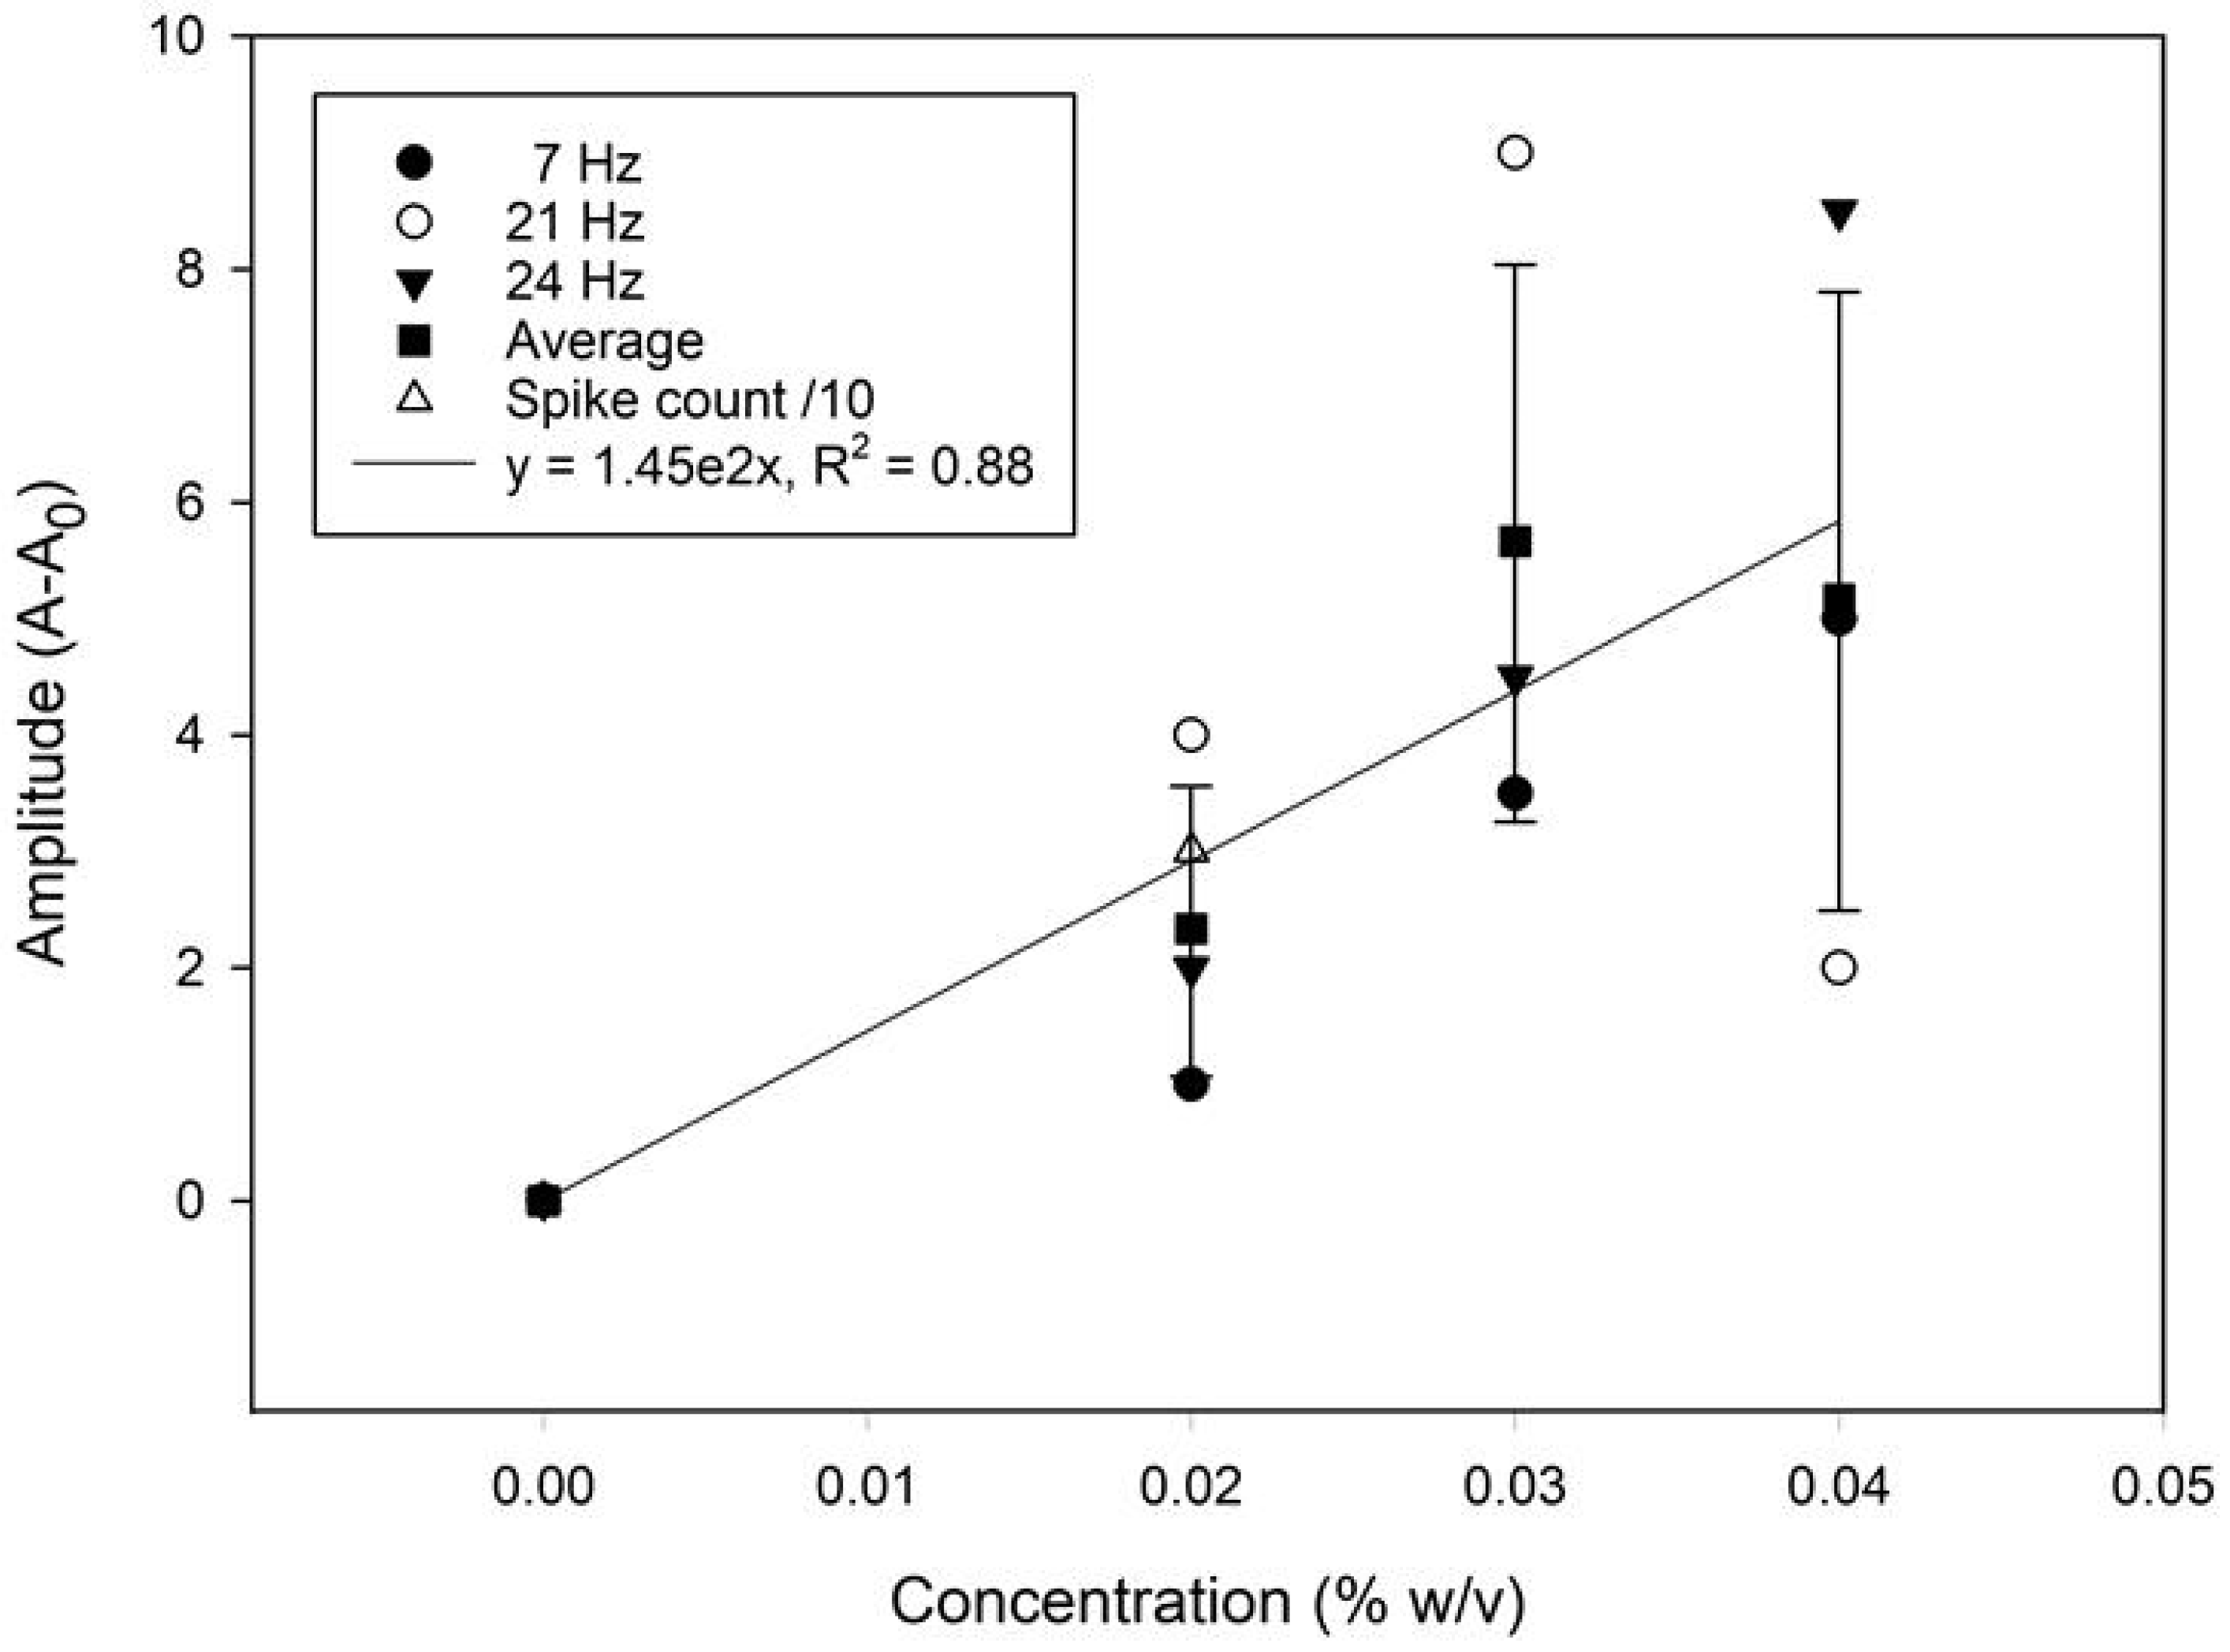
A frequency domain approach was attempted for assessing the quantitative potential of the sensor. The time and frequency domain responses for solutions containing different microplastics loading (0 to 0.04% (w/v)) are displayed in Figure 7. Both the amplitude and the frequency of the most prominent peak show a positive correlation with the concentration. A calibration graph based on the average amplitude shift (the relative signal strength derived from the FFT analysis) from the 7, 21, and 24 Hz frequency peaks is presented in Figure 8. The relative change in the spike counts (microplastics present/absent div 10 from Figure 6) has been plotted for comparison. The relative signal increase suggests that the most prominent frequency response increases with the concentration, due to more impacts within the same time frame. This is, however, not expected to be perpetually linear, as an increased concentration will also produce more impacts with adjacent microplastics, resulting in a trajectory shift, loss of momentum, and overall increased sluggishness. Scrutinizing the frequency information, rather than time-domain naïve spike counting, can, therefore, help improve the accuracy in better distinguishing impacts from noise. Moreover, information from both domains could be integrated in a multivariate model for even better performance. This is beyond the scope of the present work.

Figure 7.
FFT analysis from microplastic concentrations of (a) zero, (b) 0.02%, (c) 0.03%, and (d) 0.04% (w/v). FFT analysis shows periodic frequency associated with presence of microplastics.

Figure 8.
A calibration plot from the signal average (mean) showing the change in the FFT amplitude with the microplastic concentrations. The relative change in the spike counts has been plotted for comparison. The error bars represent the standard error of the mean (±σ, n = 3).
4. Discussion
Employing a standard screen-printed electrode (ZP-HVC-SPE) [46] gave a background signal that was too large compared to the spike events produced by the microplastics, in contrast to a smaller WE of the microwire electrodes. Although the WE presented in this paper had larger diameters than those utilized by Shimizu et al. [45], there were detectable spikes from the microplastic solutions visible in the FAM spike recordings and FFT analysis. Although spikes generated from the 10 µm particles were not visible from direct observations, impacts were visible as “noise” using larger 1 mm PET particles. Hence, the cumulative detection of spikes above a threshold demonstrated by FAM and FFT effectively separated solutions containing microplastics from those without microplastics. This method can, therefore, quantify the overall concentration of microplastic particles, even though it cannot distinguish individual ones.
In the context of early-stage sensor development, where signal variability is expected along with the interference of a significant amount of noise signal, an R2 > 0.75 is considered acceptable [50]. Although a higher R2 value would indicate better performance, the R2 = 0.88 achieved in this study based on the linear regression of the mean is comparable with the results obtained with other low-cost commercial sensors [51]. The phasing in/out of some frequencies (e.g., 21 vs. 24 Hz) with increasing particle concentrations may cause amplitude variations that also reduce the R2 term.
The current study did not include a systematic anti-interference validation used to assess the sensor’s selectivity against other particulate matter or chemical species. Only the impact from the background oxygen was investigated by comparison to deoxygenated samples, which supported the hypothesis that microplastics function as oxygen carriers. Thus, it is expected that both chemical and particulate matter with comparable interfering capabilities may be electroactive for the given WE potential. One should, therefore, design a test matrix of components found in real samples (e.g., organic matter, salts, and colloidal particles) in order to identify their impact as part of a future validation study.
Oxygen scavengers such as Na2SO3 primarily react with dissolved free oxygen and not oxygen adsorbed onto or trapped within the hydrophobic surfaces or internal voids of the microplastic particles. However, the efficacy in removing surface absorbed or entrapped oxygen on microplastics would most likely require more focused investigations. It is possible that the deoxygenation method might have introduced electrochemical effects. The absence of oxygen could alter the redox dynamics in the solution, thus influencing the baseline signals. Additionally, scavenging agents used for deoxygenation might have interacted with the electrode surface, possibly producing some molecular reaction, introducing noise, or affecting reproducibility. Replacing the chemical oxygen scavenger with argon gas for deoxygenation could help reduce potential side reactions caused by the scavenger.
The carbon surface of the WE must remain chemically inert during the oxidative and reductive electrochemical processes so that the anodic and cathodic peaks observed during the carbon electrode’s CV analysis come from the dissolved electrochemical species that are recycled and not from any underlying electrode material. Thus, a characteristic “duck-shaped” plot of the reversible reaction prevails. In contrast, if the underlying electrode material interferes through dissolution or the formation of oxides, non-reversibility exists, causing deviations from the “duck-shaped” plot. This acts as an indication that the carbon coating was compromised, rendering them not suitable for further studies.
Shimizu et al. [45] employed a carbon fiber electrode manufactured using specialized techniques, measuring 1 mm in length and 7 µm in diameter. Since such small-diameter fibers were not readily available, lab wires with a diameter down to 25 µm (40 µm with carbon coating) were chosen for this study. The dynamic range was thus restricted to 100 nA in contrast to the discrete nA level used by Shimizu. Although the individual spikes could not be investigated in the same detail, their presence was analyzed through the means of FAM and FFT.
5. Conclusions
Microplastics detection from electrochemical sensors produced from standard lab tools was demonstrated using FAM spike recordings and an FFT analysis. The “impact concept” proved a higher susceptibility for spikes as well as the presence of unique frequency spectra not visible in pure solutions devoid of microplastics. The combination and improvement of both approaches may result in an electrochemical microplastics detection technique that is effective. The electrochemical sensor does not require any specialized knowledge or sophisticated laboratory tools that require excessive space. In contrast to existing detection methods, it provides an affordable, effective, and user-friendly solution that might find broad scientific and commercial adoption by making it portable and submersible in water. By integrating the WE with the lowest possible diameter on a common substrate with a shared CE and RE by screen printing, the protocol would just require a connection to a miniaturized potentiostat tailored to FAM, with FFT analysis software presenting the data in real time.
Author Contributions
Conceptualization, M.S.C., S.S. and M.P.; Methodology, M.S.C. and S.S.; Validation, M.S.C. and S.S.; Formal analysis, M.S.C. and S.S.; Investigation, M.S.C. and S.S.; Resources, M.P., H.S. and E.J.; Writing—original draft, M.S.C.; Writing—review & editing, S.S., H.S. and E.J.; Supervision, S.S., H.S. and E.J.; Project administration, E.J.; Funding acquisition, M.P. and H.S. All authors have read and agreed to the published version of the manuscript.
Funding
This research was funded by the RFF Vestfold and Telemark (grant no. 337766) and The Research Council of Norway (Norfab project no. 245963).
Institutional Review Board Statement
Not applicable.
Informed Consent Statement
Not applicable.
Data Availability Statement
The original contributions presented in this study are included in the article. Further inquiries can be directed to the corresponding author(s).
Conflicts of Interest
Authors Mashrur Sakib Choyon, Sindre Søpstad and Martin Peacock were employed by the company Zimmer & Peacock. The remaining authors declare that the research was conducted in the absence of any commercial or financial relationships that could be construed as a potential conflict of interest.
References
- Derraik, J.G.B. The pollution of the marine environment by plastic debris: A review. Mar. Mar. Mar. Pollut. Bull. 2002, 44, 842–852. [Google Scholar] [CrossRef]
- Thompson, R.C.; Moore, C.J.; vom Saal, F.S.; Swan, S.H. Plastics, the environment and human health: Current consensus and future trends. Philos. Trans. R. Soc. B Biol. Sci. 2009, 364, 2153–2166. [Google Scholar] [CrossRef]
- Plastics Europe. Plastics—The Facts 2022 Plastics Europe. Available online: https://plasticseurope.org/knowledge-hub/plastics-the-facts-2022 (accessed on 21 June 2023).
- Rochman, C.M.; Brookson, C.; Bikker, J.; Djuric, N.; Earn, A.; Bucci, K.; Athey, S.; Huntington, A.; McIlwraith, H.; Munno, K.; et al. Rethinking microplastics as a diverse contaminant suite. Environ. Toxicol. Chem. 2019, 38, 703–711. [Google Scholar] [CrossRef]
- Barnes, D.K.A.; Galgani, F.; Thompson, R.C.; Barlaz, M. Accumulation and fragmentation of plastic debris in global environments. Philos. Trans. R. Soc. B Biol. Sci. 2009, 364, 1985–1998. [Google Scholar] [CrossRef]
- Andrady, A.L. Microplastics in the marine environment. Mar. Pollut. Bull. 2011, 62, 1596–1605. [Google Scholar] [CrossRef] [PubMed]
- Horton, A.A.; Walton, A.; Spurgeon, D.J.; Lahive, E.; Svendsen, C. Microplastics in freshwater and terrestrial environments: Evaluating the current understanding to identify the knowledge gaps and future research priorities. Sci. Total Environ. 2017, 586, 127–141. [Google Scholar] [CrossRef] [PubMed]
- Koelmans, A.A.; Mohamed Nor, N.H.; Hermsen, E.; Kooi, M.; Mintenig, S.M.; De France, J. Microplastics in freshwaters and drinking water: Critical review and assessment of data quality. Water Res. 2019, 155, 410–422. [Google Scholar] [CrossRef]
- Li, J.; Liu, H.; Paul Chen, J. Microplastics in freshwater systems: A review on occurrence, environmental effects, and methods for microplastics detection. Water Res. 2018, 137, 362–374. [Google Scholar] [CrossRef]
- Jambeck, J.R.; Geyer, R.; Wilcox, C.; Siegler, T.R.; Perryman, M.; Andrady, A.; Narayan, R.; Law, K.L. Plastic waste inputs from land into the ocean. Science 2015, 347, 768–771. [Google Scholar] [CrossRef]
- Eerkes-Medrano, D.; Thompson, R.C.; Aldridge, D.C. Microplastics in freshwater systems: A review of the emerging threats, identification of knowledge gaps and prioritisation of research needs. Water Res. 2015, 75, 63–82. [Google Scholar] [CrossRef]
- Besseling, E.; Foekema, E.; Van Franeker, J.; Leopold, M.; Kühn, S.; Rebolledo, E.B.; Heße, E.; Mielke, L.; Ijzer, J.; Kamminga, P.; et al. Microplastic in a macro filter feeder: Humpback whale Megaptera novaeangliae. Mar. Pollut. Bull. 2015, 95, 248–252. [Google Scholar] [CrossRef] [PubMed]
- Liebezeit, G.; Liebezeit, E. Synthetic particles as contaminants in German beers. Food Addit. Contam. Part A 2014, 31, 1574–1578. [Google Scholar] [CrossRef]
- Liebezeit, G.; Liebezeit, E. Non-pollen particulates in honey and sugar. Food Addit. Contam. Part A 2013, 30, 2136–2140. [Google Scholar] [CrossRef]
- Foley, C.J.; Feiner, Z.S.; Malinich, T.D.; Höök, T.O. A meta-analysis of the effects of exposure to microplastics on fish and aquatic invertebrates. Sci. Total Environ. 2018, 631–632, 550–559. [Google Scholar] [CrossRef]
- Alimba, C.G.; Faggio, C. Microplastics in the marine environment: Current trends in environmental pollution and mechanisms of toxicological profile. Environ. Toxicol. Pharmacol. 2019, 68, 61–74. [Google Scholar] [CrossRef]
- Lithner, D.; Larsson, Å.; Dave, G. Environmental and health hazard ranking and assessment of plastic polymers based on chemical composition. Sci. Total Environ. 2011, 409, 3309–3324. [Google Scholar] [CrossRef]
- Bahraini, A. 7 Types of Plastic that You Need to Know. Waste4Change. [Online]. Available online: https://waste4change.com/blog/7-types-plastic-need-know/ (accessed on 21 June 2023).
- Rochman, C.M. The Complex Mixture, Fate and Toxicity of Chemicals Associated with Plastic Debris in the Marine Environment. In Marine Anthropogenic Litter; Bergmann, M., Gutow, L., Klages, M., Eds.; Springer International Publishing: Cham, Switzerland, 2015; pp. 117–140. [Google Scholar] [CrossRef]
- Lusher, A.; Hollman, P.C.H.; Mendoza-Hill, J. Microplastics in fisheries and aquaculture: Status of knowledge on their occurrence and implications for aquatic organisms and food safety. In FAO Fisheries and Aquaculture Technical Paper; No. 615; Food and Agriculture Organization of the United Nations: Rome, Italy, 2017. [Google Scholar]
- Ragusa, A.; Svelato, A.; Santacroce, C.; Catalano, P.; Notarstefano, V.; Carnevali, O.; Papa, F.; Rongioletti, M.C.A.; Baiocco, F.; Draghi, S.; et al. Plasticenta: First evidence of microplastics in human placenta. Environ. Int. 2021, 146, 106274. [Google Scholar] [CrossRef]
- Desforges, J.-P.W.; Galbraith, M.; Ross, P.S. Ingestion of Microplastics by Zooplankton in the Northeast Pacific Ocean. Arch Env. Contam Toxicol 2015, 69, 320–330. [Google Scholar] [CrossRef]
- Lusher, A.L.; McHugh, M.; Thompson, R.C. Occurrence of microplastics in the gastrointestinal tract of pelagic and demersal fish from the English Channel. Mar. Pollut. Bull. 2013, 67, 94–99. [Google Scholar] [CrossRef]
- Kelly, F.J.; Fussell, J.C. Toxicity of airborne particles—Established evidence, knowledge gaps and emerging areas of importance. Philos. Trans. R. Soc. A Math. Phys. Eng. Sci. 2020, 378, 20190322. [Google Scholar] [CrossRef]
- 4.4: Studying Cells—Cell Size. Biology LibreTexts. Available online: https://bio.libretexts.org/Bookshelves/Introductory_and_General_Biology/Book%3A_General_Biology_(Boundless)/04%3A_Cell_Structure/4.04%3A_Studying_Cells_-_Cell_Size (accessed on 24 June 2023).
- Yong, C.Q.Y.; Valiyaveettil, S.; Tang, B.L. Toxicity of Microplastics and Nanoplastics in Mammalian Systems. Int. J. Environ. Res. Public Health 2020, 17, 1509. [Google Scholar] [CrossRef]
- Wright, S.L.; Kelly, F.J. Plastic and Human Health: A Micro Issue? Environ. Sci. Technol. 2017, 51, 6634–6647. [Google Scholar] [CrossRef]
- Ryan, P.G.; Moore, C.J.; van Franeker, J.A.; Moloney, C.L. Monitoring the abundance of plastic debris in the marine environment. Philos. Trans. R. Soc. B Biol. Sci. 2009, 364, 1999–2012. [Google Scholar] [CrossRef]
- Browne, M.A.; Galloway, T.S.; Thompson, R.C. Spatial Patterns of Plastic Debris along Estuarine Shorelines. Environ. Sci. Technol. 2010, 44, 3404–3409. [Google Scholar] [CrossRef] [PubMed]
- Karami, A.; Golieskardi, A.; Keong Choo, C.; Larat, V.; Galloway, T.S.; Salamatinia, B. The presence of microplastics in commercial salts from different countries. Sci. Rep. 2017, 7, 46173. [Google Scholar] [CrossRef]
- Kong, J.; Yu, S. Fourier Transform Infrared Spectroscopic Analysis of Protein Secondary Structures. Acta Biochim. Biophys. Sin. 2007, 39, 549–559. [Google Scholar] [CrossRef]
- What Is FTIR Spectroscopy? Available online: https://www.sigmaaldrich.com/NO/en/technical-documents/technical-article/analytical-chemistry/photometry-and-reflectometry/ftir-spectroscopy (accessed on 24 June 2023).
- Granite. What Is Raman Spectroscopy?|Raman Spectroscopy Principle. Edinburgh Instruments. Available online: https://www.edinst.com/blog/what-is-raman-spectroscopy/ (accessed on 24 June 2023).
- Nie, S.; Emory, S.R. Probing Single Molecules and Single Nanoparticles by Surface-Enhanced Raman Scattering. Science 1997, 275, 1102–1106. [Google Scholar] [CrossRef]
- Asamoah, B.O.; Kanyathare, B.; Roussey, M.; Peiponen, K.-E. A prototype of a portable optical sensor for the detection of transparent and translucent microplastics in freshwater. Chemosphere 2019, 231, 161–167. [Google Scholar] [CrossRef]
- Iri, A.H.; Shahrah, M.H.A.; Ali, A.M.; Qadri, S.A.; Erdem, T.; Ozdur, I.T.; Icoz, K. Optical detection of microplastics in water. Environ. Sci. Pollut. Res. 2021, 28, 63860–63866. [Google Scholar] [CrossRef]
- Holland, B.J.; Hay, J.N. The thermal degradation of PET and analogous polyesters measured by thermal analysis—Fourier transform infrared spectroscopy. Polymer 2002, 43, 1835–1847. [Google Scholar] [CrossRef]
- Huang, C.-J.; Narasimha, G.V.; Chen, Y.-C.; Chen, J.-K.; Dong, G.-C. Measurement of Low Concentration of Micro-Plastics by Detection of Bioaffinity-Induced Particle Retention Using Surface Plasmon Resonance Biosensors. Biosensors 2021, 11, 219. [Google Scholar] [CrossRef]
- Free, C.M.; Jensen, O.P.; Mason, S.A.; Eriksen, M.; Williamson, N.J.; Boldgiv, B. High-levels of microplastic pollution in a large, remote, mountain lake. Mar. Pollut. Bull. 2014, 85, 156–163. [Google Scholar] [CrossRef] [PubMed]
- Turner, A.; Holmes, L. Occurrence, distribution and characteristics of beached plastic production pellets on the island of Malta (central Mediterranean). Mar. Pollut. Bull. 2011, 62, 377–381. [Google Scholar] [CrossRef]
- Collard, F.; Gilbert, B.; Eppe, G.; Parmentier, E.; Das, K. Detection of Anthropogenic Particles in Fish Stomachs: An Isolation Method Adapted to Identification by Raman Spectroscopy. Arch. Environ. Contam. Toxicol. 2015, 69, 331–339. [Google Scholar] [CrossRef] [PubMed]
- Wang, Z.-M.; Wagner, J.; Ghosal, S.; Bedi, G.; Wall, S. SEM/EDS and optical microscopy analyses of microplastics in ocean trawl and fish guts. Sci. Total Environ. 2017, 603–604, 616–626. [Google Scholar] [CrossRef]
- Funck, M.; Yildirim, A.; Nickel, C.; Schram, J.; Schmidt, T.C.; Tuerk, J. Identification of microplastics in wastewater after cascade filtration using Pyrolysis-GC–MS. MethodsX 2020, 7, 100778. [Google Scholar] [CrossRef]
- Hengstmann, E.; Fischer, E.K. Nile red staining in microplastic analysis—Proposal for a reliable and fast identification approach for large microplastics. Environ. Monit. Assess. 2019, 191, 612. [Google Scholar] [CrossRef] [PubMed]
- Shimizu, K.; Sokolov, S.V.; Kätelhön, E.; Holter, J.; Young, N.P.; Compton, R.G. In situ Detection of Microplastics: Single Microparticle-electrode Impacts. Electroanalysis 2017, 29, 2200–2207. [Google Scholar] [CrossRef]
- Hyper Value Screen Printed Electrodes. zimmerandpeacock. Available online: http://www.zimmerpeacocktech.com/products/electrochemical-sensors/hyper-value-screen-printed-electrodes/ (accessed on 30 May 2023).
- Origin: Data Analysis and Graphing Software. Available online: https://www.originlab.com/origin (accessed on 20 October 2024).
- The Julia Programming Language. Available online: https://julialang.org/ (accessed on 20 October 2024).
- Introduction to Djuli. zimmerandpeacock. Available online: http://www.zimmerpeacocktech.com/knowledge-base/djuli/ (accessed on 20 October 2024).
- Karagulian, F.; Barbiere, M.; Kotsev, A.; Spinelle, L.; Gerboles, M.; Lagler, F.; Redon, N.; Crunaire, S.; Borowiak, A. Review of the Performance of Low-Cost Sensors for Air Quality Monitoring. Atmosphere 2019, 10, 506. [Google Scholar] [CrossRef]
- Schuldt, T.; Gkatzelis, G.I.; Wesolek, C.; Rohrer, F.; Winter, B.; Kuhlbusch, T.A.J.; Kiendler-Scharr, A.; Tillmann, R. Electrochemical sensors onboard a Zeppelin NT: In-flight evaluation of low-cost trace gas measurements. Atmos. Meas. Tech. Discuss. 2022, 2022, 8. [Google Scholar] [CrossRef]
Disclaimer/Publisher’s Note: The statements, opinions and data contained in all publications are solely those of the individual author(s) and contributor(s) and not of MDPI and/or the editor(s). MDPI and/or the editor(s) disclaim responsibility for any injury to people or property resulting from any ideas, methods, instructions or products referred to in the content. |
© 2025 by the authors. Licensee MDPI, Basel, Switzerland. This article is an open access article distributed under the terms and conditions of the Creative Commons Attribution (CC BY) license (https://creativecommons.org/licenses/by/4.0/).