All simulations are performed on the macOS Sequoia operating system on a MacBook Pro with the Apple M1 Pro chip and 16 GB of RAM. The simulations employed FOCUS version 981, compiled for Apple Silicon Macs.
3.1. Imaging Examples
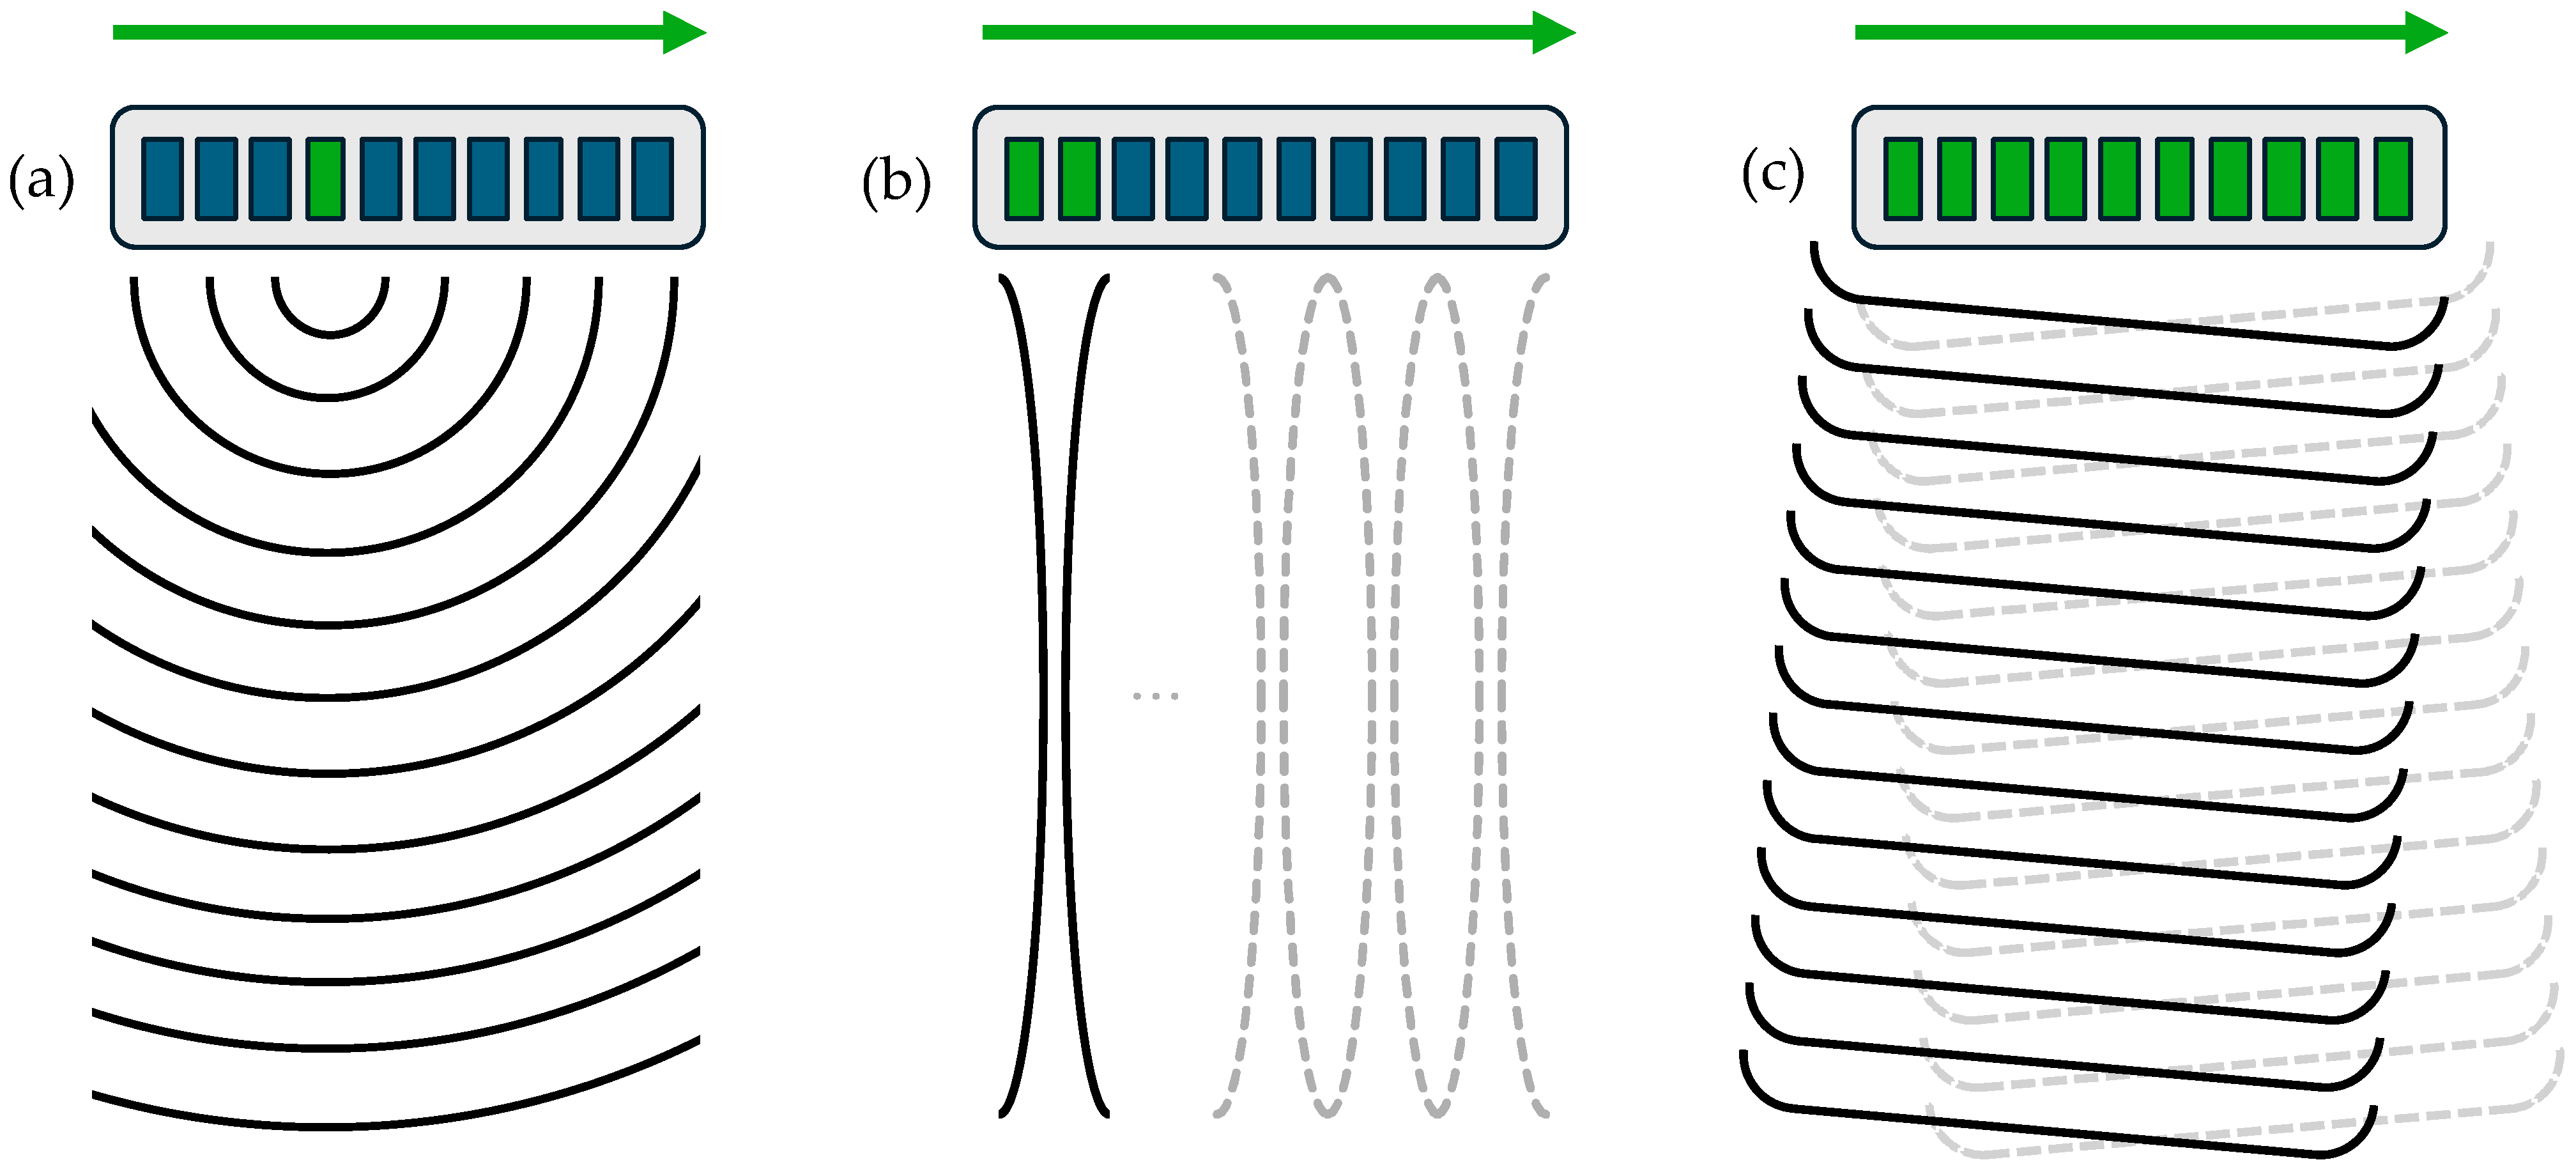
For simulations of synthetic aperture, B-mode, and plane wave imaging, a 128-element linear array of rectangular transducers is evaluated. Each rectangular transducer has a width of 0.3 mm, a height of 7.0 mm, and a kerf of 0.05 mm. The linear array is centered at , and the array normal is aligned with the z-axis. The time-varying normal velocities for the waveforms and , which satisfy , are single-cycle sinusoids with center frequencies of 3 MHz. All simulations utilize a temporal sampling frequency of 16 MHz, a sound speed of 1540 m/s, and a density of 1000 kg/m3. For the fast nearfield method calculations, six abscissas are defined for Gauss–Legendre quadrature.
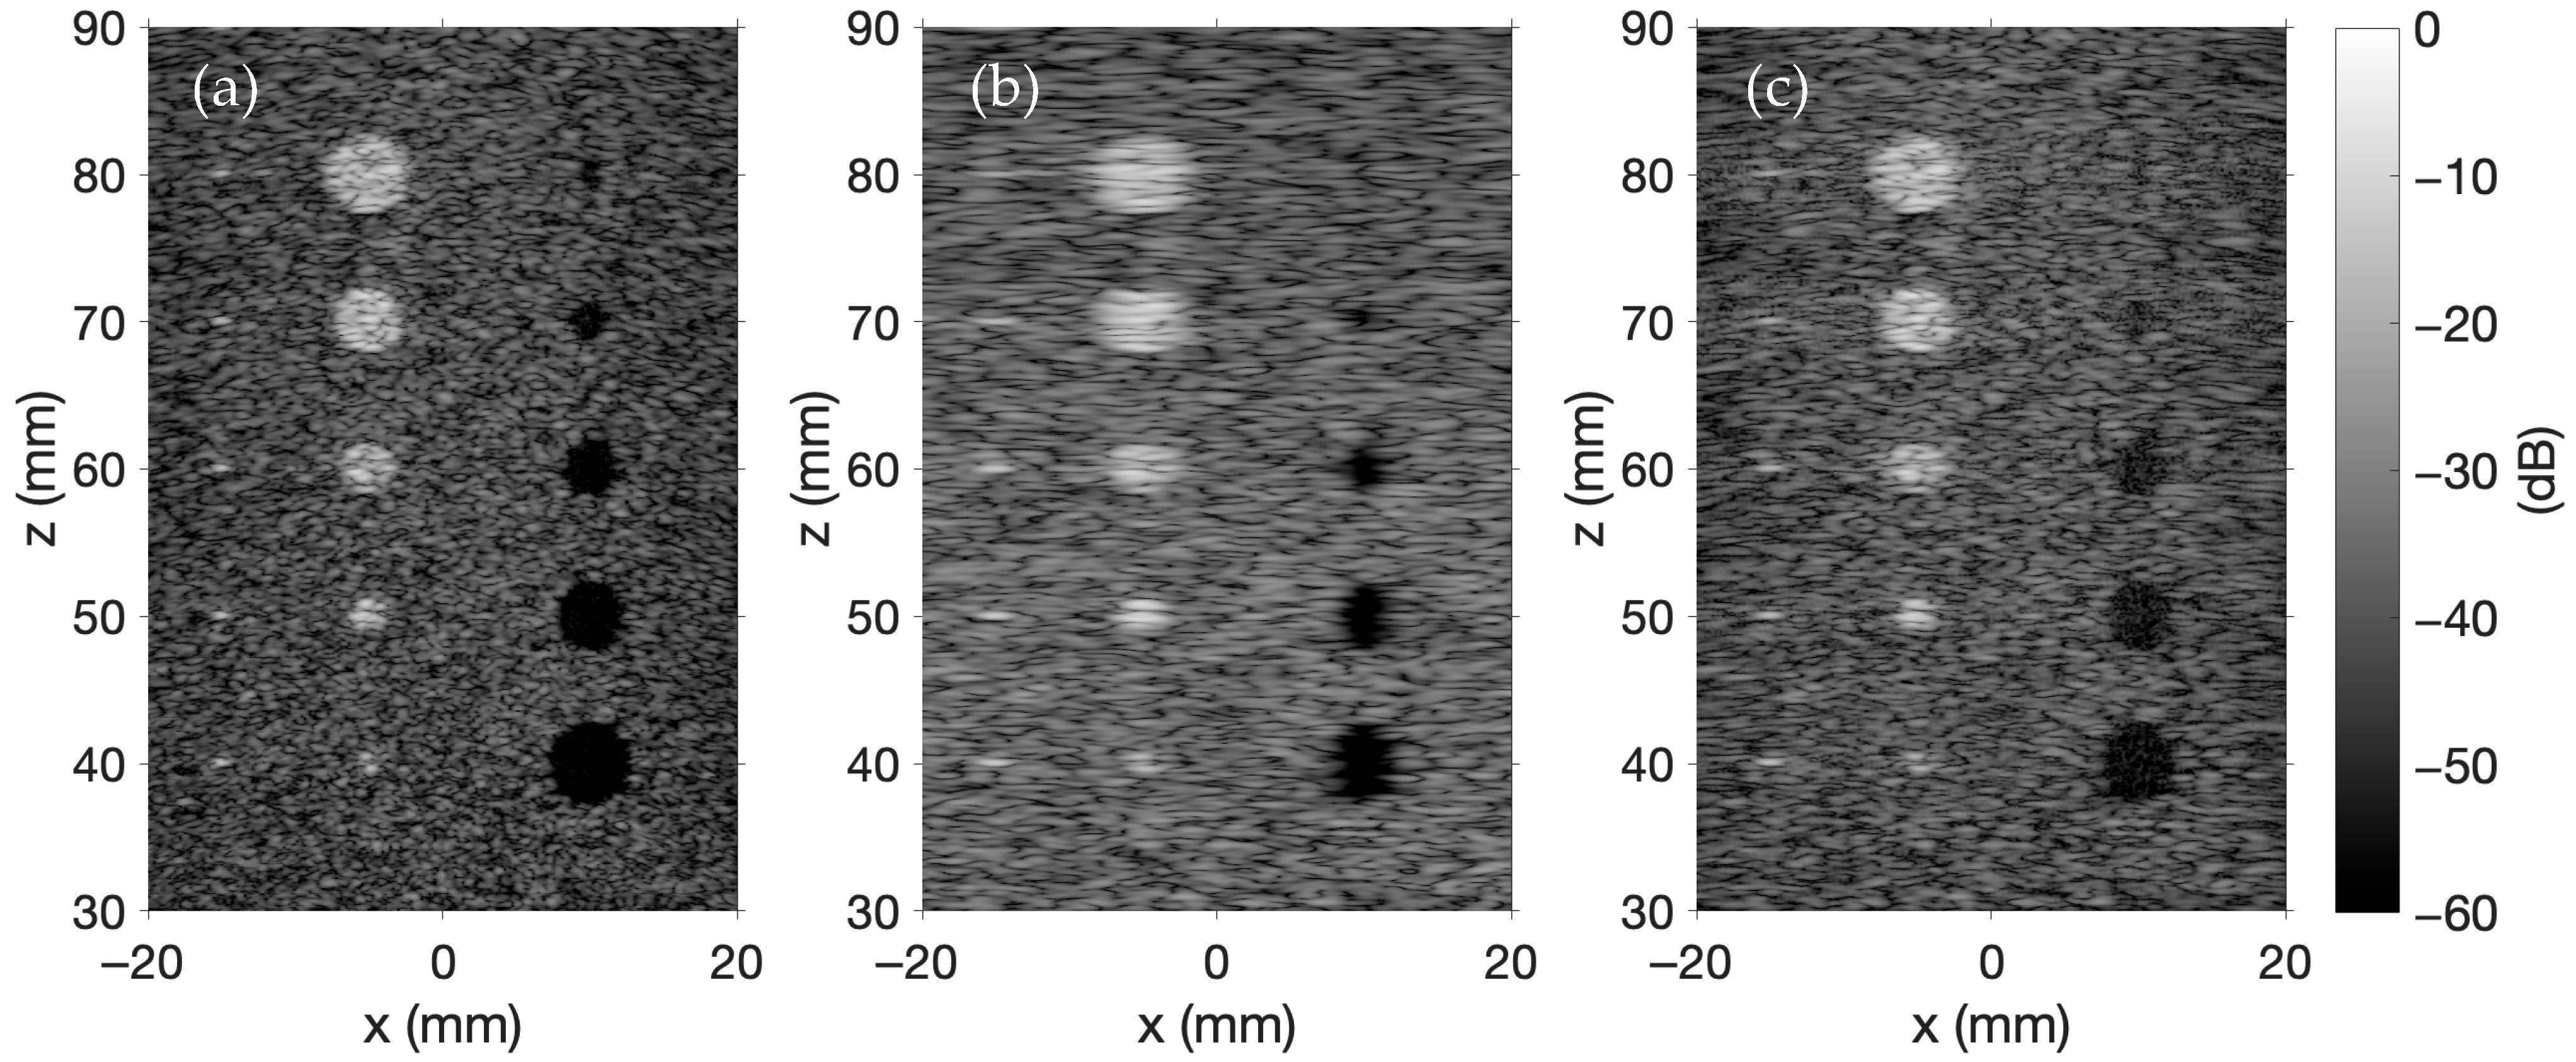
The simulated ultrasound phantom in
Figure 2 includes five point targets, five hyperechoic regions, and five anechoic regions. The background is generated by distributing scatterers randomly within a 50 × 10 × 60 mm region 30 mm away from the transducer array. Scatterer amplitudes satisfy a Gaussian distribution with a mean of 0 and a variance of 1. If a randomly distributed scatterer is located in an anechoic region, the scatterer amplitude is set to 0; however, if the scatterer is in a hyperechoic region, the scatterer amplitude is multiplied by 10. The scatterer amplitude of each point target is 20. The simulations in
Figure 2 model 100,000 scatterers using a phantom structure that is adapted from a similar script provided by the Field II package [
31].
In
Figure 2, each image is constructed using 257 A-lines positioned at both the spatial centers of each transducer and the midpoints between transducers. The lateral extent of the ultrasound image ranges from −22.4 mm to 22.4 mm in increments of 0.1764 mm. The axial extent ranges from 30 mm to 90 mm.
Figure 2a showcases synthetic aperture imaging, where each transducer is excited individually, and the backscattered pulse-echo signals are captured by all transducers. The delay-and-sum beamforming applies axial focusing along the
z-axis from 30 mm to 90 mm in 1 mm increments with an f-number of 2, while lateral focusing along the
x-axis follows the 257 A-line positions spanning from −22.4 mm to 22.4 mm. The final synthetic aperture image is generated by compounding the individual images.
Figure 2b is created using B-mode imaging. In this figure, a 64-element sub-aperture array is apodized with a Hanning window and focused to a depth of 60 mm on transmit. Receive focusing is applied at depths of 35, 45, 55, 65, 75, and 85 mm such that each A-line concatenates six segments extending from 30 to 90 mm in 10 mm increments. This process is repeated, shifting the sub-aperture across the array to produce a full set of A-lines.
Figure 2c shows an example of plane wave imaging in FOCUS. The plane wave imaging simulation in FOCUS models electronic steering across five evenly spaced transmit angles ranging from −6° to +6°. Delay-and-sum beamforming again applies receive focusing along the
z-axis from 30 mm to 90 mm in 1 mm increments with an f-number of 2, and along the
x-axis at 257 focal positions spanning from −22.4 mm to 22.4 mm. Each beamformed transmit–receive RF data pair is then combined to produce the final image. In all three images, each A-line is normalized, demodulated through a Hilbert transform, and log compressed. The normalized, demodulated, and compressed A-lines are then concatenated to produce the final images. The colorbar in
Figure 2 shows the display dynamic range in decibels (dB) for each image. That same range is applied uniformly to all of the presented simulated ultrasound images.
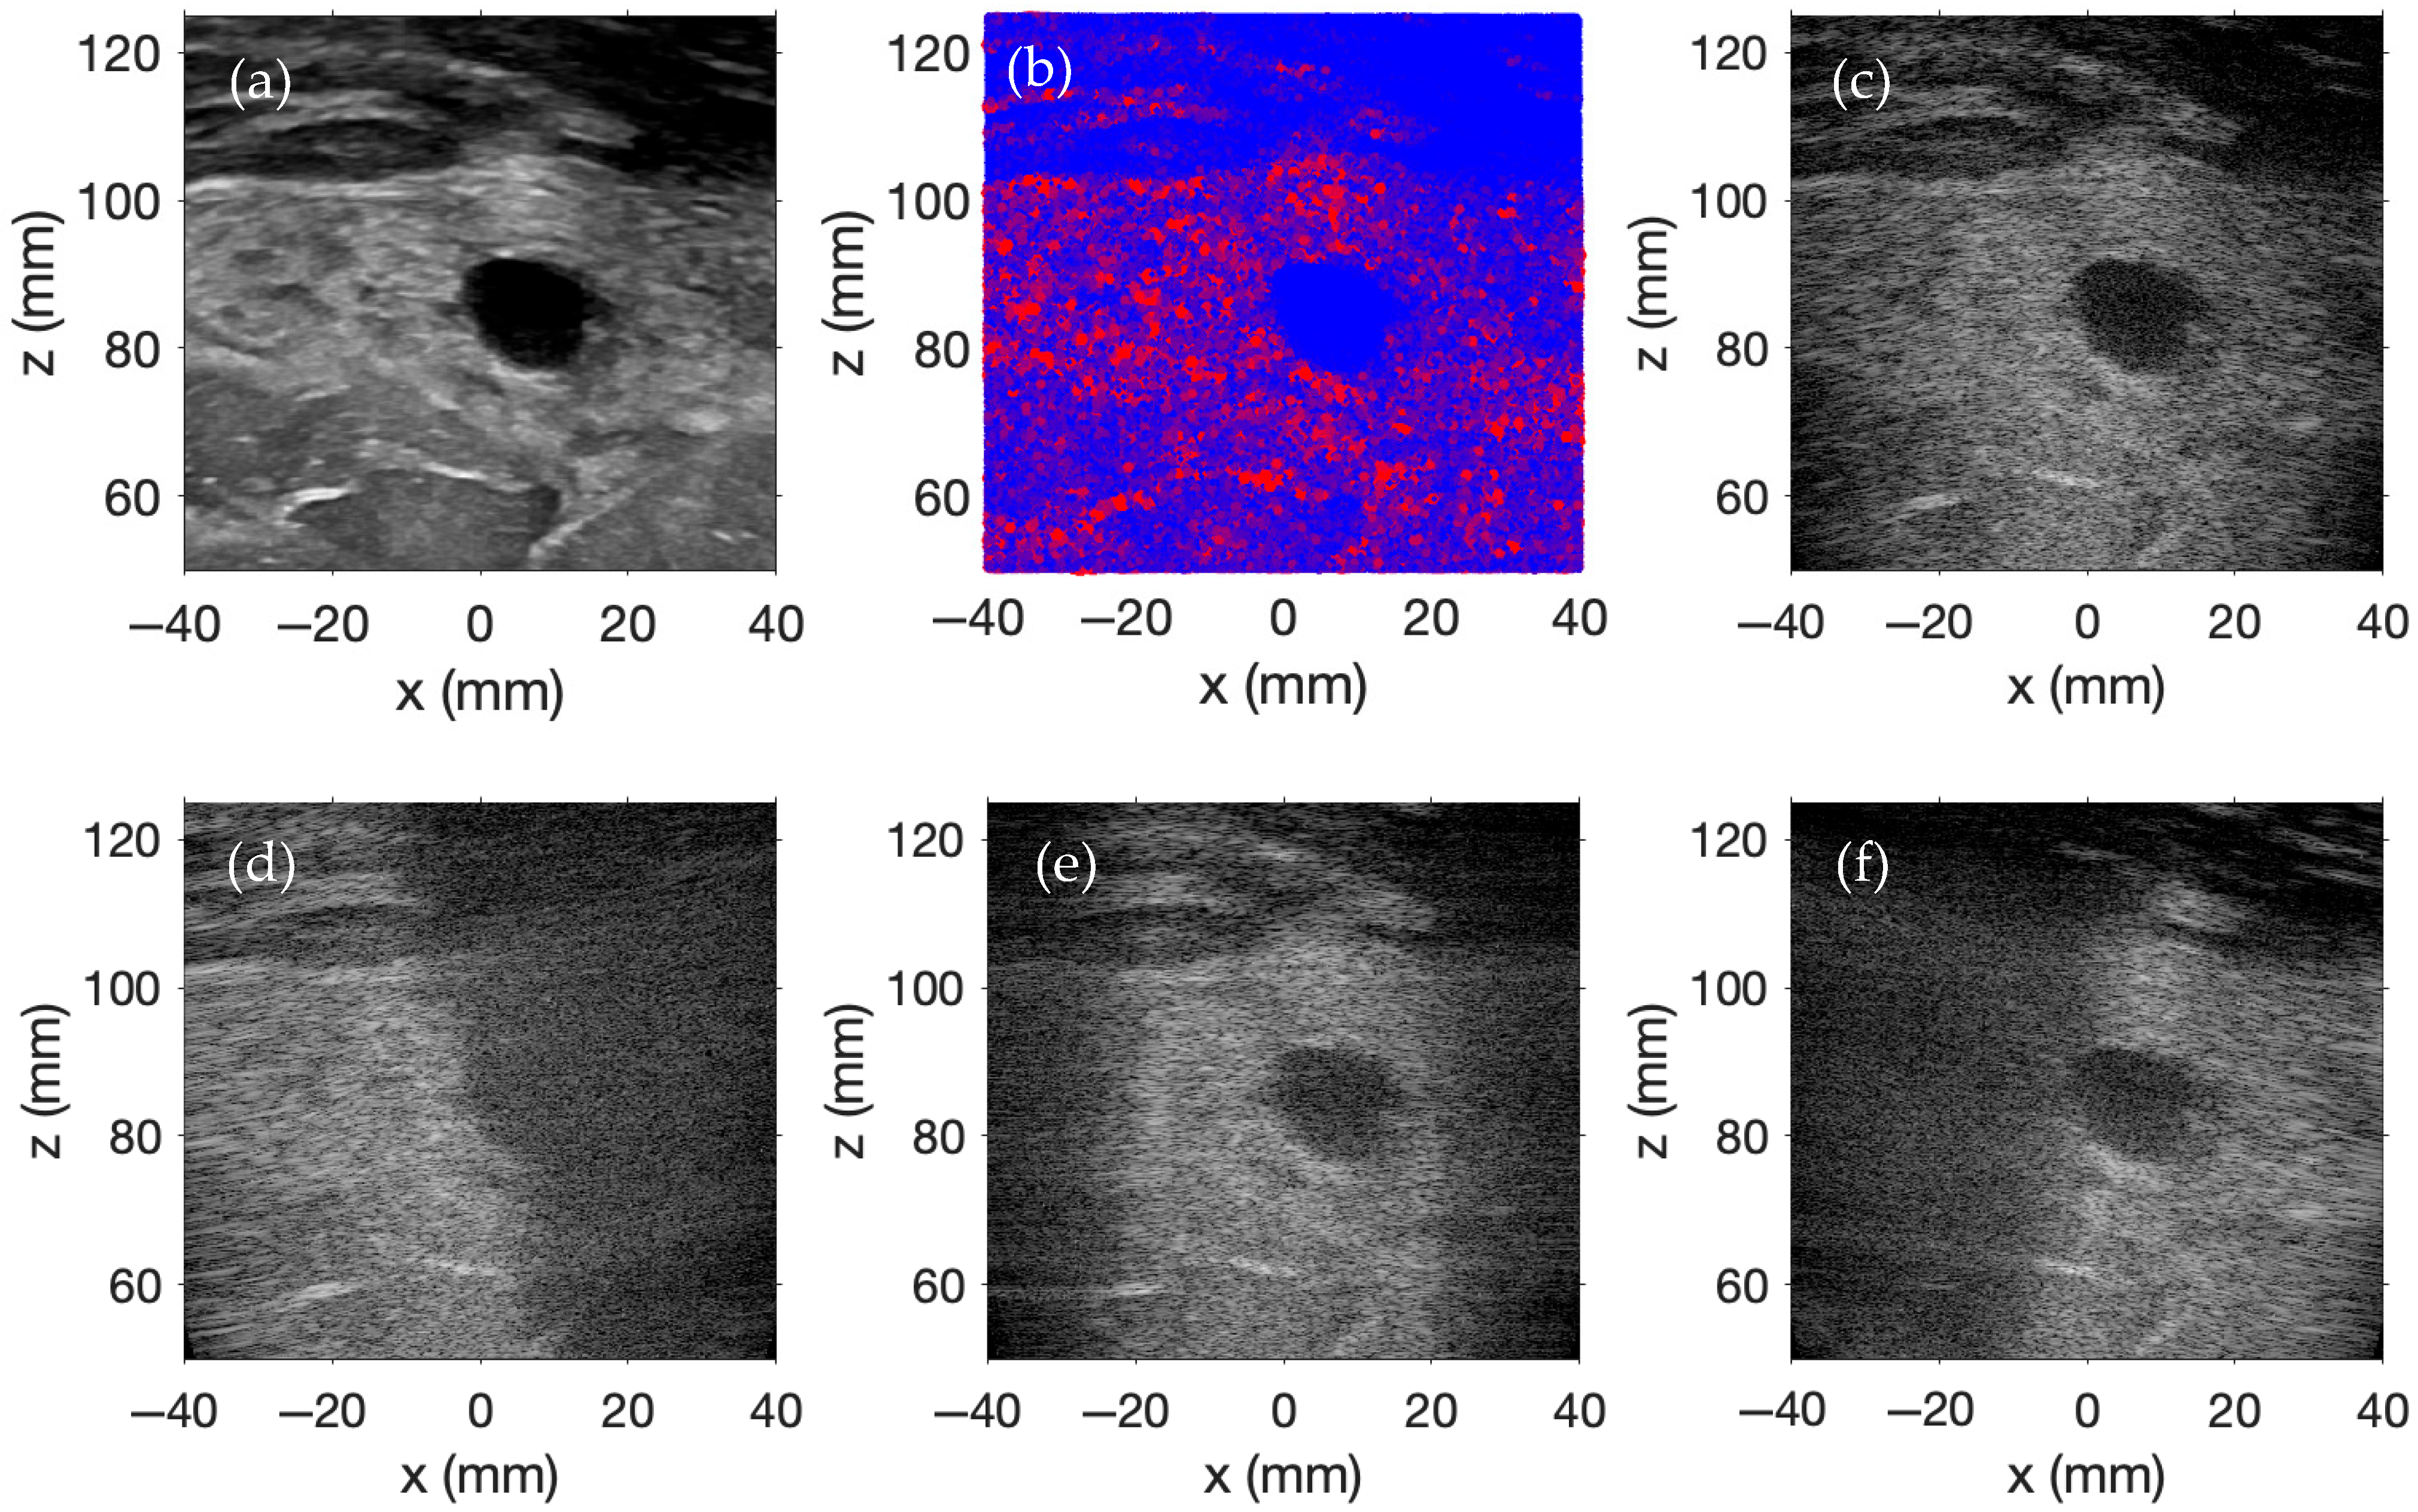
Figure 3 demonstrates plane wave imaging with the same 128-element array that was evaluated in
Figure 2. The time-varying normal velocities for the waveforms
and
, which again satisfy
, are single-cycle sinusoids with center frequencies of 3 MHz. The temporal sampling frequency is 16 MHz, the sound speed is 1540 m/s, and the density is 1000 kg/m
3.
Figure 3a contains a two-dimensional (2D) ultrasound image of a female breast with a benign mass obtained from the Breast Ultrasound Images Dataset [
32], which serves as the scatterer amplitude template for this simulation. One million scatterers are randomly distributed within a 100 × 15 × 100 mm region. Scatterer amplitudes are determined by mapping the
x–
z coordinates of each scatterer to the nearest pixel in the 2D grayscale ultrasound image, with a logical mask excluding any points outside the image bounds. Each grayscale pixel value is divided by 100, yielding scaled amplitudes ranging from 0 to 2.55. An exponential transformation of these scaled amplitudes produces strictly positive weights that accentuate bright regions relative to darker areas. Subtraction of the global minimum weight from all weights establishes a zero baseline, and the spectrum of weights is uniformly rescaled to range from 0 to
. Finally, independent Gaussian random samples with a mean of 0 and a variance of 1 are multiplied by the rescaled weights, yielding zero-mean amplitudes with local variance that reflects the grayscale variations of the original ultrasound image. The finalized collection of scatterers, intended to mimic a female breast with a benign mass, is pictured in
Figure 3b.
Plane wave imaging is performed across nine evenly spaced transmit angles, ranging from −20° to +20°. Each image is beamformed using delay-and-sum beamforming with receive focusing ranging from 50 mm to 125 mm in the
z-direction in 1 mm intervals and from −40 mm to 40 mm in the
x-direction in 0.1566 mm intervals. The f-number for the delay-and-sum beamforming is 1.5. The individual images for the steering angles of −15°, 0°, and +15° are displayed in
Figure 3d,
Figure 3e, and
Figure 3f, respectively. The final compounded plane wave image is shown in
Figure 3c. The display dynamic range for each simulated image spans from 0 to −60 dB.
As indicated by the images in the bottom row of
Figure 3, each steered plane wave insonifies different areas within the region of interest, and backscattered signals are strongest in regions where the spatial pressure magnitude of the transmitted wavefront is highest. However, by transmitting plane waves at multiple steering angles and coherently compounding the beamformed RF data from each transmission, the entire region is effectively imaged in these simulations. Furthermore, this compounding enhances lateral resolution and contrast by reducing direction-dependent artifacts and by increasing spatial coherence through the reinforcement of consistent echo patterns across steering angles.
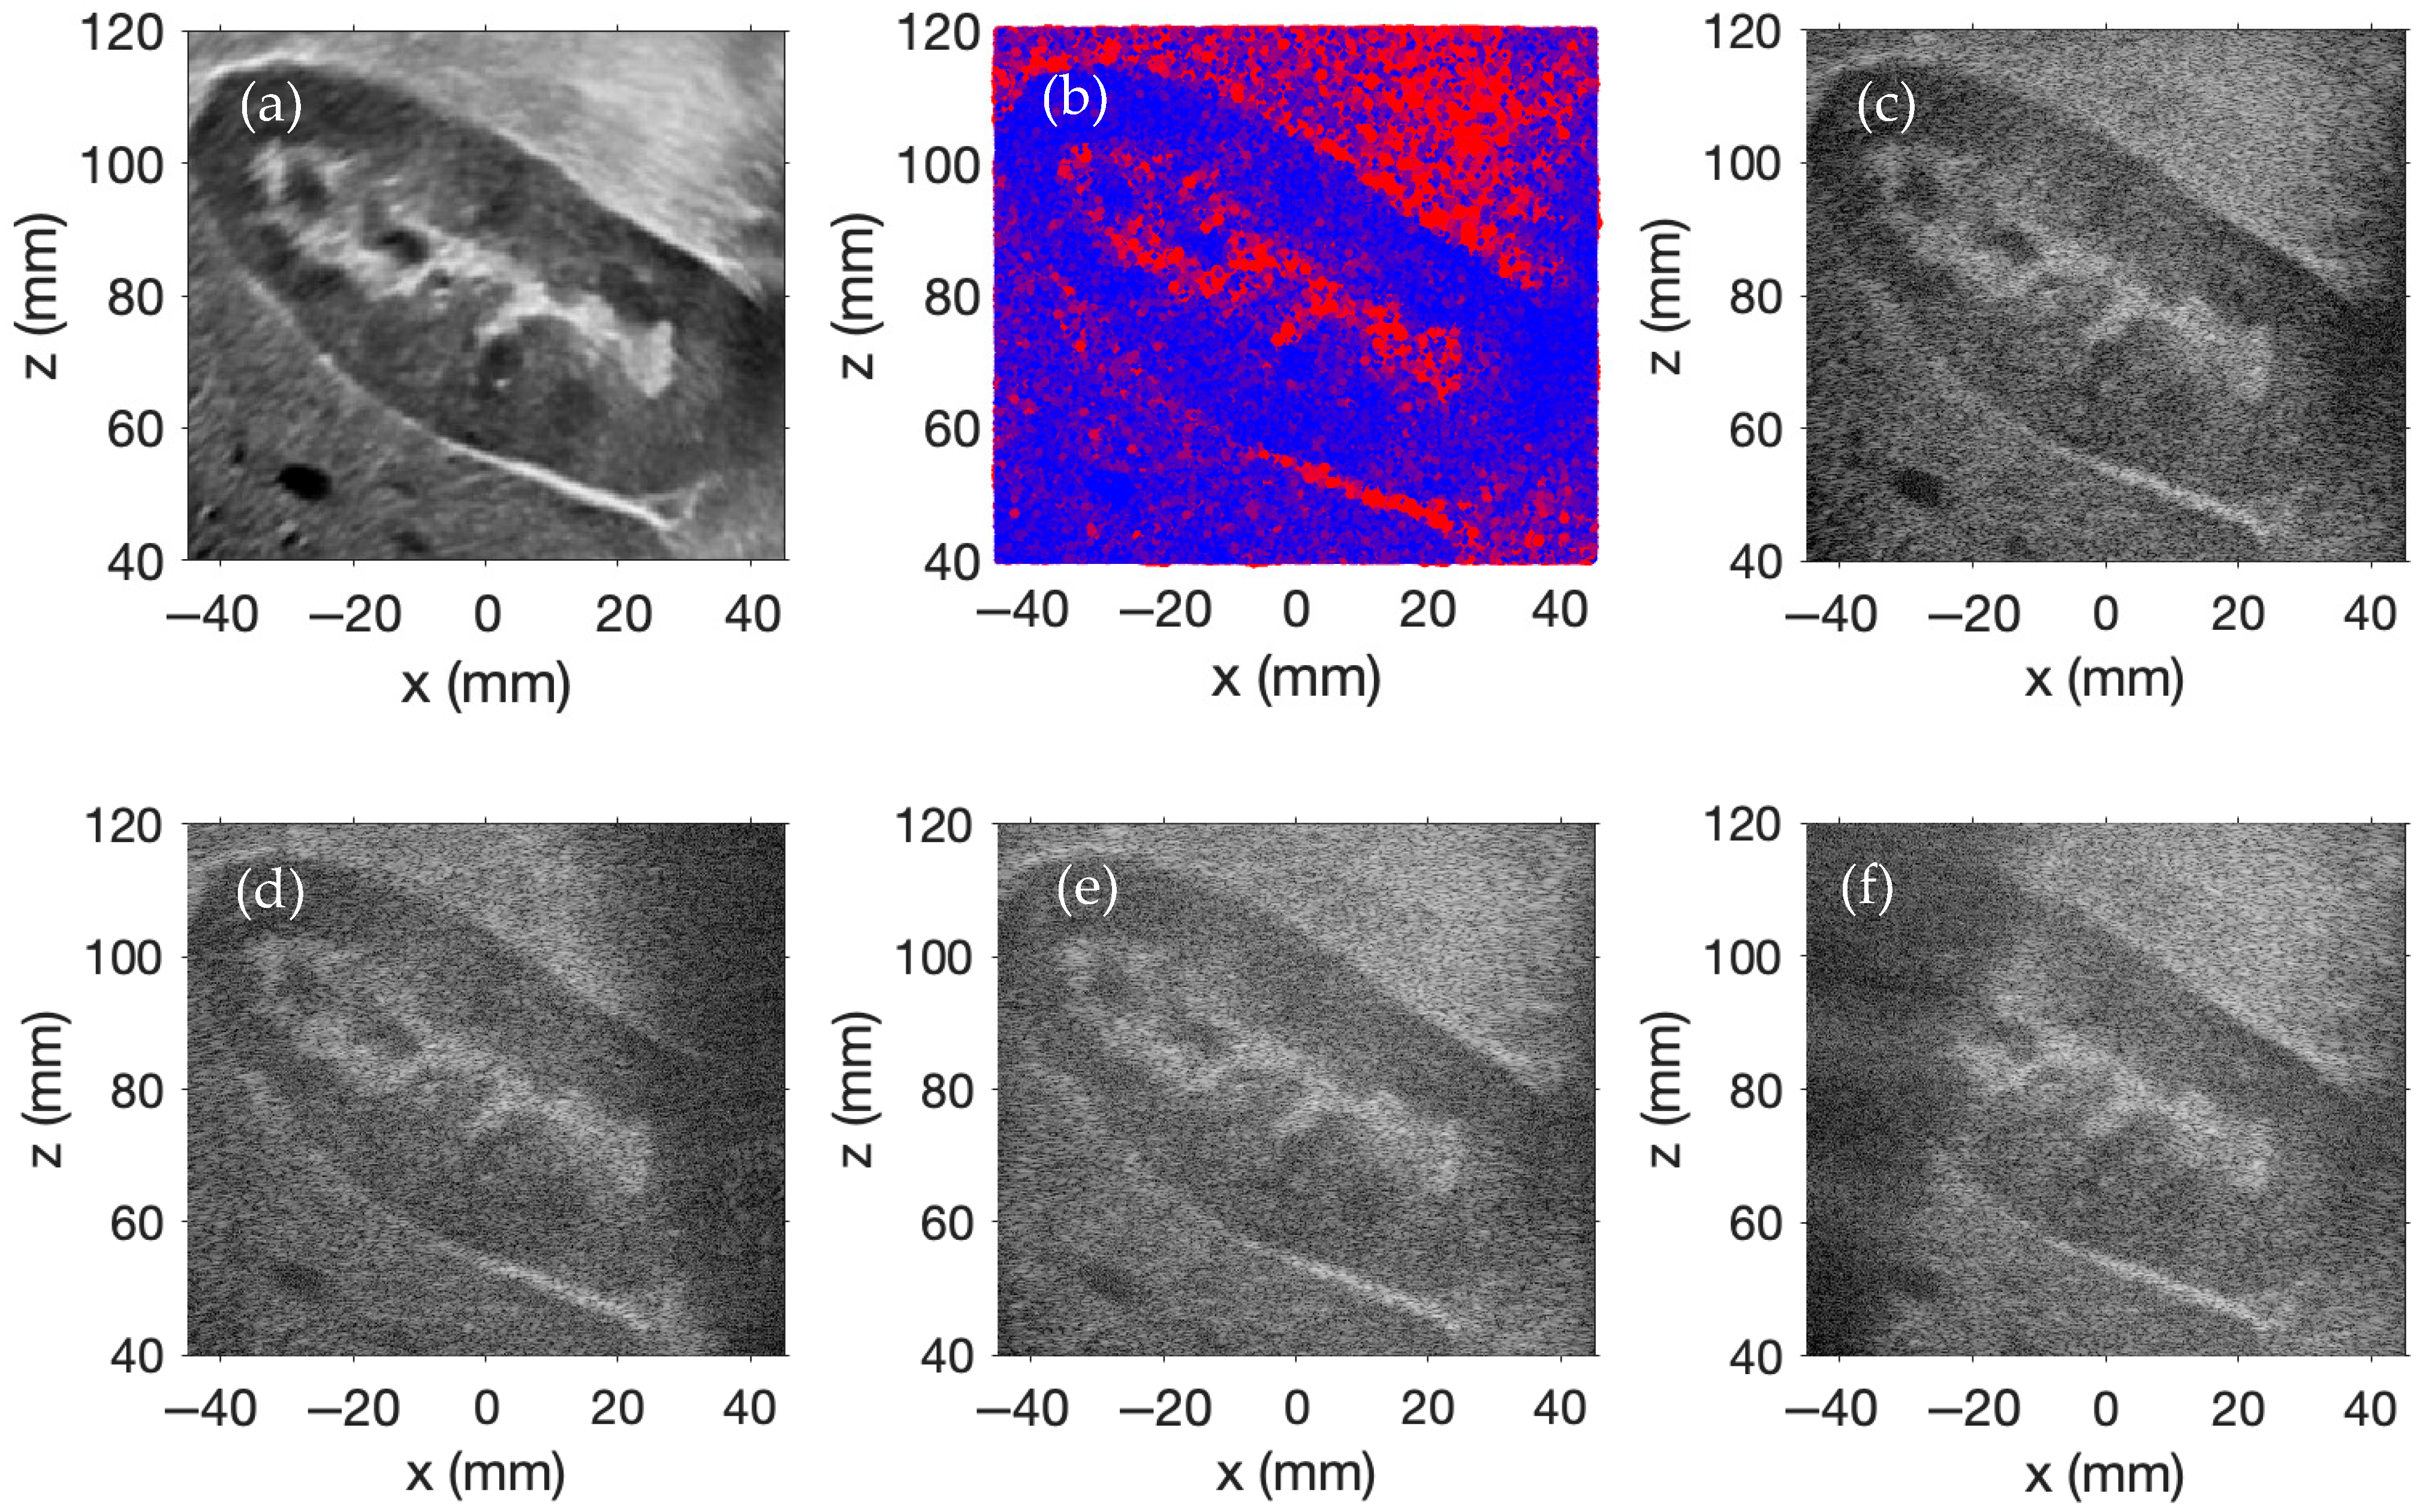
Figure 4 presents a second example of plane wave imaging simulated using FOCUS. A 256-element linear array of rectangular transducers is employed, with each element having a width of 0.3 mm, a height of 7.0 mm, and a kerf of 0.05 mm. The array is centered at
, with the element normals oriented along the
z-axis. The waveforms
and
are defined by
, where each is a single-cycle sinusoidal waveform with a center frequency of 3 MHz. The temporal sampling frequency is 16 MHz in the simulation. The sound speed is 1540 m/s, and the density is 1000 kg/m
3.
A 2D ultrasound image of a human kidney from the Kidney Ultrasound Images “Stone” and “No Stone” dataset [
33], shown in
Figure 4a, serves as the scatterer amplitude scaling template for this simulation. One million scatterers are randomly distributed within a 100 × 15 × 100 mm region. The scatterer amplitudes are assigned using the same method as described in the previous example.
Plane wave imaging is simulated using nine transmit angles evenly distributed from −20° to +20°. Delay-and-sum beamforming is applied to each acquisition with receive focusing along the
-direction from 40 mm to 120 mm with 1 mm increments and along the
-direction from −45 mm to 45 mm with 0.1761 mm increments. Delay-and-sum beamforming is performed with an f-number of 1.5. The beamformed images corresponding to steering angles of −15°, 0°, and +15° are shown in
Figure 4d,
Figure 4e, and
Figure 4f, respectively. The final compounded image, formed by coherently compounding all steered acquisitions, is displayed in
Figure 4c. Each simulated image employs a display dynamic range of 0 to −60 dB.
This example again illustrates how coherent compounding improves resolution and contrast in plane wave imaging simulations. Compared to the previous configuration, the longer lateral span of the 256-element array enables broader plane wave coverage, reducing the presence of shadowed or under-illuminated regions in the individual images. As a result, each single-angle acquisition captures more of the region of interest with fewer dark areas. This improved per-angle coverage yields a final compounded image with more uniform brightness, particularly in the lower corners where coverage was previously more limited. The increased strength and consistency of the RF data in these regions contribute to improved resolution and contrast, as spatial features are more effectively reinforced across multiple steered angles—unlike in the previous simulation, where limited coverage resulted in weaker representations of those areas. However, this improvement incurs a computational cost: doubling the number of transducer elements relative to the prior simulation nearly quadruples the simulation time, reflecting the increased memory usage and computational demands associated with a larger transducer array.
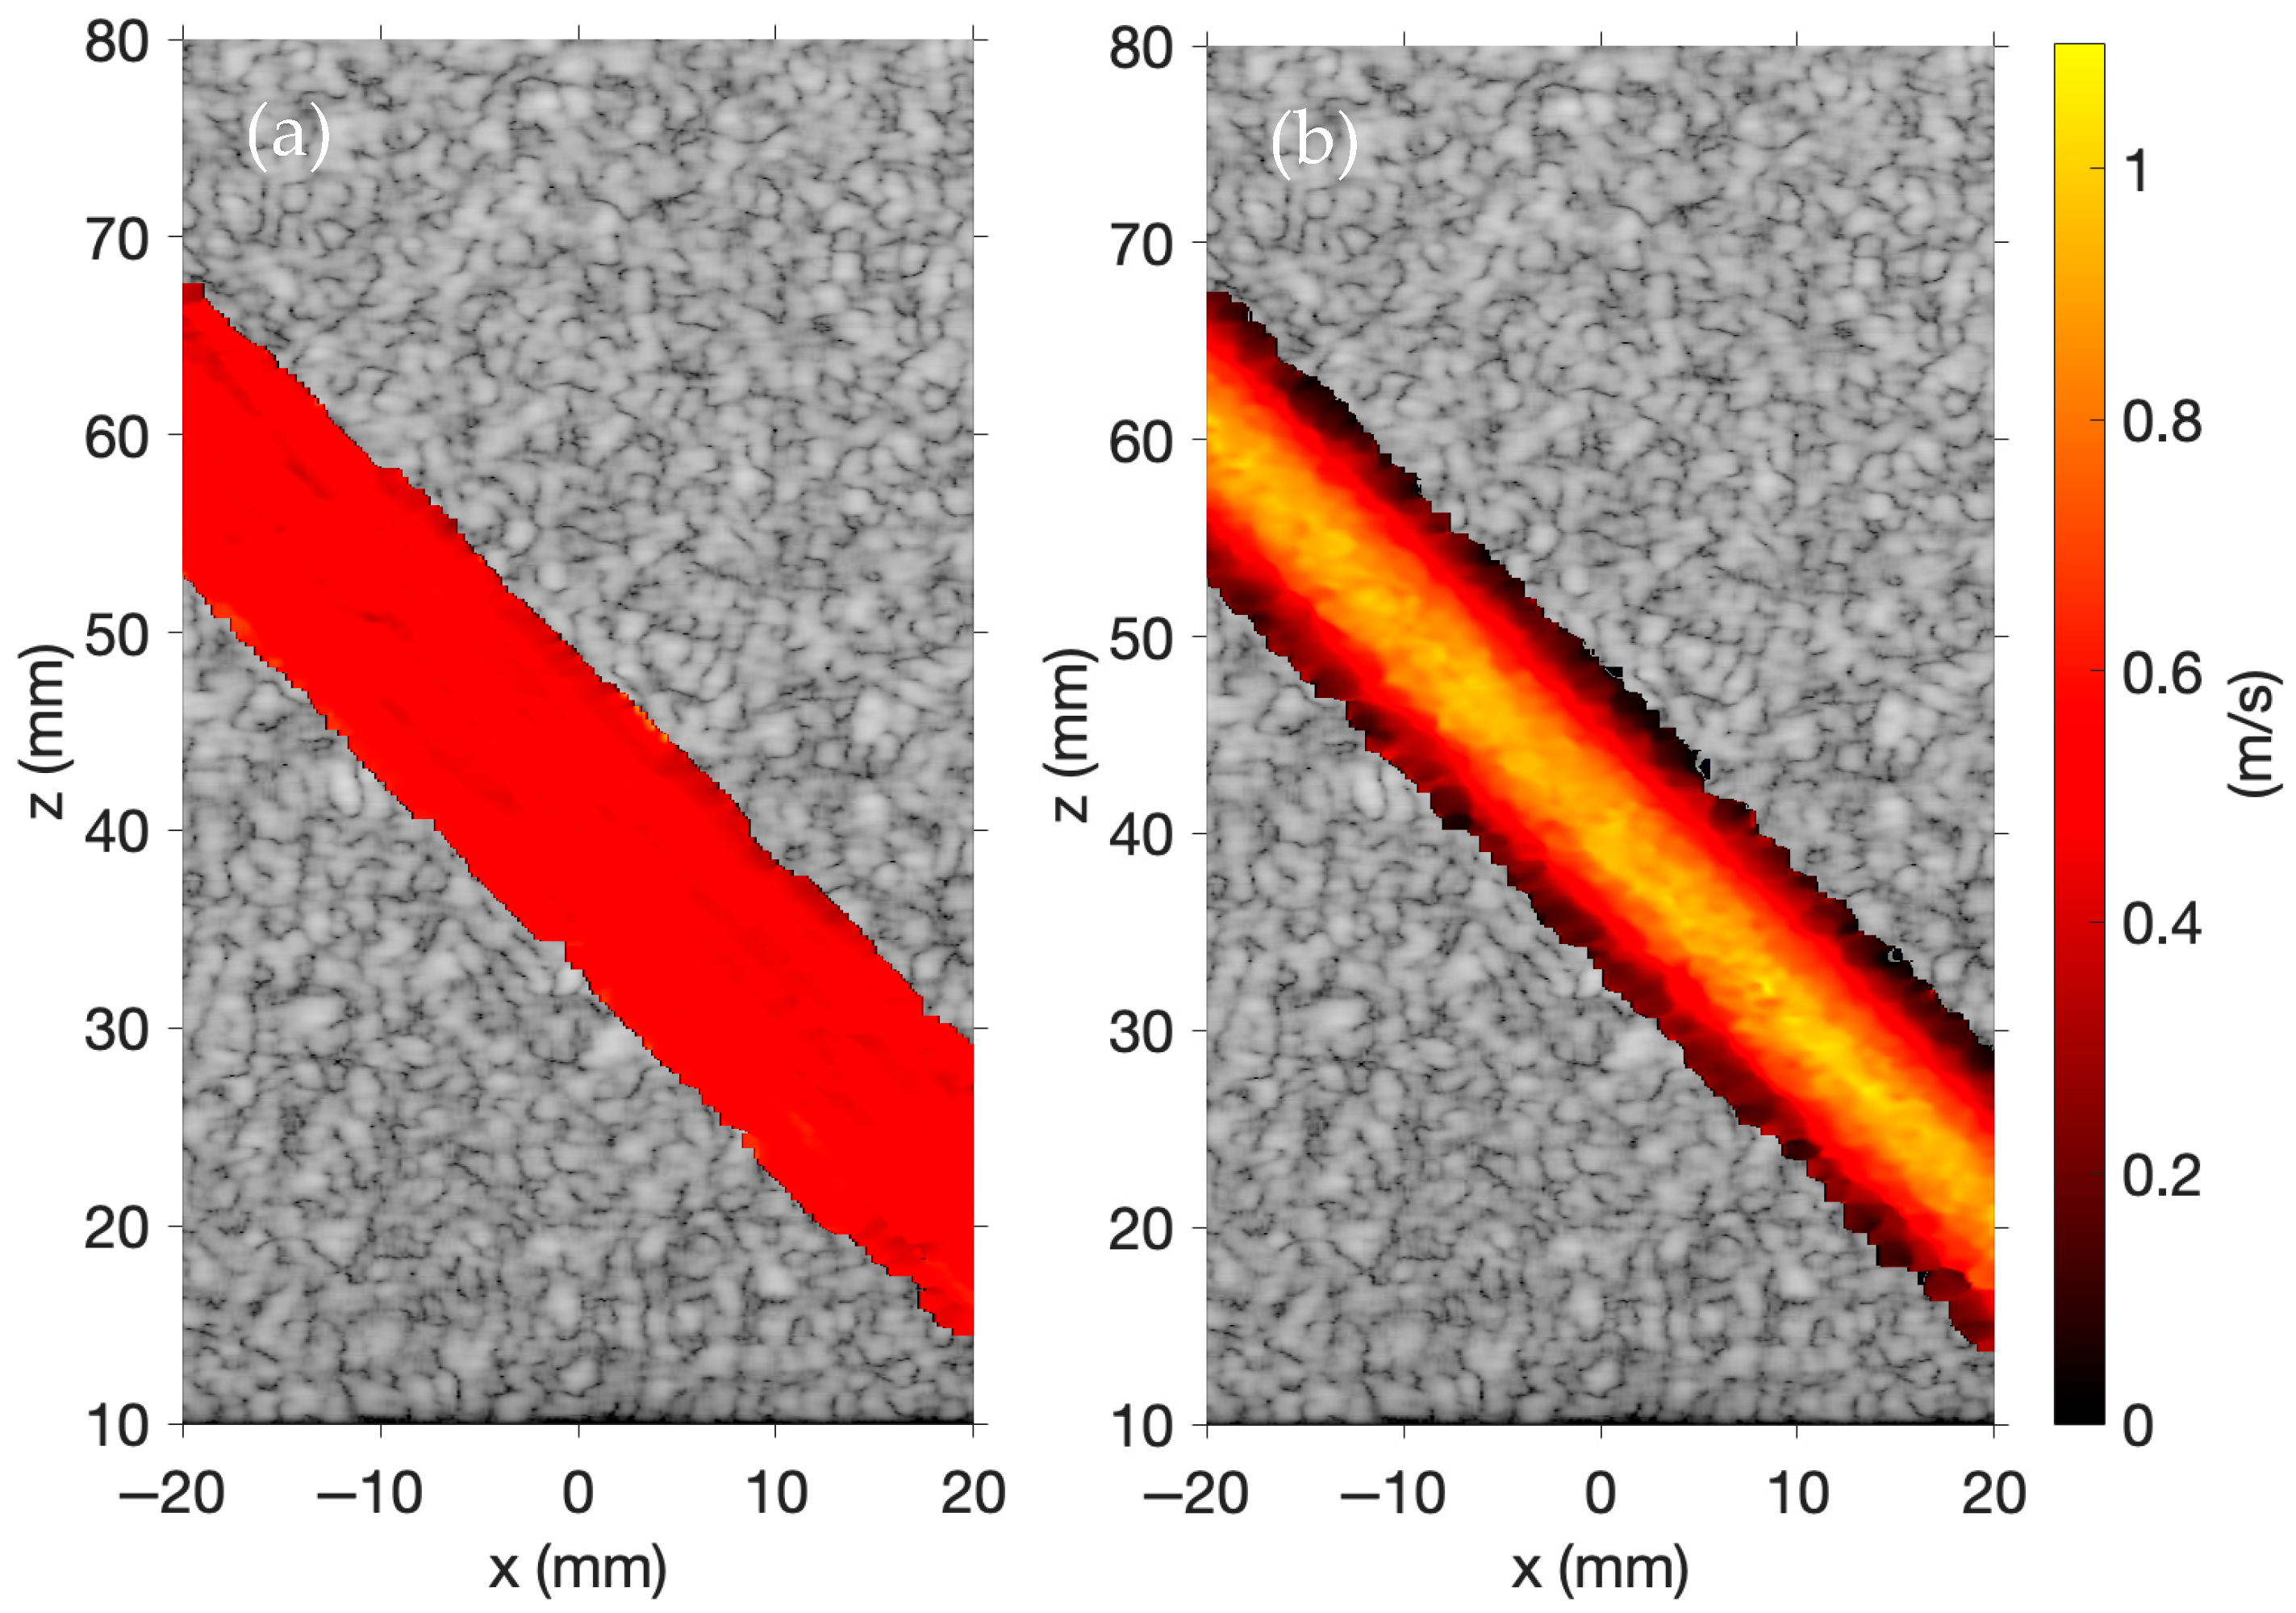
To produce the color Doppler images in
Figure 5, the time-varying waveforms are given by
and
. These correspond to a four-cycle sinusoidal waveform and a one-cycle sinusoidal waveform, each with a center frequency of 2.5 MHz. Both simulations define a temporal sampling frequency of 20 MHz, a sound speed of 1540 m/s, and a density of 1000 kg/m
3. The 256-element linear array of rectangular transducers defined for these simulations is centered at
. The transducer width is 0.3 mm, the height is 7 mm, and the kerf is 0.05 mm.
A set of 50,000 moving scatterers is generated to mimic the flow dynamics of a carotid artery. These scatterers are randomly distributed within a 3D vessel with a radius of 5 mm, oriented at a 45° angle, and positioned 40 mm away from the transducer array. Additionally, 50,000 static scatterers are also generated, randomly distributed within a 60 × 10 × 70 mm region, excluding the space occupied by the vessel, positioned 10 mm away from the transducer array. The amplitudes of the moving and static scatterers follow Gaussian distributions with a mean of 0 and variances of 1 and 625, respectively.
Laminar blood flow in
Figure 5a is modeled with a flow velocity of 0.5 m/s, and parabolic blood flow in
Figure 5b is modeled with a peak flow velocity of 1.0 m/s. These images are inspired by a similar image shown on the Field II website [
31]. In Field II, color Doppler imaging is performed using B-mode imaging, whereas FOCUS supports color Doppler imaging using either B-mode imaging or plane wave imaging. RF data is obtained using five plane waves steered across five evenly spaced transmit angles spanning from −6° to +6°. For delay-and-sum beamforming, the
z-axis focal depths range from 10 mm to 80 mm in increments of 1 mm and the
x-axis focal depths range from −20 mm to 20 mm in increments of 0.1569 mm. The f-number for the delay-and-sum beamforming is 1.5. A pulse repetition frequency of 5 kHz is used, with 50 total acquisitions—10 scans are performed at each of the five transmit angles. Flow velocities are estimated with a 1D autocorrelation phase-based estimator. Portions of the RF data with magnitudes below a 4 dB cutoff after normalization are set to zero. A Hamming moving spatial average filter is then applied with a height of 1.54 mm and a width of 1.57 mm.
Figure 5 demonstrates that color Doppler imaging is effectively simulated using plane wave imaging in FOCUS. The laminar and parabolic flow profiles of the moving scatterers are evident in each image.
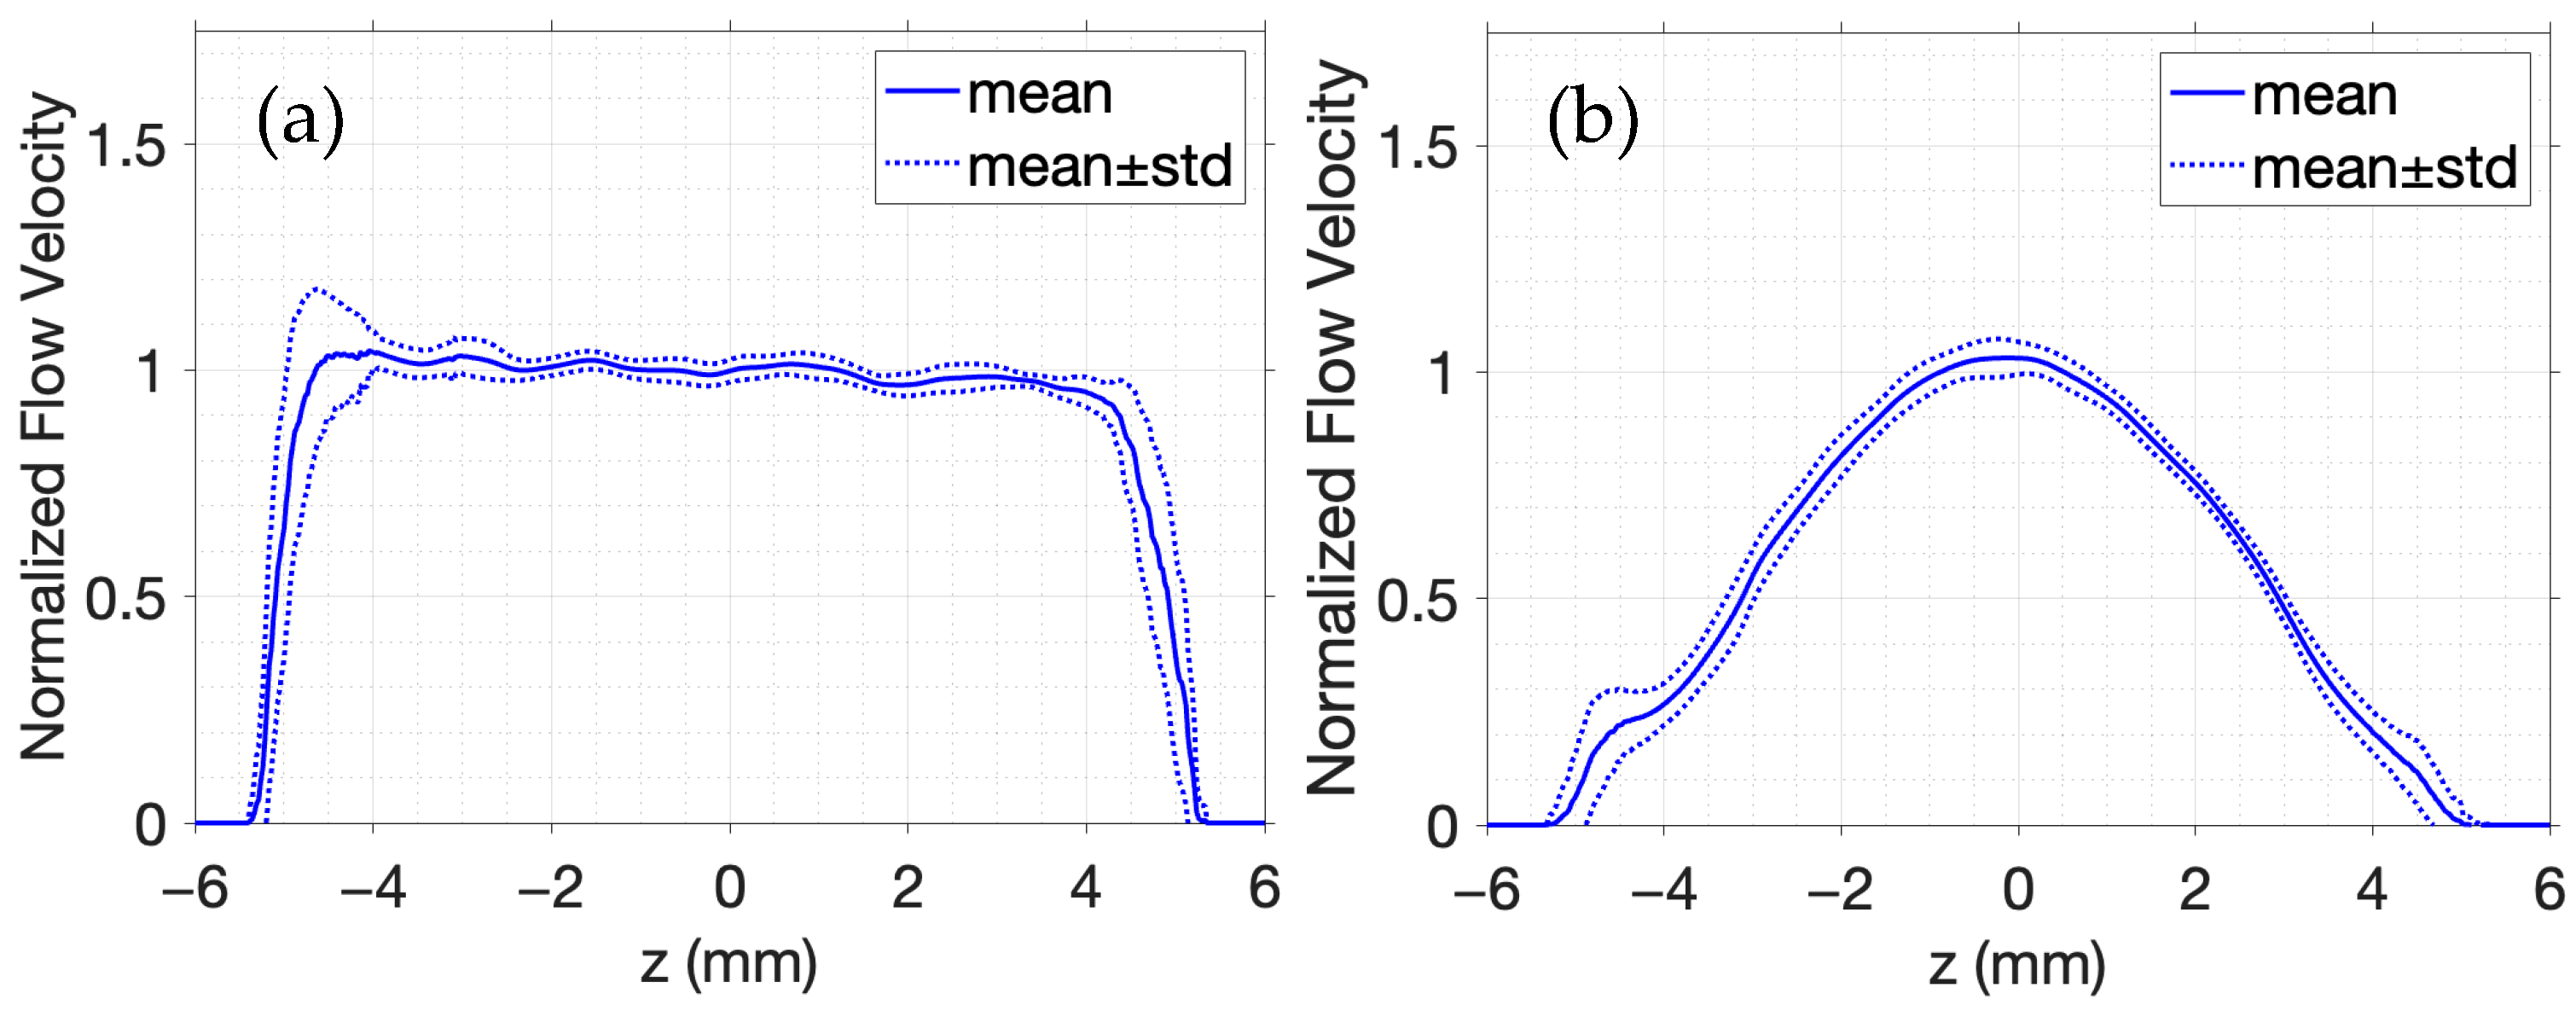
In
Figure 6, the velocity estimates are averaged across all A-lines within the artery interior in addition to a 1 mm region immediately outside the vessel walls on either side. Each profile is normalized by the peak velocity estimate at
. The expected flow trends are accurately captured by
Figure 6, where a flat profile in
Figure 6a confirms uniform laminar flow, and a curved profile in
Figure 6b reflects the parabolic velocity distribution typical of fully developed flow in a vessel. In
Figure 6b, the peak velocity occurs at the vessel center and decreases toward the walls, as expected. The 1D autocorrelation phase-based estimator reliably distinguishes between the laminar and parabolic flow profiles, demonstrating the capability of simulated color Doppler imaging to describe flow patterns.
3.2. Model Convergence
The simulation parameters associated with
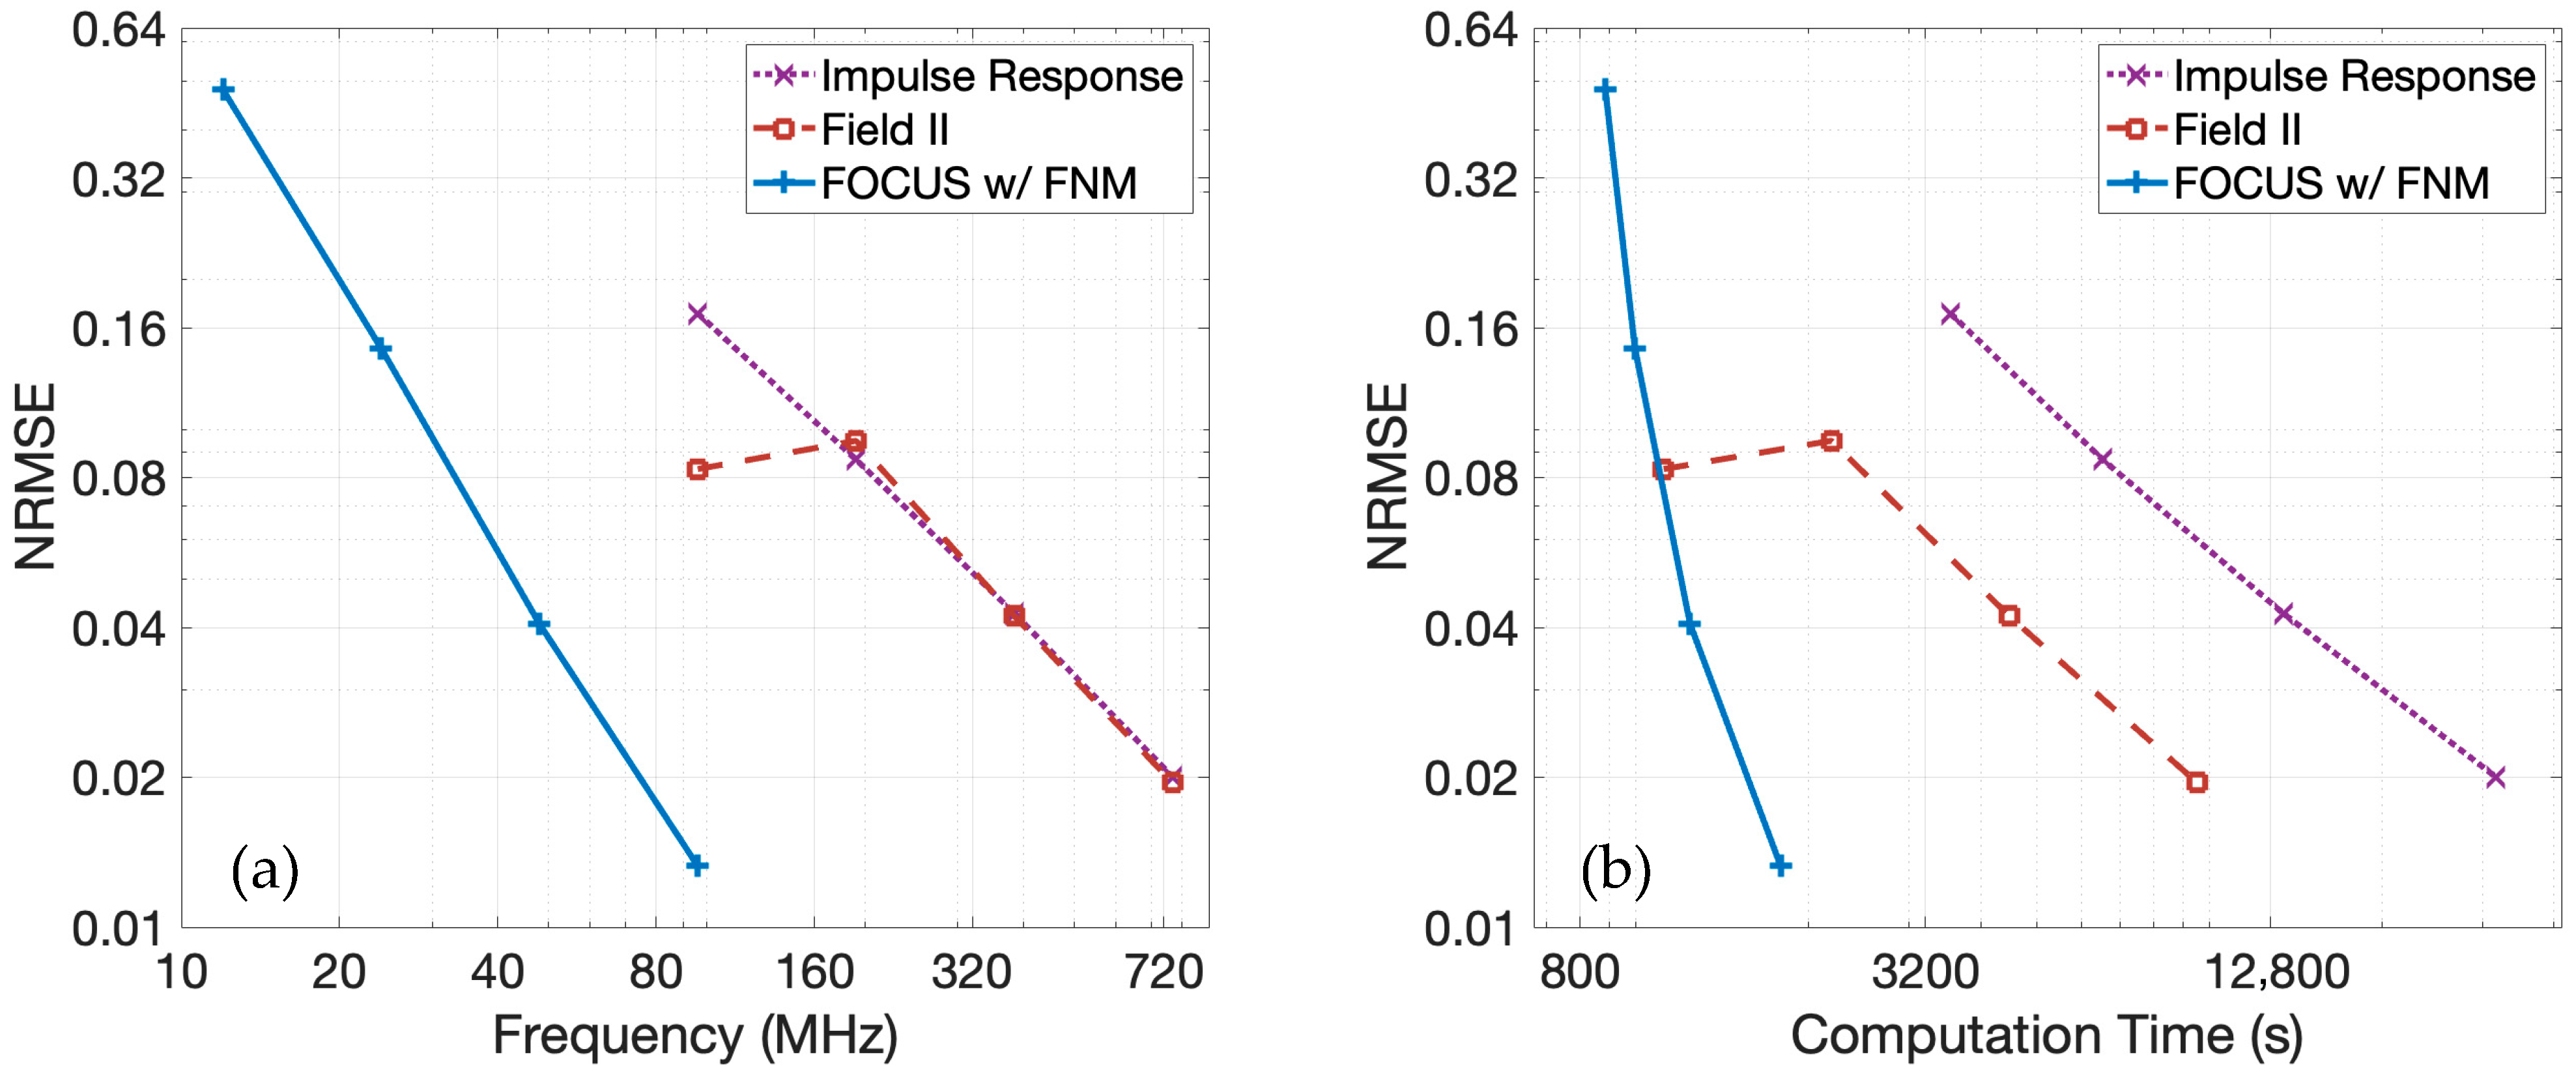
Figure 2c are also evaluated to compare the convergence properties of the pulse-echo model with the fast nearfield method to the pulse-echo model with spatial impulse responses and to Field II (version 4.11, compiled for Apple Silicon Macs). For Field II simulations, the rectangular transducers of the linear array were spatially discretized by concatenating six equal-sized vertical sub-elements to facilitate comparisons with fast nearfield method calculations that incorporate six abscissas for integration. Since the pulse-echo model with the fast nearfield method is analytically equivalent to the pulse-echo model with spatial impulse responses, both are expected to ultimately converge to the same result as the temporal sampling frequency increases. Field II simulations are also analytically equivalent to pulse-echo simulations with spatial impulse responses, but Field II applies a far-field approximation. Since the simulations are conducted in the far-field, convergence to the solution obtained with the spatial impulse response is expected. The reference RF data is generated using spatial impulse responses with a temporal sampling frequency of 3.072 GHz. The RF data is computed for simulations using spatial impulse responses and Field II at temporal sampling frequencies of 96, 192, 384, and 768 MHz. Since FOCUS attains reference-level accuracy by 96 MHz, FOCUS simulations are performed at temporal sampling frequencies of 12, 24, 48, and 96 MHz. Because Field II omits the three temporal-derivative terms in Equation (1), the normal velocities
and
were differentiated prior to convolution, and the resulting RF data from Field II also underwent a differentiation to restore all three temporal-derivative contributions. Furthermore, Field II excludes the scale factor
from Equation (1). Therefore, the RF data from Field II was also multiplied by this scale factor to facilitate a direct comparison.
Figure 7a shows the normalized root-mean-square error (NRMSE) for each method as a function of temporal sampling frequency relative to the 3.072 GHz spatial impulse response reference. The NRMSE is evaluated over the echo-containing portions of the RF data. The pulse-echo model using the fast nearfield method, the pulse-echo model using spatial impulse responses, and the pulse-echo model with Field II all converge toward the reference solution as the temporal sampling frequency increases. However, the convergence slope is steepest for the fast nearfield method, indicating the fastest rate of convergence. Additionally, the NRMSE for the fast nearfield method is lower than that of the spatial impulse responses and Field II when these are evaluated at the same temporal sampling frequency, suggesting not only faster convergence at a given temporal sampling frequency but also superior accuracy at each temporal sampling frequency.
The NRMSE as a function of computation time is presented in
Figure 7b. For all three methods, especially at higher frequencies, the computation time increases approximately linearly with increased temporal sampling frequencies. When comparing the pulse-echo model with the fast nearfield method to the pulse-echo model with spatial impulse responses, the fast nearfield method consistently achieves lower NRMSE with shorter computation times. A direct comparison between the pulse-echo model with the fast nearfield method in FOCUS and the spatial impulse response in Field II simulations reveals a distinct performance trade-off. At higher temporal sampling frequencies targeting lower NRMSE, the fast nearfield method approach is significantly faster than Field II. Both spatial impulse responses and Field II exhibit only modest error reduction with increased temporal sampling frequency, despite substantial increases in runtime, resulting in relatively shallow error–time curves. In contrast, the fast nearfield method in FOCUS generates a steep error–time curve, demonstrating that even large decreases in NRMSE require only modest additional computation time. For instance, FOCUS simulations utilizing a temporal sampling frequency of 48 MHz are completed in 20 min. To achieve comparable accuracy, Field II simulations require a much higher temporal sampling frequency of 384 MHz and about 75 min of computation time. Furthermore, when aiming for even lower errors, FOCUS simulations at 96 MHz finish in 30 min, whereas Field II requires 159 min with a temporal sampling frequency of 768 MHz. Consequently, the fast nearfield method approach also benefits from lower memory requirements, since memory scales linearly with temporal sampling frequency in these simulations.
Figure 8 presents results obtained with the same transducer array and imaging parameters evaluated in
Figure 7 to scatterers in the nearfield. To maintain a consistent scatterer density with the previous convergence profiling, 8333 scatterers are randomly distributed within a 50 × 10 × 5 mm region located 2 mm from the transducer array. The amplitudes of the scatterers followed a Gaussian distribution with a mean of 0 and a variance of 1. The reference RF data is again generated using spatial impulse responses at a temporal sampling frequency of 3.072 GHz.
For these calculations, the fast nearfield method requires additional abscissas for Gauss–Legendre quadrature to achieve comparable convergence. To achieve NRMSE values similar to those demonstrated in the far-field in
Figure 7, 50 abscissas are defined for fast nearfield method calculations. In Field II simulations, each rectangular array element is partitioned into 50 uniform sub-elements arranged in a 2 × 25 grid.
The NRMSE for each method as a function of temporal sampling frequency relative to the nearfield reference solution is displayed in
Figure 8a. The pulse-echo model using the fast nearfield method demonstrates rapid convergence as the temporal sampling frequency increases, which is consistent with the far-field results shown in
Figure 7a. In contrast, spatial impulse responses and Field II converge much more slowly in the nearfield region. As a result, the fast nearfield method achieves substantially lower NRMSE values, indicating both significantly faster convergence with increased temporal sampling frequency and markedly higher accuracy in the nearfield.
Figure 8b shows the NRMSE evaluated in the nearfield region as a function of computation time. The pulse-echo model with fast nearfield method in FOCUS consistently achieves a substantially lower NRMSE with significantly shorter computation times. These results demonstrate that the pulse-echo model with fast nearfield method is well suited for nearfield simulations. In contrast, spatial impulse responses, even with many sub-elements in Field II simulations, exhibit poor convergence in the nearfield and require prohibitively high temporal sampling frequencies to achieve comparable accuracy, resulting in much longer computation times with increased memory requirements.
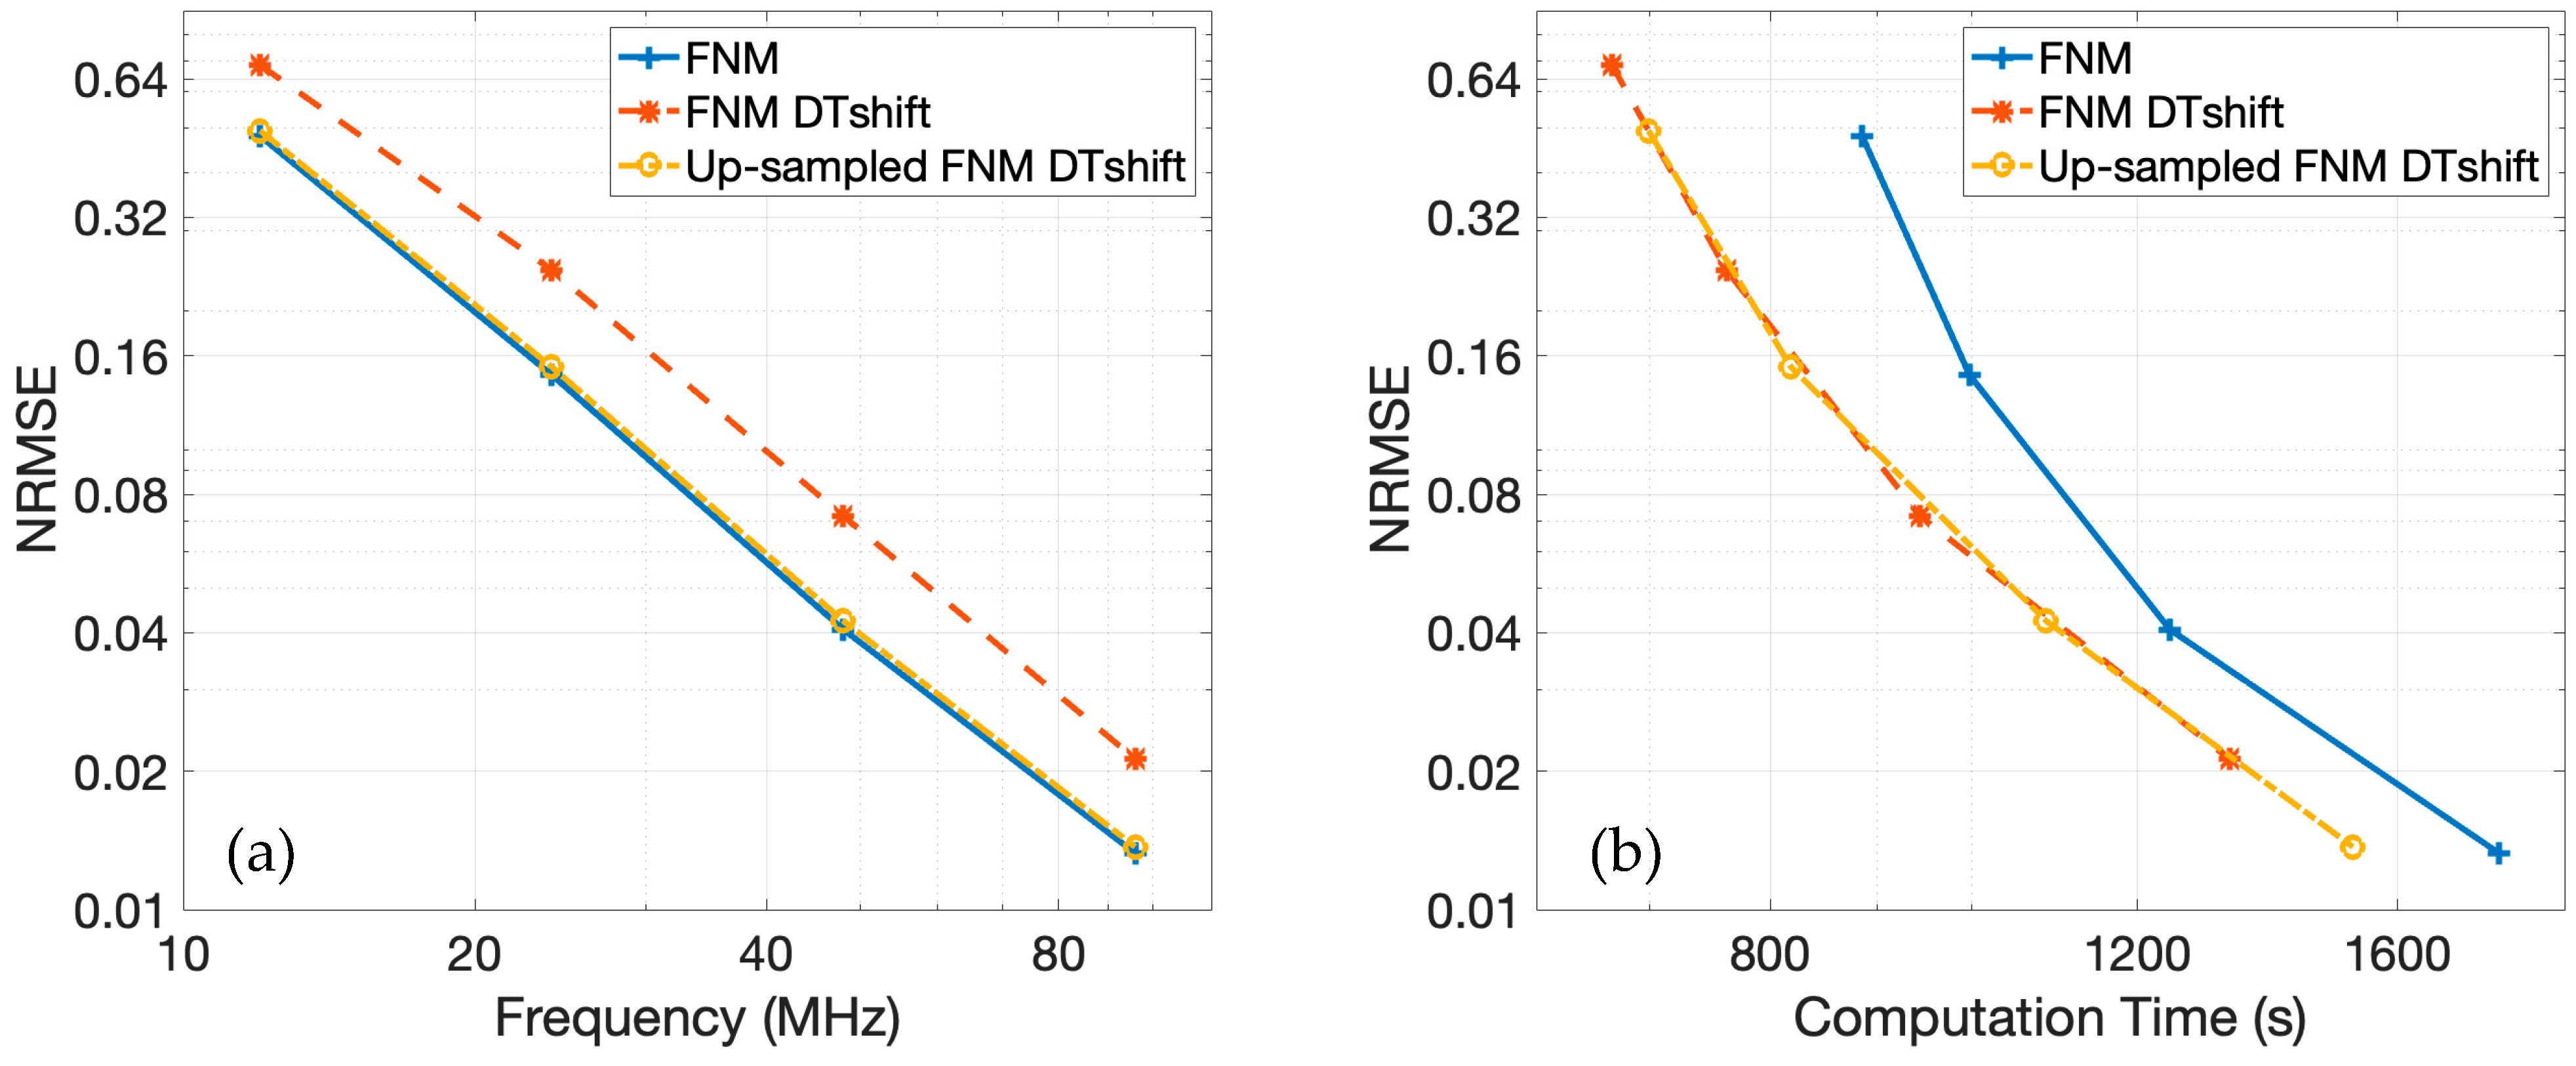
The parameters defined for the simulations shown in
Figure 2c are again chosen to evaluate the convergence behavior of the pulse-echo model with the fast nearfield method. For this evaluation, three different approaches were employed: the fast nearfield method; the fast nearfield method with discrete-time shifting and linear interpolation; and the upsampled fast nearfield method with discrete-time shifting, linear interpolation, and downsampling prior to convolution. The reference RF data used for these comparisons is identical to the reference RF data in
Figure 7, which is generated using spatial impulse responses at a temporal sampling frequency of 3.072 GHz. The RF data for each of the three approaches is then computed at temporal sampling frequencies of 12, 24, 48, and 96 MHz. Upsampled fast nearfield method calculations are computed at four times the respective temporal sampling frequencies—namely 48, 96, 192, and 384 MHz.
Figure 9a presents the NRMSE for each of the three fast nearfield method approaches across various temporal sampling frequencies relative to the reference. The NRMSE for the baseline fast nearfield method matches the result shown in
Figure 7a. Incorporating discrete-time shifting and linear interpolation introduces some additional error, as indicated by the corresponding NRMSE curve, which follows a similar convergence trend but remains consistently elevated. This error is effectively mitigated when the fast nearfield method calculations are upsampled prior to discrete-time shifting, linear interpolation, and downsampling. The NRMSE curve for this upsampled approach closely aligns with the baseline fast nearfield method approach, demonstrating that upsampling eliminates the aliasing artifacts introduced by linear interpolation.
The NRMSE as a function of computation time for the temporal sampling frequencies of 12, 24, 48, and 96 MHz across all three approaches is presented in
Figure 9b. The NRMSE curves corresponding to the approaches that incorporate discrete-time shifting are shifted leftward relative to the baseline fast nearfield method approach, indicating reduced computation times. This demonstrates that discrete-time shifting effectively accelerates these simulations, particularly when simulating multiple plane wave images. Among the three approaches, the fast nearfield method with discrete-time shifting and linear interpolation yields the shortest computation times but exhibits increased error. The upsampled fast nearfield method approach offers a favorable trade-off. While slightly slower than the fastest approach, the upsampled fast nearfield method maintains NRMSE values nearly identical to those obtained by the baseline fast nearfield method. The upsampled fast nearfield method with discrete-time shifting thus achieves an appropriate balance between computational efficiency and accuracy. These results suggest that the upsampled fast nearfield method approach is best suited for efficient simulations of plane wave imaging. By combining the speed advantages of discrete-time shifting with the accuracy gains from upsampled fast nearfield method calculations, the method delivers an effective balance of accuracy and efficiency.
