
Visualizing Relaxation in Wearables: Multi-Domain Feature Fusion of HRV Using Fuzzy Recurrence Plots


Abstract
Highlights
- A novel method was developed to convert HRV time series into textured images using fuzzy recurrence plots (FRPs) based on fuzzy set theory.
- The model achieved 96.6% classification accuracy for relaxation states using only three selected features across multiple domains.
- The model enables both visual and automated interpretation of physiological changes during relaxation, enhancing transparency and user engagement.
- The model is suitable for real-time integration into low-power wearable devices for stress monitoring and biofeedback.
Abstract
1. Introduction
2. Materials and Methods
2.1. Participants
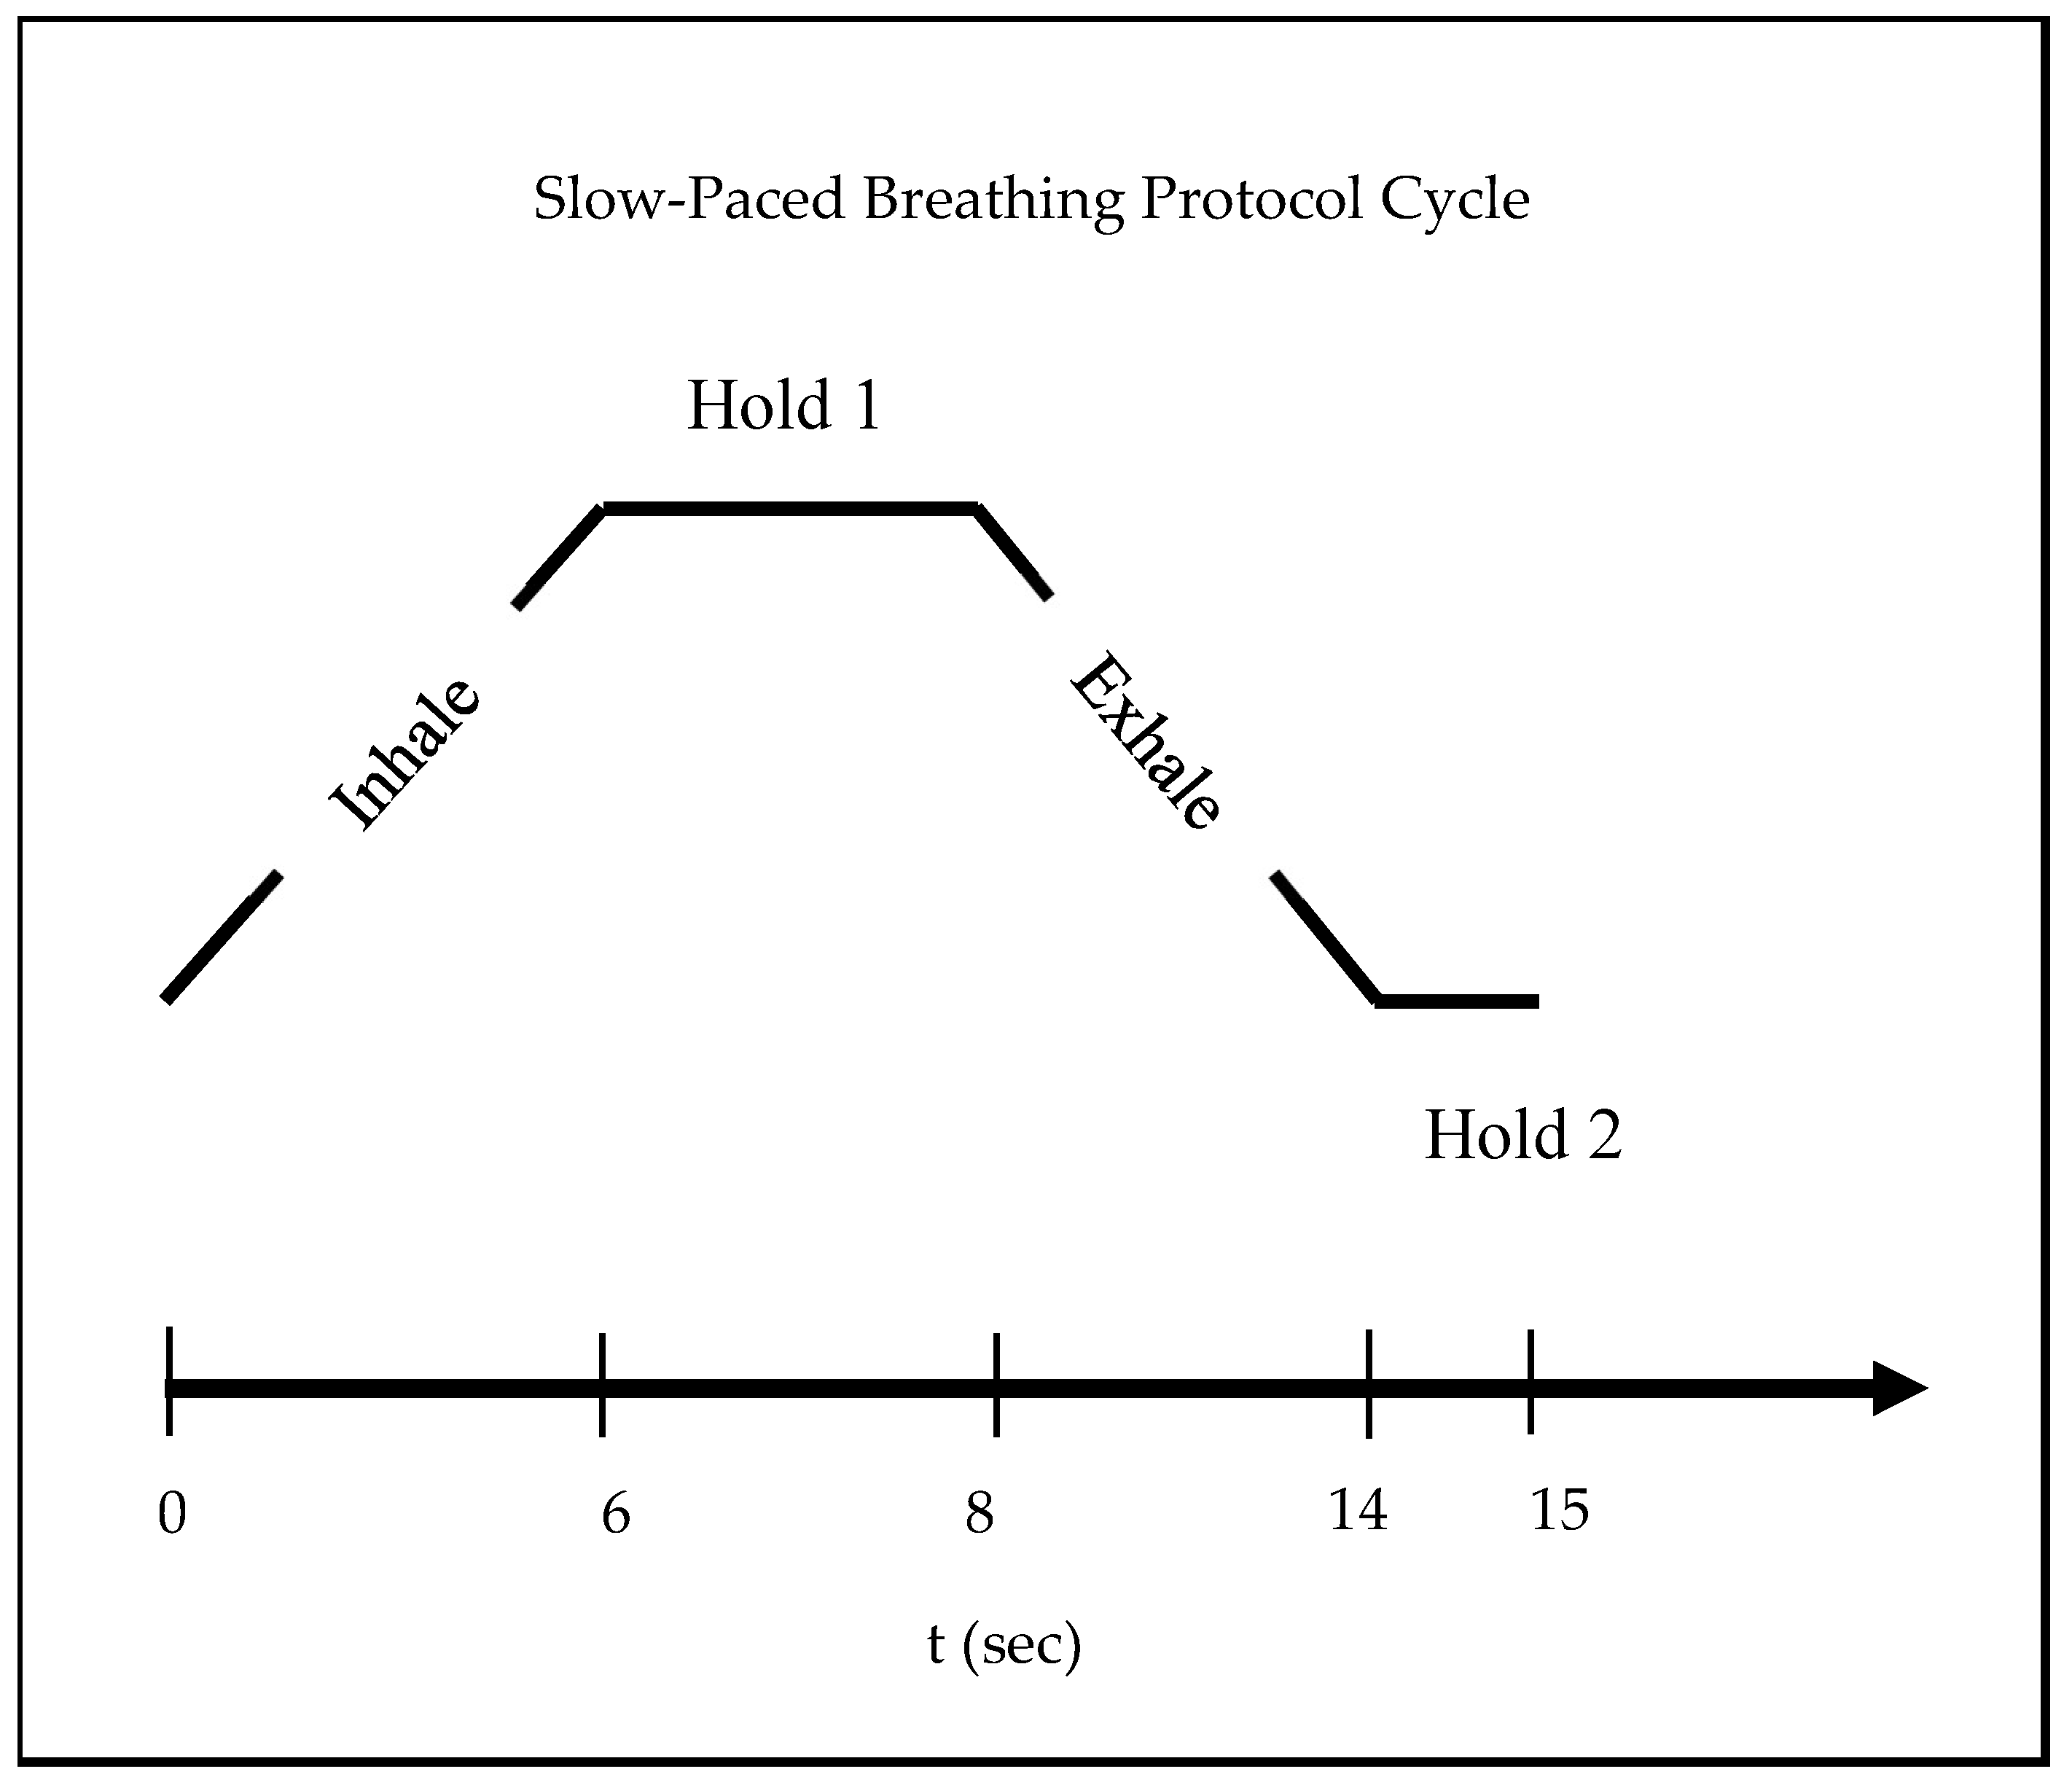
2.2. Experimental Protocol
2.3. Data Acquisition
2.4. Analysis of HRV Time Series
2.4.1. Time-Domain, Frequency-Domain, and Graphical HRV Features
2.4.2. Non-Linear HRV Features Using Entropy
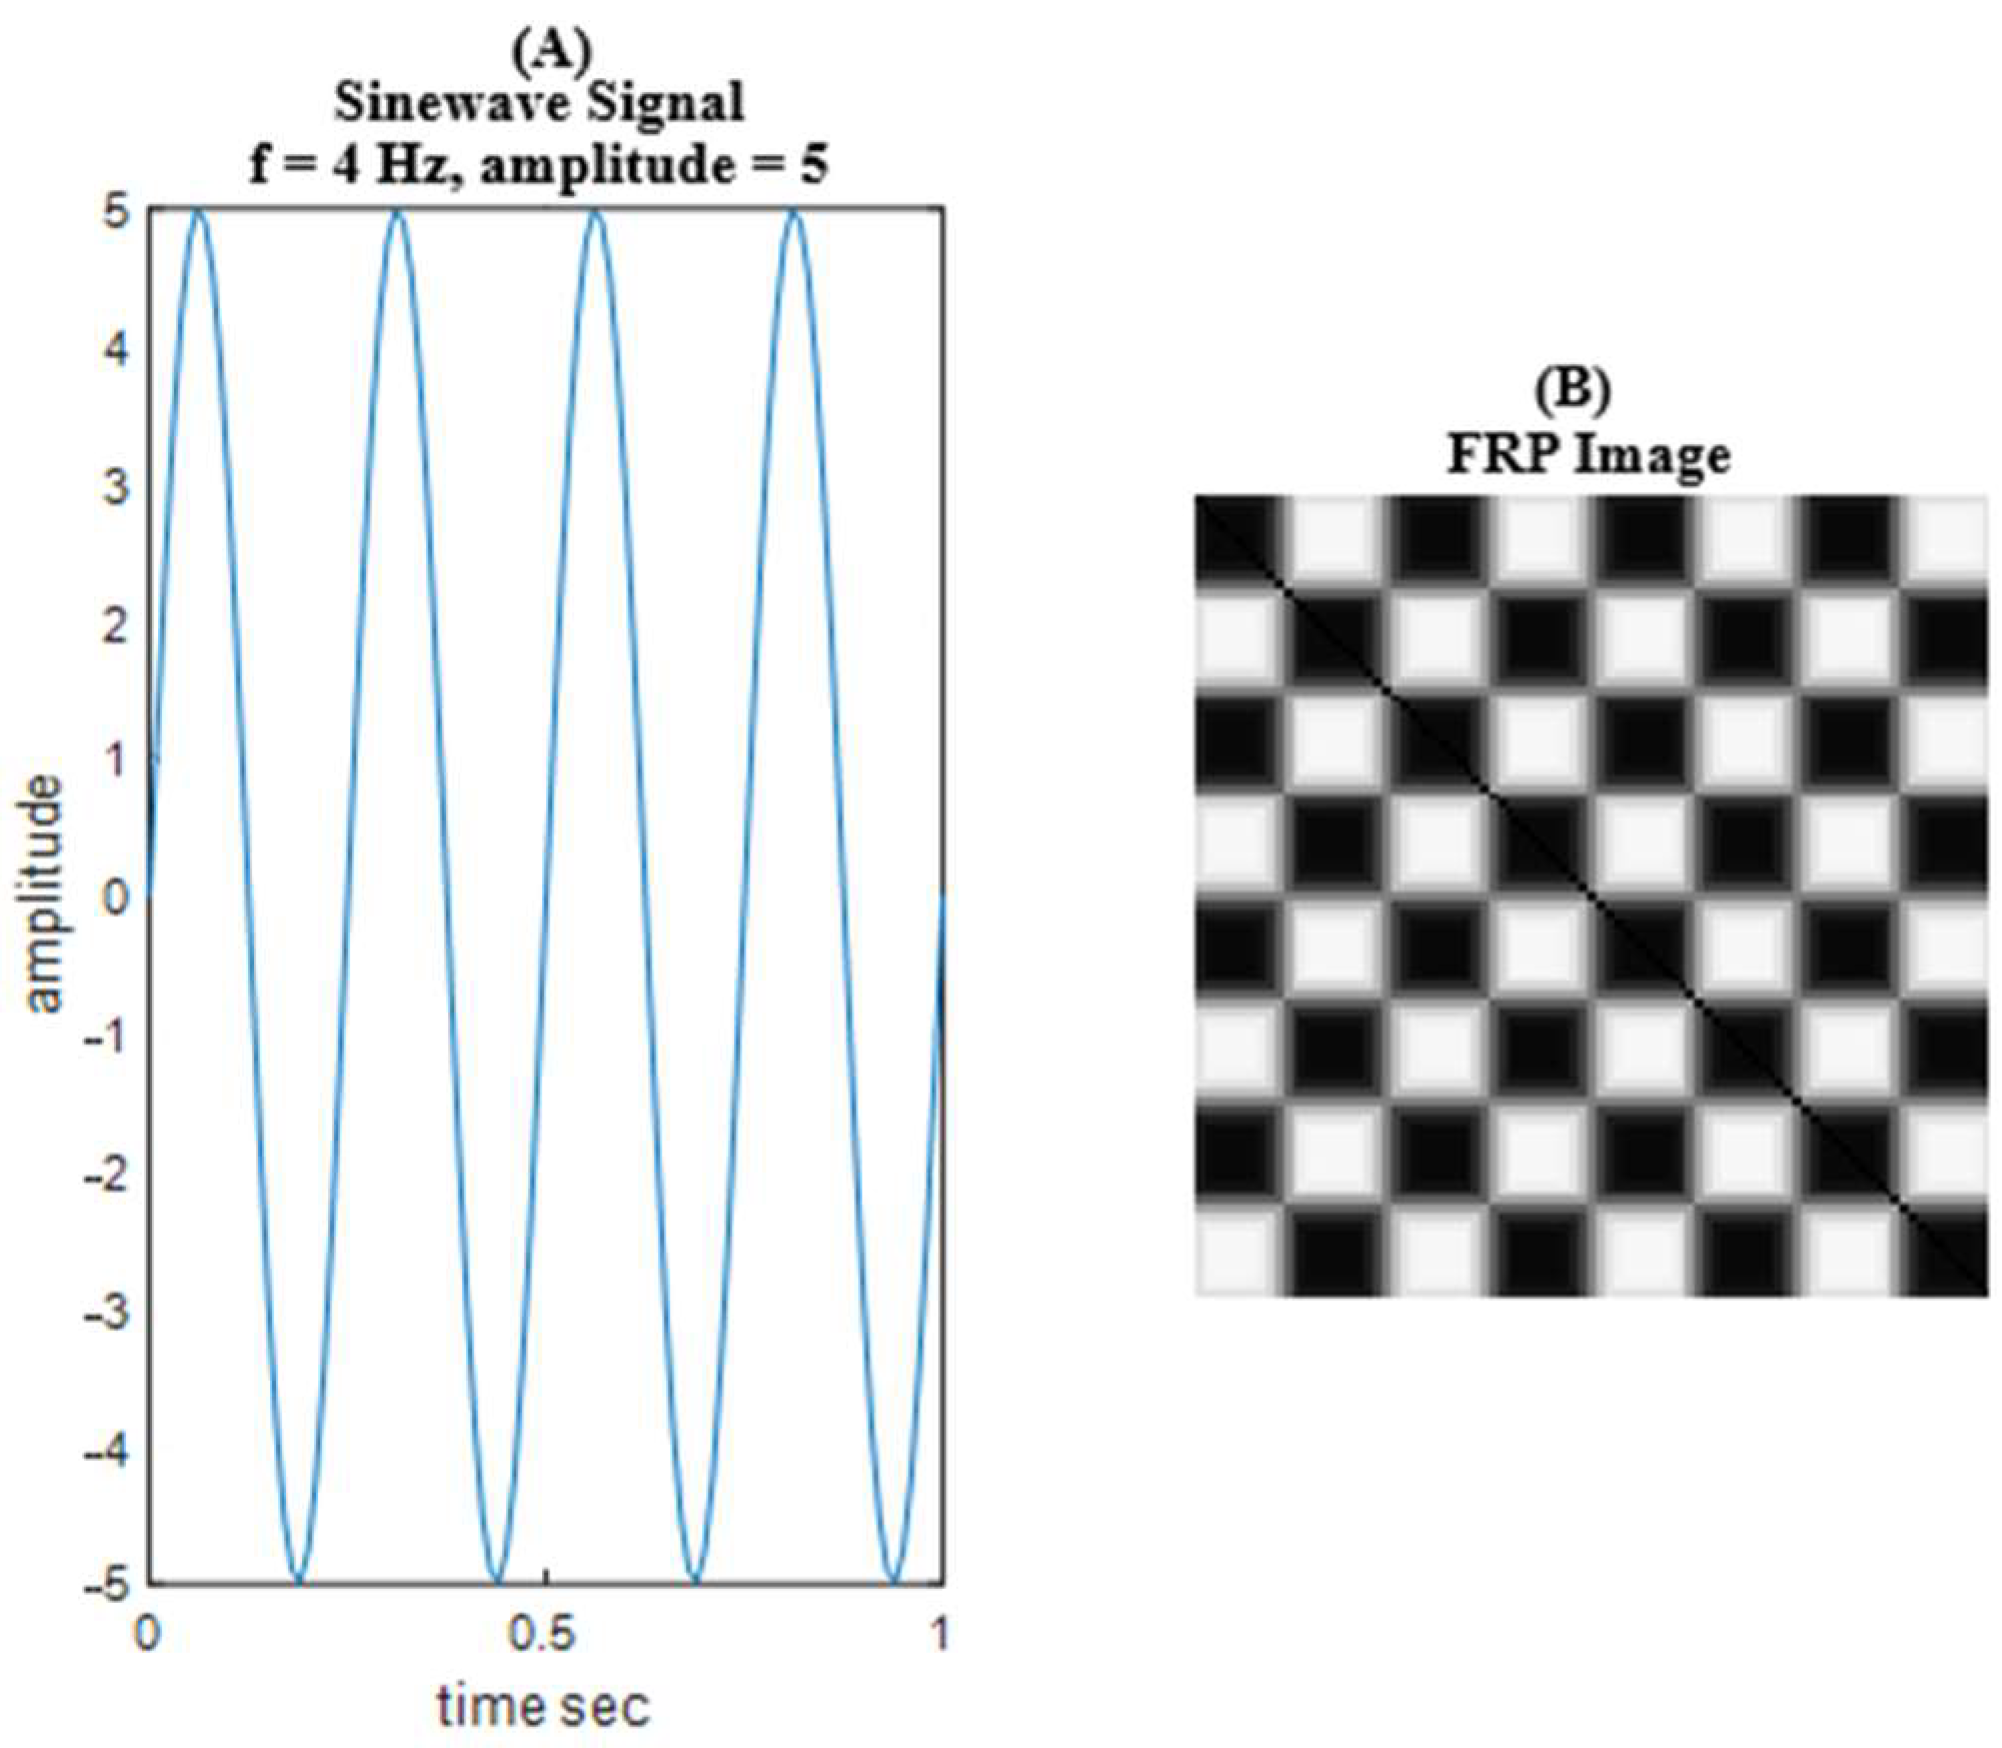
2.4.3. Time-Series to Image Conversion Using FRP
- Reflexivity:
- Symmetry:
- Transitivity:
2.5. Statistical Analysis
2.6. Feature Selection and Reduction Method
- Fisher’s Discriminant Ratio
- Correlation Matrix
- Classifier Subset Evaluator (CSE)
2.7. Classifier and Performance Parameters for Relaxation Detection
3. Results
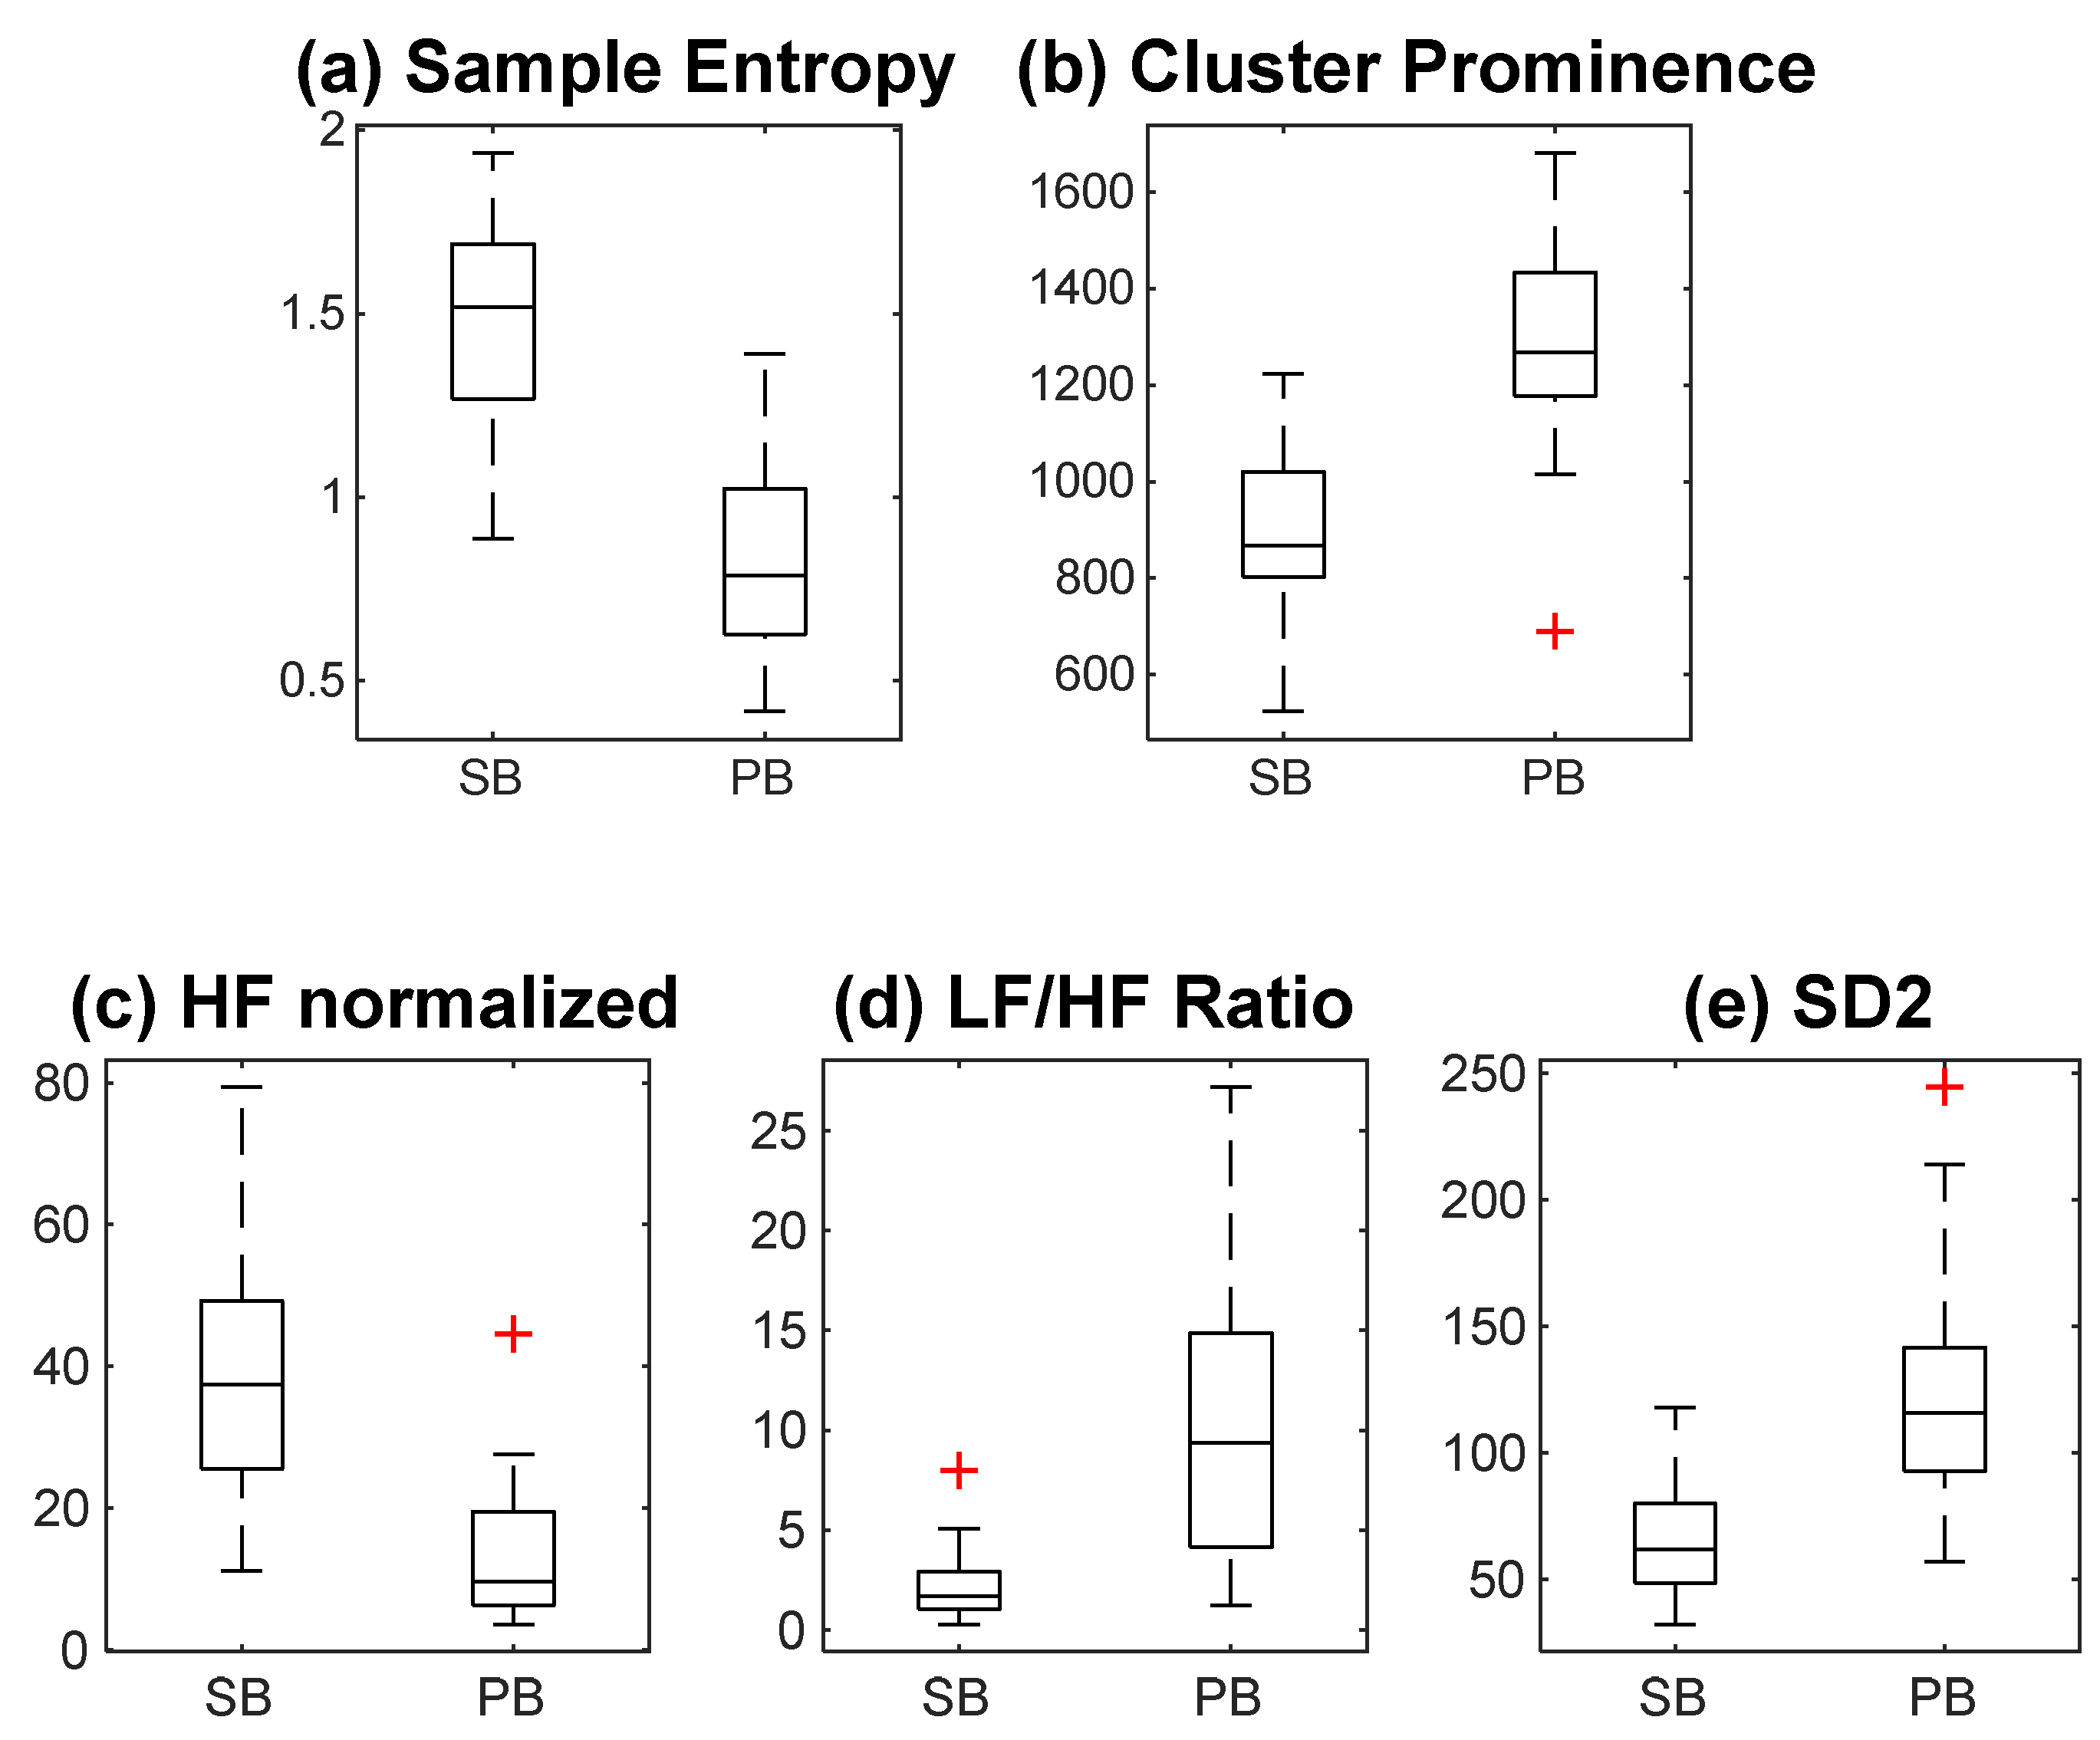
3.1. Multi-Domain Analysis of HRV Features
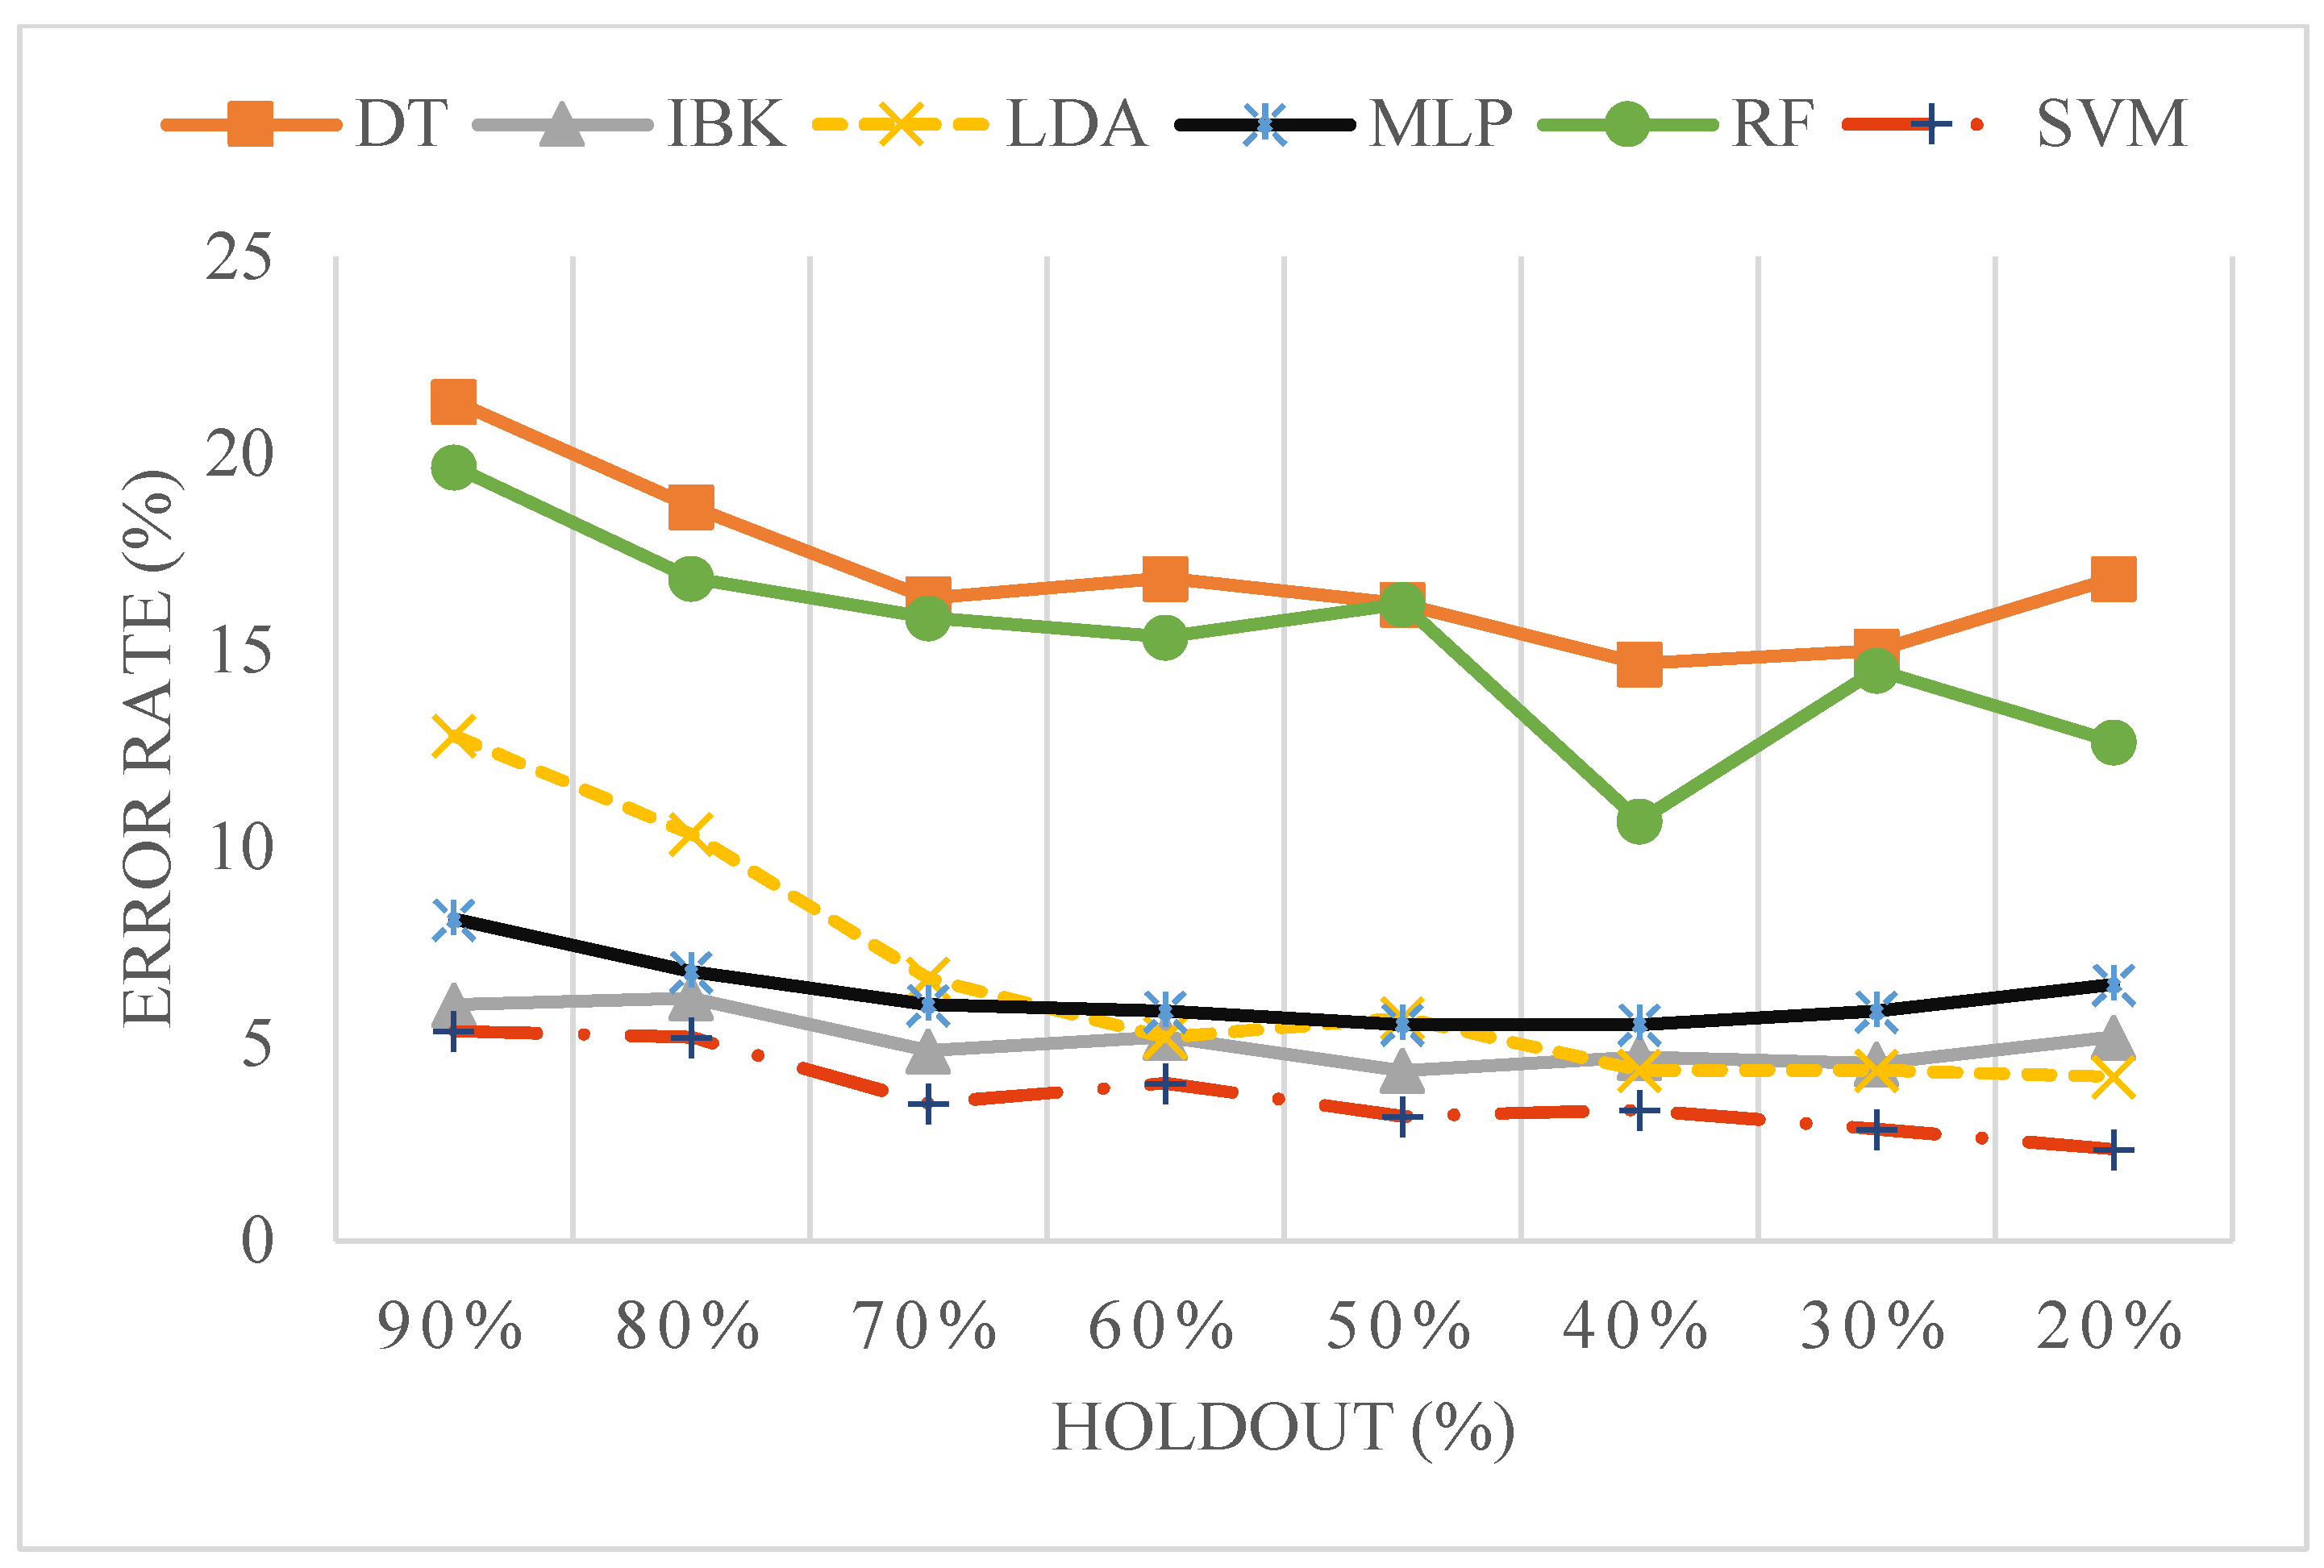
3.2. Classification of HRV Time Series
4. Discussion
5. Conclusions
Supplementary Materials
Author Contributions
Funding
Institutional Review Board Statement
Informed Consent Statement
Data Availability Statement
Acknowledgments
Conflicts of Interest
Abbreviations
| ECG | Electrocardiograms |
| HRV | Heart rate variability |
| FRP | Fuzzy recurrence plot |
| SVM | Support vector machine |
| ANS | Autonomic nervous system |
| PNS | Parasympathetic nervous system |
| SNS | Sympathetic nervous system |
| HR | Heart rate |
| RSA | Respiratory sinus arrhythmia |
| FDR | Fisher discriminant ratio |
| GLCM | Grey level co-variance matrix |
| RBC | Rank–biserial correlation |
References
- Hjortskov, N.; Rissén, D.; Blangsted, A.K.; Fallentin, N.; Lundberg, U.; Søgaard, K. The Effect of Mental Stress on Heart Rate Variability and Blood Pressure during Computer Work. Eur. J. Appl. Physiol. 2004, 92, 84–89. [Google Scholar] [CrossRef] [PubMed]
- Tavares, B.S.; de Paula Vidigal, G.; Garner, D.M.; Raimundo, R.D.; de Abreu, L.C.; Valenti, V.E. Effects of Guided Breath Exercise on Complex Behaviour of Heart Rate Dynamics. Clin. Physiol. Funct. Imaging 2017, 37, 622–629. [Google Scholar] [CrossRef] [PubMed]
- Campbell, I.N.; Gallagher, M.; McLeod, H.J.; O’Neill, B.; McMillan, T.M. Brief Compassion Focused Imagery for Treatment of Severe Head Injury. Neuropsychol. Rehabil. 2019, 29, 917–927. [Google Scholar] [CrossRef] [PubMed]
- Ooishi, Y.; Mukai, H.; Watanabe, K.; Kawato, S.; Kashino, M. Increase in Salivary Oxytocin and Decrease in Salivary Cortisol after Listening to Relaxing Slow-Tempo and Exciting Fast-Tempo Music. PLoS ONE 2017, 12, e0189075. [Google Scholar] [CrossRef]
- Ikei, H.; Song, C.; Miyazaki, Y. Effects of Olfactory Stimulation by α-Pinene on Autonomic Nervous Activity. J. Wood Sci. 2016, 62, 568–572. [Google Scholar] [CrossRef]
- SOYAMA, I. Effects of Moderate Exercise on Relieving Mental Load of Elementary School Teachers. Jpn. J. Educ. Psychol. 2014, 62, 305–321. [Google Scholar] [CrossRef]
- Zaccaro, A.; Piarulli, A.; Laurino, M.; Garbella, E.; Menicucci, D.; Neri, B.; Gemignani, A. How Breath-Control Can Change Your Life: A Systematic Review on Psycho-Physiological Correlates of Slow Breathing. Front. Hum. Neurosci. 2018, 12, 353. [Google Scholar] [CrossRef]
- Laohakangvalvit, T.; Sripian, P.; Nakagawa, Y.; Feng, C.; Tazawa, T.; Sakai, S.; Sugaya, M. Study on the Psychological States of Olfactory Stimuli Using Electroencephalography and Heart Rate Variability. Sensors 2023, 23, 4026. [Google Scholar] [CrossRef]
- Lehrer, P.M.; Vaschillo, E.; Vaschillo, B. Resonant Frequency Biofeedback Training to Increase Cardiac Variability: Rationale and Manual for Training. Appl. Psychophysiol. Biofeedback 2000, 25, 177–191. [Google Scholar] [CrossRef]
- Hoshiyama, M.; Hoshiyama, A. Heart Rate Variability Associated with Different Modes of Lower Abdominal Muscle Tension during Zen Meditation. In Proceedings of the Computing in Cardiology 2014, Cambridge, MA, USA, 7–10 September 2014; Volume 2014, pp. 561–565. [Google Scholar]
- Lin, I.M.; Tai, L.Y.; Fan, S.Y. Breathing at a Rate of 5.5breaths per Minute with Equal Inhalation-to-Exhalation Ratio Increases Heart Rate Variability. Int. J. Psychophysiol. 2014, 91, 206–211. [Google Scholar] [CrossRef]
- Bouny, P.; Arsac, L.M.; Guérin, A.; Nerincx, G.; Deschodt-Arsac, V. Guiding Breathing at the Resonance Frequency with Haptic Sensors Potentiates Cardiac Coherence. Sensors 2023, 23, 4494. [Google Scholar] [CrossRef] [PubMed]
- Chandra, S.; Sharma, G.; Sharma, M.; Jha, D.; Mittal, A.P. Workload Regulation by Sudarshan Kriya: An EEG and ECG Perspective. Brain Inform. 2017, 4, 13–25. [Google Scholar] [CrossRef] [PubMed]
- Sahambi, J.S.; Tandon, S.N.; Bhatt, R.K.P. Using Wavelet Transforms for ECG Characterization. IEEE Eng. Med. Biol. Mag. 1997, 16, 77–83. [Google Scholar] [CrossRef]
- Sahambi, J.S.; Tandon, S.N.; Bhatt, R.K.P. Quantitative Analysis of Errors Due to Power-Line Interference and Base-Line Drift in Detection of Onsets and Offsets in ECG Using Wavelets. Med. Biol. Eng. Comput. 1997, 35, 747–751. [Google Scholar] [CrossRef] [PubMed]
- Kabir, M.A.; Shahnaz, C. Denoising of ECG Signals Based on Noise Reduction Algorithms in EMD and Wavelet Domains. Biomed. Signal Process. Control 2012, 7, 481–489. [Google Scholar] [CrossRef]
- Salahuddin, L.; Cho, J.; Jeong, M.G.; Kim, D. Ultra Short Term Analysis of Heart Rate Variability for Monitoring Mental Stress in Mobile Settings. In Proceedings of the Annual International Conference of the IEEE Engineering in Medicine and Biology—Proceedings, Lyon, France, 22–26 August 2007; pp. 4656–4659. [Google Scholar] [CrossRef]
- Shaffer, F.; Ginsberg, J.P. An Overview of Heart Rate Variability Metrics and Norms. Front. Public Health 2017, 5, 258. [Google Scholar] [CrossRef]
- Task Force of the European Society of Cardiology and the North American Society of Pacing and Electrophysiology. Heart Rate Variability: Standards of Measurement, Physiological Interpretation and Clinical Use. Circulation 1996, 93, 1043–1065. [Google Scholar] [CrossRef]
- Cantürk, İ. A Computerized Method to Assess Parkinson’s Disease Severity from Gait Variability Based on Gender. Biomed. Signal Process. Control 2021, 66, 102497. [Google Scholar] [CrossRef]
- Pham, T.D. Texture Classification and Visualization of Time Series of Gait Dynamics in Patients with Neuro-Degenerative Diseases. IEEE Trans. Neural Syst. Rehabil. Eng. 2018, 26, 188–196. [Google Scholar] [CrossRef]
- Pham, T.D. Fuzzy Recurrence Plots. Europhys. Lett. 2016, 116, 50008. [Google Scholar] [CrossRef]
- Naz, M.; Shah, J.H.; Khan, M.A.; Sharif, M.; Raza, M.; Damaševičius, R. From ECG Signals to Images: A Transformation Based Approach for Deep Learning. PeerJ Comput. Sci. 2021, 7, e386. [Google Scholar] [CrossRef] [PubMed]
- Abubaker, M.B.; Babayigit, B. Detection of Cardiovascular Diseases in ECG Images Using Machine Learning and Deep Learning Methods. IEEE Trans. Artif. Intell. 2023, 4, 373–382. [Google Scholar] [CrossRef]
- Zhao, C.F.; Yao, W.Y.; Yi, M.J.; Wan, C.; Tian, Y. Le Arrhythmia Classification Algorithm Based on a Two-Dimensional Image and Modified EfficientNet. Comput. Intell. Neurosci. 2022, 2022, 8683855. [Google Scholar] [CrossRef]
- Wang, Y.; Zhang, Z.; Yang, W. ECG Abnormalities Classification Using Deep Learning. In Proceedings of the 2022 China Automation Congress (CAC), Xiamen, China, 25–27 November 2022; pp. 1265–1268. [Google Scholar]
- Paul, A.; Usman, J.; Ahmad, M.Y.; Hamidreza, M.; Maryam, H.; Ong, Z.C.; Hasikin, K.; Lai, K.W. Health Efficacy of Electrically Operated Automated Massage on Muscle Properties, Peripheral Circulation, and Physio-Psychological Variables: A Narrative Review. EURASIP J. Adv. Signal Process. 2021, 2021, 80. [Google Scholar] [CrossRef]
- Press, W.H.; Teukolsky, S.A. Savitzky-Golay Smoothing Filters. Comput. Phys. 1990, 4, 669–672. [Google Scholar] [CrossRef]
- Pan, J.; Tompkins, W.J. A Real-Time QRS Detection Algorithm. IEEE Trans. Biomed. Eng. 1985, BME-32, 230–236. [Google Scholar] [CrossRef]
- Li, Z.; Snieder, H.; Su, S.; Ding, X.; Thayer, J.F.; Treiber, F.A.; Wang, X. A Longitudinal Study in Youth of Heart Rate Variability at Rest and in Response to Stress. Int. J. Psychophysiol. 2009, 73, 212–217. [Google Scholar] [CrossRef]
- Bartels, R.; Neumamm, L.; Peçanha, T.; Carvalho, A.R.S. SinusCor: An Advanced Tool for Heart Rate Variability Analysis. Biomed. Eng. Online 2017, 16, 110. [Google Scholar] [CrossRef]
- Mayor, D.; Panday, D.; Kandel, H.K.; Steffert, T.; Banks, D. Ceps: An Open Access Matlab Graphical User Interface (Gui) for the Analysis of Complexity and Entropy in Physiological Signals. Entropy 2021, 23, 321. [Google Scholar] [CrossRef]
- Rolink, J.; Fonseca, P.; Long, X.; Leonhardt, S. Improving Sleep/Wake Classification with Recurrence Quantification Analysis Features. Biomed. Signal Process. Control 2019, 49, 78–86. [Google Scholar] [CrossRef]
- Goshvarpour, A.; Abbasi, A.; Goshvarpour, A. Do Men and Women Have Different ECG Responses to Sad Pictures? Biomed. Signal Process. Control 2017, 38, 67–73. [Google Scholar] [CrossRef]
- Schlenker, J.; Socha, V.; Riedlbauchová, L.; Nedělka, T.; Schlenker, A.; Potočková, V.; Malá, Š.; Kutílek, P. Recurrence Plot of Heart Rate Variability Signal in Patients with Vasovagal Syncopes. Biomed. Signal Process. Control 2016, 25, 1–11. [Google Scholar] [CrossRef]
- Dinstein, I.; Shanmugam, K.; Haralick, R.M. Textural Features for Image Classification. IEEE Trans. Syst. Man Cybern. 1973, SMC-3, 610–621. [Google Scholar]
- Löfstedt, T.; Brynolfsson, P.; Asklund, T.; Nyholm, T.; Garpebring, A. Gray-Level Invariant Haralick Texture Features. PLoS ONE 2019, 14, e0212110. [Google Scholar] [CrossRef] [PubMed]
- Samant, P.; Agarwal, R. Diagnosis of Diabetes Using Computer Methods: Soft Computing Methods for Diabetes Detection Using Iris. Int. J. Med. Health Biomed. Bioeng. Pharm. Eng. 2017, 200, 57–62. [Google Scholar]
- Singh, M.; Singh, S.; Gupta, S. An Information Fusion Based Method for Liver Classification Using Texture Analysis of Ultrasound Images. Inf. Fusion 2014, 19, 91–96. [Google Scholar] [CrossRef]
- Bridge, P.D.; Sawilowsky, S.S. Increasing Physicians’ Awareness of the Impact of Statistics on Research Outcomes: Comparative Power of the t-Test and Wilcoxon Rank-Sum Test in Small Samples Applied Research. J. Clin. Epidemiol. 1999, 52, 229–235. [Google Scholar] [CrossRef]
- Kitchen, C.M.R. Nonparametric vs Parametric Tests of Location in Biomedical Research. Am. J. Ophthalmol. 2009, 147, 571–572. [Google Scholar] [CrossRef]
- Kerby, D.S. The Simple Difference Formula: An Approach to Teaching Nonparametric Correlation. Compr. Psychol. 2014, 3, 11.IT.3.1. [Google Scholar] [CrossRef]
- Polat, H.; Mehr, H.D.; Cetin, A. Diagnosis of Chronic Kidney Disease Based on Support Vector Machine by Feature Selection Methods. Syst.-Level Qual. Improv. 2017, 41, 55. [Google Scholar] [CrossRef]
- Hall, M.; Frank, E.; Holmes, G.; Pfahringer, B.; Reutemann, P.; Witten, I.H. The WEKA Data Mining Software. ACM SIGKDD Explor. Newsl. 2009, 11, 10–18. [Google Scholar] [CrossRef]
- Castaldo, R.; Montesinos, L.; Melillo, P.; James, C.; Pecchia, L. Ultra-Short Term HRV Features as Surrogates of Short Term HRV: A Case Study on Mental Stress Detection in Real Life. BMC Med. Inform. Decis. Mak. 2019, 19, 12. [Google Scholar] [CrossRef] [PubMed]
- Jain, A.K.; Duin, P.W.; Mao, J. Statistical Pattern Recognition: A Review. IEEE Trans. Pattern Anal. Mach. Intell. 2000, 22, 4–37. [Google Scholar] [CrossRef]
- Song, H.S.; Lehrer, P.M. The Effects of Specific Respiratory Rates on Heart Rate and Heart Rate Variability. Appl. Psychophysiol. Biofeedback 2003, 28, 13–23. [Google Scholar] [CrossRef]
- Melo, H.M.; Martins, T.C.; Nascimento, L.M.; Hoeller, A.A.; Walz, R.; Takase, E. Ultra-Short Heart Rate Variability Recording Reliability: The Effect of Controlled Paced Breathing. Ann. Noninvasive Electrocardiol. 2018, 23, e12565. [Google Scholar] [CrossRef]
- Tarvainen, M.P.; Niskanen, J.P.; Lipponen, J.A.; Ranta-aho, P.O.; Karjalainen, P.A. Kubios HRV—Heart Rate Variability Analysis Software. Comput. Methods Programs Biomed. 2014, 113, 210–220. [Google Scholar] [CrossRef]
- Delliaux, S.; Delaforge, A.; Deharo, J.-C.; Chaumet, G. Mental Workload Alters Heart Rate Variability, Lowering Non-Linear Dynamics. Front. Physiol. 2019, 10, 565. [Google Scholar] [CrossRef]
- Taelman, J.; Vandeput, S.; Vlemincx, E.; Spaepen, A.; Van Huffel, S. Instantaneous Changes in Heart Rate Regulation Due to Mental Load in Simulated Office Work. Eur. J. Appl. Physiol. 2011, 111, 1497–1505. [Google Scholar] [CrossRef]
- Weippert, M.; Behrens, K.; Rieger, A.; Kumar, M.; Behrens, M. Effects of Breathing Patterns and Light Exercise on Linear and Nonlinear Heart Rate Variability. Appl. Physiol. Nutr. Metab. 2015, 40, 762–768. [Google Scholar] [CrossRef]
- Chen, W.; Wang, Z.; Xie, H.; Yu, W. Characterization of Surface EMG Signal Based on Fuzzy Entropy. IEEE Trans. Neural Syst. Rehabil. Eng. 2007, 15, 266–272. [Google Scholar] [CrossRef]


| S. No | Entropy | Hyperparameters |
|---|---|---|
| 1 | Approximate entropy | m = 2, r = 0.2 |
| 2 | Sample entropy | m = 2, r = 0.2, tau = 1 |
| 3 | Fuzzy entropy | m = 2, membership function = trapezoidal, tau= 2 |
| 4 | Amplitude-aware permutation entropy | m = 6, tau = 1, a = 0.5 |
| 5 | Bubble entropy | m = 10 |
| S. No | Classifier | Hyper-Parameters |
|---|---|---|
| 1 | Support vector machine (SVM) | Kernel = radial basis function |
| 2 | Linear discriminant analysis (LDA) | R = 1.0 × 10⁻⁶ |
| 3 | K-nearest neighbour (IBK) | K = 3 |
| 4 | C4.5 | Confidence factor = 0.25, minimum number of instances = 2 |
| 5 | Multi-layer perceptron (MLP) | Learning rate = 0.3, momentum = 0.2, number of excerpts= 500 |
| 6 | Random forest (RF) | K = 0, M = 1, P = 100, I = 100 |
| S No. | Features | FDR Value > 0.95 |
|---|---|---|
| 1 | SampEn_DS | 1.280185 |
| 2 | Cluster Prominence * | 1.255806 |
| 3 | Entropy * | 1.146591 |
| 4 | HFnu | 1.132644 |
| 5 | LFnu | 1.132644 |
| 6 | Sum Entropy * | 1.110963 |
| 7 | Energy * | 1.084762 |
| 8 | Information measure of correlation 1 * | 1.05102 |
| 9 | LF_HF | 1.043894 |
| 10 | Maximum probability * | 1.015278 |
| 11 | Homogeneity * | 1.009838 |
| 12 | Difference Entropy * | 1.003695 |
| 13 | SD2 | 0.989185 |
| S. No. | Features | FDR Value | RBC |
|---|---|---|---|
| 1 | Sample Entropy | 1.28 | −1 |
| 2 | Cluster Prominence | 1.256 | 0.987 |
| 3 | HFnu | 1.133 | −0.996 |
| 4 | LF_HF | 1.044 | 0.996 |
| 5 | SD2 | 0.989 | 0.974 |
| Classifier | ACC% | SEN% | SPE% | F1-SCORE | AUC% |
|---|---|---|---|---|---|
| LDA | 95 | 93.3 | 96.6 | 0.95 | 96.6 |
| SVM | 96.6 | 93.3 | 100 | 0.967 | 96.7 |
| MLP | 93.3 | 90 | 96.7 | 0.933 | 96.4 |
| IBK | 95 | 93.3 | 96.6 | 0.95 | 97.6 |
| DT | 85 | 80 | 90 | 0.85 | 88.4 |
| RF | 90 | 90 | 90 | 0.9 | 95.9 |
| Classifier | ACC | SEN | SPE | F1-SCORE | AUC | Feature Subset |
|---|---|---|---|---|---|---|
| LDA # | 96.6 | 96.7 | 96.7 | 0.967 | 96.4 | cprom, HFnu, SD2 |
| SVM # | 96.6 | 93.3 | 100 | 0.967 | 96.7 | cprom, LF_HF, SD2 |
| MLP # | 93.3 | 90 | 96.7 | 0.933 | 96.2 | cprom, LF_HF, SD2 |
| IBK | 88.3 | 90 | 86.7 | 0.850 | 90.9 | SE |
| DT # | 85 | 80 | 90 | 0.883 | 88.4 | SE, cprom, HFnu |
| RF | 81.6 | 83.3 | 80 | 0.817 | 90.6 | SE |
Disclaimer/Publisher’s Note: The statements, opinions and data contained in all publications are solely those of the individual author(s) and contributor(s) and not of MDPI and/or the editor(s). MDPI and/or the editor(s) disclaim responsibility for any injury to people or property resulting from any ideas, methods, instructions or products referred to in the content. |
© 2025 by the authors. Licensee MDPI, Basel, Switzerland. This article is an open access article distributed under the terms and conditions of the Creative Commons Attribution (CC BY) license (https://creativecommons.org/licenses/by/4.0/).
Share and Cite
Arya, P.; Singh, M.; Singh, M. Visualizing Relaxation in Wearables: Multi-Domain Feature Fusion of HRV Using Fuzzy Recurrence Plots. Sensors 2025, 25, 4210. https://doi.org/10.3390/s25134210
Arya P, Singh M, Singh M. Visualizing Relaxation in Wearables: Multi-Domain Feature Fusion of HRV Using Fuzzy Recurrence Plots. Sensors. 2025; 25(13):4210. https://doi.org/10.3390/s25134210
Chicago/Turabian StyleArya, Puneet, Mandeep Singh, and Mandeep Singh. 2025. "Visualizing Relaxation in Wearables: Multi-Domain Feature Fusion of HRV Using Fuzzy Recurrence Plots" Sensors 25, no. 13: 4210. https://doi.org/10.3390/s25134210
APA StyleArya, P., Singh, M., & Singh, M. (2025). Visualizing Relaxation in Wearables: Multi-Domain Feature Fusion of HRV Using Fuzzy Recurrence Plots. Sensors, 25(13), 4210. https://doi.org/10.3390/s25134210