
Transfer Learning-Based Interpretable Soil Lead Prediction in the Gejiu Mining Area, Yunnan


Abstract
1. Introduction
2. Data and Methods
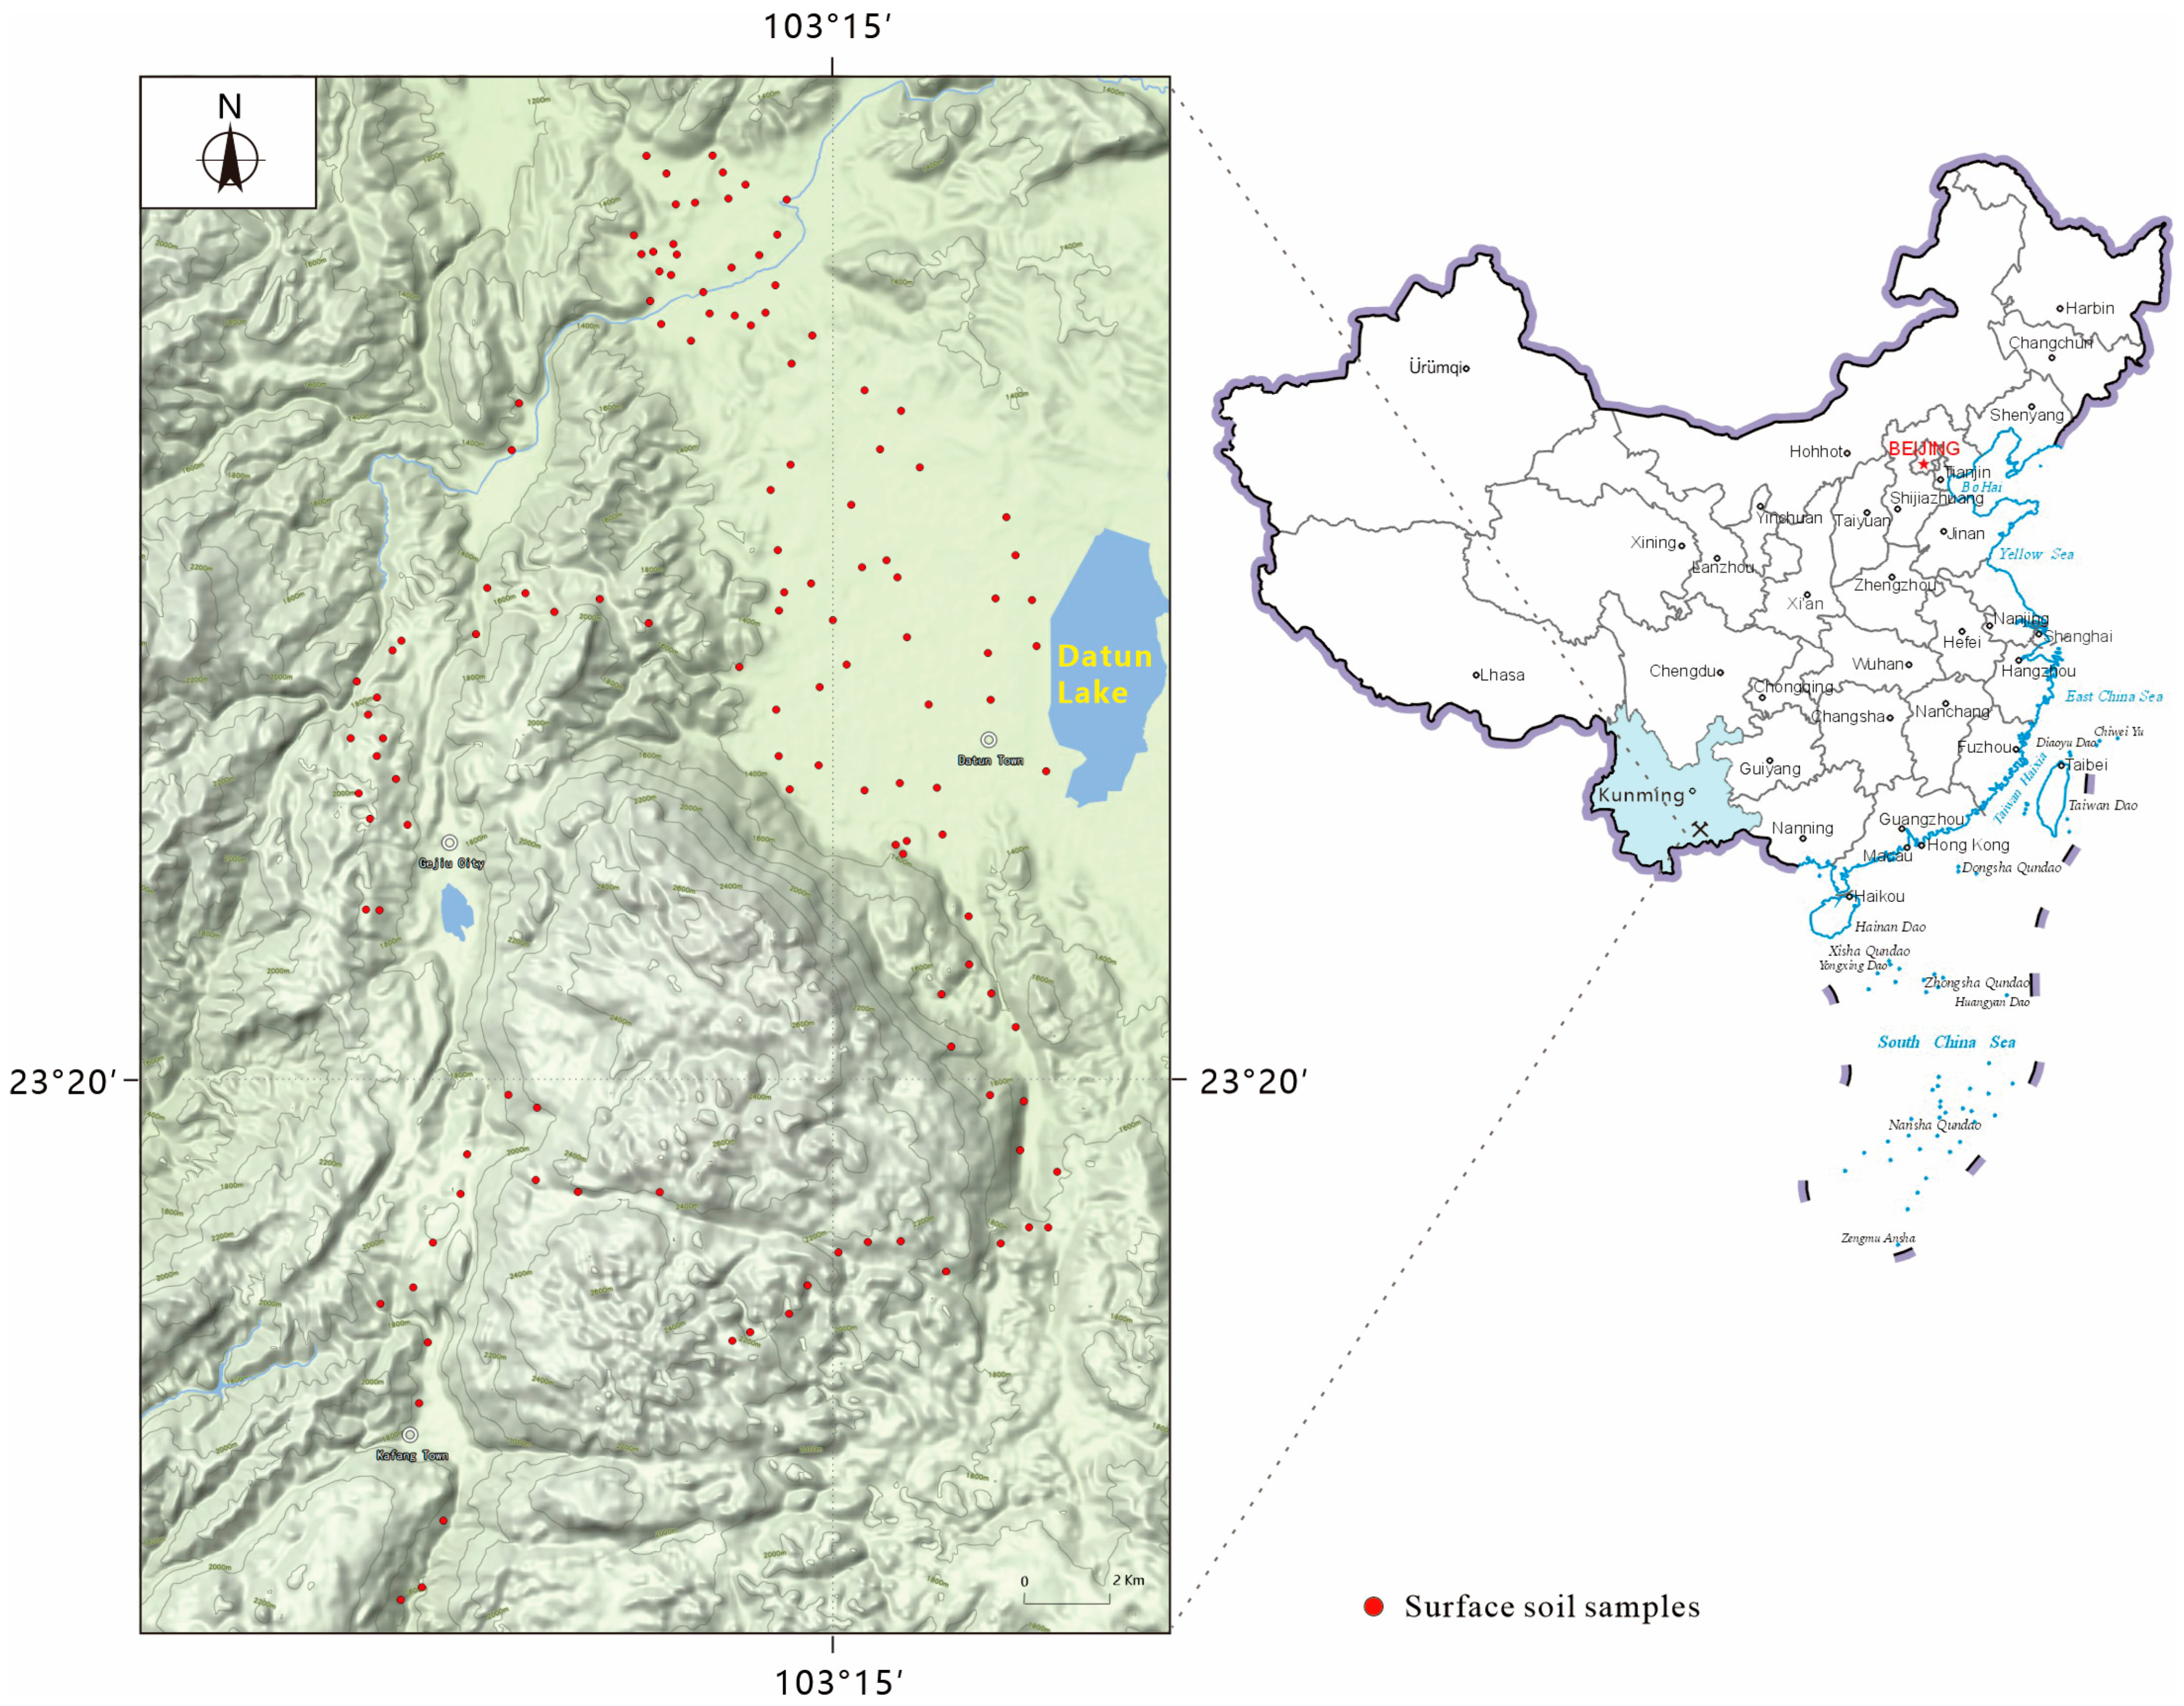
2.1. Data Sources
2.2. Methods
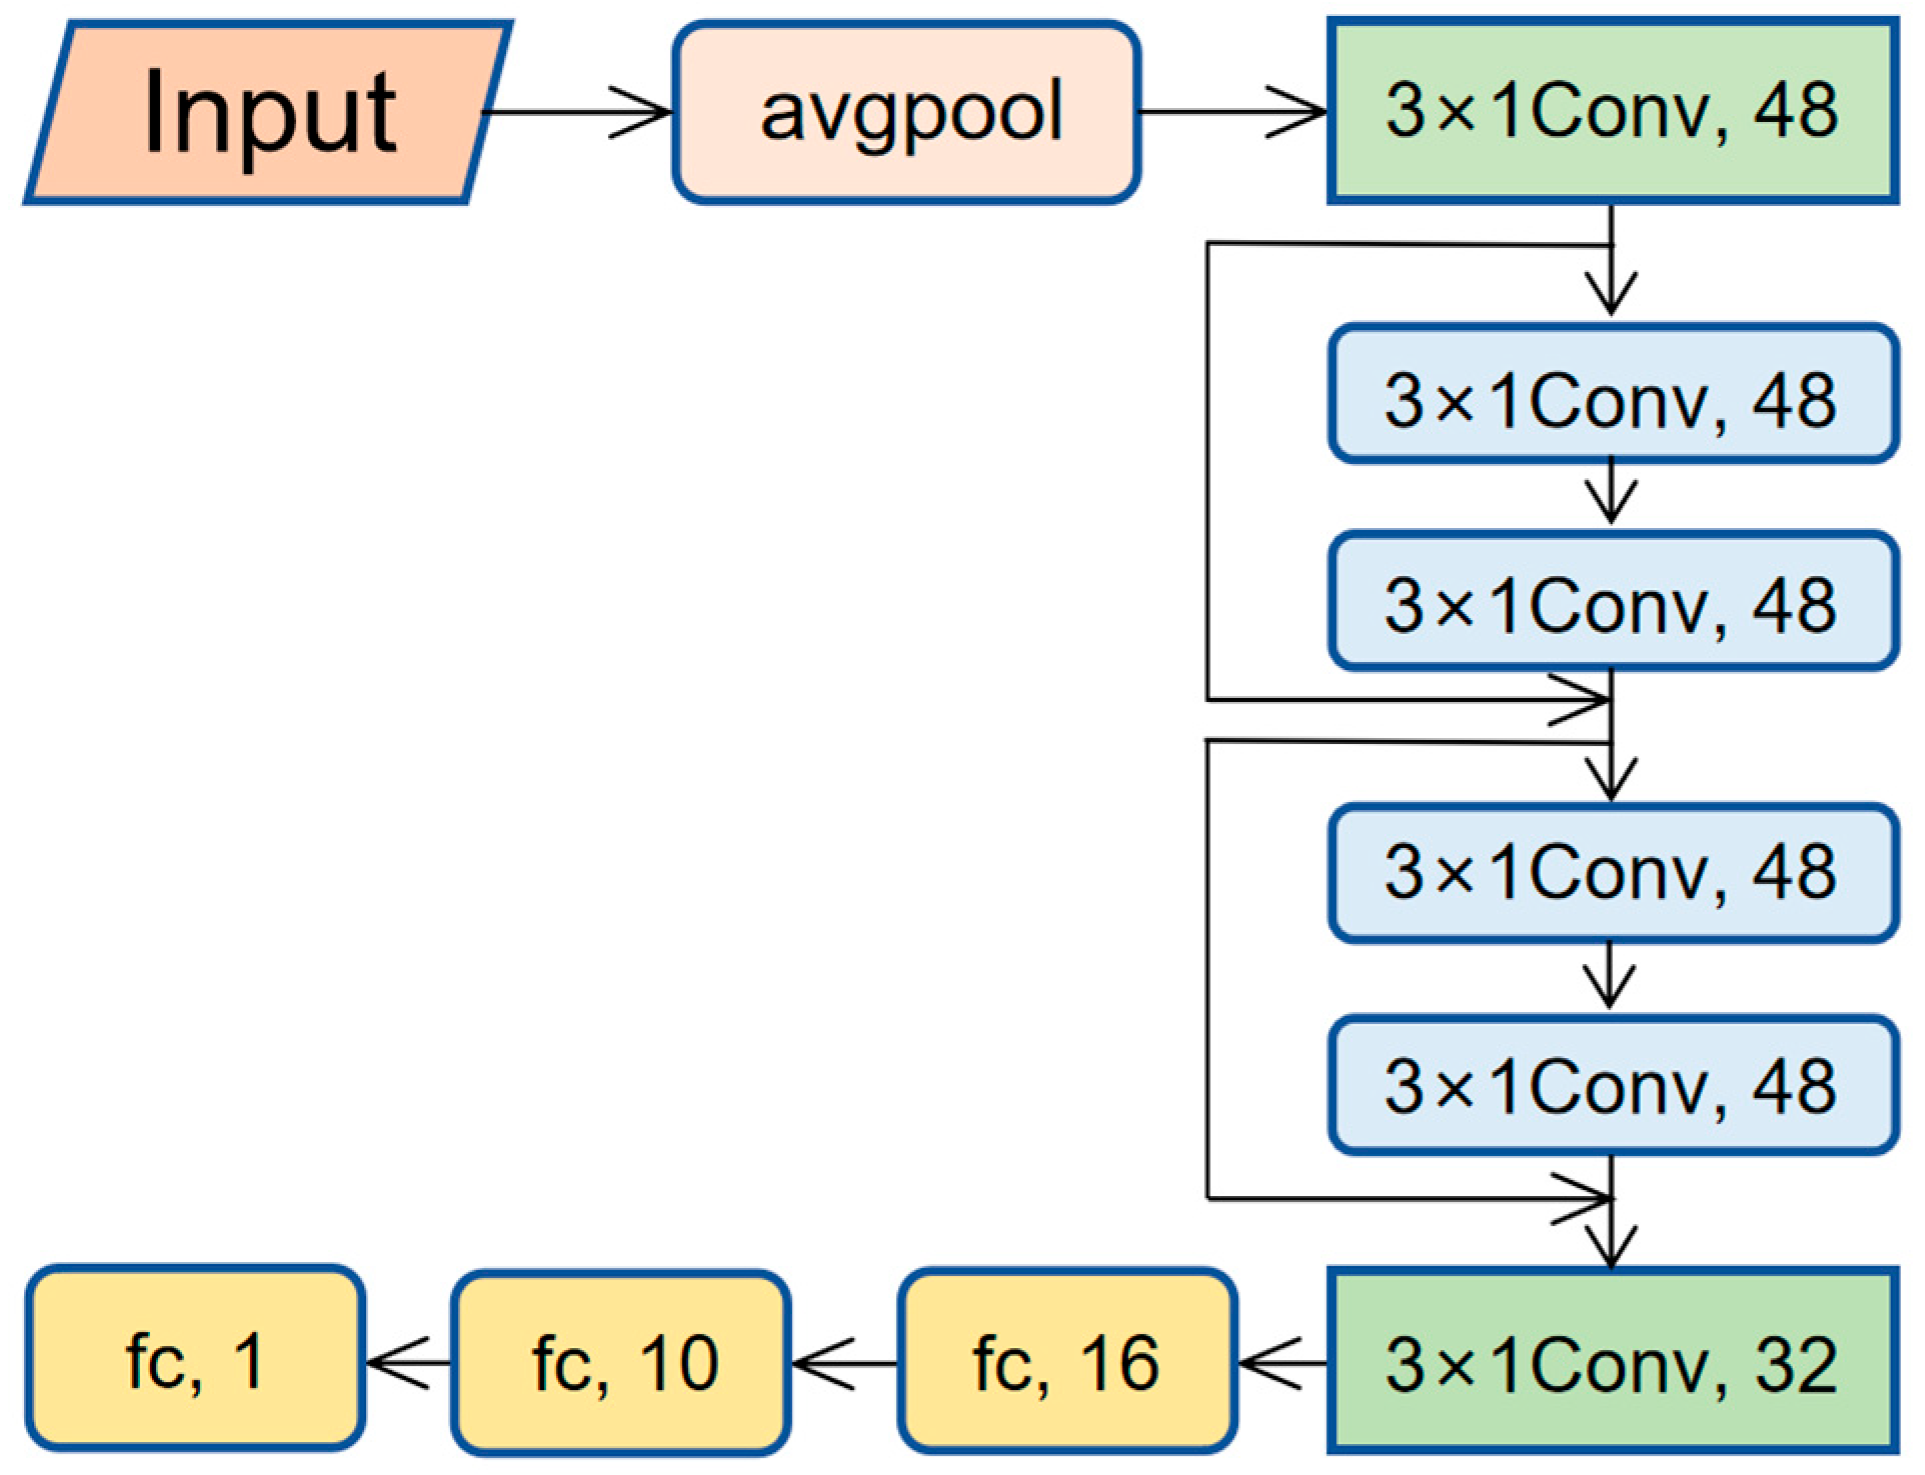
2.2.1. ResNet Model Architecture
2.2.2. Transfer Learning Process
2.2.3. Interpretability Analysis
2.2.4. Comparison Experiments and Evaluation Metrics
3. Results
3.1. Statistical Characterization of Soil Pb Concentrations
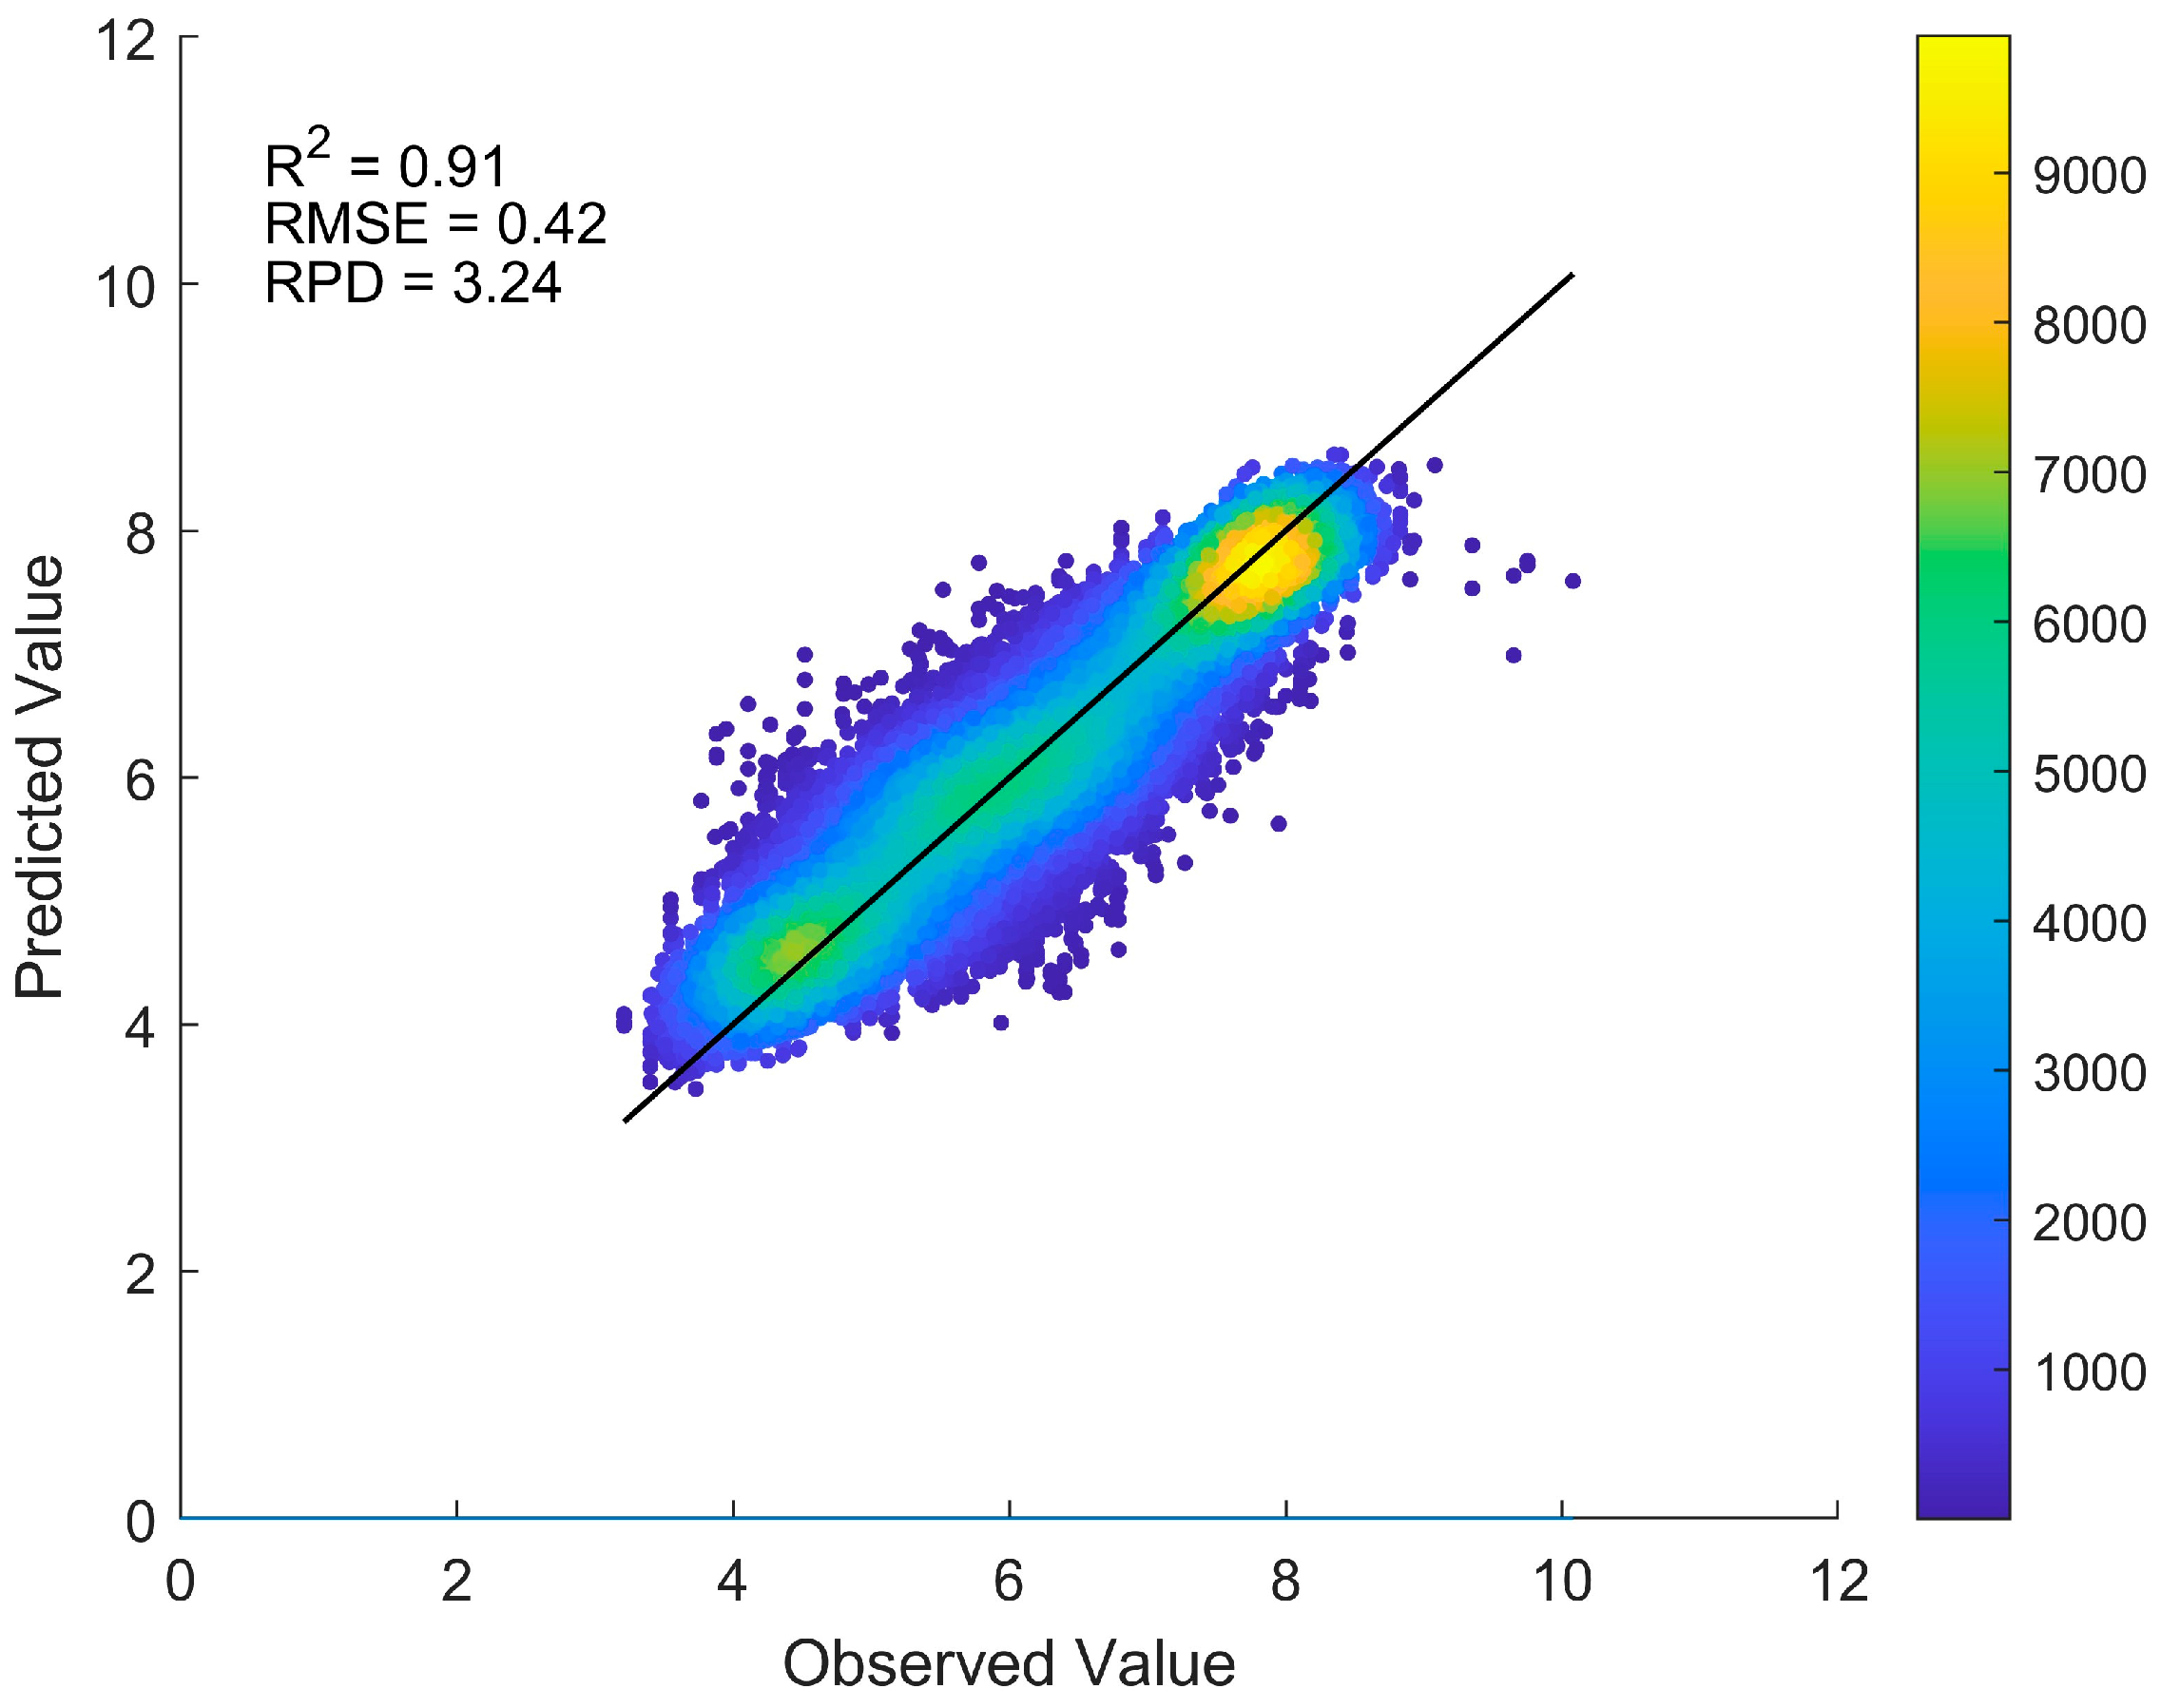
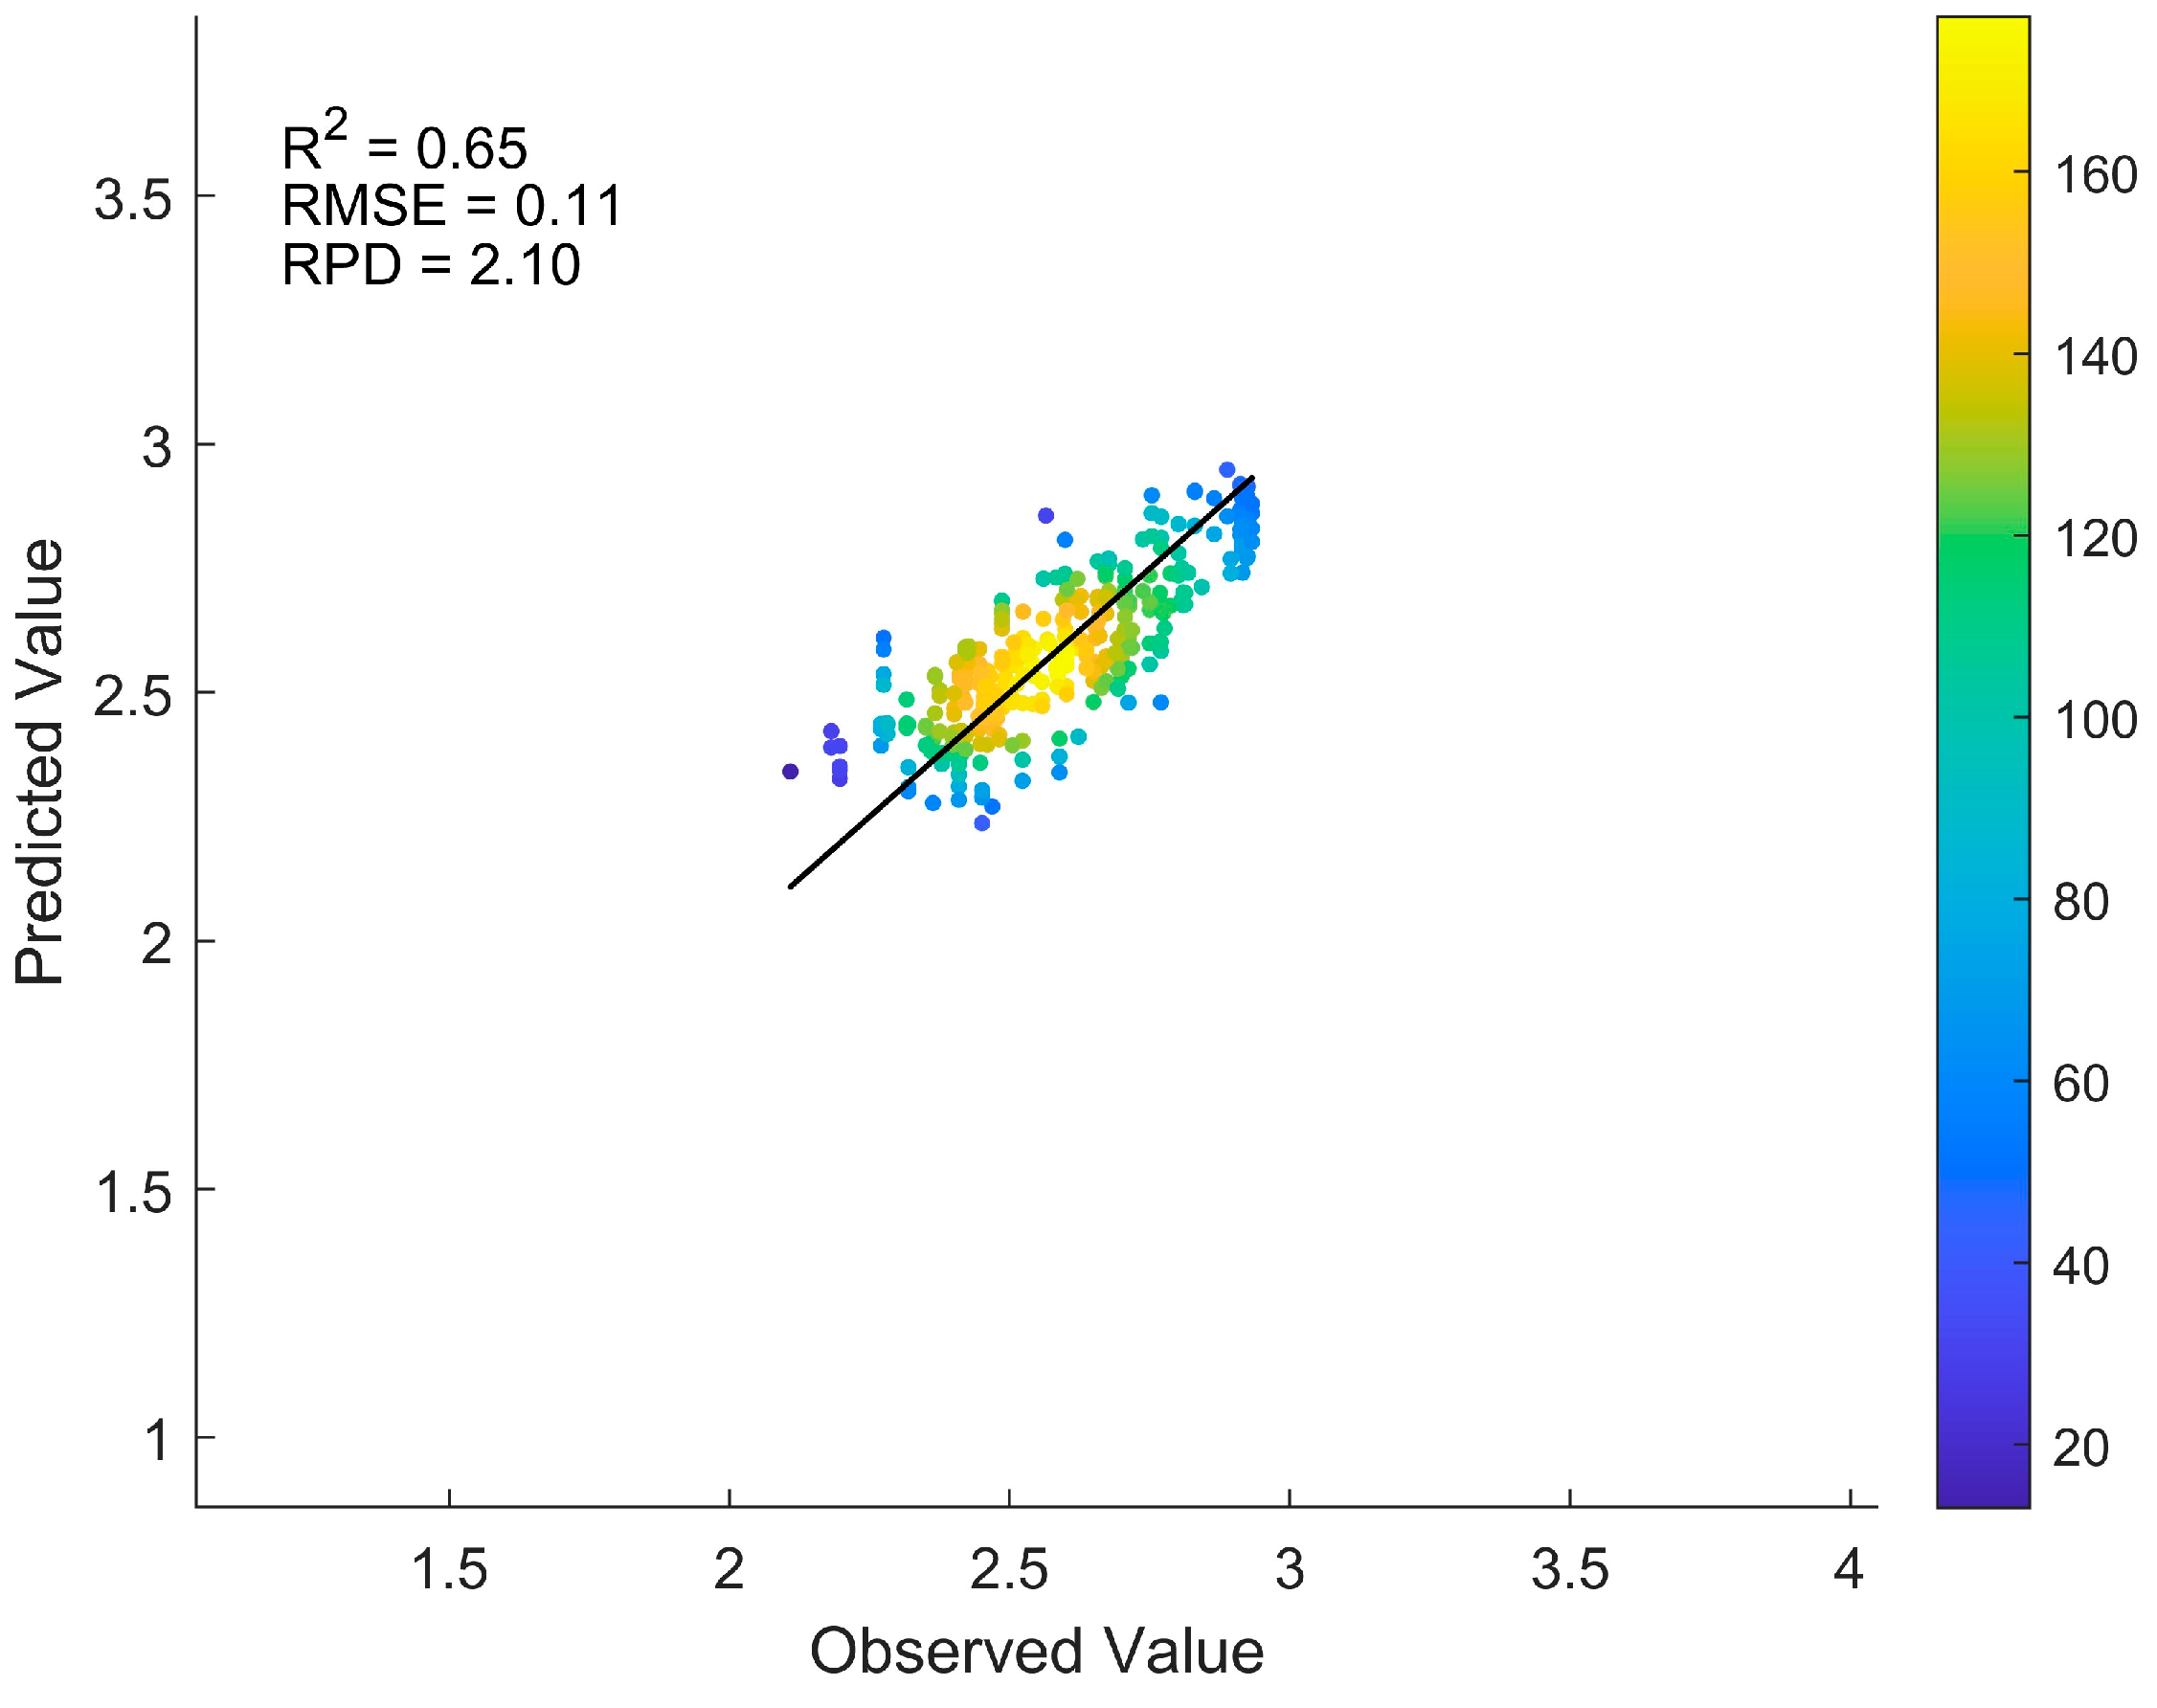
3.2. Source Domain Modeling
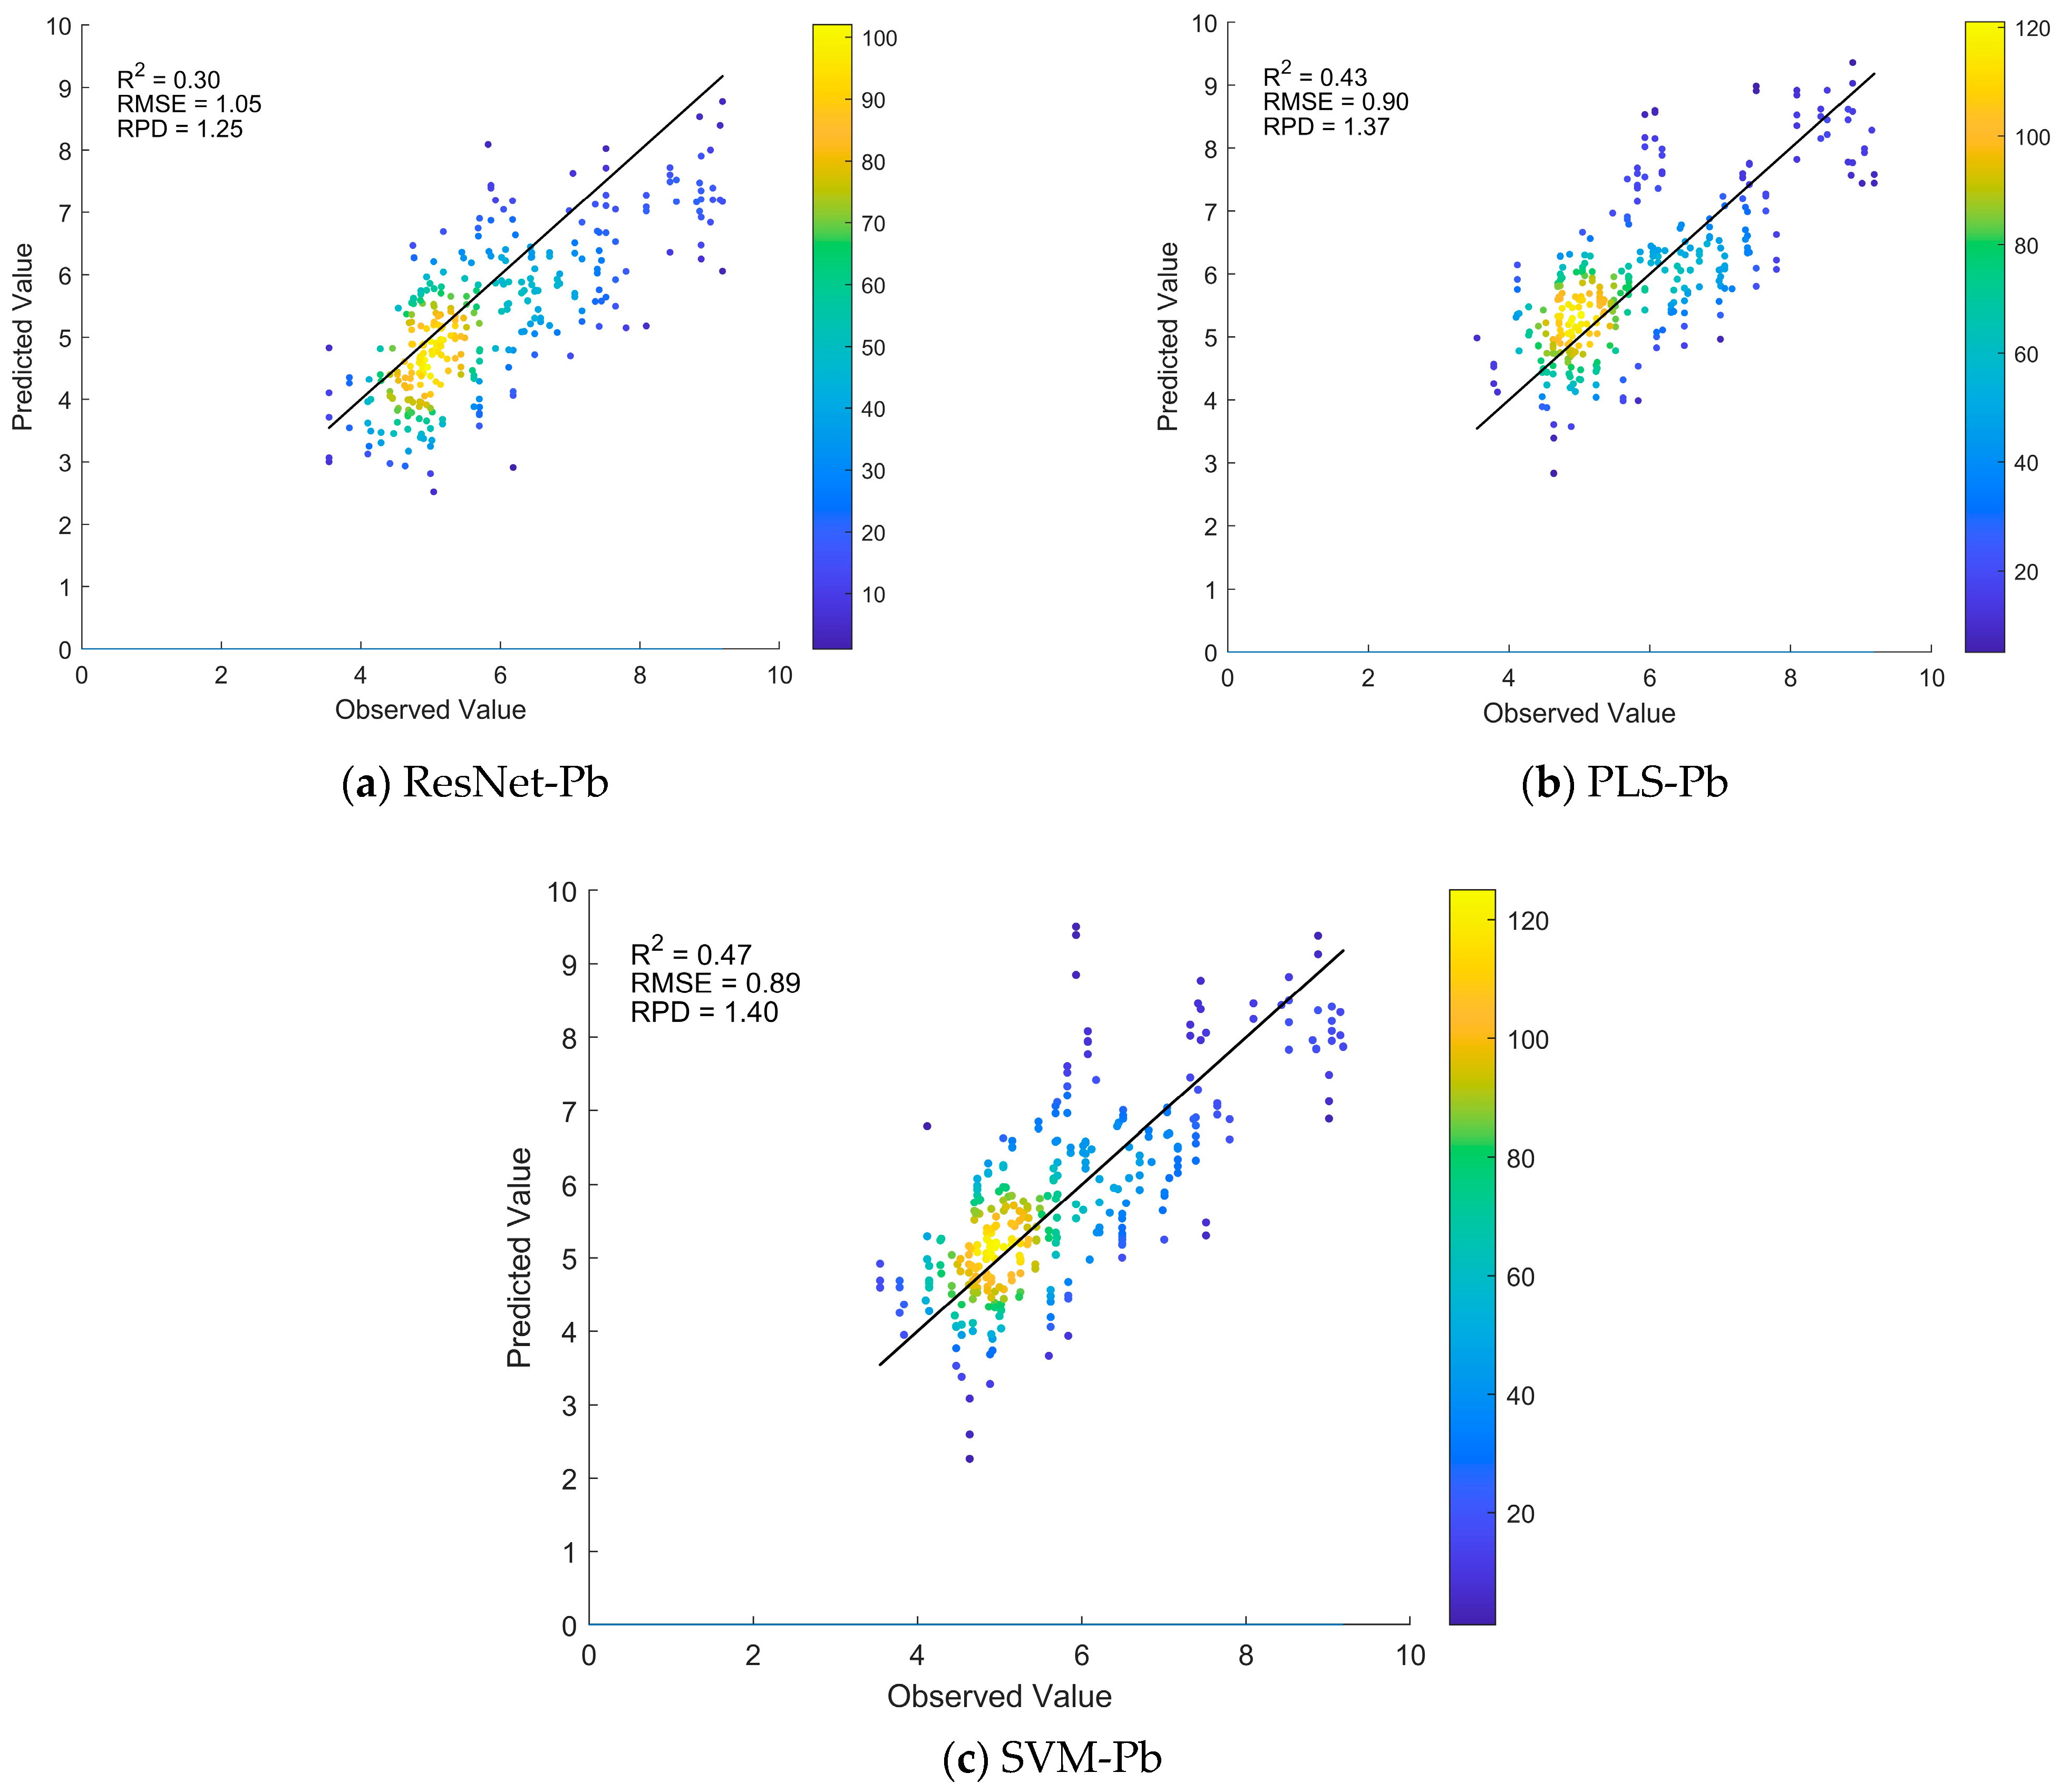
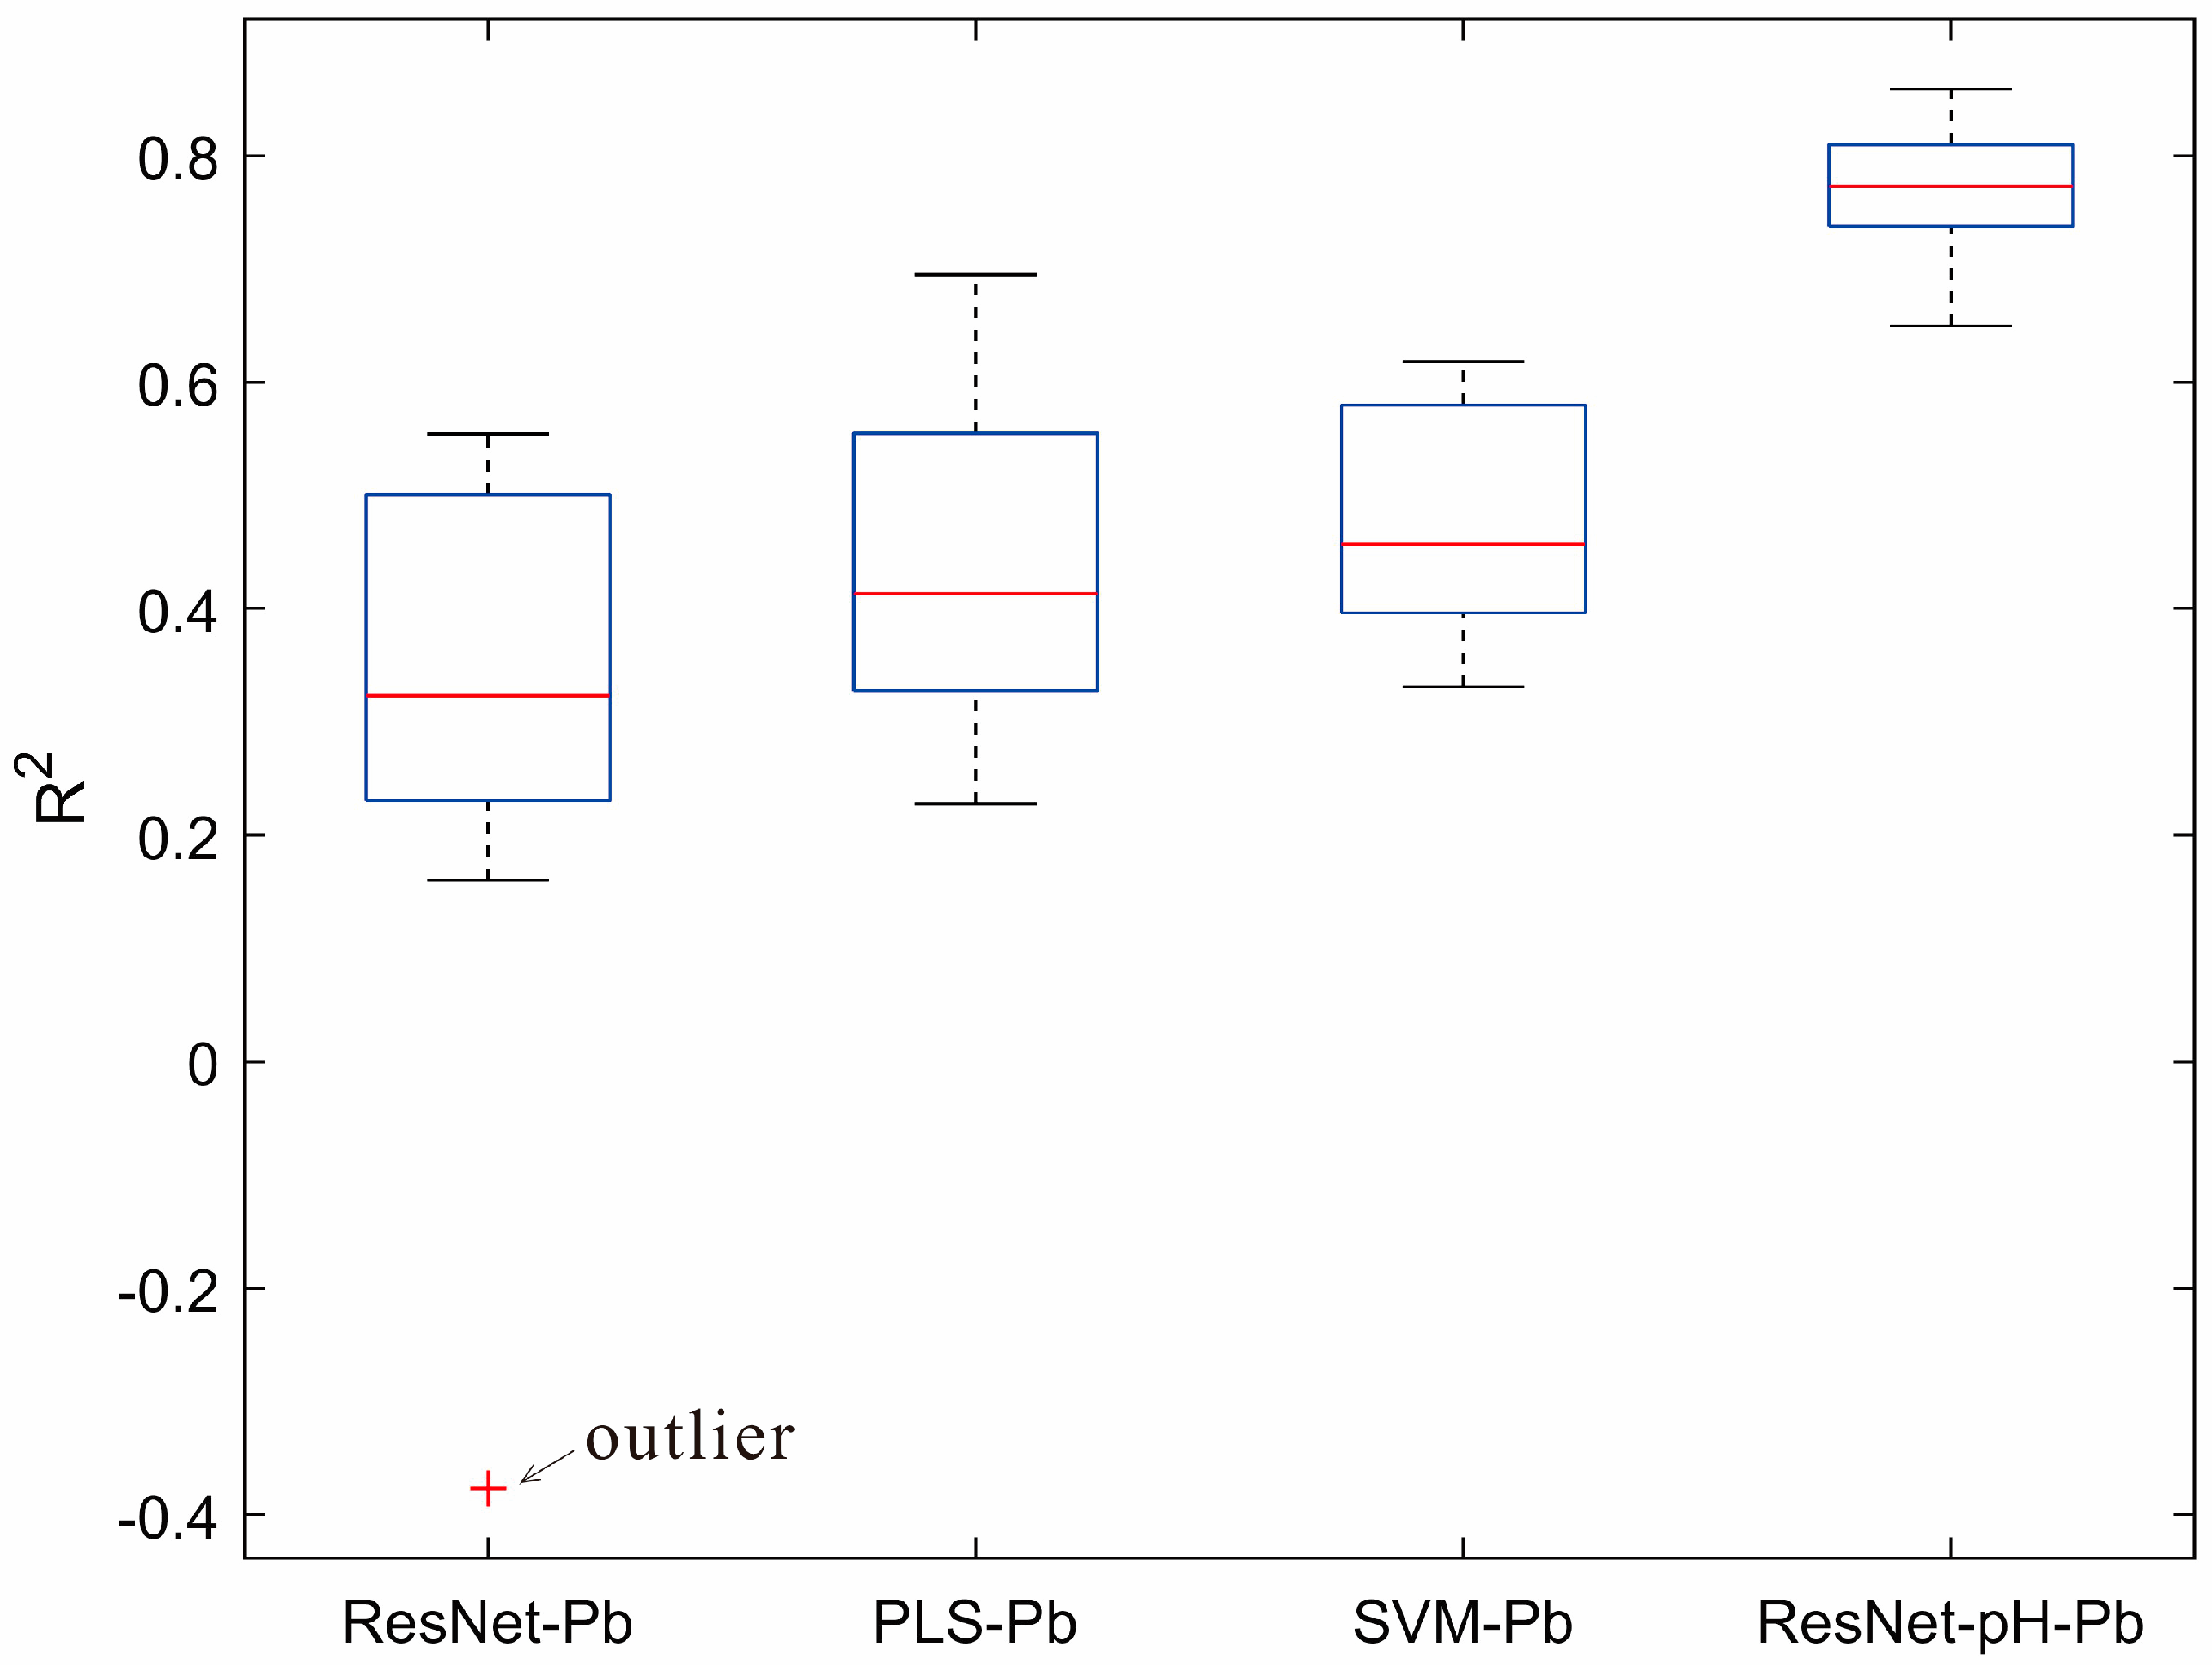
3.3. Direct Modeling in the Target Domain
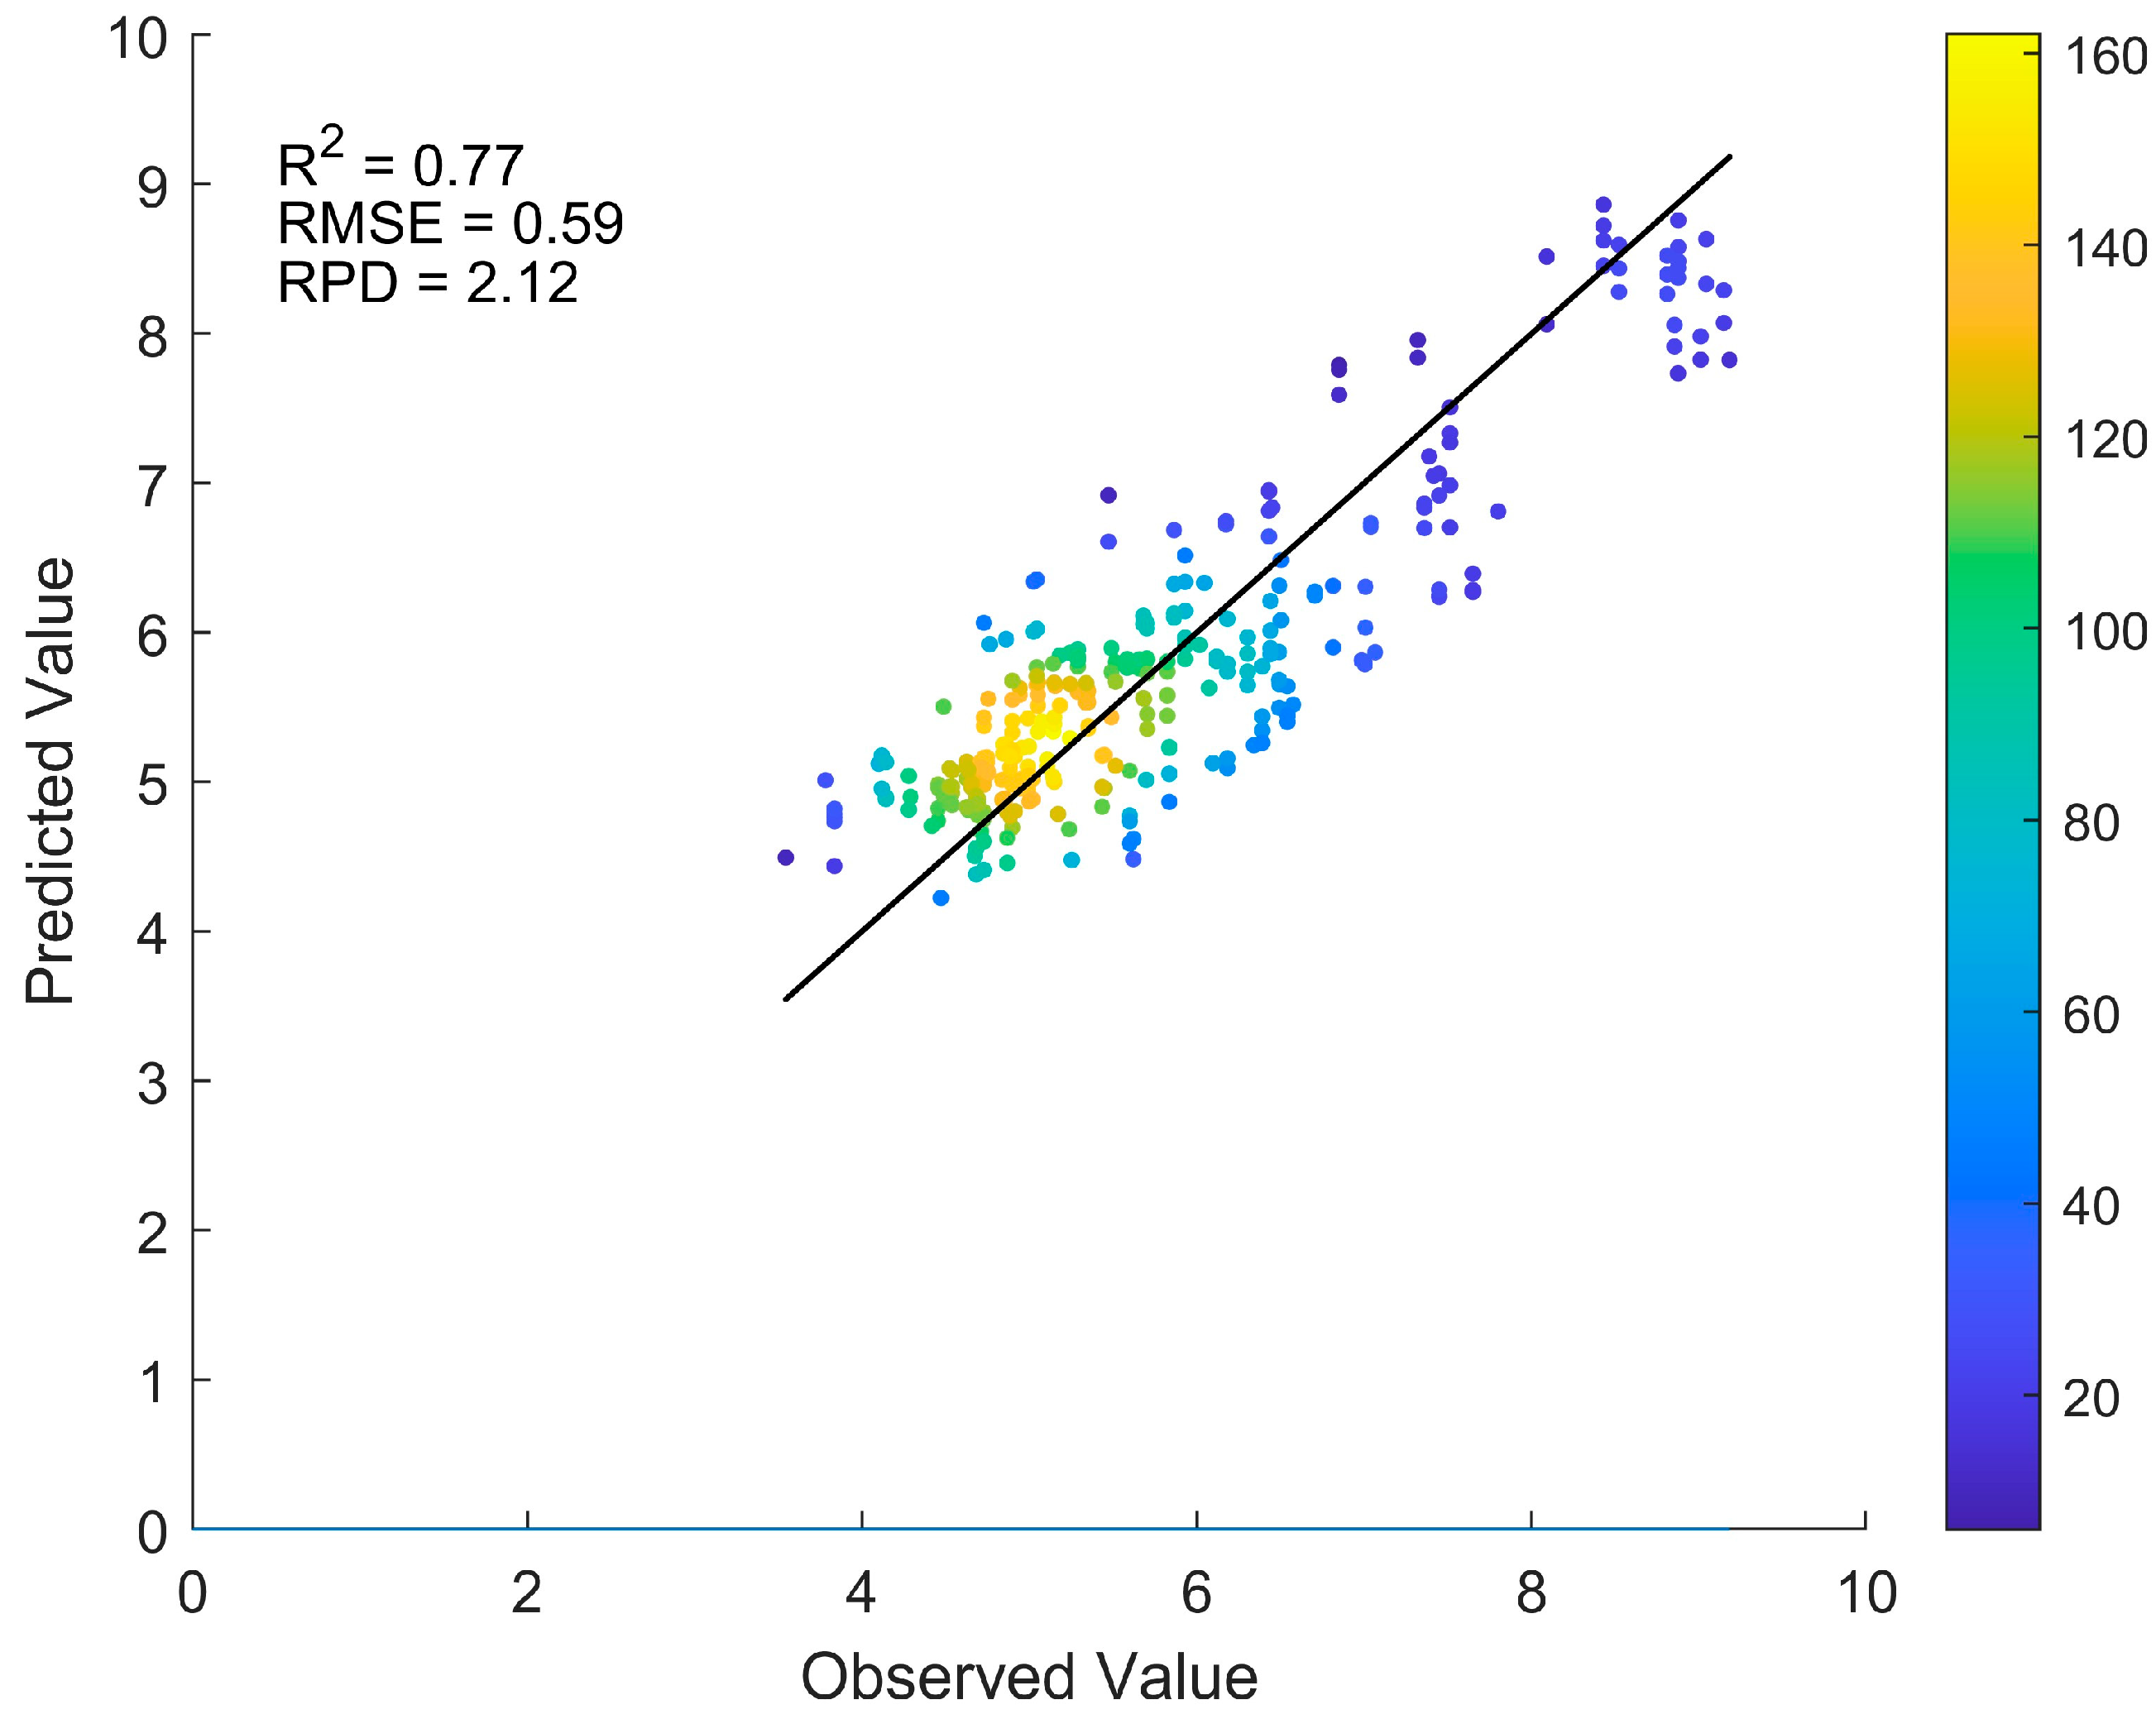
3.4. Performance of the Transfer Learning Model
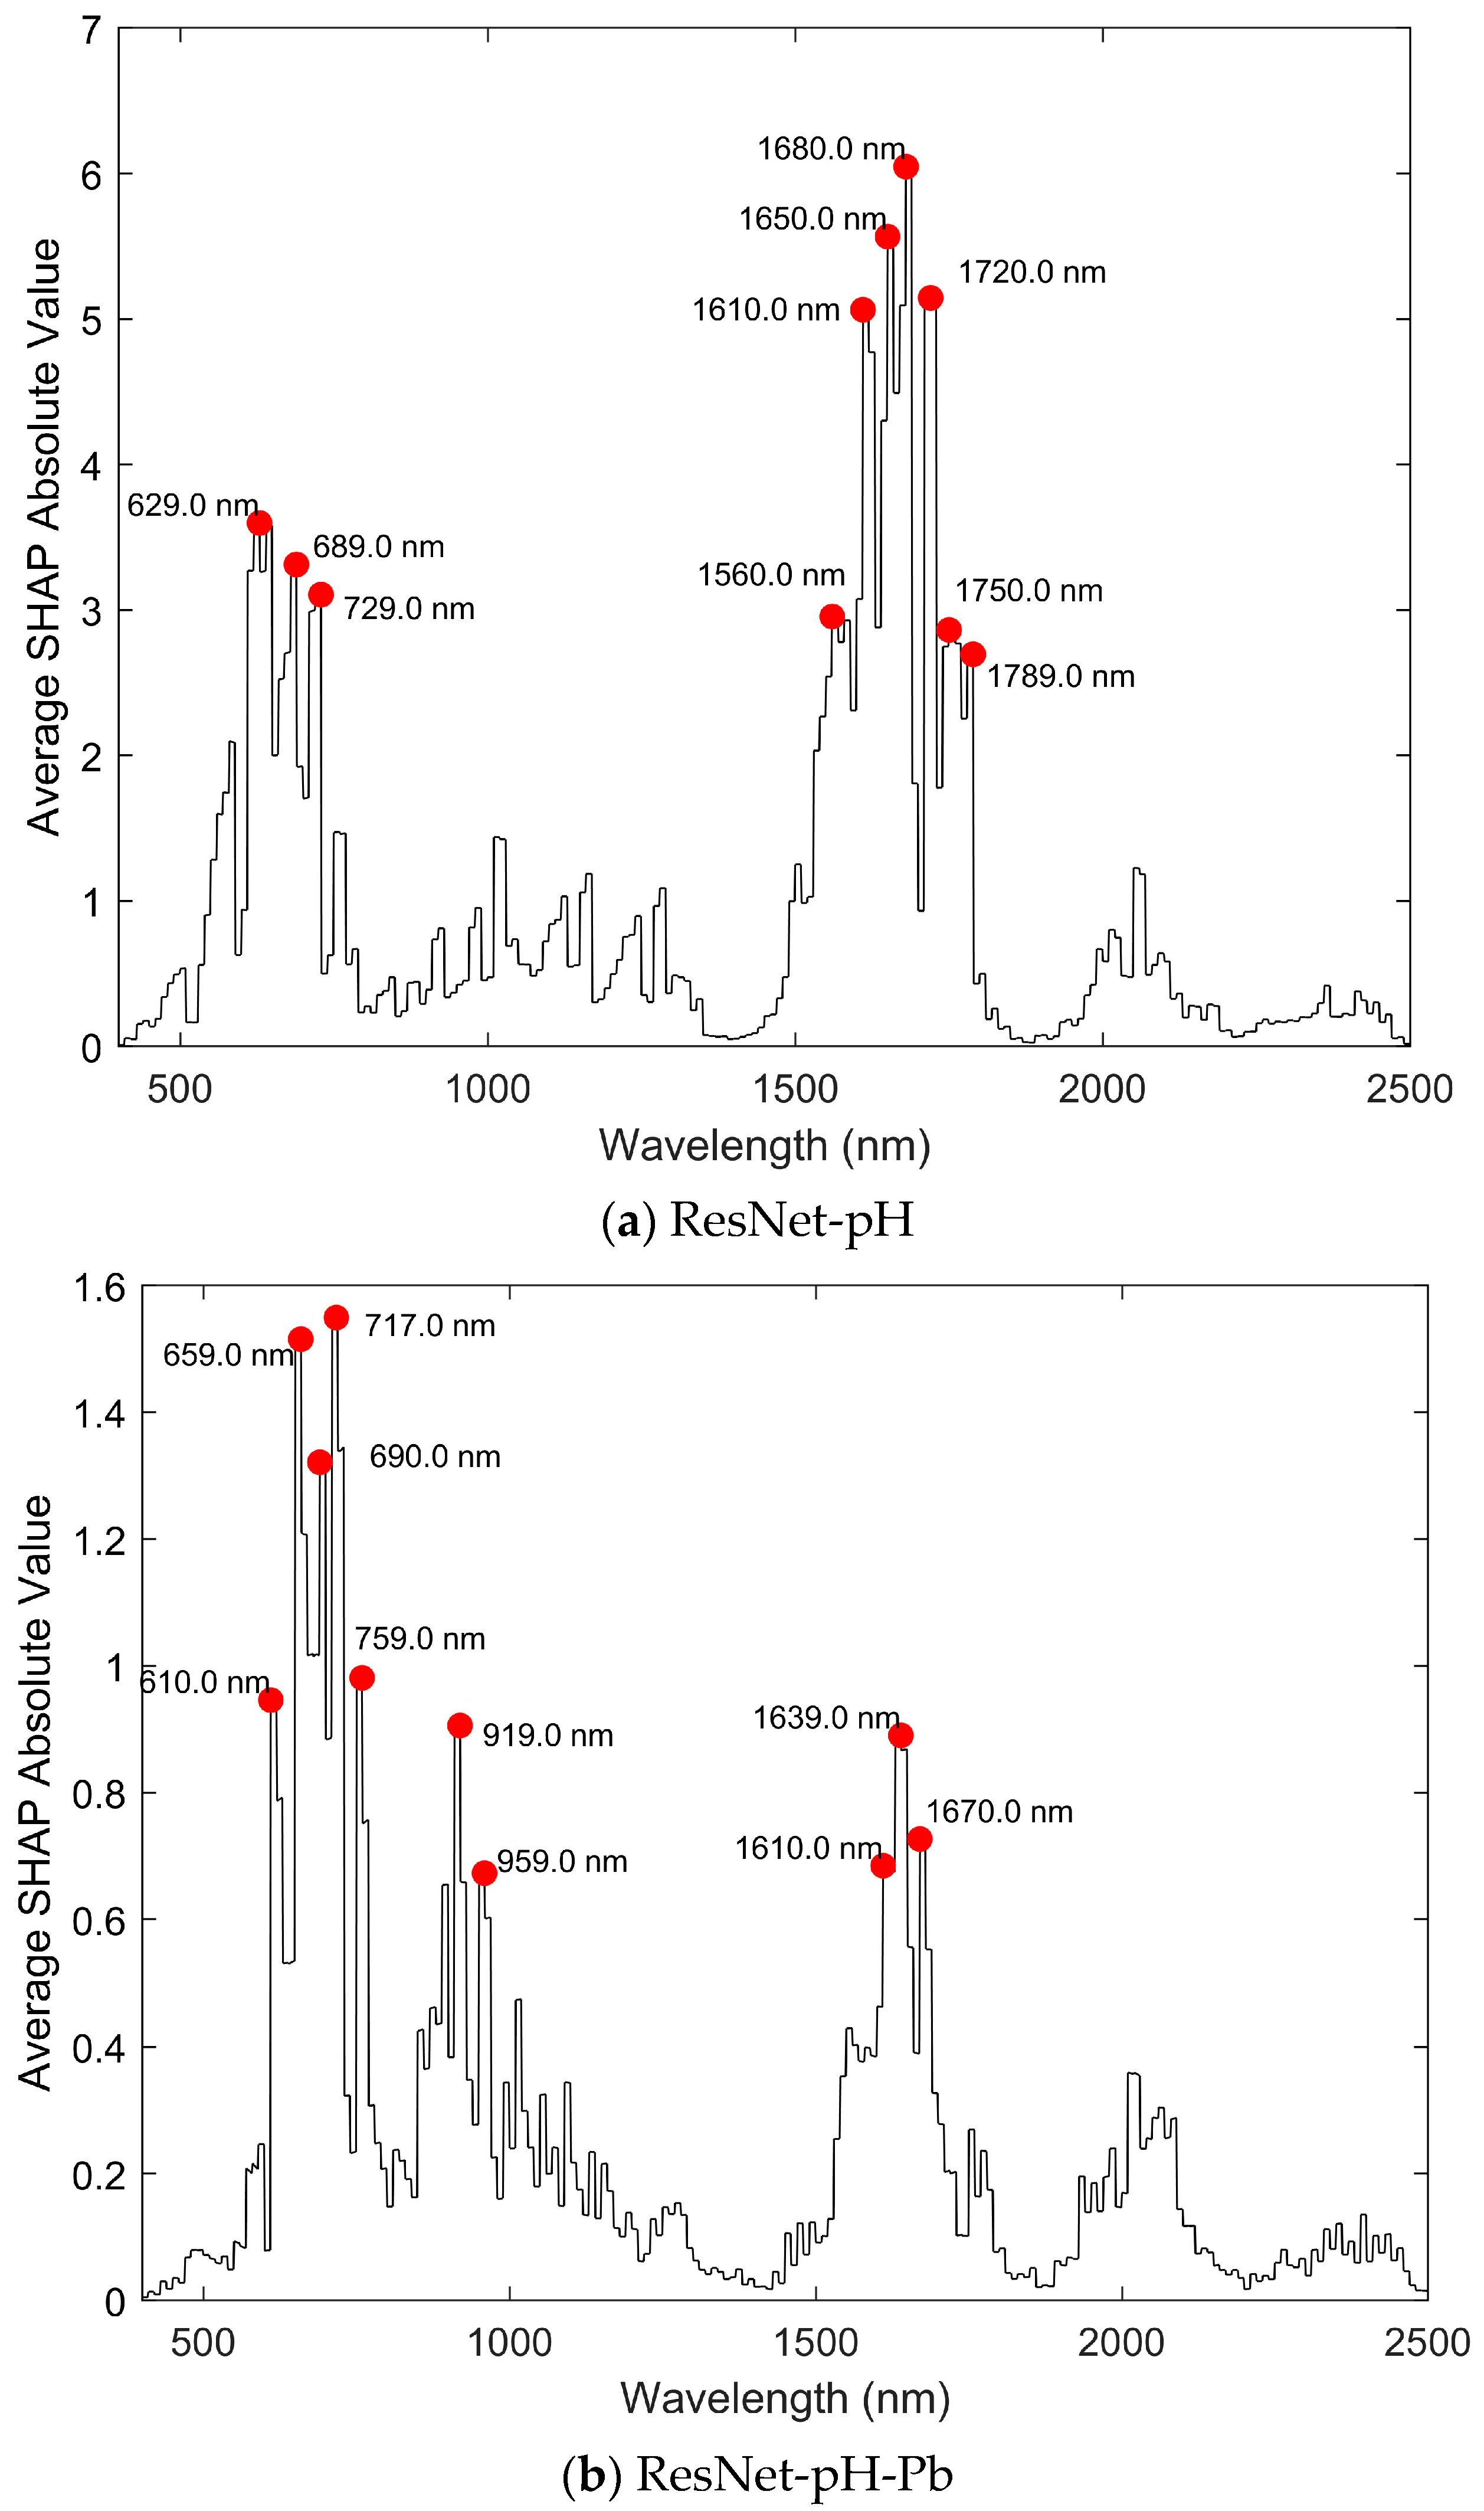
3.5. Wavelength Contribution in ResNet Modeling
4. Discussion
4.1. Improvement in Prediction Performance for Small Sample Target Domains Using Transfer Learning
4.2. Feature Analysis of Wavelength Contribution
4.3. Limitations and Future Directions
5. Conclusions
Author Contributions
Funding
Institutional Review Board Statement
Informed Consent Statement
Data Availability Statement
Acknowledgments
Conflicts of Interest
References
- Gholizadeh, A.; Borůvka, L.; Saberioon, M.M.; Kozák, J.; Vašát, R.; Němeček, K. Comparing different data preprocessing methods for monitoring soil heavy metals based on soil spectral features. Soil Water Res. 2015, 10, 218–227. [Google Scholar] [CrossRef]
- Bradl, H.B. Adsorption of heavy metal ions on soils and soils constituents. J. Colloid Interface Sci. 2004, 277, 1–18. [Google Scholar] [CrossRef] [PubMed]
- Li, Z.; Ma, Z.; van der Kuijp, T.J.; Yuan, Z.; Huang, L. A review of soil heavy metal pollution from mines in China: Pollution and health risk assessment. Sci. Total Environ. 2014, 468–469, 843–853. [Google Scholar] [CrossRef]
- Luo, X.; Wu, C.; Lin, Y.; Li, W.; Deng, M.; Tan, J.; Xue, S. Soil heavy metal pollution from Pb/Zn smelting regions in China and the remediation potential of biomineralization. J. Environ. Sci. 2023, 125, 662–677. [Google Scholar] [CrossRef]
- Guo, G.; Zhang, D.; Wang, Y. Probabilistic Human Health Risk Assessment of Heavy Metal Intake via Vegetable Consumption around Pb/Zn Smelters in Southwest China. Int. J. Environ. Res. Public Health 2019, 16, 3267. [Google Scholar] [CrossRef]
- Shi, T.; Chen, Y.; Liu, Y.; Wu, G. Visible and near-infrared reflectance spectroscopy—An alternative for monitoring soil contamination by heavy metals. J. Hazard. Mater. 2014, 265, 166–176. [Google Scholar] [CrossRef]
- Chen, L.; Lai, J.; Tan, K.; Wang, X.; Chen, Y.; Ding, J. Development of a soil heavy metal estimation method based on a spectral index: Combining fractional-order derivative pretreatment and the absorption mechanism. Sci. Total Environ. 2022, 813, 151882. [Google Scholar] [CrossRef] [PubMed]
- He, P.; Cheng, X.; Wen, X.; Cao, Y.; Chen, Y. Improving Soil Heavy Metal Lead Inversion Through Combined Band Selection Methods: A Case Study in Gejiu City, China. Sensors 2025, 25, 684. [Google Scholar] [CrossRef]
- Wang, J.; Cui, L.; Gao, W.; Shi, T.; Chen, Y.; Gao, Y. Prediction of low heavy metal concentrations in agricultural soils using visible and near-infrared reflectance spectroscopy. Geoderma 2014, 216, 1–9. [Google Scholar] [CrossRef]
- He, K.; Zhang, X.; Ren, S.; Sun, J. Deep Residual Learning for Image Recognition. In Proceedings of the IEEE Conference on Computer Vision and Pattern Recognition, Las Vegas, NV, USA, 27–30 June 2016; pp. 770–778. [Google Scholar] [CrossRef]
- Zeng, P.; Song, X.; Yang, H.; Wei, N.; Du, L. Digital Soil Mapping of Soil Organic Matter with Deep Learning Algorithms. ISPRS Int. J. Geo-Inf. 2022, 11, 299. [Google Scholar] [CrossRef]
- Ng, W.; Minasny, B.; Mendes, W.d.S.; Demattê, J.A.M. The influence of training sample size on the accuracy of deep learning models for the prediction of soil properties with near-infrared spectroscopy data. Soil 2020, 6, 565–578. [Google Scholar] [CrossRef]
- Pan, S.J.; Yang, Q. A Survey on Transfer Learning. IEEE Trans. Knowl. Data Eng. 2010, 22, 1345–1359. [Google Scholar] [CrossRef]
- Yang, J.; Wang, X.; Wang, R.; Wang, H. Combination of Convolutional Neural Networks and Recurrent Neural Networks for predicting soil properties using Vis–NIR spectroscopy. Geoderma 2020, 380, 114616. [Google Scholar] [CrossRef]
- Kok, M.; Sarjant, S.; Verweij, S.; Vaessen, S.F.C.; Ros, G.H. On-site soil analysis: A novel approach combining NIR spectroscopy, remote sensing and deep learning. Geoderma 2024, 446, 116903. [Google Scholar] [CrossRef]
- Padarian, J.; Minasny, B.; Mcbratney, A.B. Transfer learning to localise a continental soil vis-NIR calibration model. Geoderma 2019, 340, 279–288. [Google Scholar] [CrossRef]
- Zhong, X.; Chen, Z.; Li, Y.; Ding, K.; Liu, W.; Liu, Y.; Yuan, Y.; Zhang, M.; Baker, A.J.M.; Yang, W.; et al. Factors influencing heavy metal availability and risk assessment of soils at typical metal mines in Eastern China. J. Hazard. Mater. 2020, 400, 123289. [Google Scholar] [CrossRef]
- Luo, X.-s.; Yu, S.; Li, X.-d. The mobility, bioavailability, and human bioaccessibility of trace metals in urban soils of Hong Kong. Appl. Geochem. 2012, 27, 995–1004. [Google Scholar] [CrossRef]
- Caporale, A.G.; Violante, A. Chemical Processes Affecting the Mobility of Heavy Metals and Metalloids in Soil Environments. Curr. Pollut. Rep. 2016, 2, 15–27. [Google Scholar] [CrossRef]
- Ke, Z.; Ren, S.; Yin, L. Advancing soil property prediction with encoder-decoder structures integrating traditional deep learning methods in Vis-NIR spectroscopy. Geoderma 2024, 449, 117006. [Google Scholar] [CrossRef]
- Haghi, R.K.; Pérez-Fernández, E.; Robertson, A.H.J. Prediction of various soil properties for a national spatial dataset of Scottish soils based on four different chemometric approaches: A comparison of near infrared and mid-infrared spectroscopy. Geoderma 2021, 396, 115071. [Google Scholar] [CrossRef]
- Zhong, L.; Guo, X.; Ding, M.; Ye, Y.; Jiang, Y.; Zhu, Q.; Li, J. SHAP values accurately explain the difference in modeling accuracy of convolution neural network between soil full-spectrum and feature-spectrum. Comput. Electron. Agric. 2024, 217, 108627. [Google Scholar] [CrossRef]
- Li, C.; Song, L.; Zheng, L.; Ji, R. DSCformer: Lightweight model for predicting soil nitrogen content using VNIR-SWIR spectroscopy. Comput. Electron. Agric. 2025, 230, 109761. [Google Scholar] [CrossRef]
- Mkhatshwa, J.; Kavu, T.; Daramola, O. Analysing the Performance and Interpretability of CNN-Based Architectures for Plant Nutrient Deficiency Identification. Computation 2024, 12, 113. [Google Scholar] [CrossRef]
- Albinet, F.; Peng, Y.; Eguchi, T.; Smolders, E.; Dercon, G. Prediction of exchangeable potassium in soil through mid-infrared spectroscopy and deep learning: From prediction to explainability. Artif. Intell. Agric. 2022, 6, 230–241. [Google Scholar] [CrossRef]
- Orgiazzi, A.; Ballabio, C.; Panagos, P.; Jones, A.; Fernández-Ugalde, O. LUCAS Soil, the largest expandable soil dataset for Europe: A review. Eur. J. SoilSci. 2017, 69, 140–153. [Google Scholar] [CrossRef]
- Panagos, P.; Meusburger, K.; Ballabio, C.; Borrelli, P.; Alewell, C. Soil erodibility in Europe: A high-resolution dataset based on LUCAS. Sci. Total Environ. 2014, 479–480, 189–200. [Google Scholar] [CrossRef]
- Liu, B.; Guo, B.; Zhuo, R.; Dai, F. Estimation of soil organic carbon in LUCAS soil database using Vis-NIR spectroscopy based on hybrid kernel Gaussian process regression. Spectrochim. Acta Part A Mol. Biomol. Spectrosc. 2024, 321, 124687. [Google Scholar] [CrossRef]
- Li, H.; Yao, J.; Min, N.; Duran, R. Comprehensive assessment of environmental and health risks of metal(loid)s pollution from non-ferrous metal mining and smelting activities. J. Clean. Prod. 2022, 375, 134049. [Google Scholar] [CrossRef]
- Cheng, X.; Chen, Z.; Zhou, X.; Huang, Q.; Shen, J.; Chen, Y.; Hou, M.; Xiong, J. Evaluation of Contamination and Ecological and Health Risk in Surface Soil and Crops Contaminated with Metalloids and Heavy Metals in Datun, China, “The World Tin Capital”. Soil. Sediment. Contam. Int. J. 2024. [Google Scholar] [CrossRef]
- Lundberg, S.M.; Lee, S.-I. A Unified Approach to Interpreting Model Predictions. In Proceedings of the Advances in Neural Information Processing Systems, Long Beach, CA, USA, 4–9 December 2017; Volume 30, pp. 4765–4774. [Google Scholar]
- Wu, Y.; Chen, J.; Wu, X.; Tian, Q.; Ji, J.; Qin, Z. Possibilities of reflectance spectroscopy for the assessment of contaminant elements in suburban soils. Appl. Geochem. 2005, 20, 1051–1059. [Google Scholar] [CrossRef]
- Zhou, M.; Zou, B.; Tu, Y.; Feng, H.; He, C.; Ma, X.; Ning, J. Spectral response feature bands extracted from near standard soil samples for estimating soil Pb in a mining area. Geocarto Int. 2022, 37, 13248–13267. [Google Scholar] [CrossRef]
- Arif, M.; Qi, Y.; Dong, Z.; Wei, H. Rapid retrieval of cadmium and lead content from urban greenbelt zones using hyperspectral characteristic bands. J. Clean. Prod. 2022, 374, 133922. [Google Scholar] [CrossRef]
- Khosravi, V.; Doulati Ardejani, F.; Yousefi, S.; Aryafar, A. Monitoring soil lead and zinc contents via combination of spectroscopy with extreme learning machine and other data mining methods. Geoderma 2018, 318, 29–41. [Google Scholar] [CrossRef]
- Viscarra Rossel, R.A.; Walvoort, D.J.J.; McBratney, A.B.; Janik, L.J.; Skjemstad, J.O. Visible, near infrared, mid infrared or combined diffuse reflectance spectroscopy for simultaneous assessment of various soil properties. Geoderma 2006, 131, 59–75. [Google Scholar] [CrossRef]
- Tan, K.; Ma, W.; Chen, L.; Wang, H.; Du, Q.; Du, P.; Yan, B.; Liu, R.; Li, H. Estimating the distribution trend of soil heavy metals in mining area from HyMap airborne hyperspectral imagery based on ensemble learning. J. Hazard. Mater. 2021, 401, 123288. [Google Scholar] [CrossRef]
- Rathod, P.H.; Rossiter, D.G.; Noomen, M.F.; van der Meer, F.D. Proximal Spectral Sensing to Monitor Phytoremediation of Metal-Contaminated Soils. Int. J. Phytoremediation 2013, 15, 405–426. [Google Scholar] [CrossRef]
- Liu, J.; Li, X.; Zhang, P.; Zhu, Q.; Lu, W.; Yang, Y.; Li, Y.; Zhou, J.; Wu, L.; Zhang, N.; et al. Contamination levels of and potential risks from metal(loid)s in soil-crop systems in high geological background areas. Sci. Total Environ. 2023, 881, 163405. [Google Scholar] [CrossRef]
- Ashraf, M.A.; Maah, M.J.; Yusoff, I. Heavy metals accumulation in plants growing in ex tin mining catchment. Int. J. Environ. Sci. Technol. 2011, 8, 401–416. [Google Scholar] [CrossRef]
- Vega, F.A.; Covelo, E.F.; Andrade, M.L. Competitive sorption and desorption of heavy metals in mine soils: Influence of mine soil characteristics. J. Colloid Interface Sci. 2006, 298, 582–592. [Google Scholar] [CrossRef]
- Jiang, H.; Li, T.; Han, X.; Yang, X.; He, Z. Effects of pH and low molecular weight organic acids on competitive adsorption and desorption of cadmium and lead in paddy soils. Environ. Monit. Assess. 2012, 184, 6325–6335. [Google Scholar] [CrossRef]
- Lu, Q.; Wang, S.; Bai, X.; Liu, F.; Wang, M.; Wang, J.; Tian, S. Rapid inversion of heavy metal concentration in karst grain producing areas based on hyperspectral bands associated with soil components. Microchem. J. 2019, 148, 404–411. [Google Scholar] [CrossRef]
- Rossel, R.A.V.; Behrens, T. Using data mining to model and interpret soil diffuse reflectance spectra. Geoderma 2010, 158, 46–54. [Google Scholar] [CrossRef]
- Viscarra Rossel, R.A.; Behrens, T.; Ben-Dor, E.; Brown, D.J.; Demattê, J.A.M.; Shepherd, K.D.; Shi, Z.; Stenberg, B.; Stevens, A.; Adamchuk, V.; et al. A global spectral library to characterize the world’s soil. Earth-Sci. Rev. 2016, 155, 198–230. [Google Scholar] [CrossRef]
- Wang, Y.; Zou, B.; Chai, L.; Lin, Z.; Feng, H.; Tang, Y.; Tian, R.; Tu, Y.; Zhang, B.; Zou, H. Monitoring of soil heavy metals based on hyperspectral remote sensing: A review. Earth-Sci. Rev. 2024, 254, 104814. [Google Scholar] [CrossRef]
- Stenberg, B.; Viscarra Rossel, R.A.; Mouazen, A.M.; Wetterlind, J. Chapter Five—Visible and Near Infrared Spectroscopy in Soil Science. In Advances in Agronomy; Sparks, D.L., Ed.; Academic Press: Cambridge, MA, USA, 2010; Volume 107, pp. 163–215. [Google Scholar]
- Wang, Y.; Zhang, X.; Sun, W.; Wang, J.; Ding, S.; Liu, S. Effects of hyperspectral data with different spectral resolutions on the estimation of soil heavy metal content: From ground-based and airborne data to satellite-simulated data. Sci. Total Environ. 2022, 838, 156129. [Google Scholar] [CrossRef]
- Hong, Y.; Shen, R.; Cheng, H.; Chen, Y.; Zhang, Y.; Liu, Y.; Zhou, M.; Yu, L.; Liu, Y.; Liu, Y. Estimating lead and zinc concentrations in peri-urban agricultural soils through reflectance spectroscopy: Effects of fractional-order derivative and random forest. Sci. Total Environ. 2019, 651, 1969–1982. [Google Scholar] [CrossRef]

| Layer | Type | Filters | Kernel Size | Stride | Width | Number of Parameters | Actication |
|---|---|---|---|---|---|---|---|
| 1 | Input | - | - | - | 2100 | 0 | - |
| 2 | AvgPool | - | 10× | 1 | 210 | 0 | - |
| 3 | Convolutional | 48 | 3 × 1 | 1 | 210 | 192 | Leaky Relu (alpha = 0.01) |
| 4 | Maxpooling | - | 2 × 1 | - | 105 | 0 | - |
| 5 | Residual Block | 48 | 3 × 1 | 1 | 105 | 6960 | Relu |
| 48 | 3 × 1 | 1 | 105 | 6960 | - | ||
| 6 | Residual Block | 48 | 3 × 1 | 1 | 105 | 6960 | Relu |
| 48 | 3 × 1 | 1 | 105 | 6960 | |||
| 7 | Convolutional | 32 | 3 × 1 | 1 | 105 | 4640 | Leaky Relu (alpha = 0.01) |
| 8 | Maxpooling | - | 2 × 1 | - | 52 | 0 | - |
| 9 | Flatten | - | - | - | 1664 | 0 | - |
| 10 | Dense (Fully connected) | - | - | - | 16 | 16,640 | Leaky Relu (alpha = 0.01) |
| 11 | Dense (Fully connected) | - | - | - | 10 | 170 | Leaky Relu (alpha = 0.01) |
| 12 | Output | - | - | - | 1 | 11 | Relu |
| Model | Dataset | Training Samples | Testing Samples | Trained Layers | Frozen Layers |
|---|---|---|---|---|---|
| ResNet-pH | LUCAS | 14,277 | 4759 | All | None |
| ResNet-Pb | Gejiu | 98 | 32 | All | None |
| ResNet-pH-Pb | Gejiu | 98 | 32 | Max-pooling, Dense | Convolutional, Residual |
| Dataset | Sample Size | Property | Min | Max | Mean | SD | CV | Skew | Kurt | Median |
|---|---|---|---|---|---|---|---|---|---|---|
| LUCAS | 19,036 | pH | 3.21 | 10.08 | 6.02 | 1.35 | 0.22 | −0.07 | −1.24 | 6.21 |
| Gejiu | 130 | Pb | 34.6 | 9720 | 974.06 | 1969.17 | 2.02 | 3.12 | 9.1 | 232 |
Disclaimer/Publisher’s Note: The statements, opinions and data contained in all publications are solely those of the individual author(s) and contributor(s) and not of MDPI and/or the editor(s). MDPI and/or the editor(s) disclaim responsibility for any injury to people or property resulting from any ideas, methods, instructions or products referred to in the content. |
© 2025 by the authors. Licensee MDPI, Basel, Switzerland. This article is an open access article distributed under the terms and conditions of the Creative Commons Attribution (CC BY) license (https://creativecommons.org/licenses/by/4.0/).
Share and Cite
He, P.; Cheng, X.; Wen, X.; Yi, Y.; Chen, Z.; Chen, Y. Transfer Learning-Based Interpretable Soil Lead Prediction in the Gejiu Mining Area, Yunnan. Sensors 2025, 25, 4209. https://doi.org/10.3390/s25134209
He P, Cheng X, Wen X, Yi Y, Chen Z, Chen Y. Transfer Learning-Based Interpretable Soil Lead Prediction in the Gejiu Mining Area, Yunnan. Sensors. 2025; 25(13):4209. https://doi.org/10.3390/s25134209
Chicago/Turabian StyleHe, Ping, Xianfeng Cheng, Xingping Wen, Yan Yi, Zailin Chen, and Yu Chen. 2025. "Transfer Learning-Based Interpretable Soil Lead Prediction in the Gejiu Mining Area, Yunnan" Sensors 25, no. 13: 4209. https://doi.org/10.3390/s25134209
APA StyleHe, P., Cheng, X., Wen, X., Yi, Y., Chen, Z., & Chen, Y. (2025). Transfer Learning-Based Interpretable Soil Lead Prediction in the Gejiu Mining Area, Yunnan. Sensors, 25(13), 4209. https://doi.org/10.3390/s25134209