


Measurement of Ultra-Low Frequency Vibrations Using an Atom Interferometer
Abstract
1. Introduction

| Frequency Ranges | Self-Noise | |
|---|---|---|
| accelerometers [30] | DC—430 Hz | (0.01 Hz) |
| seismometers [31] | 0.0083 Hz–80 Hz | (0.01 Hz) |
| laser vibrometers [32] | DC—22 kHz | (0.5 Hz) |
| atom interferometer | DC—100 Hz | (0.01 Hz this article) (0.01 Hz future) [33] |
2. Principle
3. Vibration Measurement
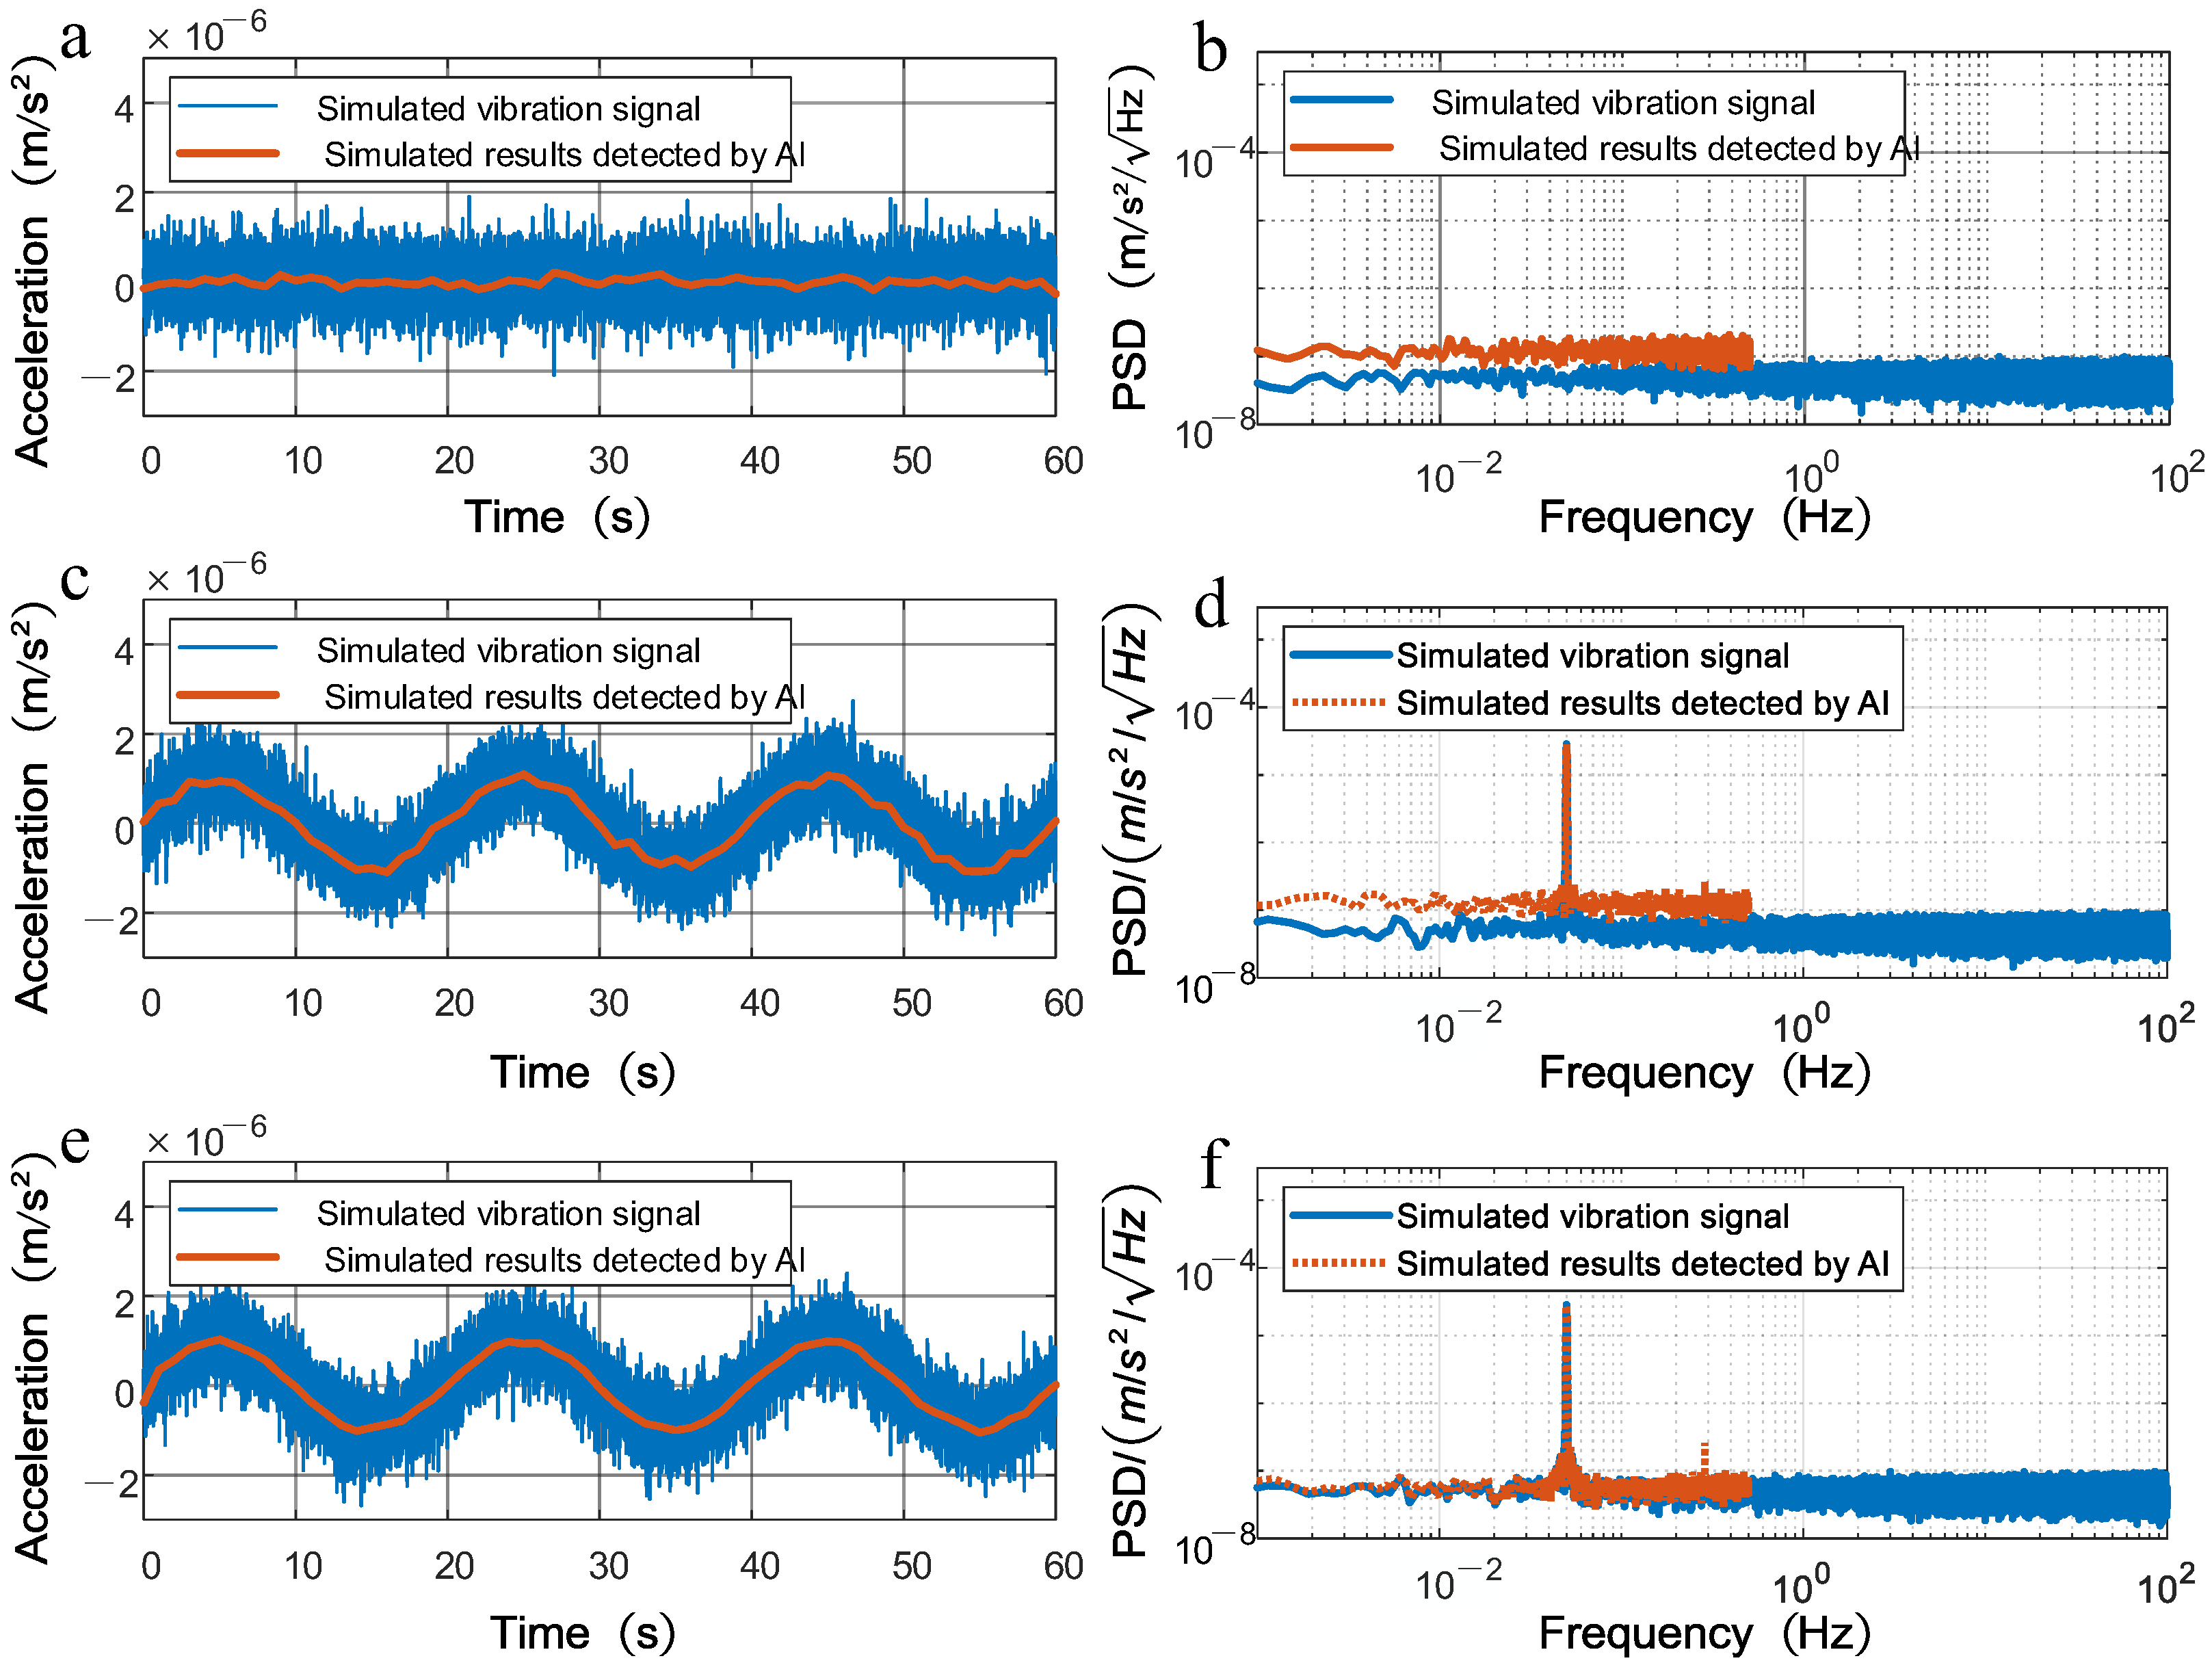
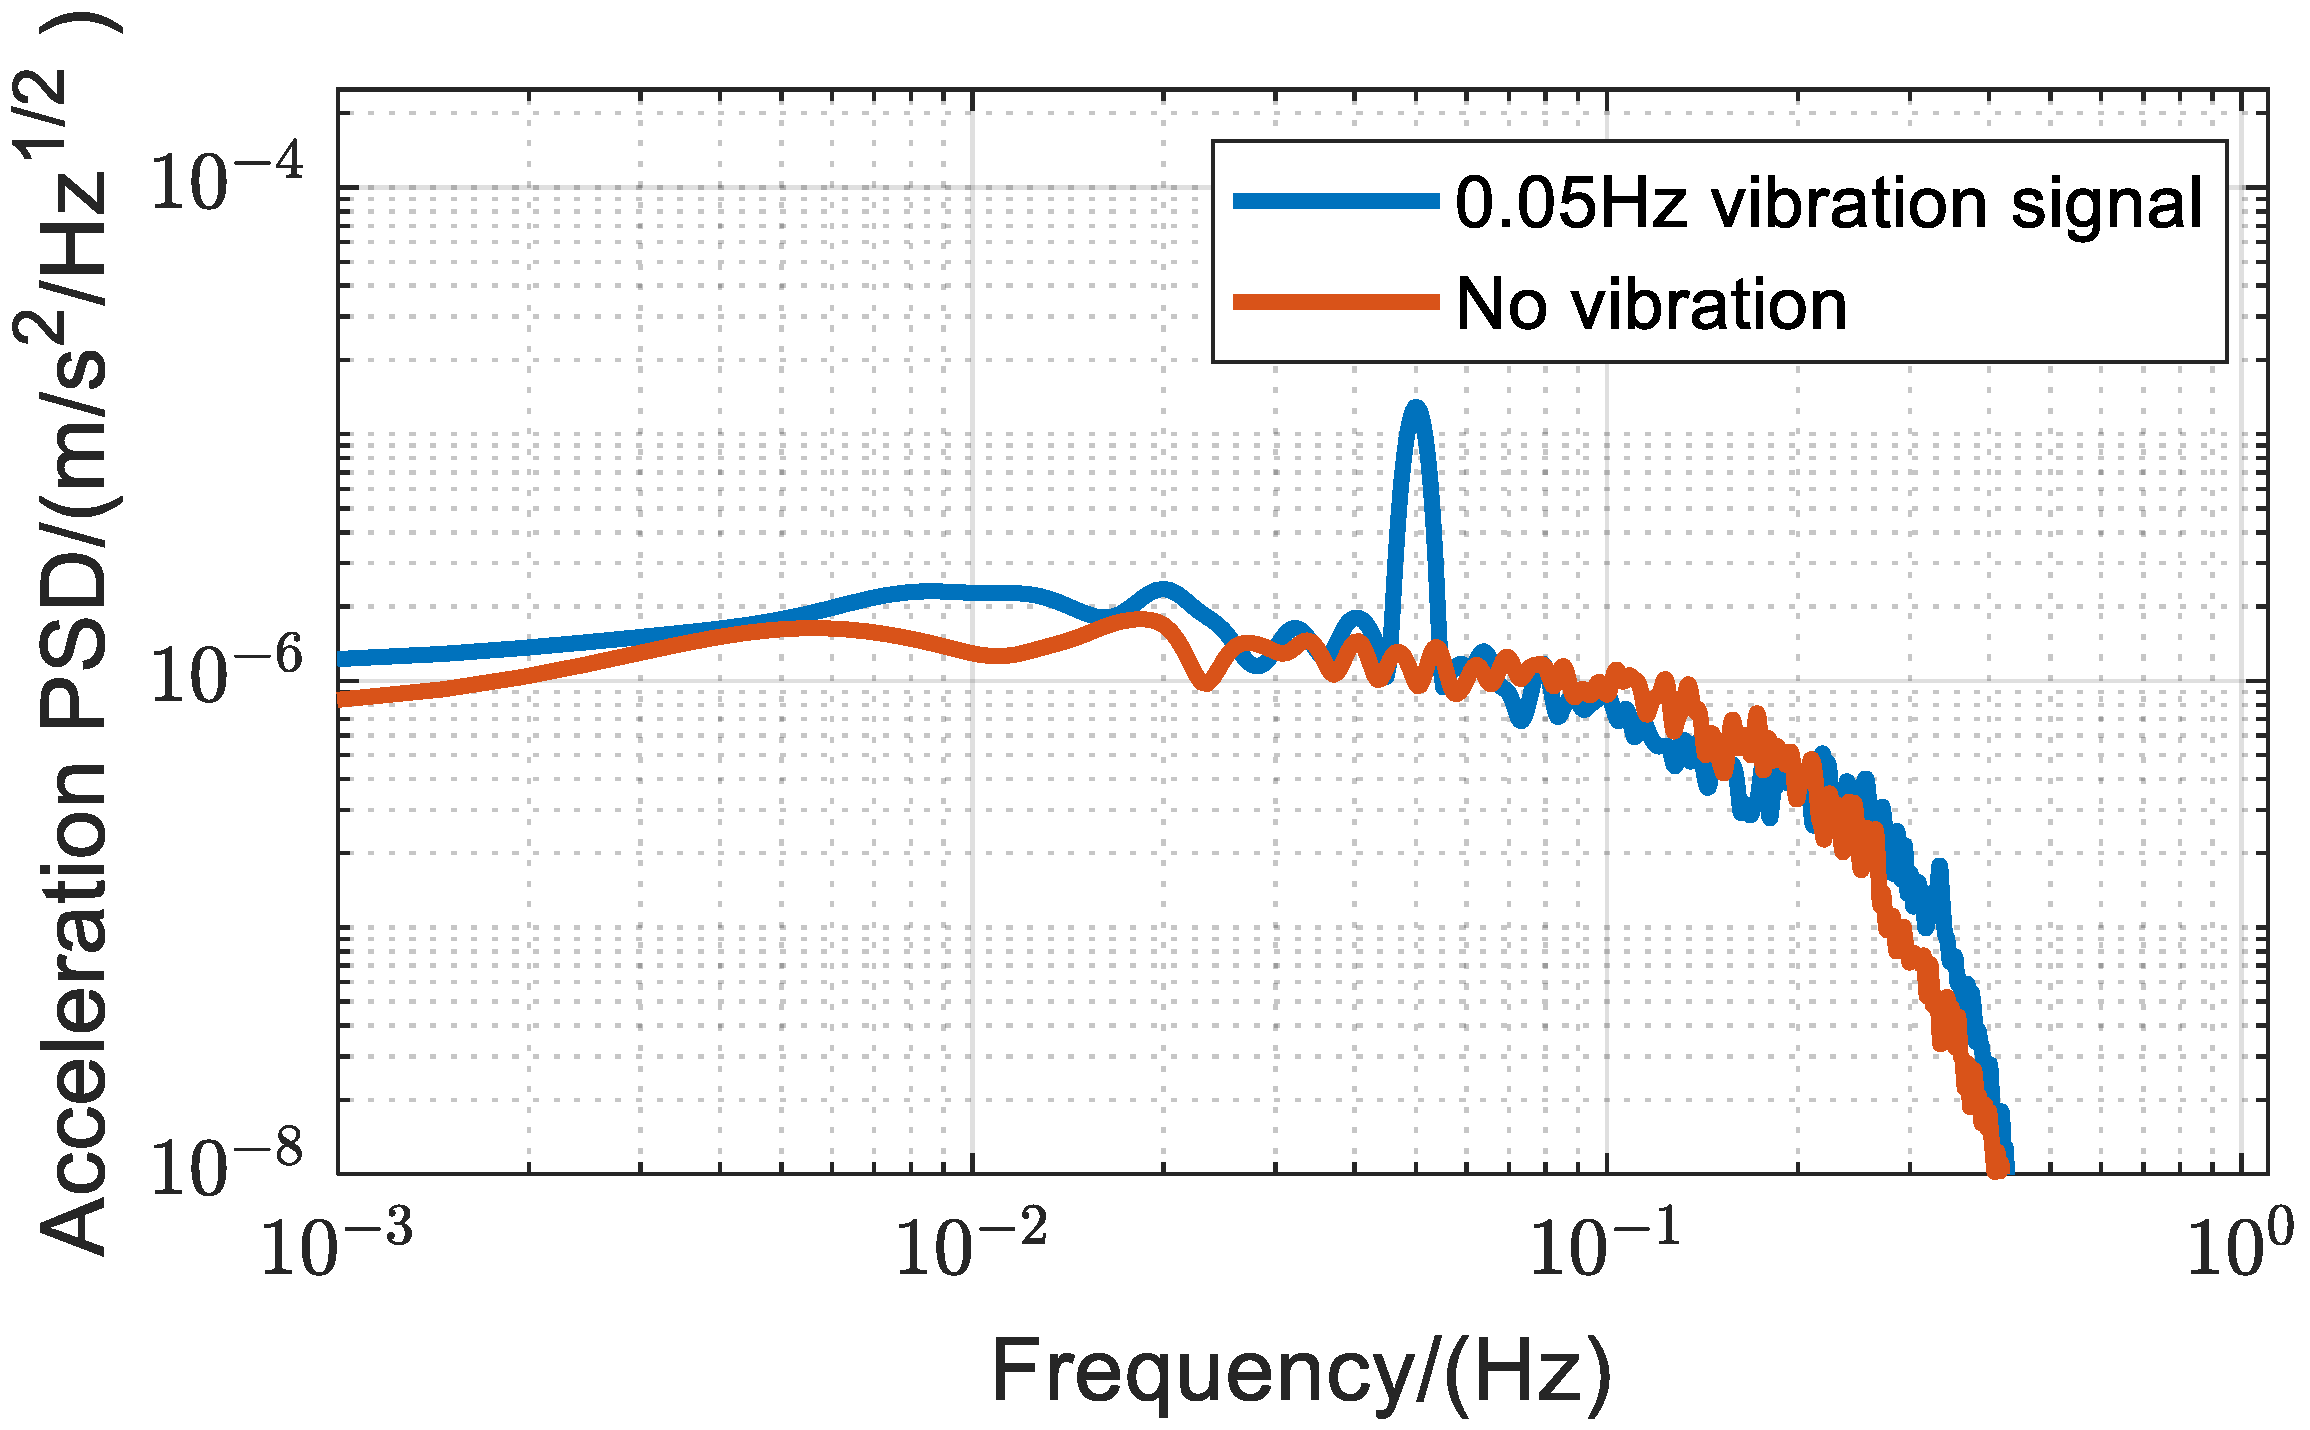
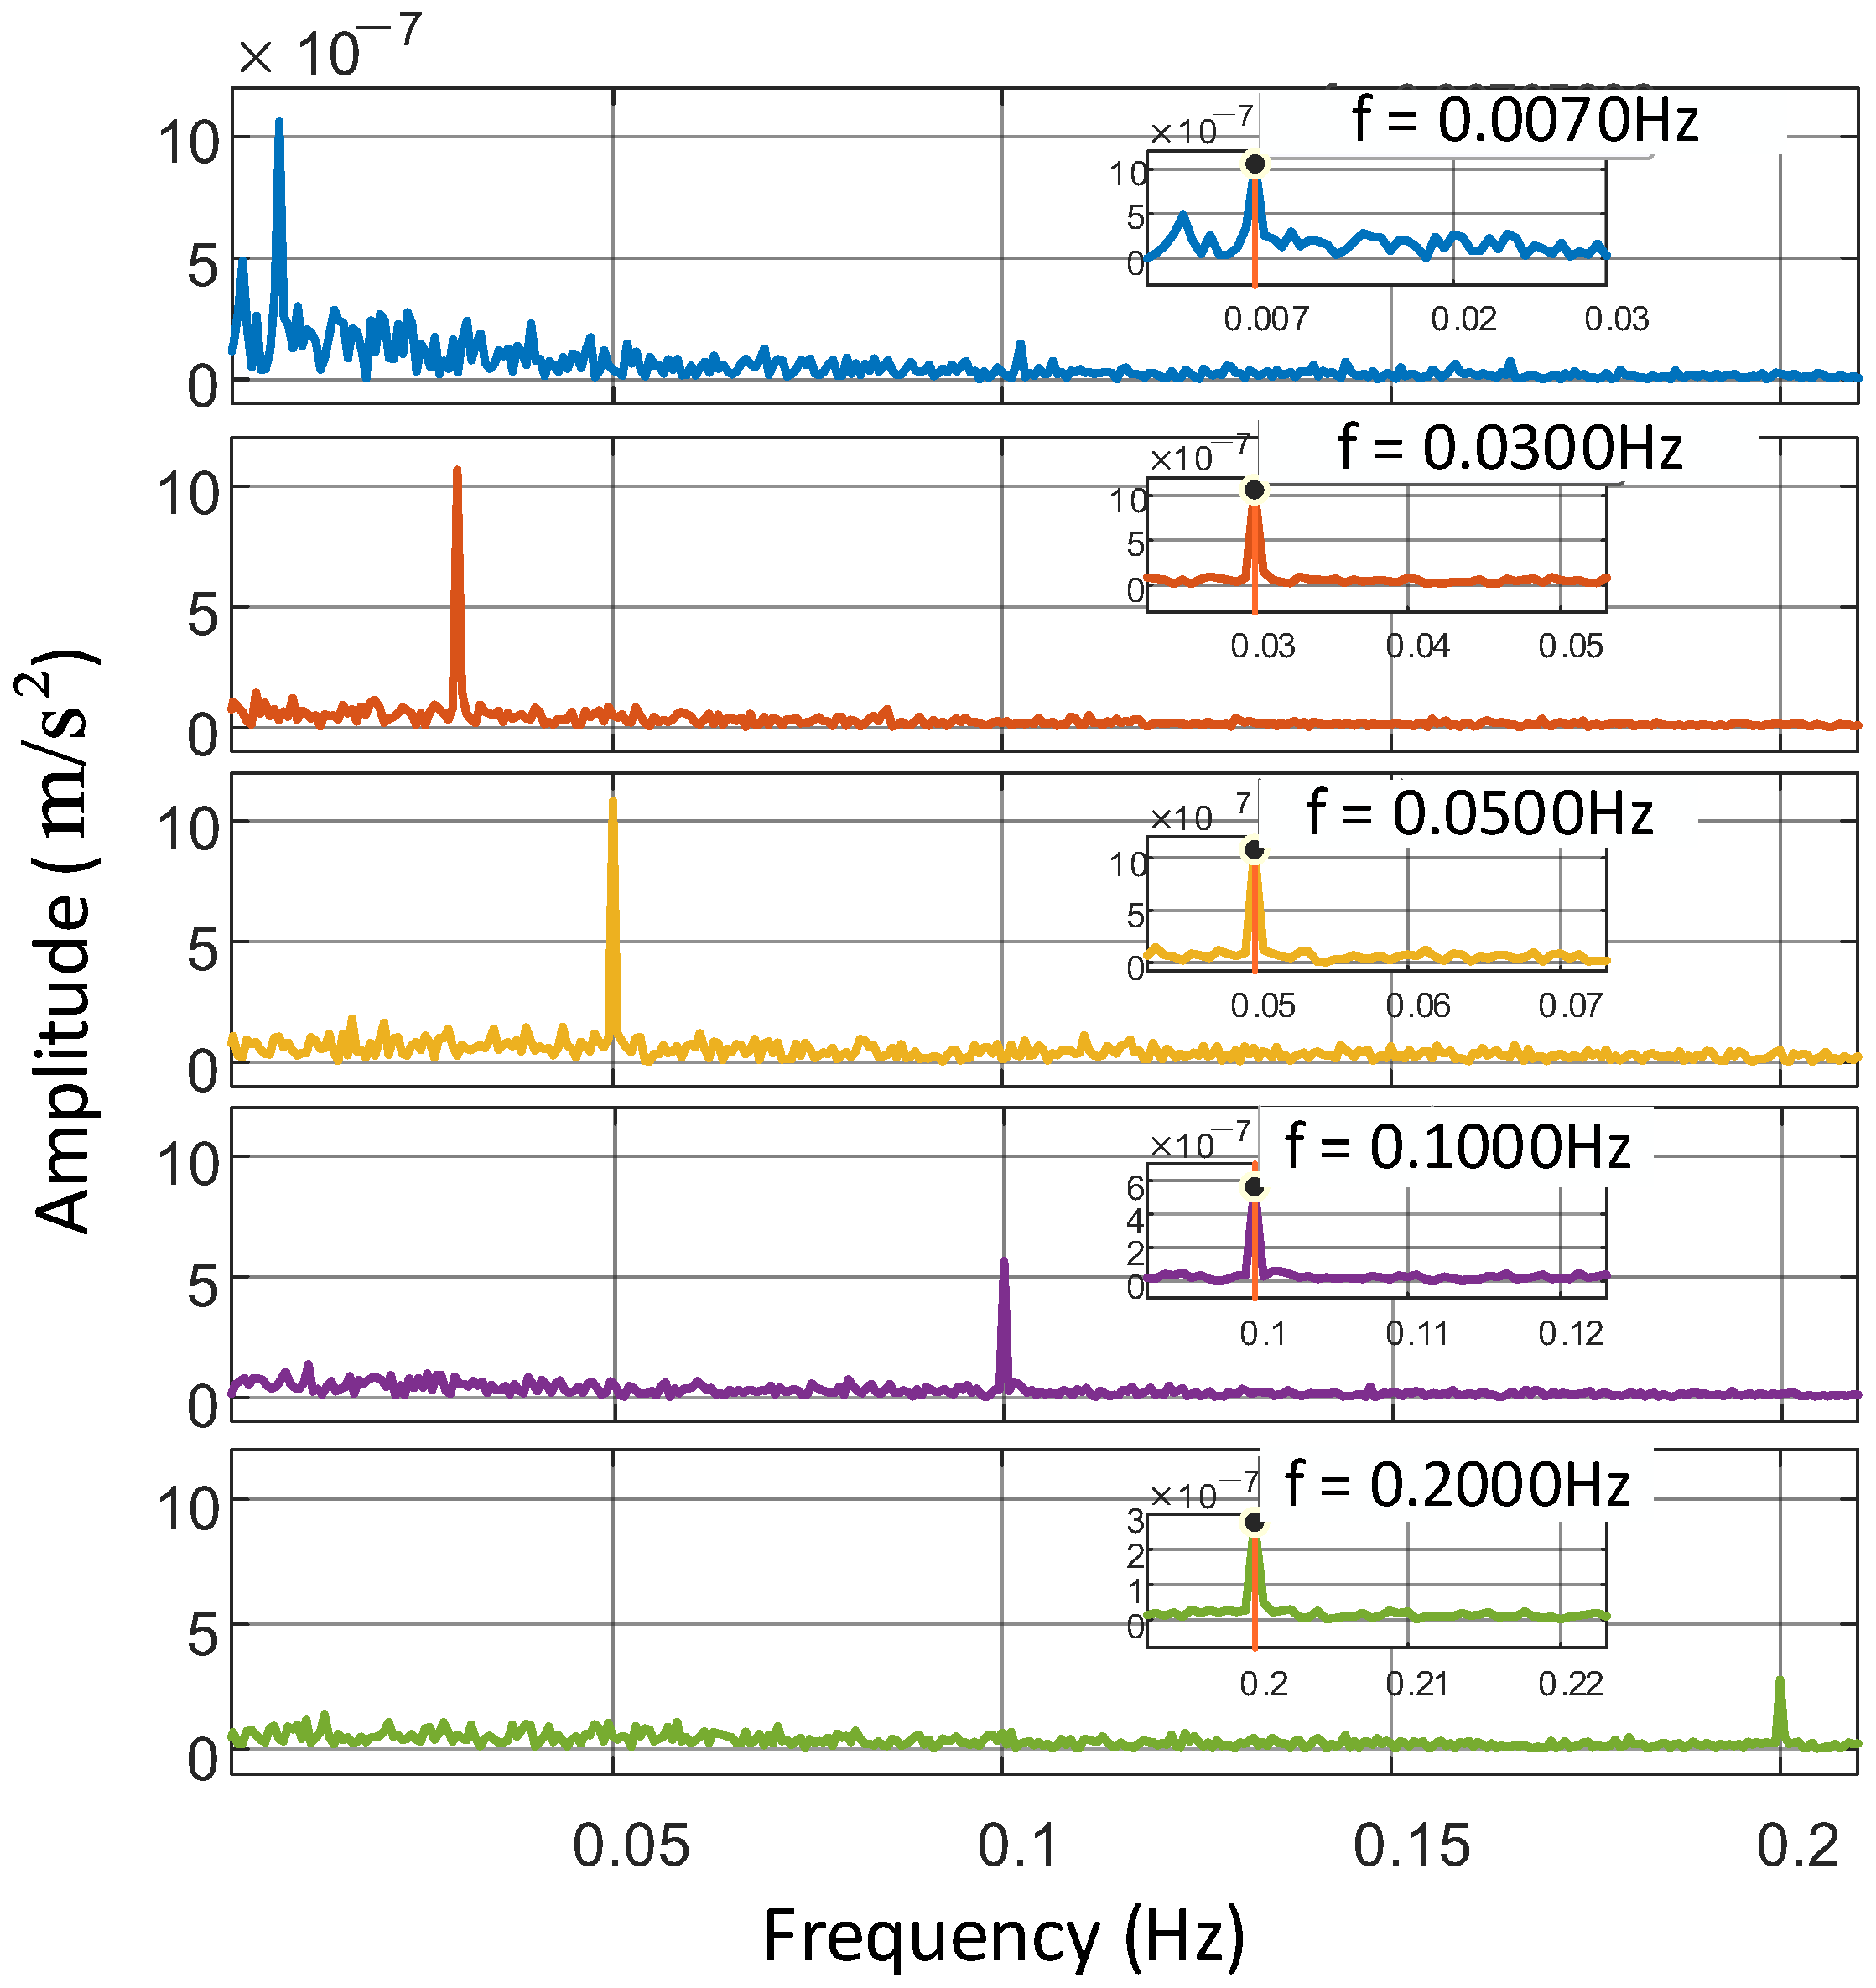
3.1. Simulation
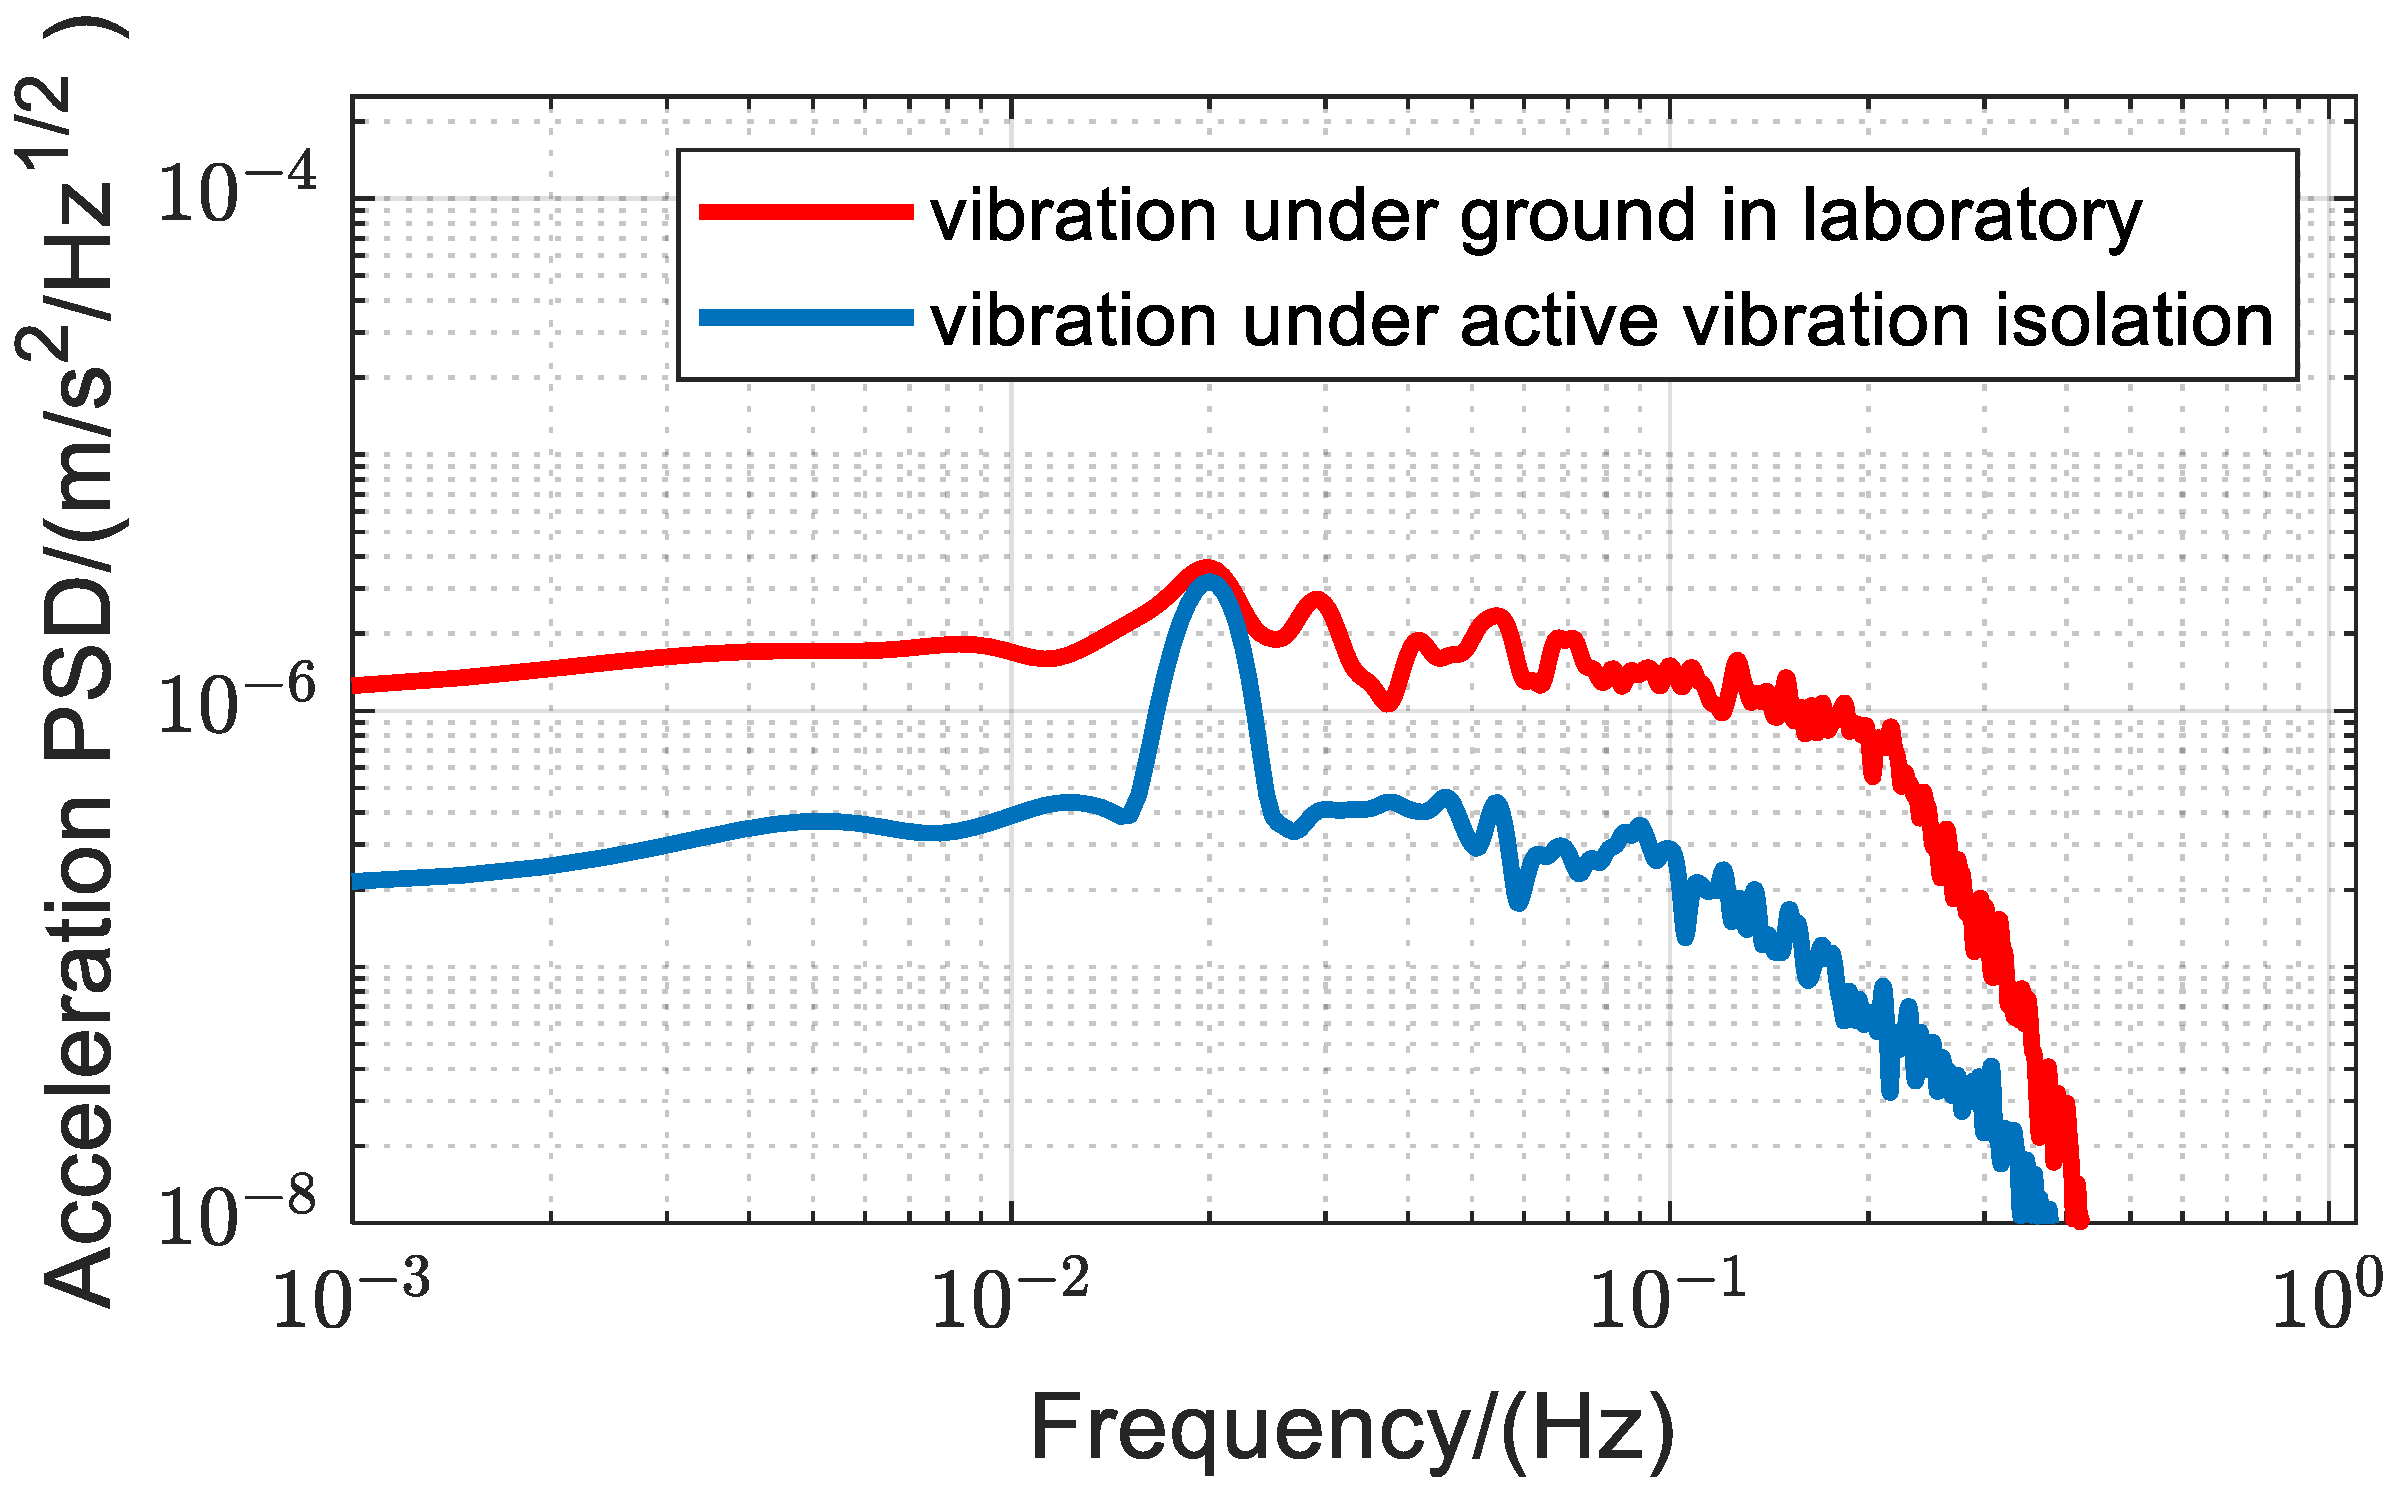
3.2. Experiments
4. Conclusions
Author Contributions
Funding
Institutional Review Board Statement
Informed Consent Statement
Data Availability Statement
Acknowledgments
Conflicts of Interest
References
- Wu, T.; You, D.; Gao, H.; Lian, P.; Ma, W.; Zhou, X.; Wang, C.; Luo, J.; Zhang, H.; Tan, H. Research Status and Development Trend of Piezoelectric Accelerometer. Crystals 2023, 13, 1363. [Google Scholar] [CrossRef]
- Hou, Y.; Jiao, R.; Yu, H. MEMS based geophones and seismometers. Sens. Actuators A 2021, 318, 112498. [Google Scholar] [CrossRef]
- Hancox, J.; Staples, B.; Parker, R.J. The application of scanning laser Doppler vibrometry in aero-engine development. Proc. Inst. Mech. Eng. Part G 1995, 209, 35–42. [Google Scholar] [CrossRef]
- Dornfeld, D.; Lee, D.-E. Sensors for Precision Manufacturing; Springer: Berlin/Heidelberg, Germany, 2008. [Google Scholar]
- Kitazaki, S.; Griffin, M.J. Resonance behaviour of the seated human body and effects of posture. J. Biomech. 1997, 31, 143–149. [Google Scholar] [CrossRef]
- Lei, Y.; Li, R.; Zhang, L.; Hu, P.; Huang, Q. Optical accelerometers for detecting low-frequency micro-vibrations. Appl. Sci. 2022, 12, 3994. [Google Scholar] [CrossRef]
- Roy, A.; Sarkar, S.; Goap, A.; Ghosh, R.; Gaurav, A.; Akula, A.; Kumar, S. Seismic Instrumentation and Its Application. In Handbook of Vibroacoustics, Noise and Harshness; Springer: Berlin/Heidelberg, Germany, 2024; pp. 1–36. [Google Scholar]
- Rothberg, S.J.; Allen, M.; Castellini, P.; Di Maio, D.; Dirckx, J.; Ewins, D.; Halkon, B.J.; Muyshondt, P.; Paone, N.; Ryan, T. An international review of laser Doppler vibrometry: Making light work of vibration measurement. Opt. Lasers Eng. 2017, 99, 11–22. [Google Scholar] [CrossRef]
- Lutzmann, P.; Göhler, B.; Hill, C.A.; Putten, F.V. Laser vibration sensing at Fraunhofer IOSB: Review and applications. Opt. Eng. 2017, 56, 031215. [Google Scholar] [CrossRef]
- Berman, P.R. Atom Interferometry; Academic Press: Cambridge, MA, USA, 1997. [Google Scholar]
- Cronin, A.D.; Schmiedmayer, J.; Pritchard, D.E. Optics and interferometry with atoms and molecules. Rev. Mod. Phys. 2009, 81, 1051. [Google Scholar] [CrossRef]
- Geiger, R.; Ménoret, V.; Stern, G.; Zahzam, N.; Cheinet, P.; Battelier, B.; Villing, A.; Moron, F.; Lours, M.; Bidel, Y.; et al. Detecting inertial effects with airborne matter-wave interferometry. Nat. Commun. 2011, 2, 474. [Google Scholar] [CrossRef]
- Savoie, D.; Altorio, M.; Fang, B.; Sidorenkov., L.A.; Geiger., R.; Landragin, A. Interleaved atom interferometry for high-sensitivity inertial measurements. Sci. Adv. 2018, 4, eaau7948. [Google Scholar] [CrossRef]
- Durfee, D.; Shaham, Y.; Kasevich, M. Long-term stability of an area-reversible atom-interferometer Sagnac gyroscope. Phys. Rev. Lett. 2006, 97, 240801. [Google Scholar] [CrossRef]
- Peters, A.; Chung, K.Y.; Chu, S. High-precision gravity measurements using atom interferometry. Metrologia 2001, 38, 25. [Google Scholar] [CrossRef]
- Wu, X.; Pagel, Z.; Malek, B.S.; Nguyen, T.H.; Zi, F.; Scheirer, D.S.; Müller, H. Gravity surveys using a mobile atom interferometer. Sci. Adv. 2019, 5, eaax0800. [Google Scholar] [CrossRef] [PubMed]
- Zhou, L.; Xiong, Z.; Yang, W.; Tang, B.; Peng, W.; Wang, Y.; Xu, P.; Wang, J.; Zhan, M. Measurement of local gravity via a cold atom interferometer. Chin. Phys. Lett. 2011, 28, 013701. [Google Scholar] [CrossRef]
- Ruan, C.; Zhuang, W.; Yao, J.; Zhao, Y.; Ma, Z.; Yi, C.; Tian, Q.; Wu, S.; Fang, F.; Wen, Y. A Transportable Atomic Gravimeter with Constraint-Structured Active Vibration Isolation. Sensors 2024, 24, 2395. [Google Scholar] [CrossRef]
- Xu, A.; Kong, D.; Fu, Z.; Wang, Z.; Lin, Q. Vibration compensation of an atom gravimeter. Chin. Opt. Lett. 2019, 17, 070201. [Google Scholar] [CrossRef]
- Richardson, L.L. Inertial Noise Post-Correction in Atom Interferometers Measuring the Local Gravitational Acceleration; Institutionelles Repositorium der Leibniz Universität Hannover: Hannover, Germany, 2019. [Google Scholar]
- Schmidt, M.; Senger, A.; Hauth, M.; Freier, C.; Schkolnik, V.; Peters, A. A mobile high-precision absolute gravimeter based on atom interferometry. Gyroscopy Navig. 2011, 2, 170–177. [Google Scholar] [CrossRef]
- Oon, F.E.; Dumke, R. Compact Active Vibration Isolation and Tilt Stabilization for a Portable High-Precision Atomic Gravimeter. Phys. Rev. Appl. 2022, 18, 044037. [Google Scholar] [CrossRef]
- Zhou, M.; Hu, Z.; Duan, X.; Sun, B.; Chen, L.; Zhang, Q.; Luo, J. Performance of a cold-atom gravimeter with an active vibration isolator. Phys. Rev. A At. Mol. Opt. Phys. 2012, 86, 043630. [Google Scholar] [CrossRef]
- Tang, B.; Zhou, L.; Xiong, Z.; Wang, J.; Zhan, M. A programmable broadband low frequency active vibration isolation system for atom interferometry. Rev. Sci. Instrum. 2014, 85, 093109. [Google Scholar] [CrossRef]
- Zhou, M.; Xiong, X.; Chen, L.; Cui, J.; Duan, X.; Hu, Z. Note: A three-dimension active vibration isolator for precision atom gravimeters. Rev. Sci. Instrum. 2015, 86, 046108. [Google Scholar] [CrossRef]
- Chen, B.; Long, J.; Xie, H.; Chen, L.; Chen, S. A mobile three-dimensional active vibration isolator and its application to cold atom interferometry. Acta Phys. Sin. 2019, 68, 183301. [Google Scholar] [CrossRef]
- Merlet, S.; Le Gouët, J.; Bodart, Q.; Clairon, A.; Landragin, A.; Pereira Dos Santos, F.; Rouchon, P. Operating an atom interferometer beyond its linear range. Metrologia 2009, 46, 87–94. [Google Scholar] [CrossRef]
- Lautier, J.; Volodimer, L.; Hardin, T.; Merlet, S.; Lours, M.; Pereira Dos Santos, F.; Landragin, A. Hybridizing matter-wave and classical accelerometers. Appl. Phys. Lett. 2014, 105, 144102. [Google Scholar] [CrossRef]
- Yao, J.M.; Zhuang, W.; Feng, J.Y.; Wang, Q.Y.; Zhao, Y.; Wang, S.K.; Wu, S.Q.; Li, T.C. A coefficient searching based vibration correction method. Acta Phys. Sin. 2022, 71, 119101. [Google Scholar] [CrossRef]
- Small Broadband Seismometer (GL-CS60/120). Available online: http://geolight.cn/p.aspx?id=40&&type=2 (accessed on 25 May 2025).
- Greenview Geo. Titan Accelerometer (Strong Motion Meter) Product Page. Available online: https://www.greenviewgeo.cn/zh-hant/products/titan (accessed on 25 May 2025).
- Polytec Optical. Product Introduction: Optical Fiber Seismic Sensor. Available online: http://www.polytecoptical.com/productshow.php?id=321 (accessed on 25 May 2025).
- Zhang, T.; Chen, L.; Shu, Y.; Xu, W.; Cheng, Y.; Luo, Q.; Hu, Z.; Zhou, M. Ultrahigh-Sensitivity Bragg Atom Gravimeter and its Application in Testing Lorentz Violation. Phys. Rev. Appl. 2023, 20, 014067. [Google Scholar] [CrossRef]
- Cheinet, P.; Canuel, B.; Dos Santos, F.P.; Gauguet, A.; Yver-Leduc, F.; Landragin, A. Measurement of the sensitivity function in a time-domain atomic interferometer. IEEE Trans. Instrum. Meas. 2008, 57, 1141–1148. [Google Scholar] [CrossRef]
- Ménoret, V.; Vermeulen, P.; Le Moigne, N.; Bonvalot, S.; Bouyer, P.; Landragin, A.; Desruelle, B. Gravity measurements below 10−9 g with a transportable absolute quantum gravimeter. Sci. Rep. 2018, 8, 12300. [Google Scholar] [CrossRef]


Disclaimer/Publisher’s Note: The statements, opinions and data contained in all publications are solely those of the individual author(s) and contributor(s) and not of MDPI and/or the editor(s). MDPI and/or the editor(s) disclaim responsibility for any injury to people or property resulting from any ideas, methods, instructions or products referred to in the content. |
© 2025 by the authors. Licensee MDPI, Basel, Switzerland. This article is an open access article distributed under the terms and conditions of the Creative Commons Attribution (CC BY) license (https://creativecommons.org/licenses/by/4.0/).
Share and Cite
Ma, Z.; Zhuang, W.; Zhao, Y.; Ruan, C.; Tian, Q.; Yao, J.; Feng, J.; Wu, S.; Fang, F.; Wan, L. Measurement of Ultra-Low Frequency Vibrations Using an Atom Interferometer. Sensors 2025, 25, 4136. https://doi.org/10.3390/s25134136
Ma Z, Zhuang W, Zhao Y, Ruan C, Tian Q, Yao J, Feng J, Wu S, Fang F, Wan L. Measurement of Ultra-Low Frequency Vibrations Using an Atom Interferometer. Sensors. 2025; 25(13):4136. https://doi.org/10.3390/s25134136
Chicago/Turabian StyleMa, Zenghan, Wei Zhuang, Yang Zhao, Chuanjing Ruan, Qin Tian, Jiamin Yao, Jinyang Feng, Shuqing Wu, Fang Fang, and Ling Wan. 2025. "Measurement of Ultra-Low Frequency Vibrations Using an Atom Interferometer" Sensors 25, no. 13: 4136. https://doi.org/10.3390/s25134136
APA StyleMa, Z., Zhuang, W., Zhao, Y., Ruan, C., Tian, Q., Yao, J., Feng, J., Wu, S., Fang, F., & Wan, L. (2025). Measurement of Ultra-Low Frequency Vibrations Using an Atom Interferometer. Sensors, 25(13), 4136. https://doi.org/10.3390/s25134136