
Risk Mitigation of a Heritage Bridge Using Noninvasive Sensors


Abstract
1. Introduction
1.1. Assessment of Historical Structures in Literature
1.2. Current Practices of Bridge Assessments in Australia
- Level 1 inspections involve routine visual assessments aimed at identifying irregularities or anomalies that may warrant further investigation. Common issues noted during these inspections include excessive cracking, corrosion of steel components, degradation of expansion joints, and bearing deformations. In the state of Victoria, Level 1 inspections are typically conducted biannually by trained inspectors, not necessarily professional engineers. Level 1 inspections are also conducted after major events, such as flooding or passage of overweight, overmass vehicles.
- Level 2 inspections provide more detailed and quantified information to support asset management and maintenance planning. These visual assessments evaluate the outcomes of past rehabilitation efforts, identify current maintenance requirements, and support the forecasting of future condition deterioration and budgetary needs. In Victoria, Level 2 inspections are generally conducted every 3–5 years by more experienced bridge inspectors, often under engineers’ supervision.
- Level 3 inspections consist of comprehensive structural investigations undertaken by qualified engineers. These may involve advanced techniques such as structural modelling, load testing, and both destructive and non-destructive testing methods. Level 3 inspections are typically initiated in response to findings from Level 1 or 2 assessments and must be conducted by structural engineers or technical specialists.
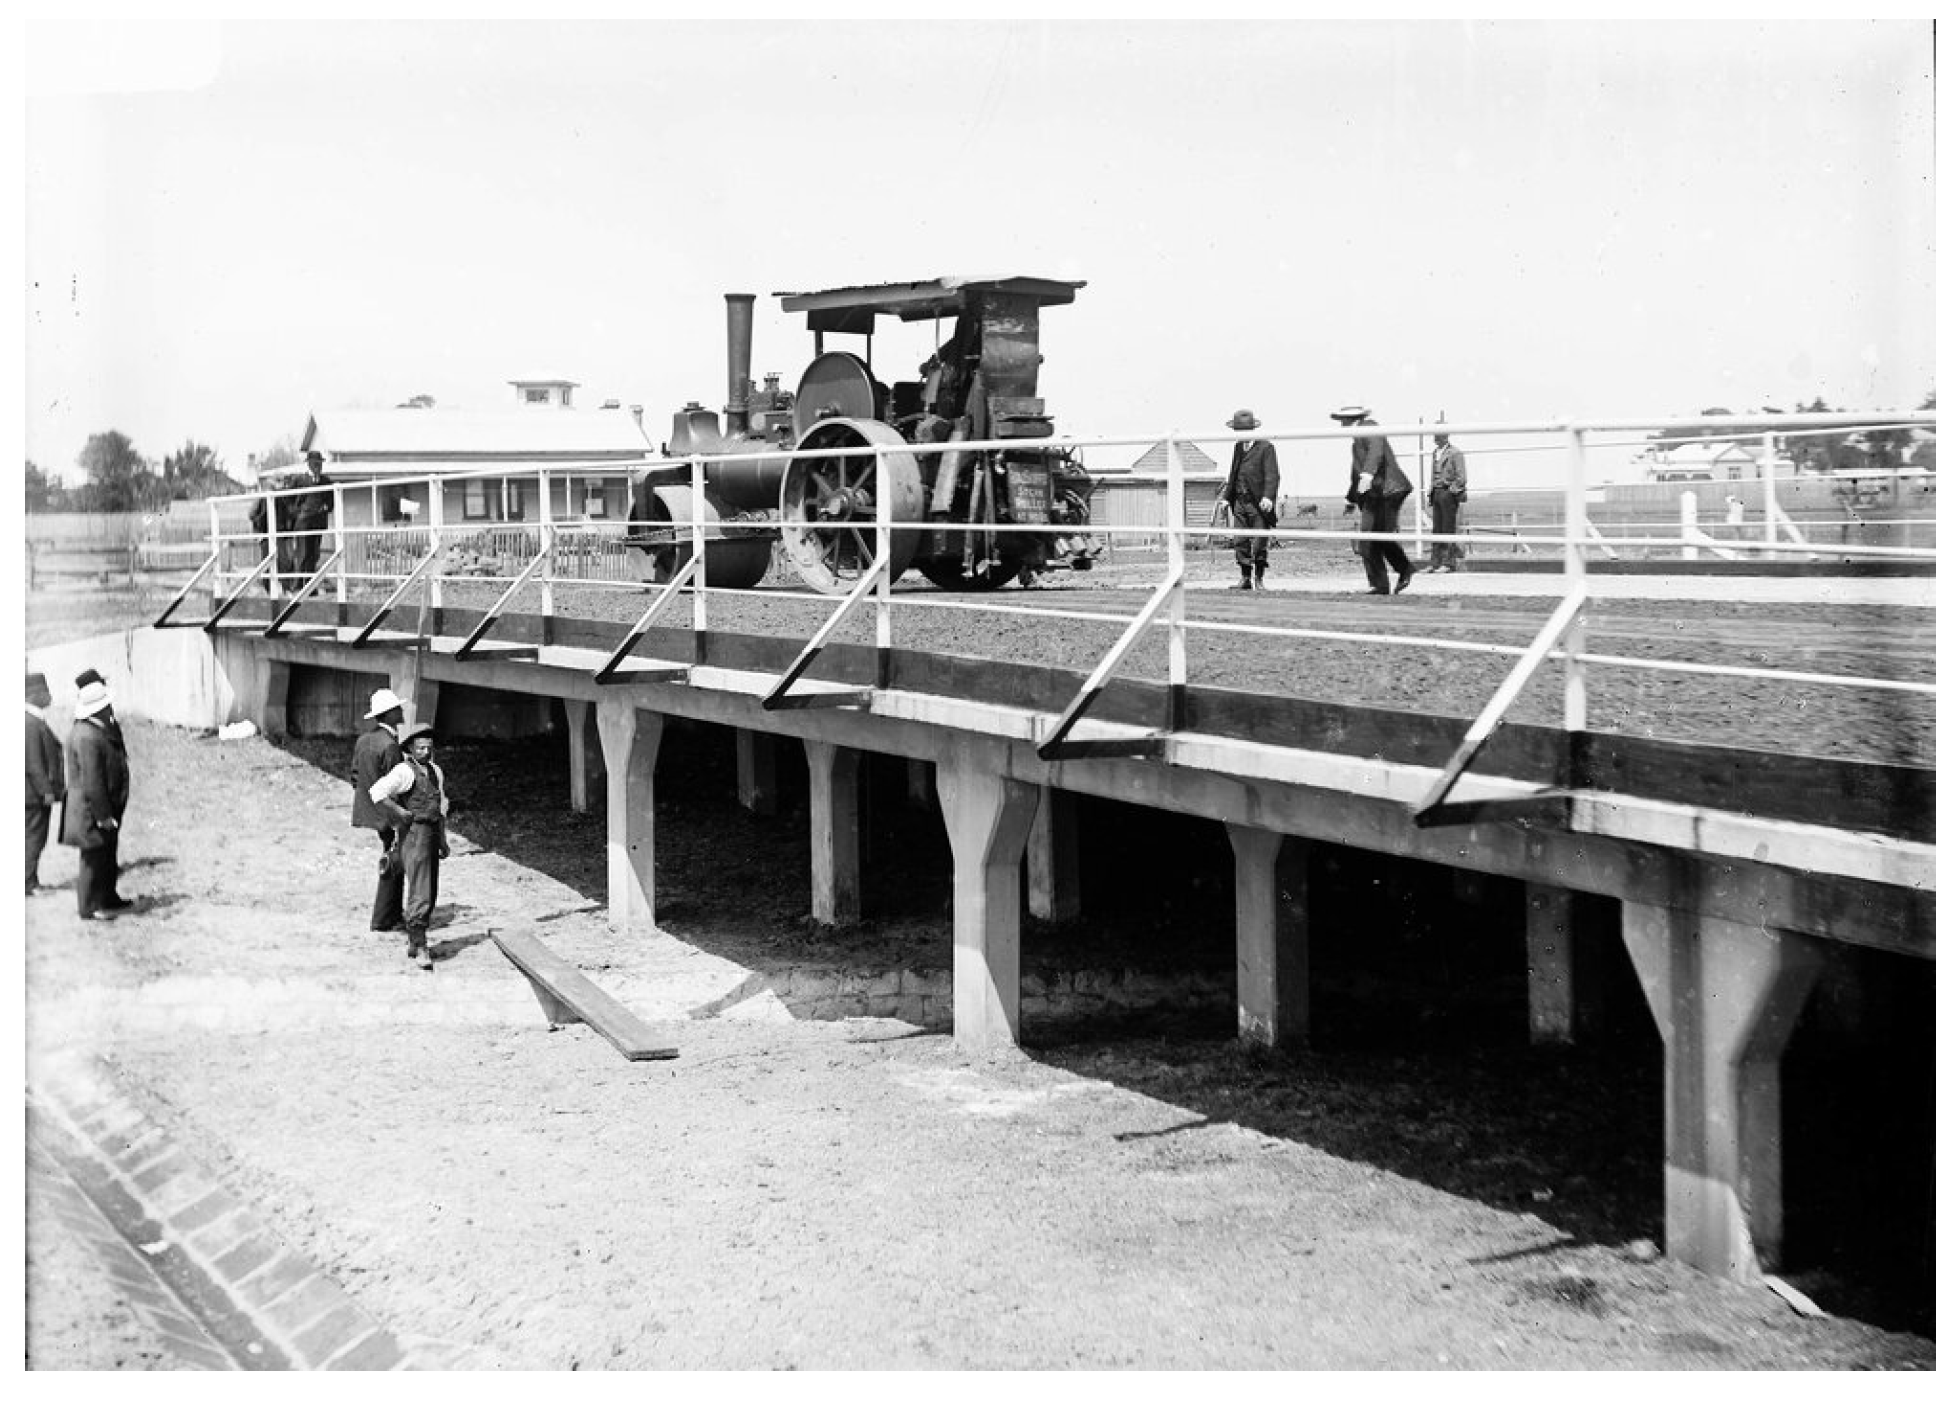
2. Descriptions of Heritage RC Bridge in This Study
Previous Studies of St Kilda Street Bridge
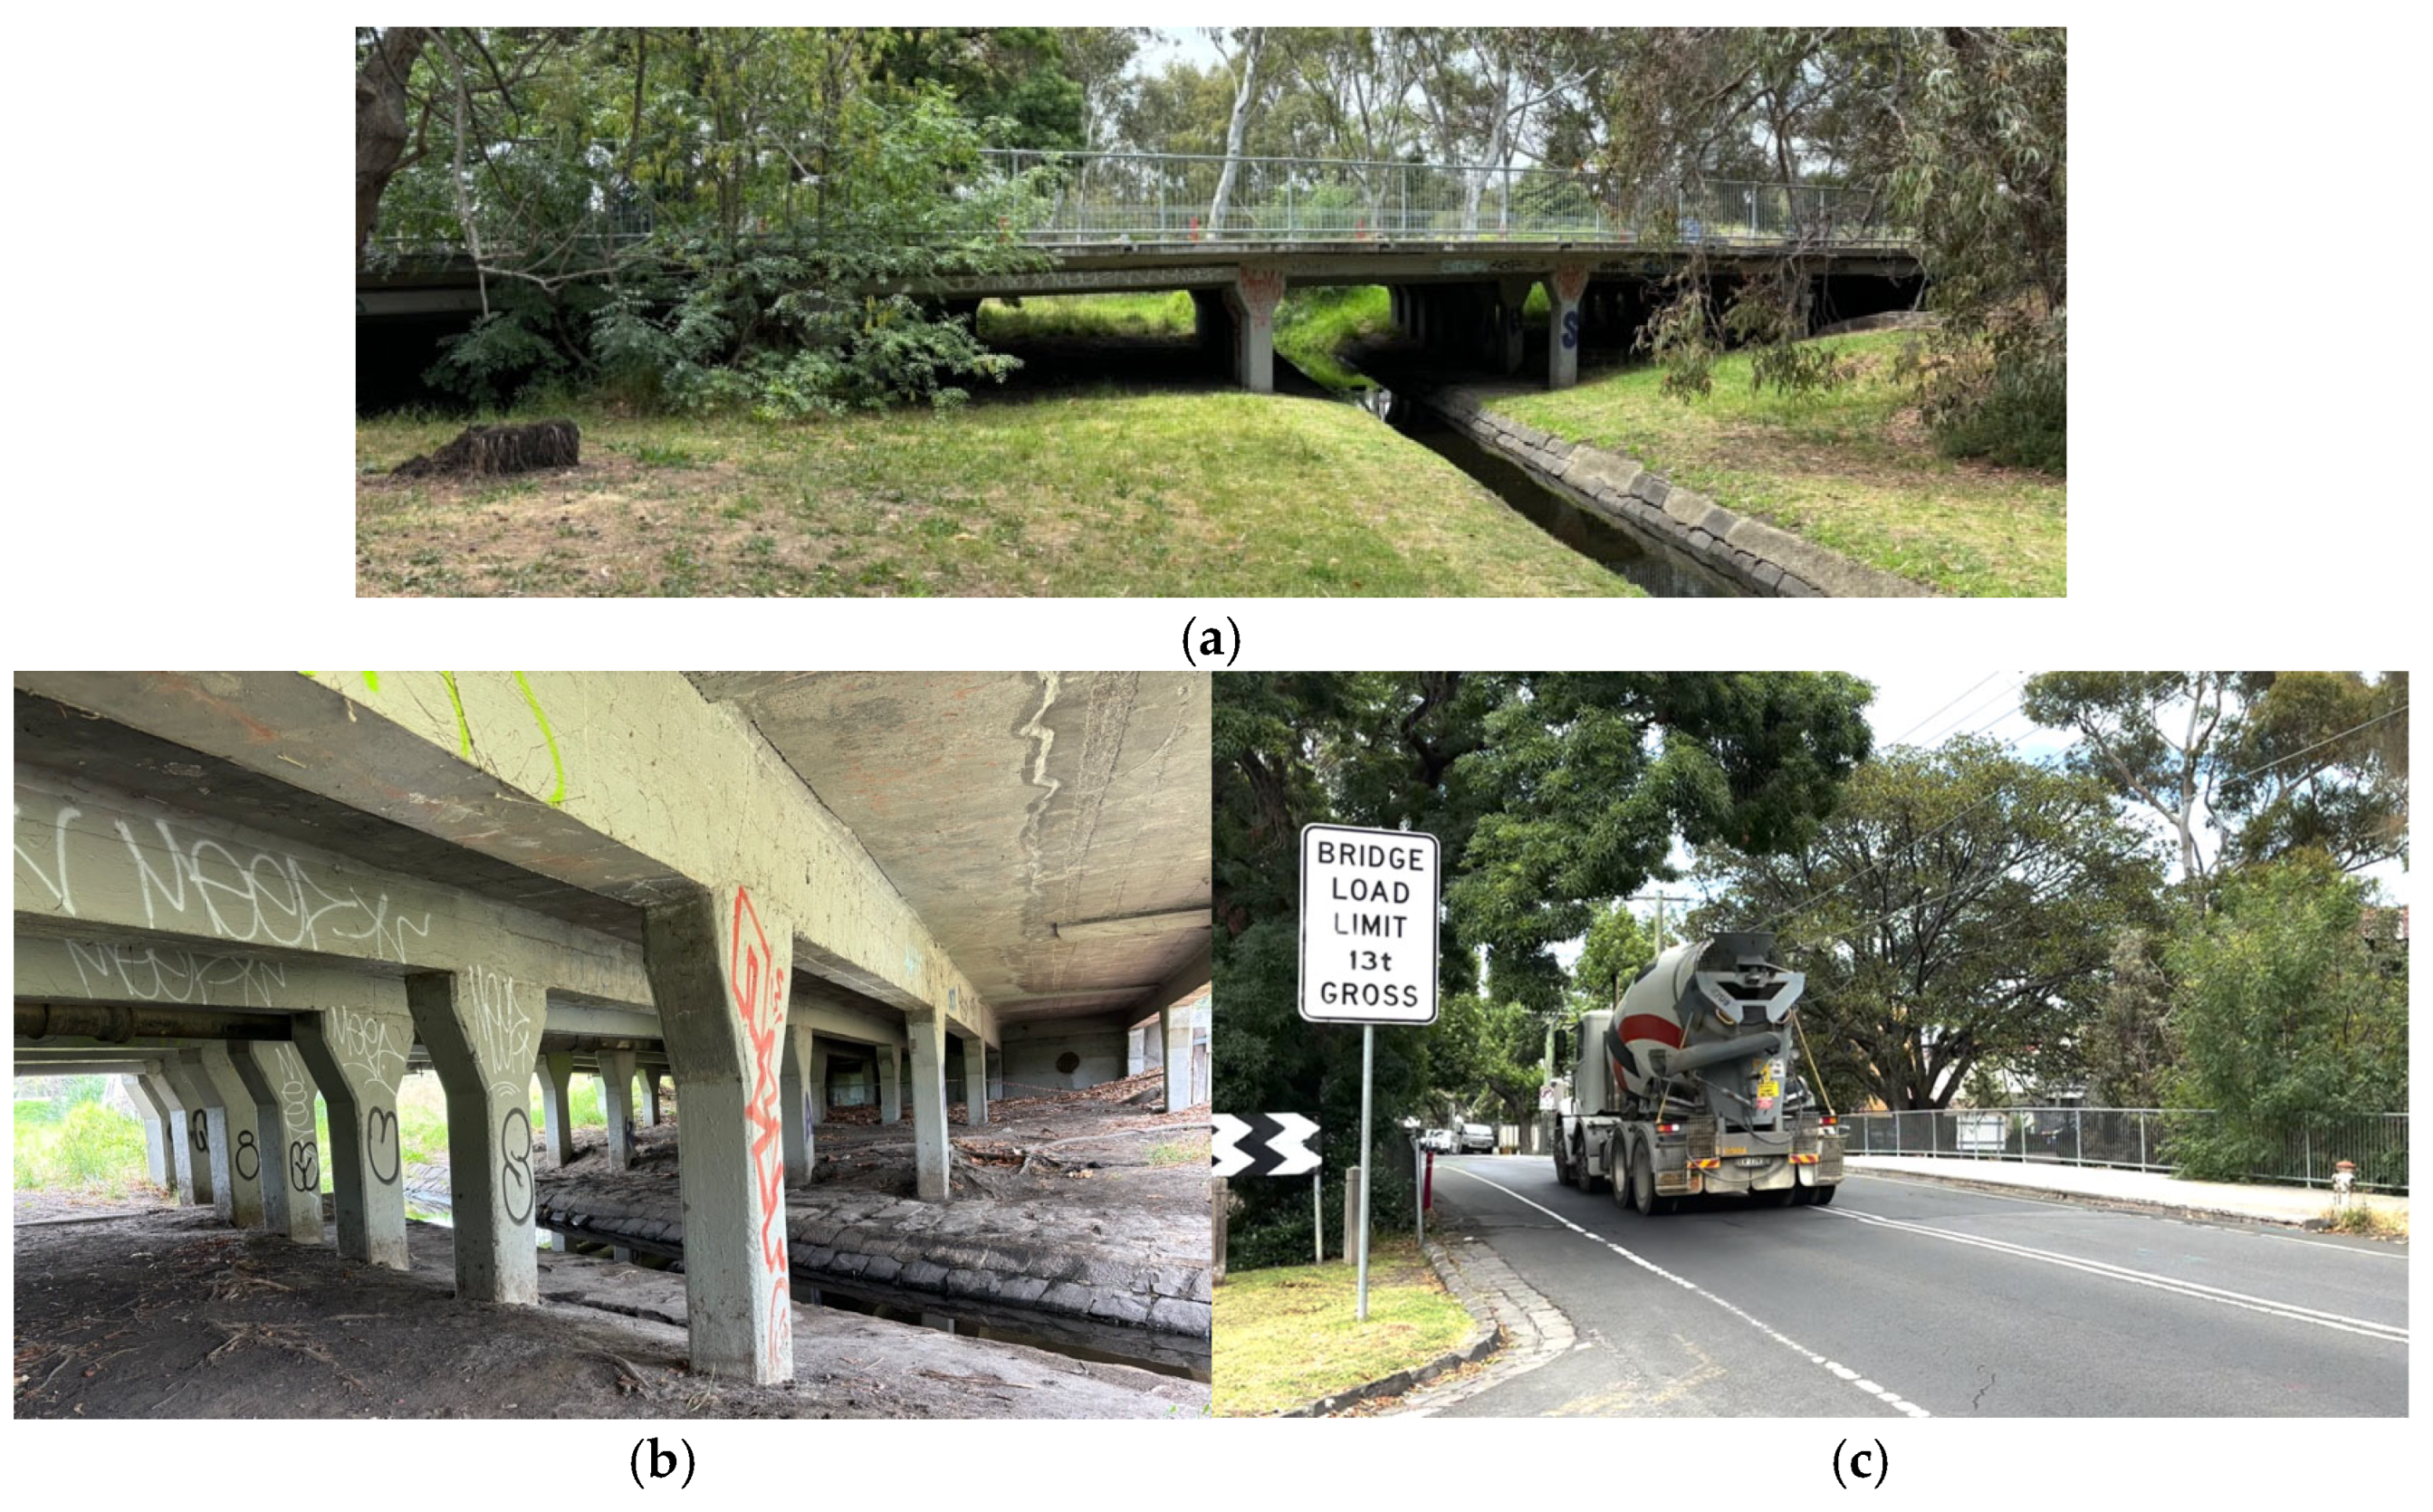
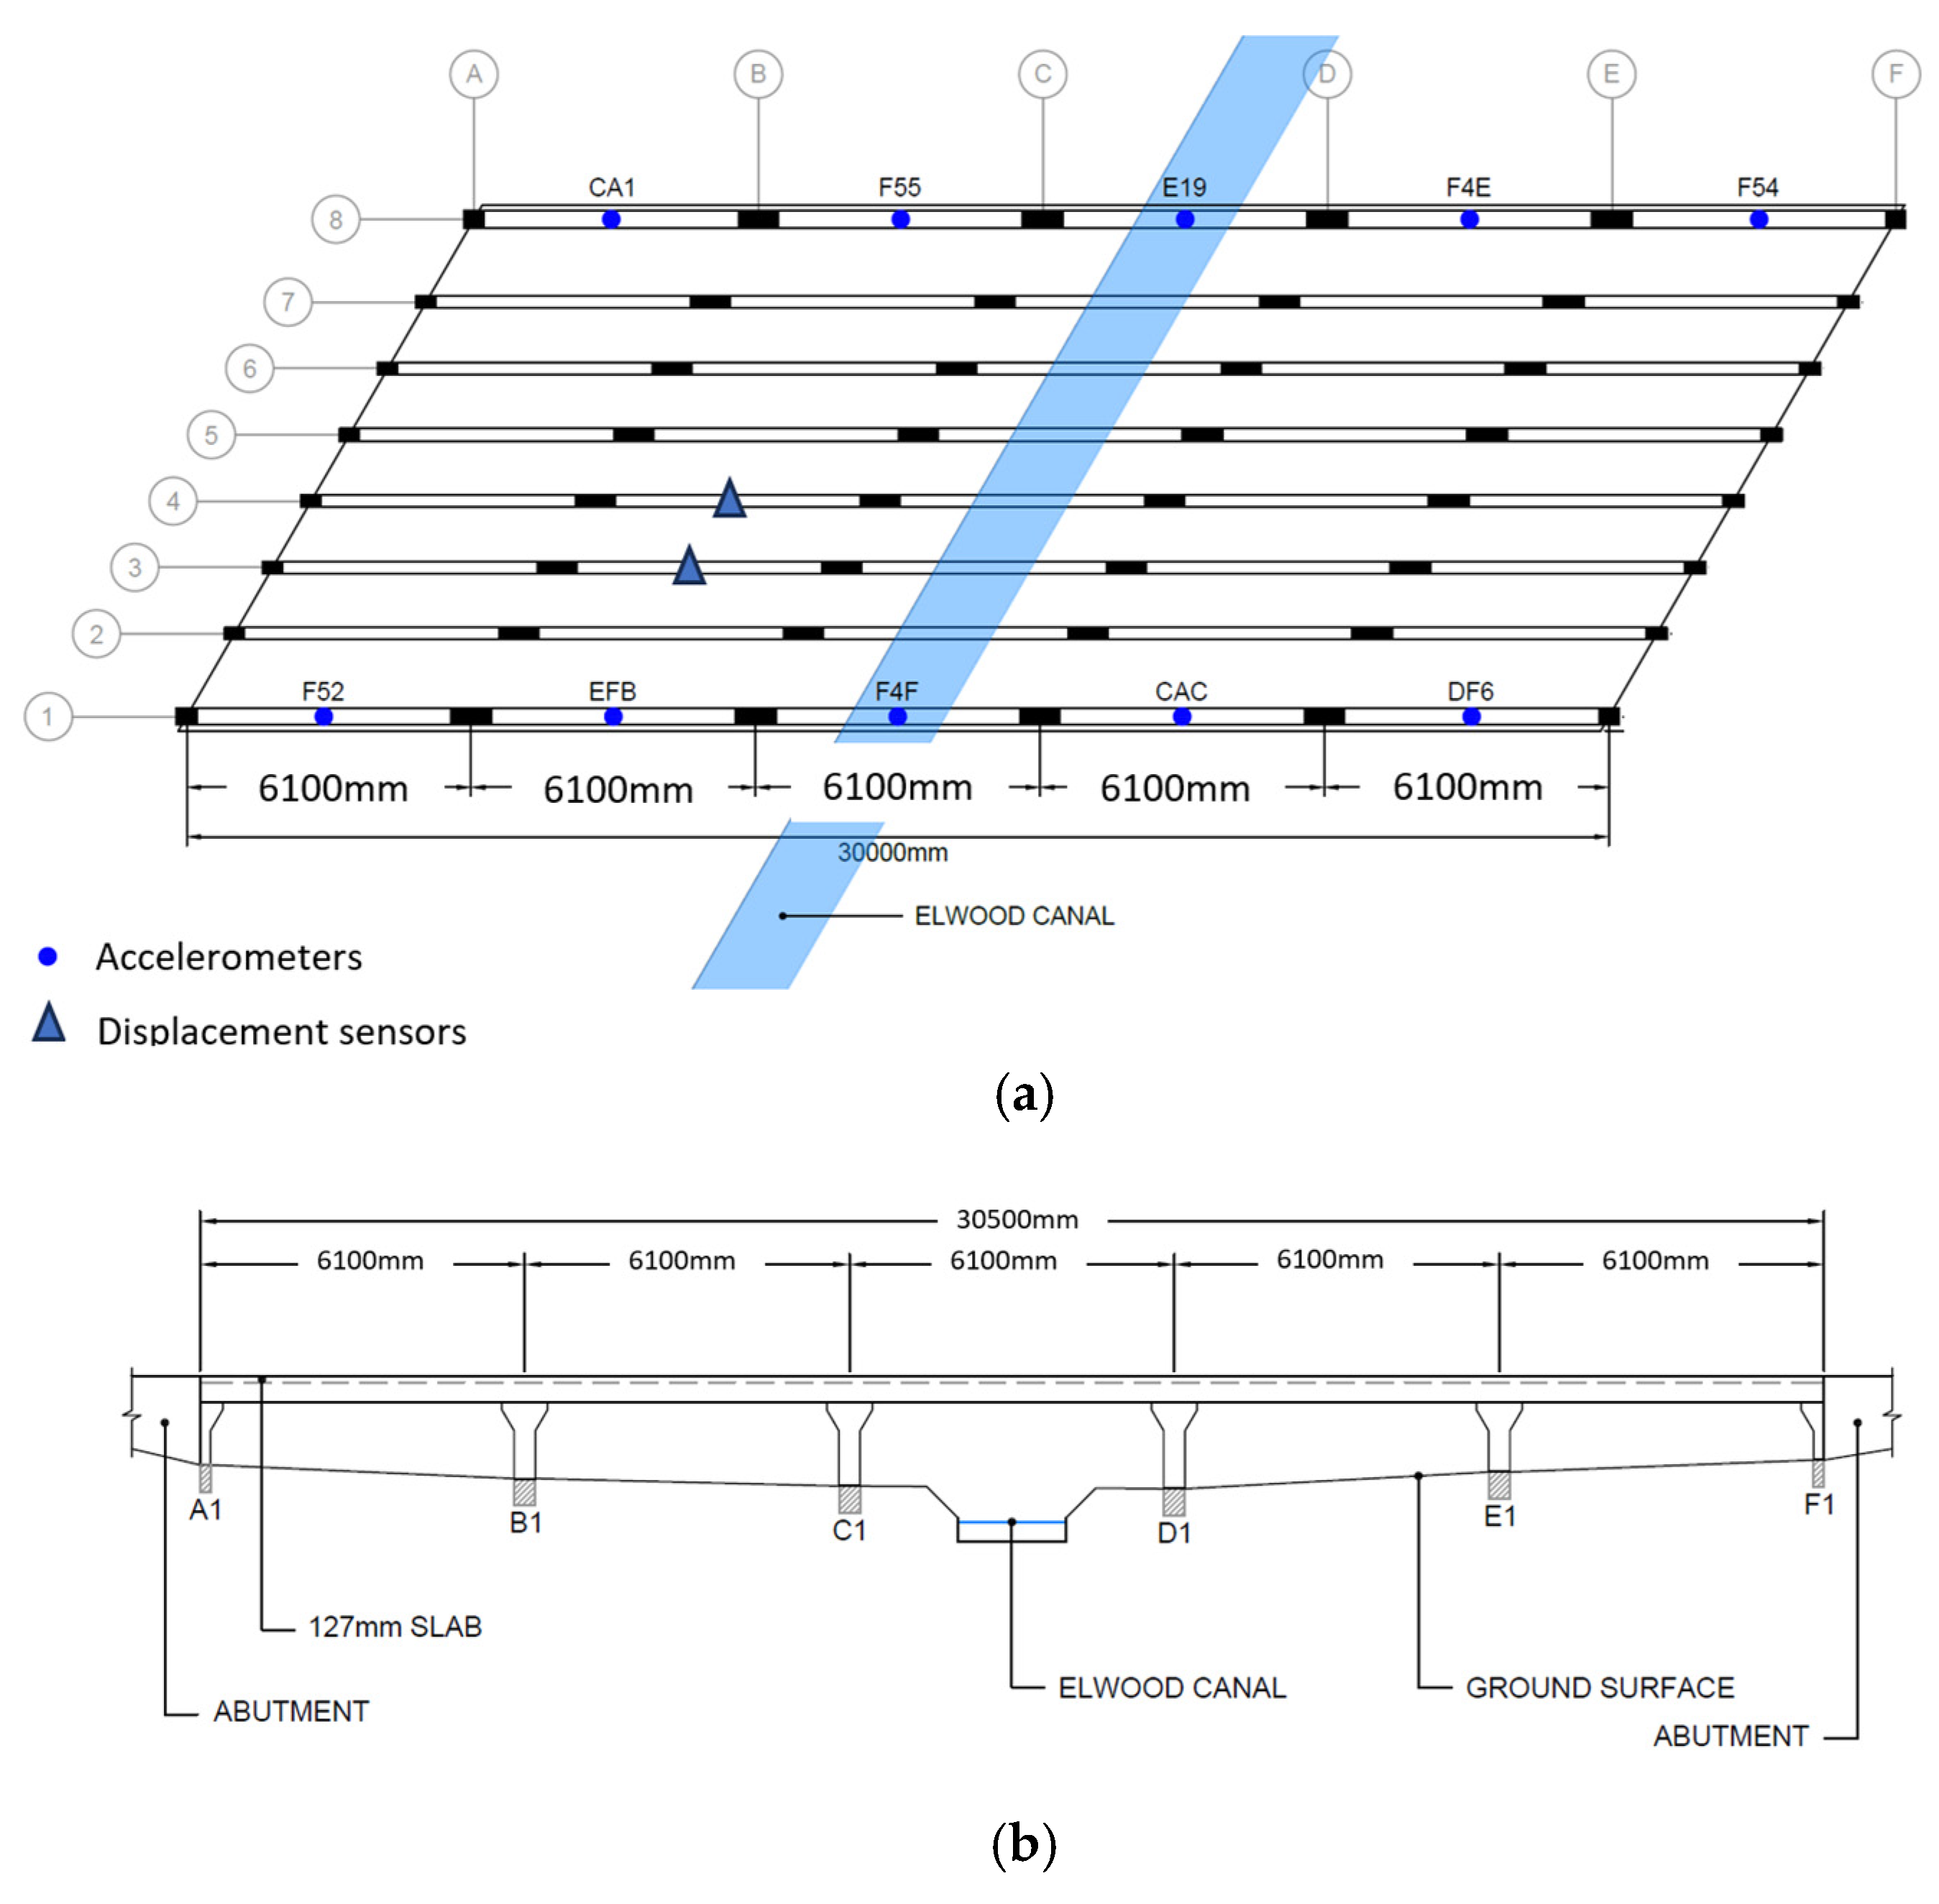
3. Field Inspections and Deployment of Sensors
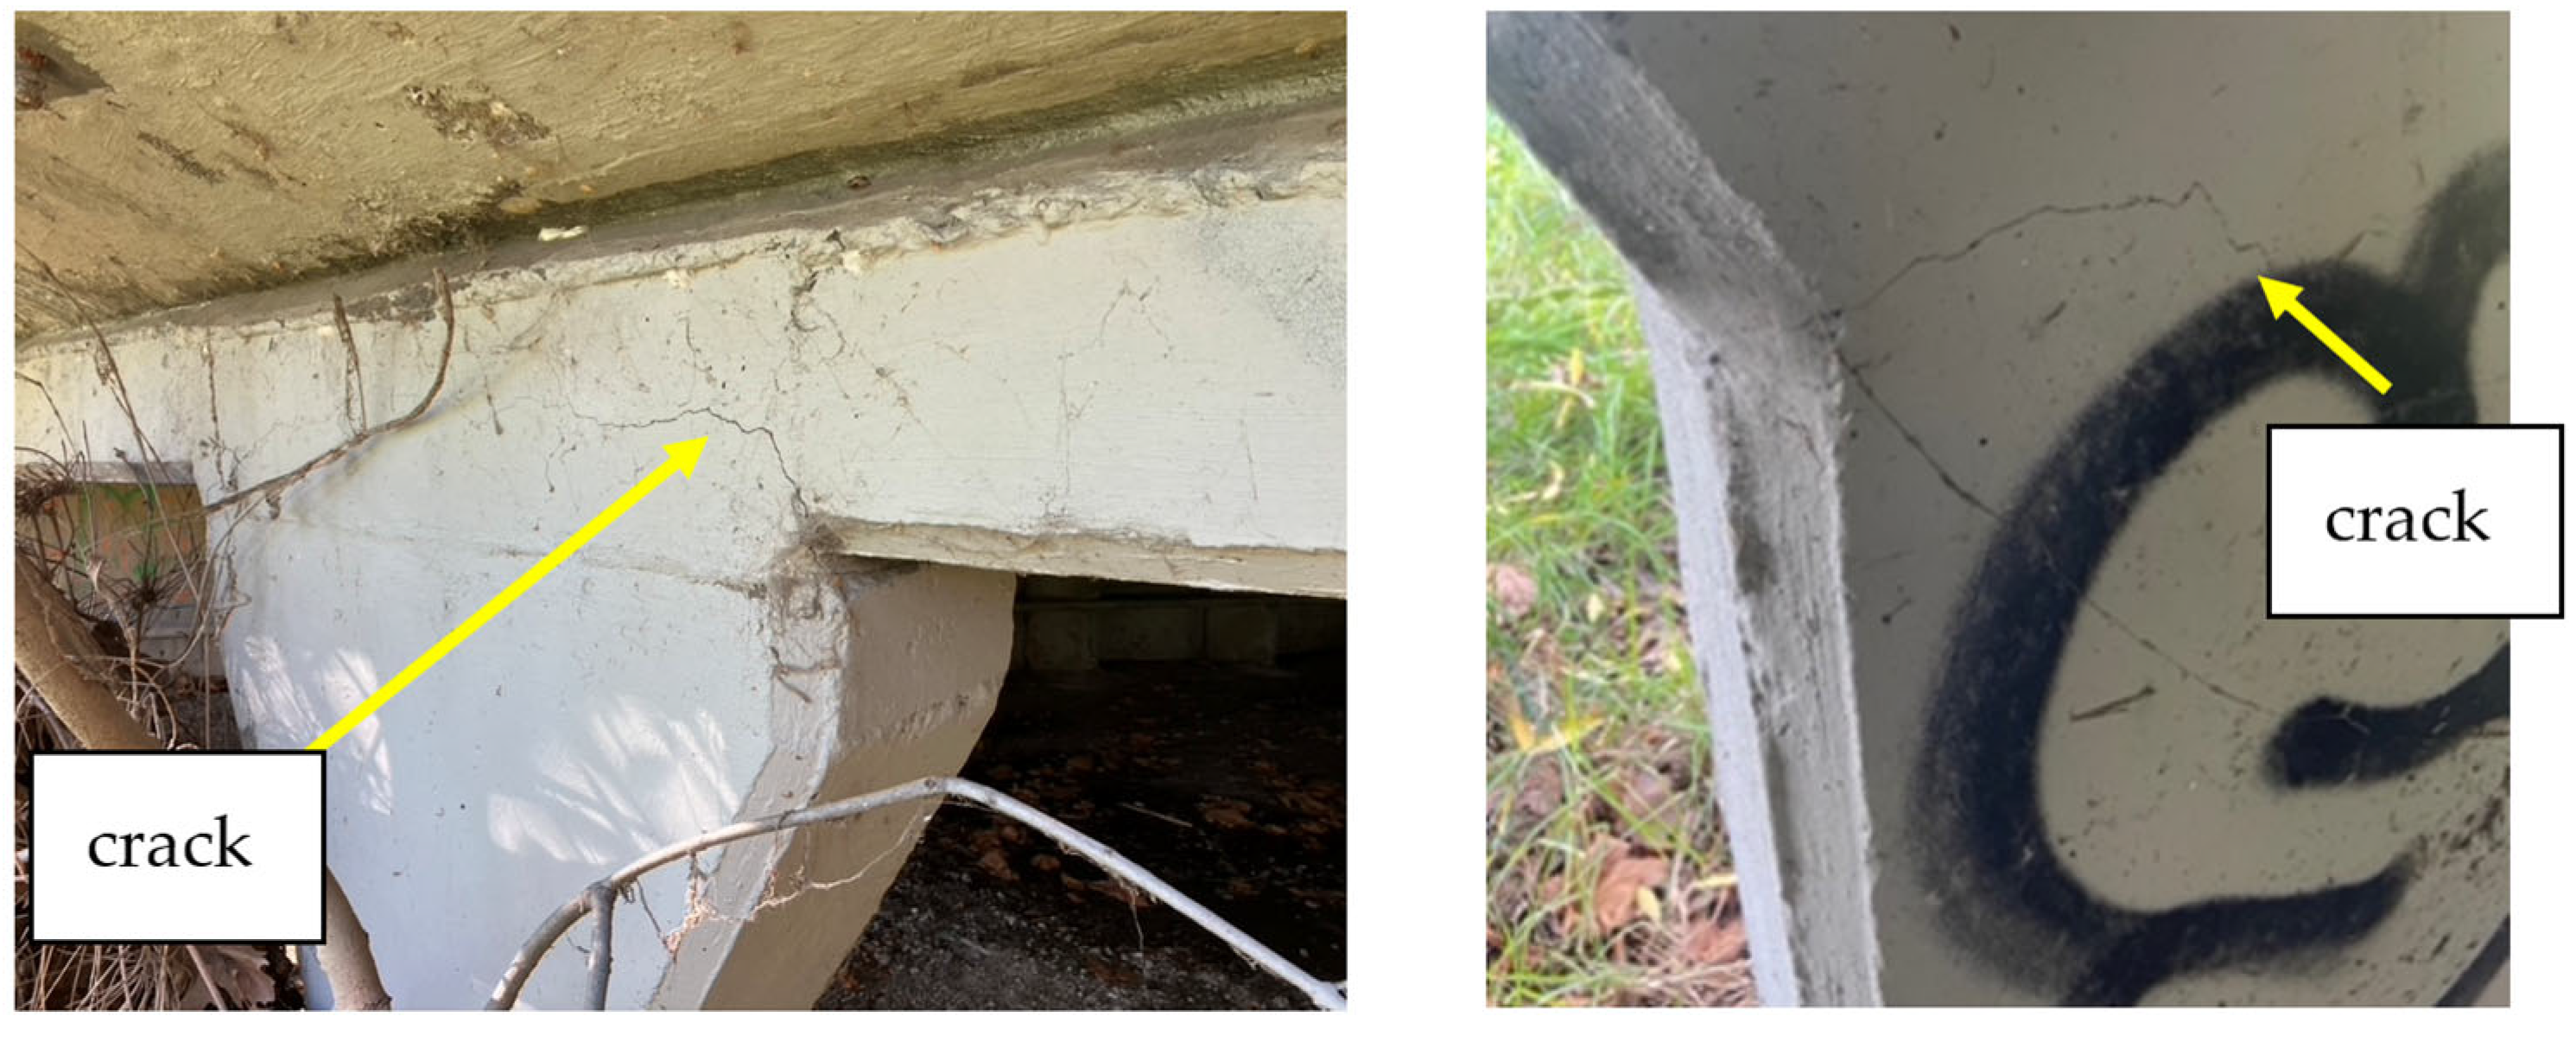
3.1. Field Inspections
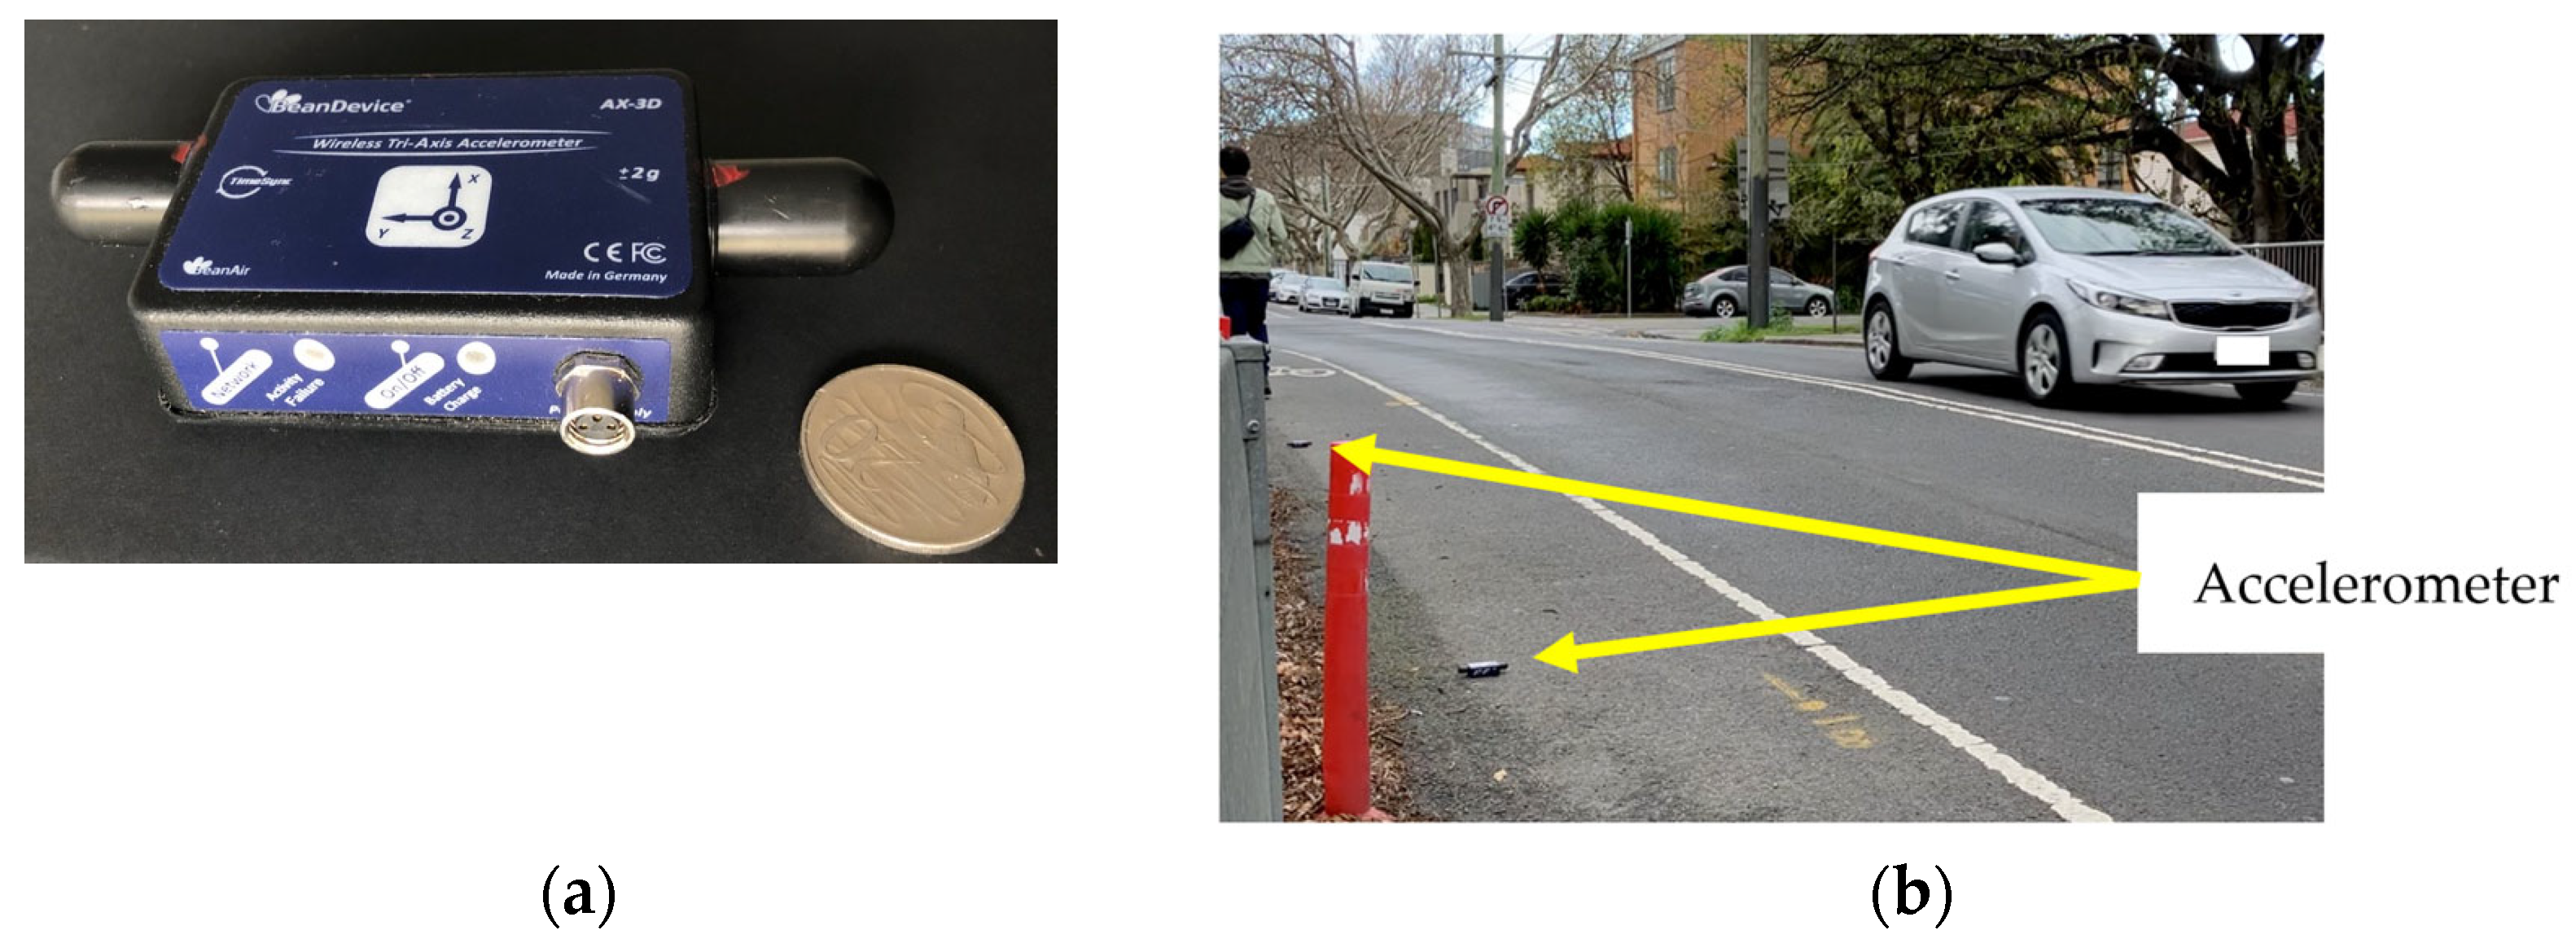
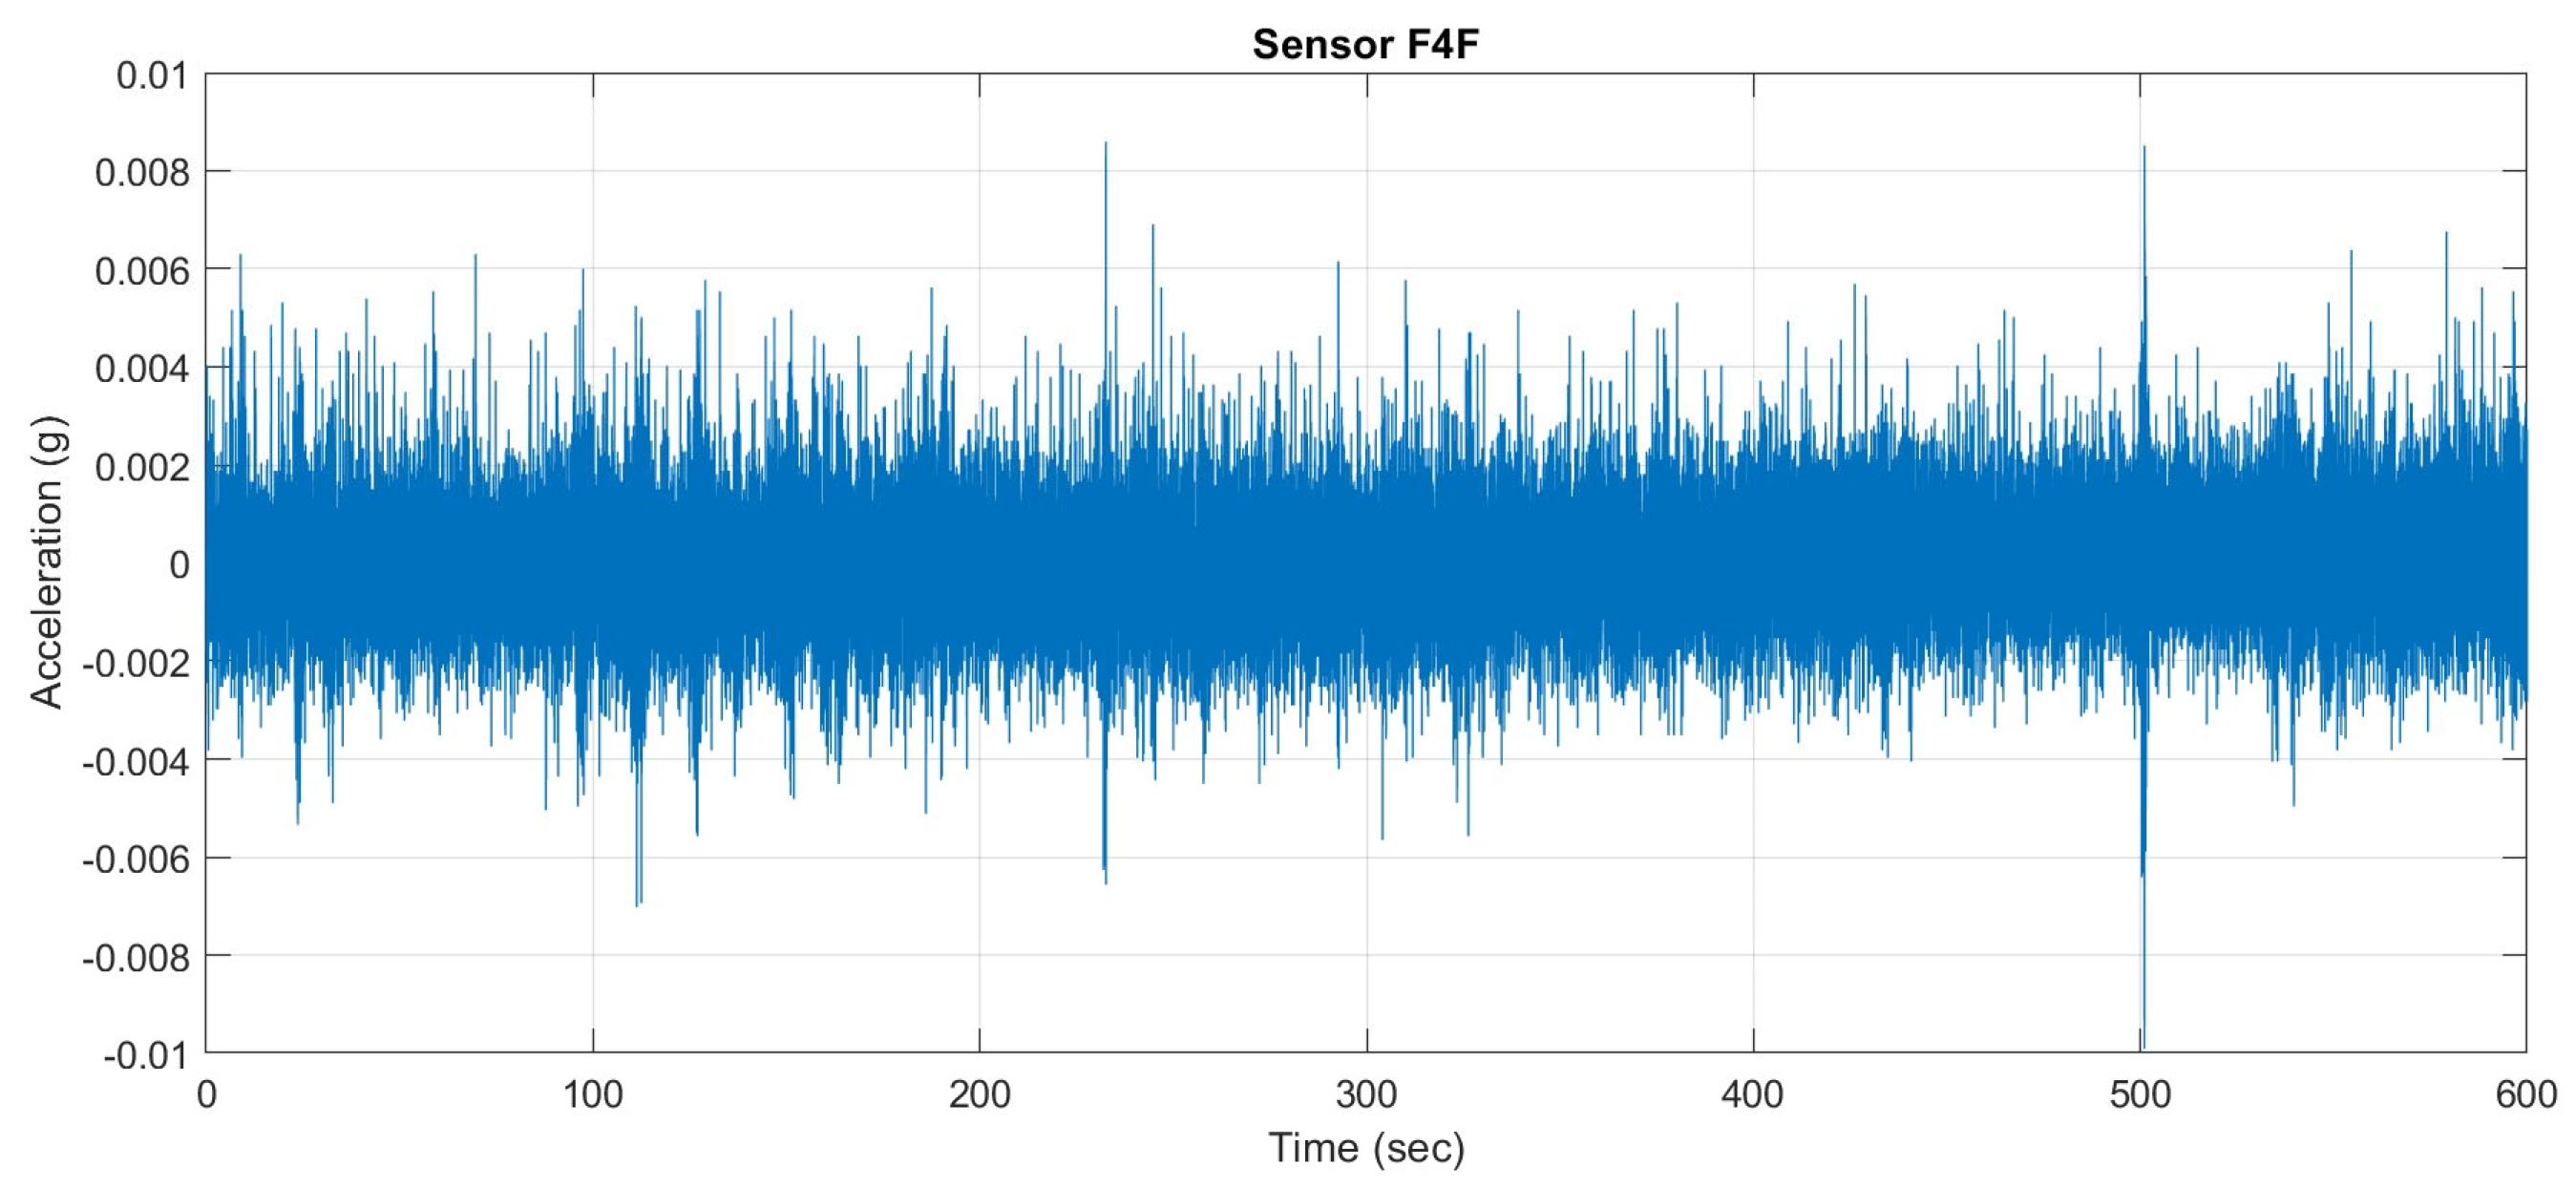
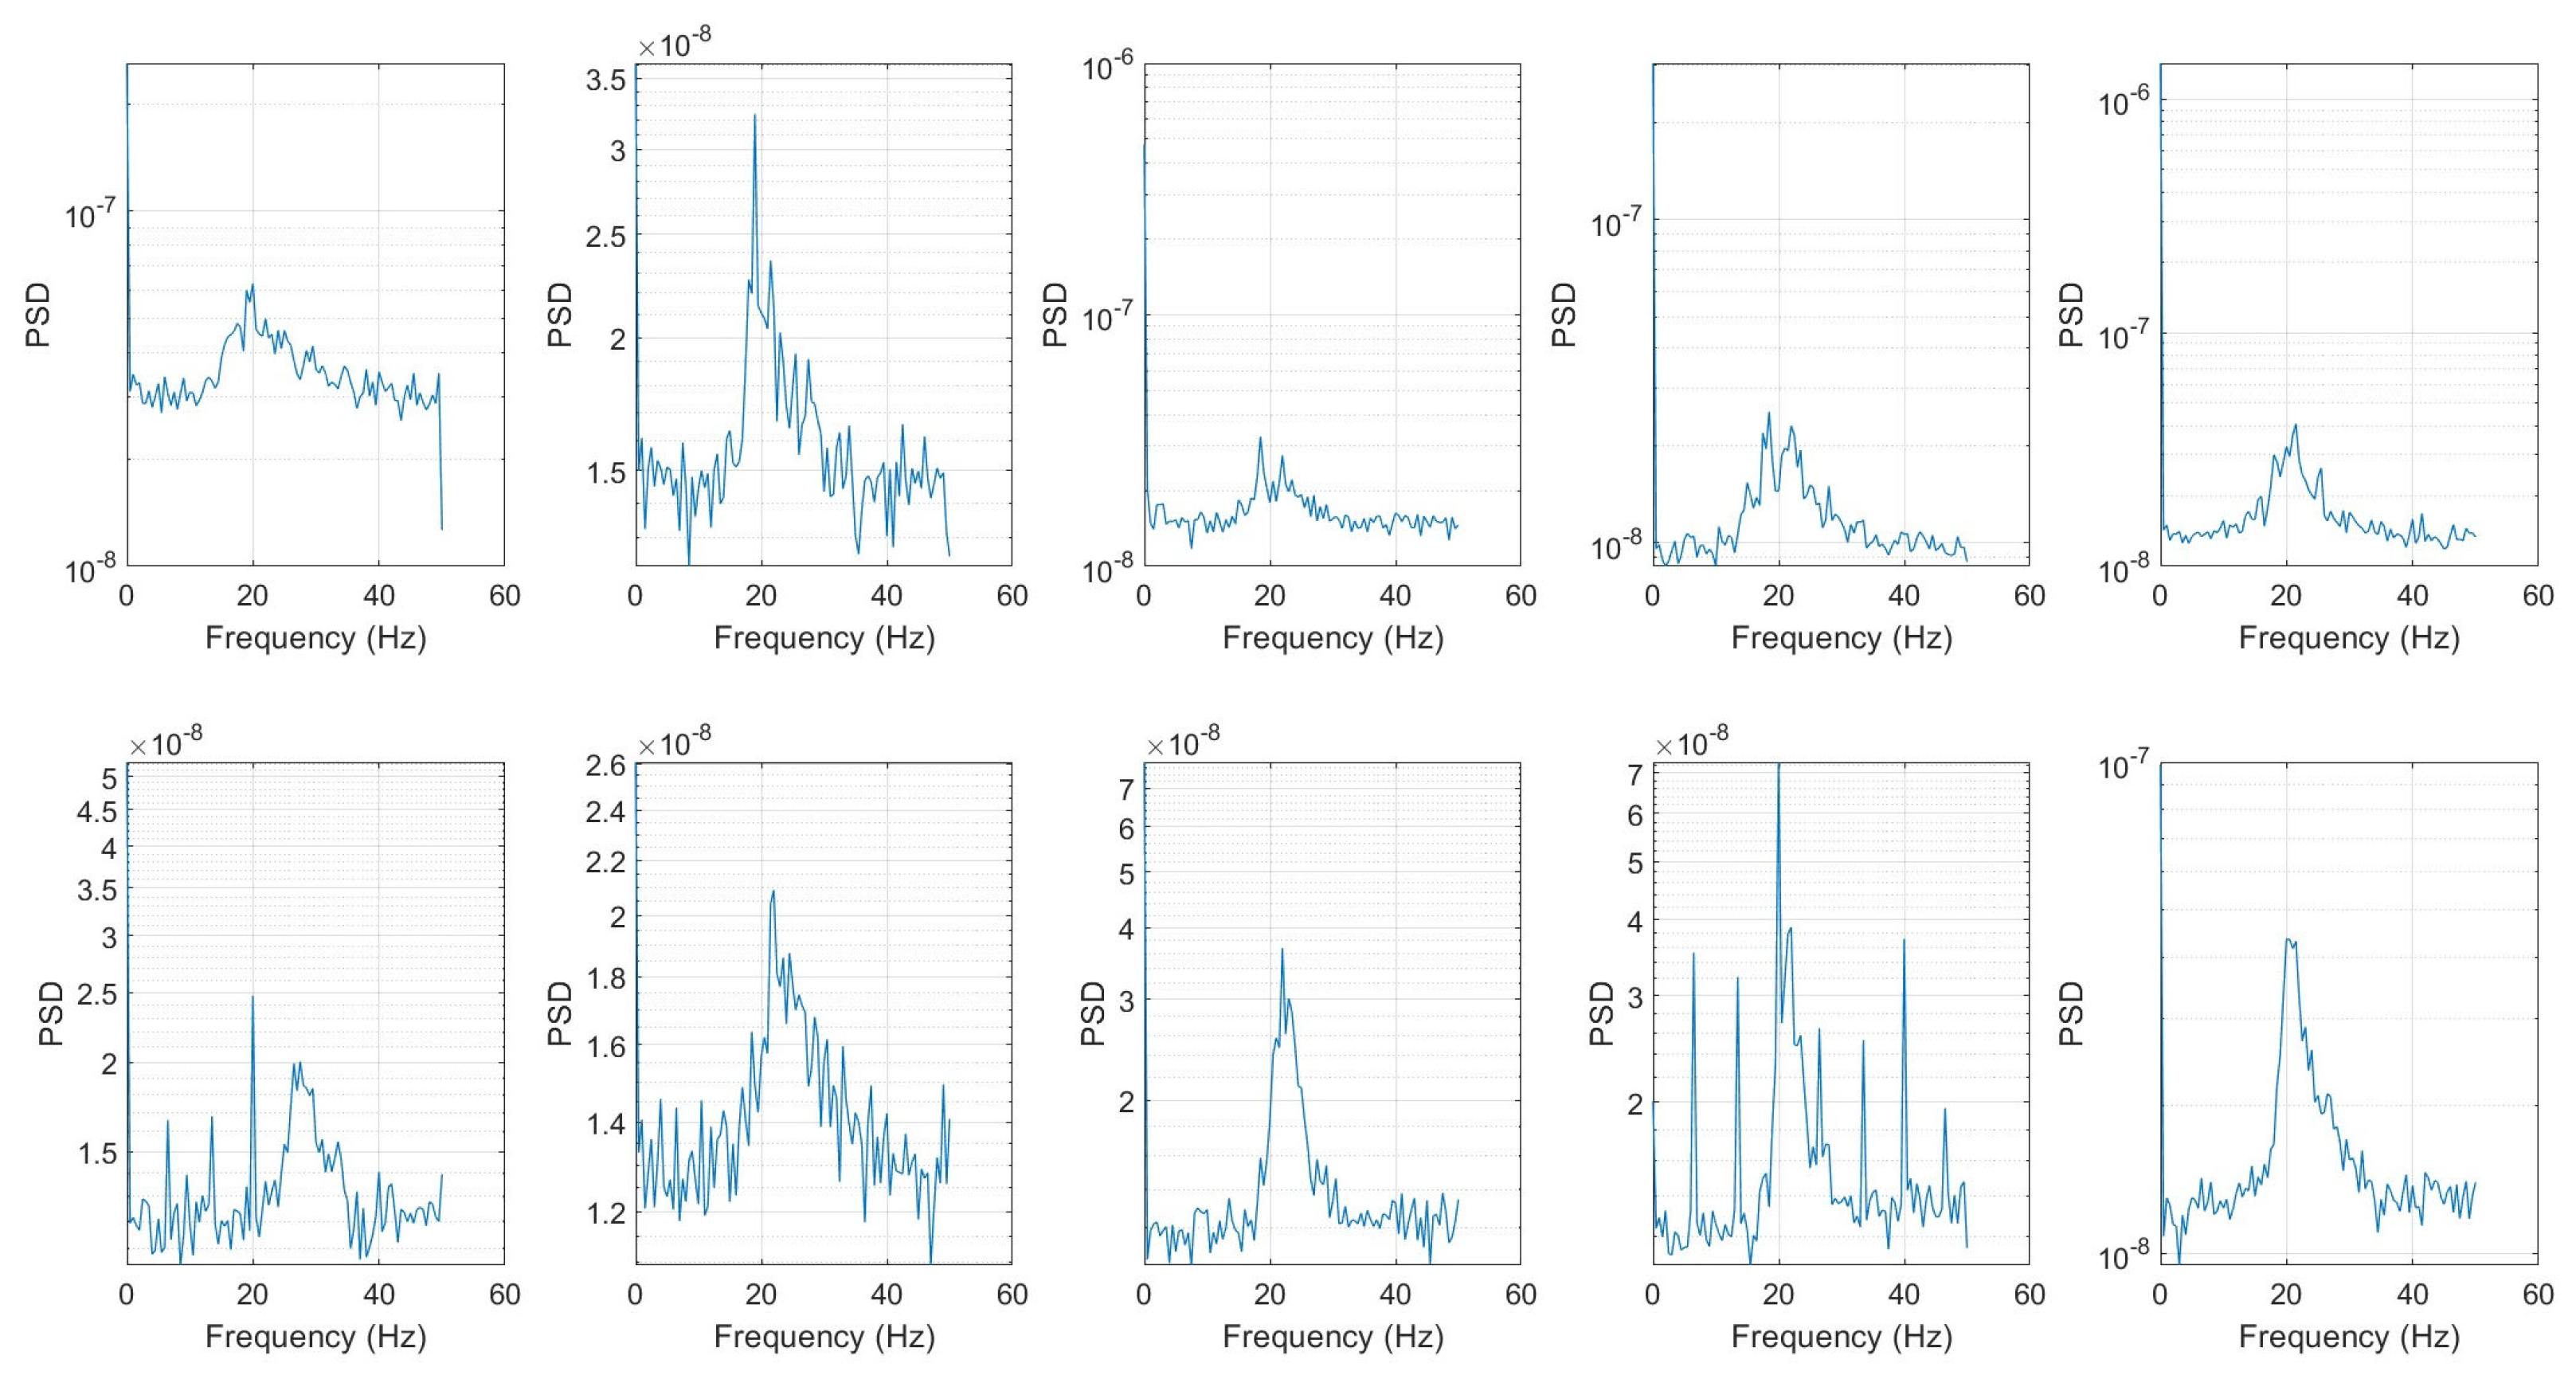
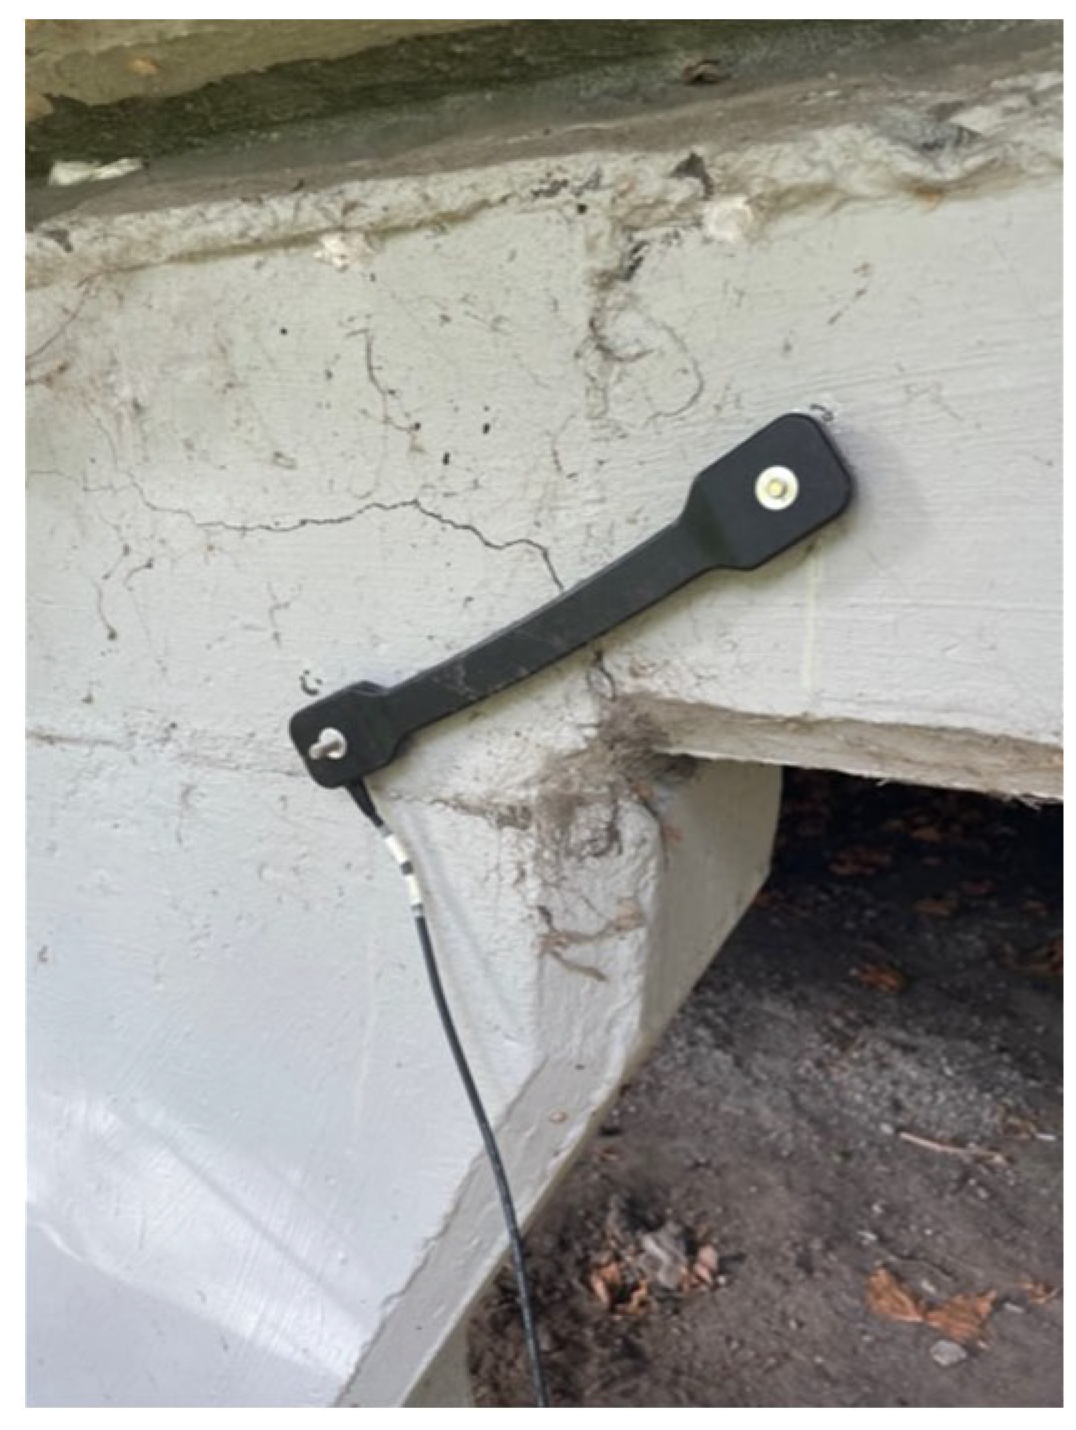
3.2. Ambient Vibration Test
- Non-destructive—it does not involve any coring or intrusive procedure. This is particularly important for heritage-listed assets.
- Road closure was not required—the bridge has an AADT of 1300; closure of the bridge will adversely affect local residents.
- No external application of force, such as an impact hammer, was required.
- No external power source is required—sensors, the DAQ unit, and the computer have an internal battery.
- It measures the structure’s response under actual service conditions.
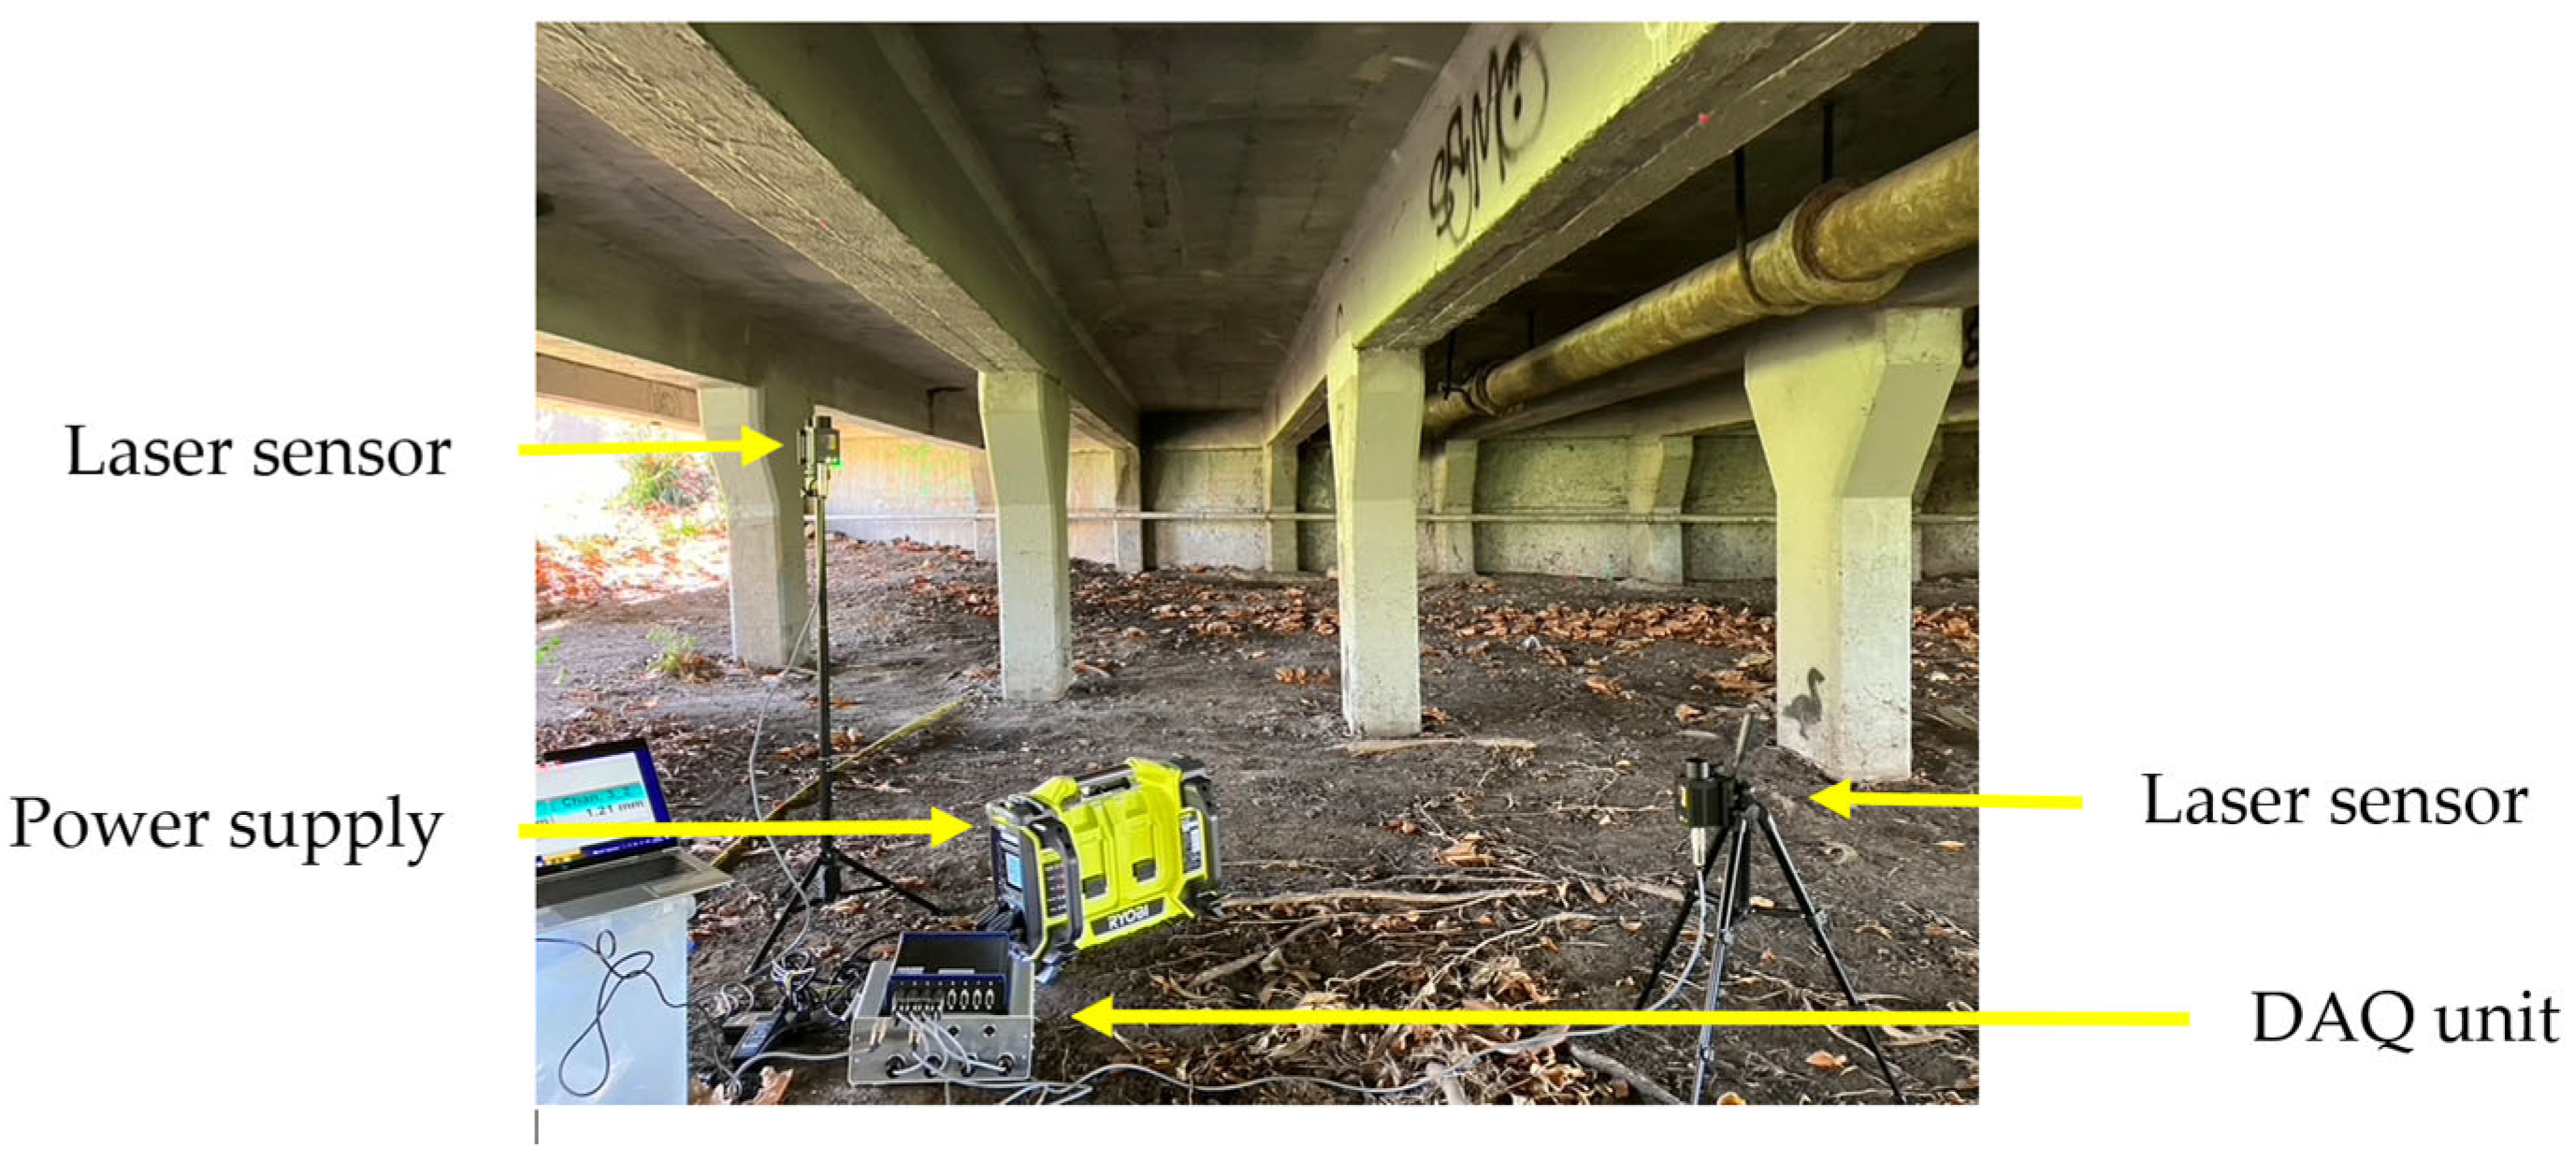
3.3. Girder Displacements and Crack Widths Under Traffic Loads
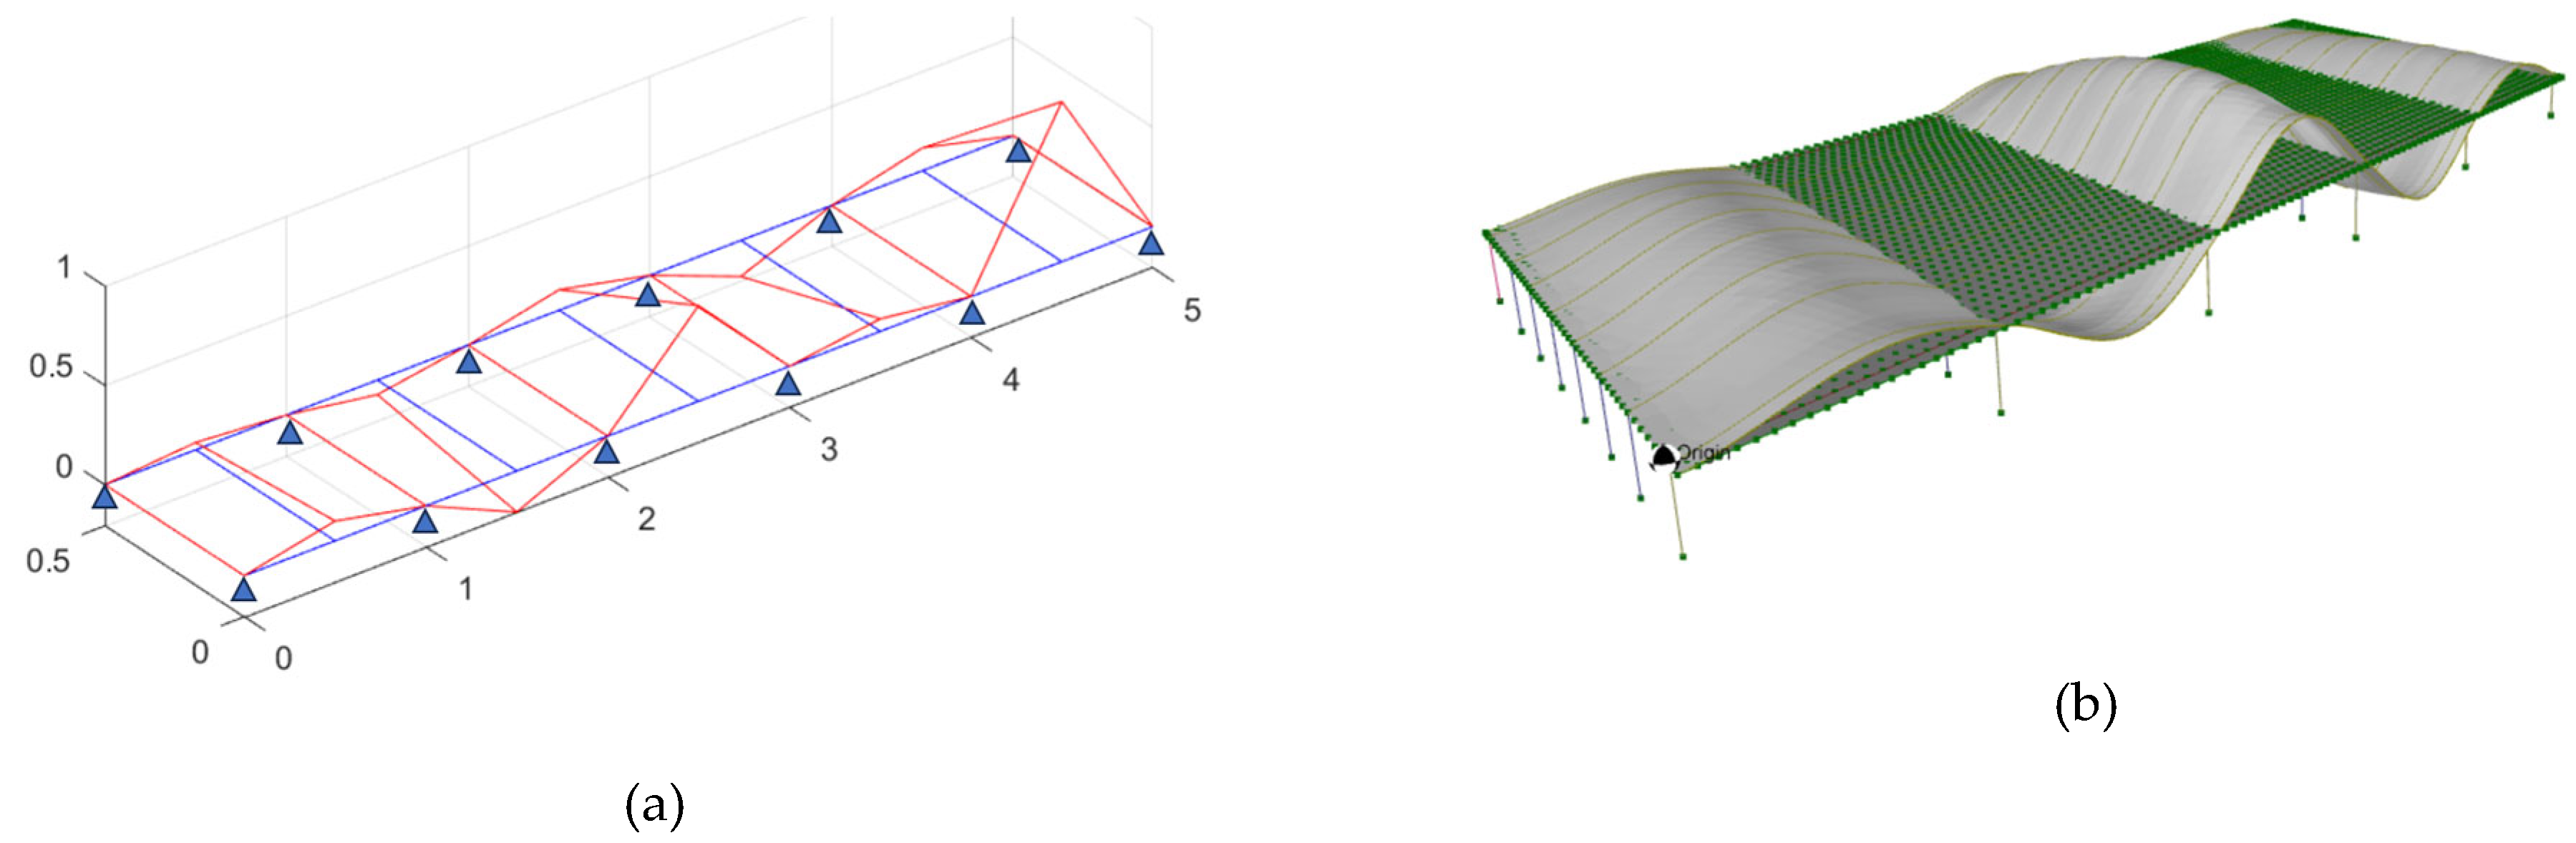
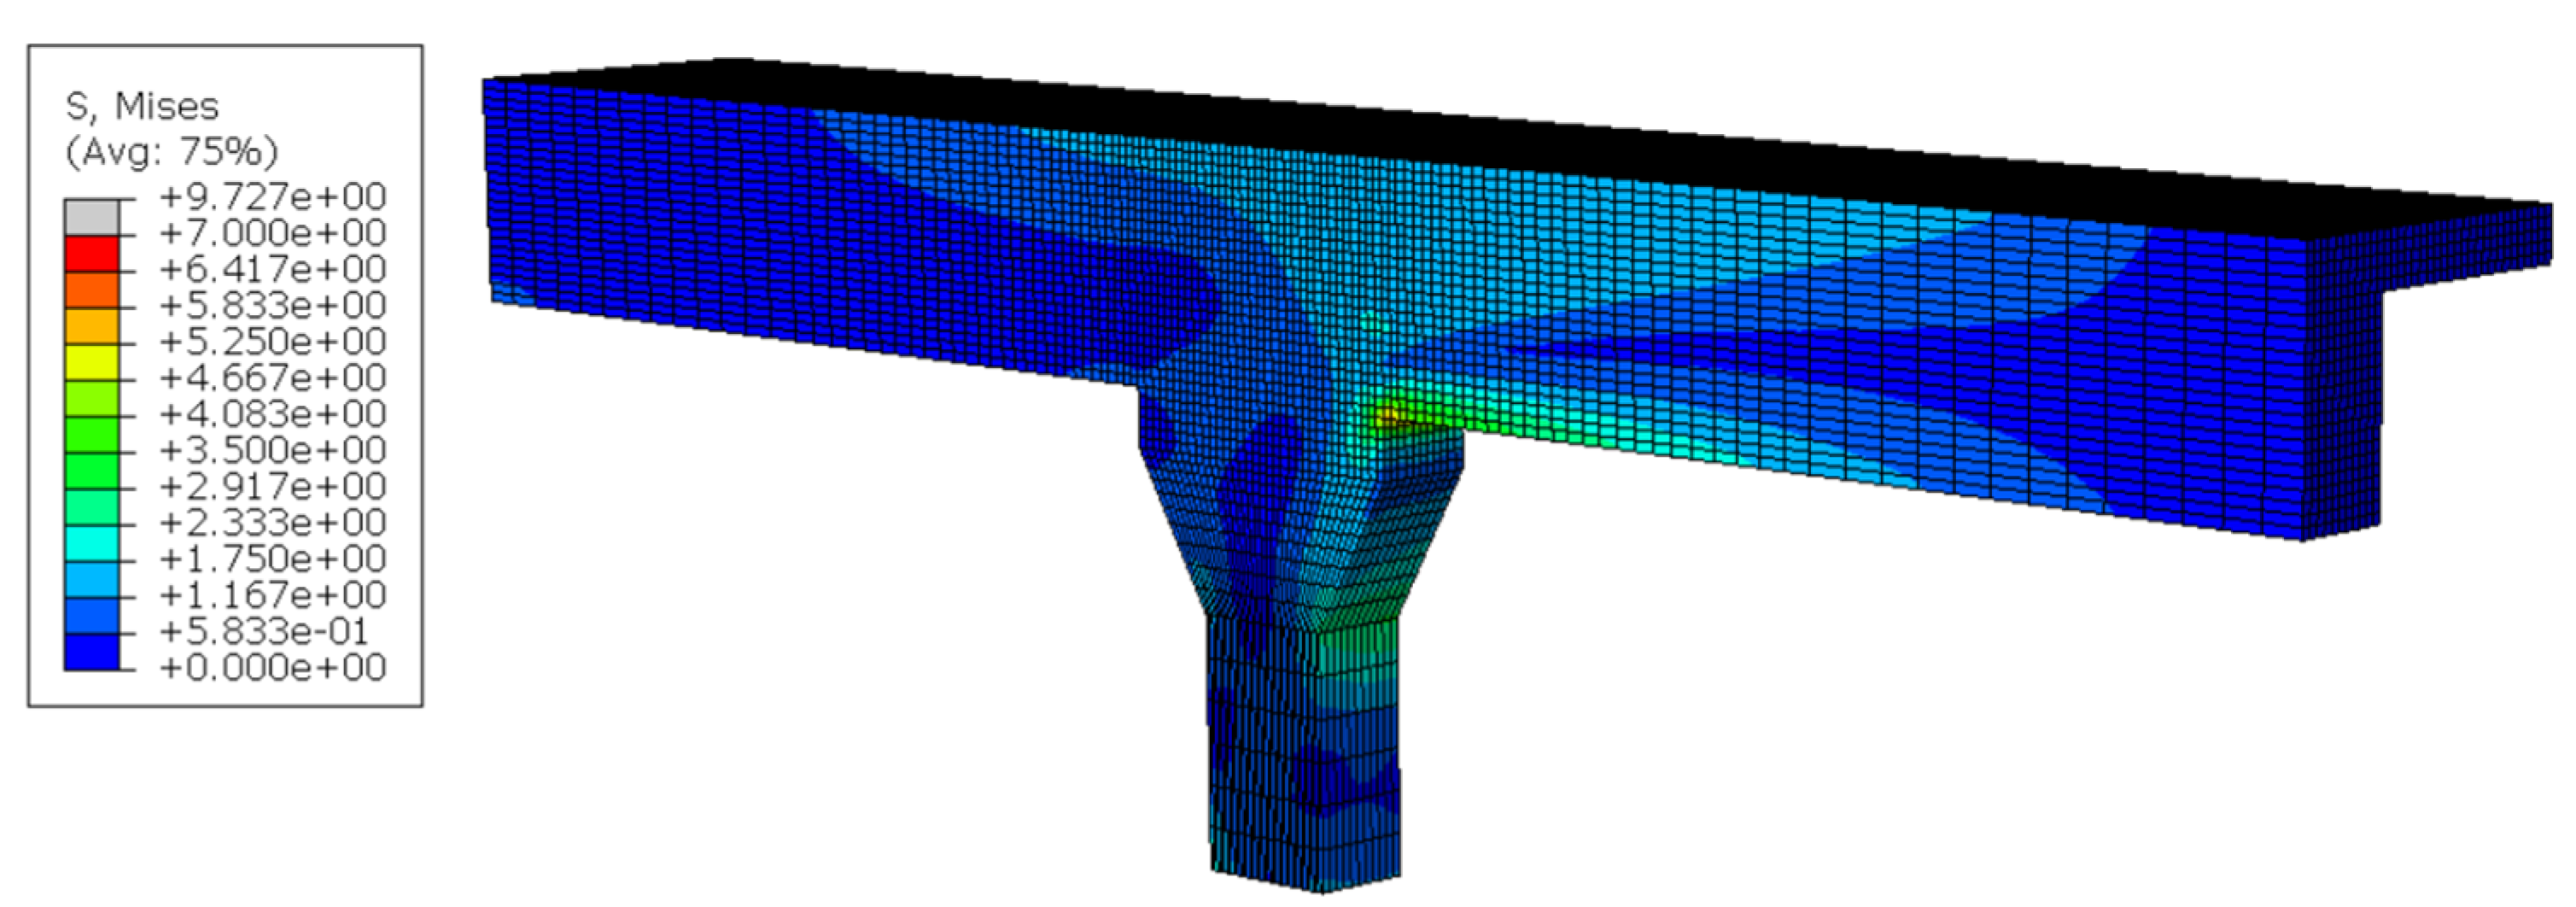
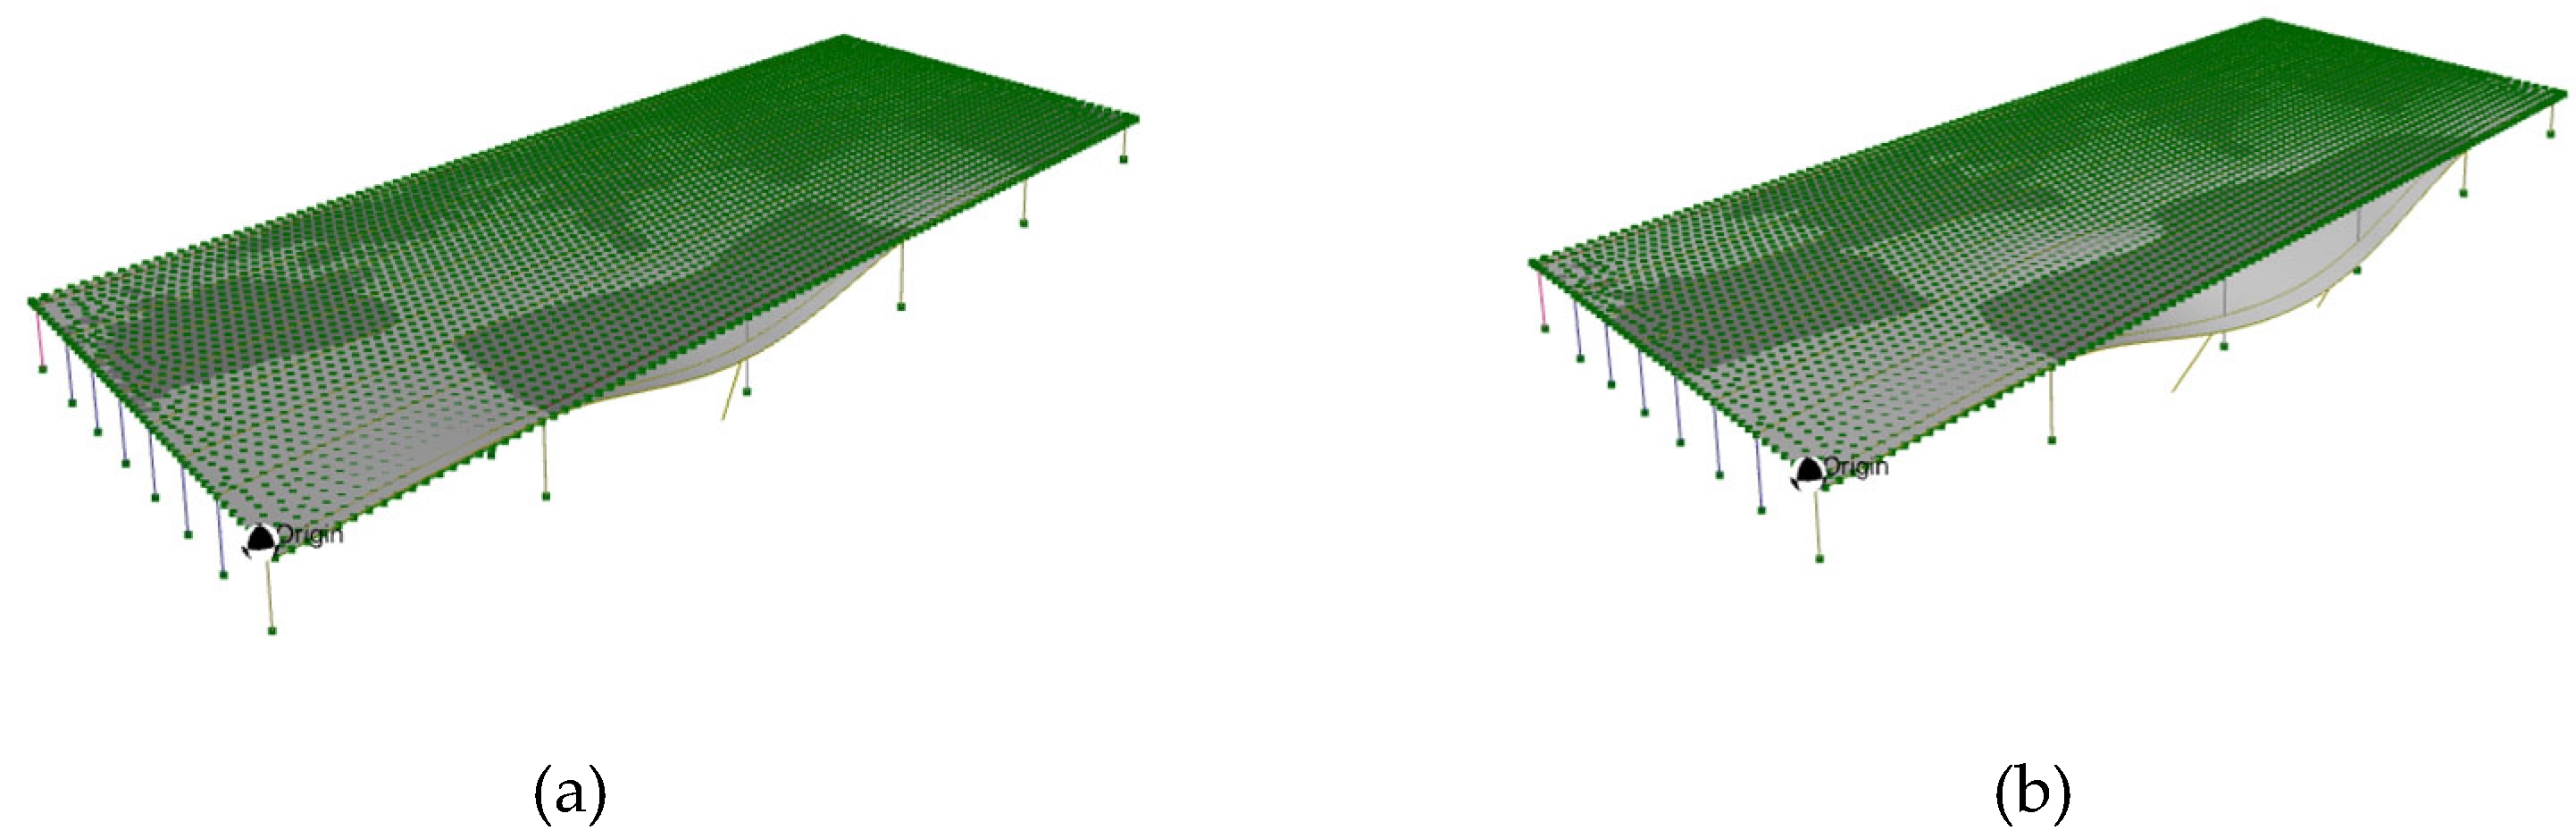
4. Development of Finite-Element Model
4.1. Finite-Element Modeling
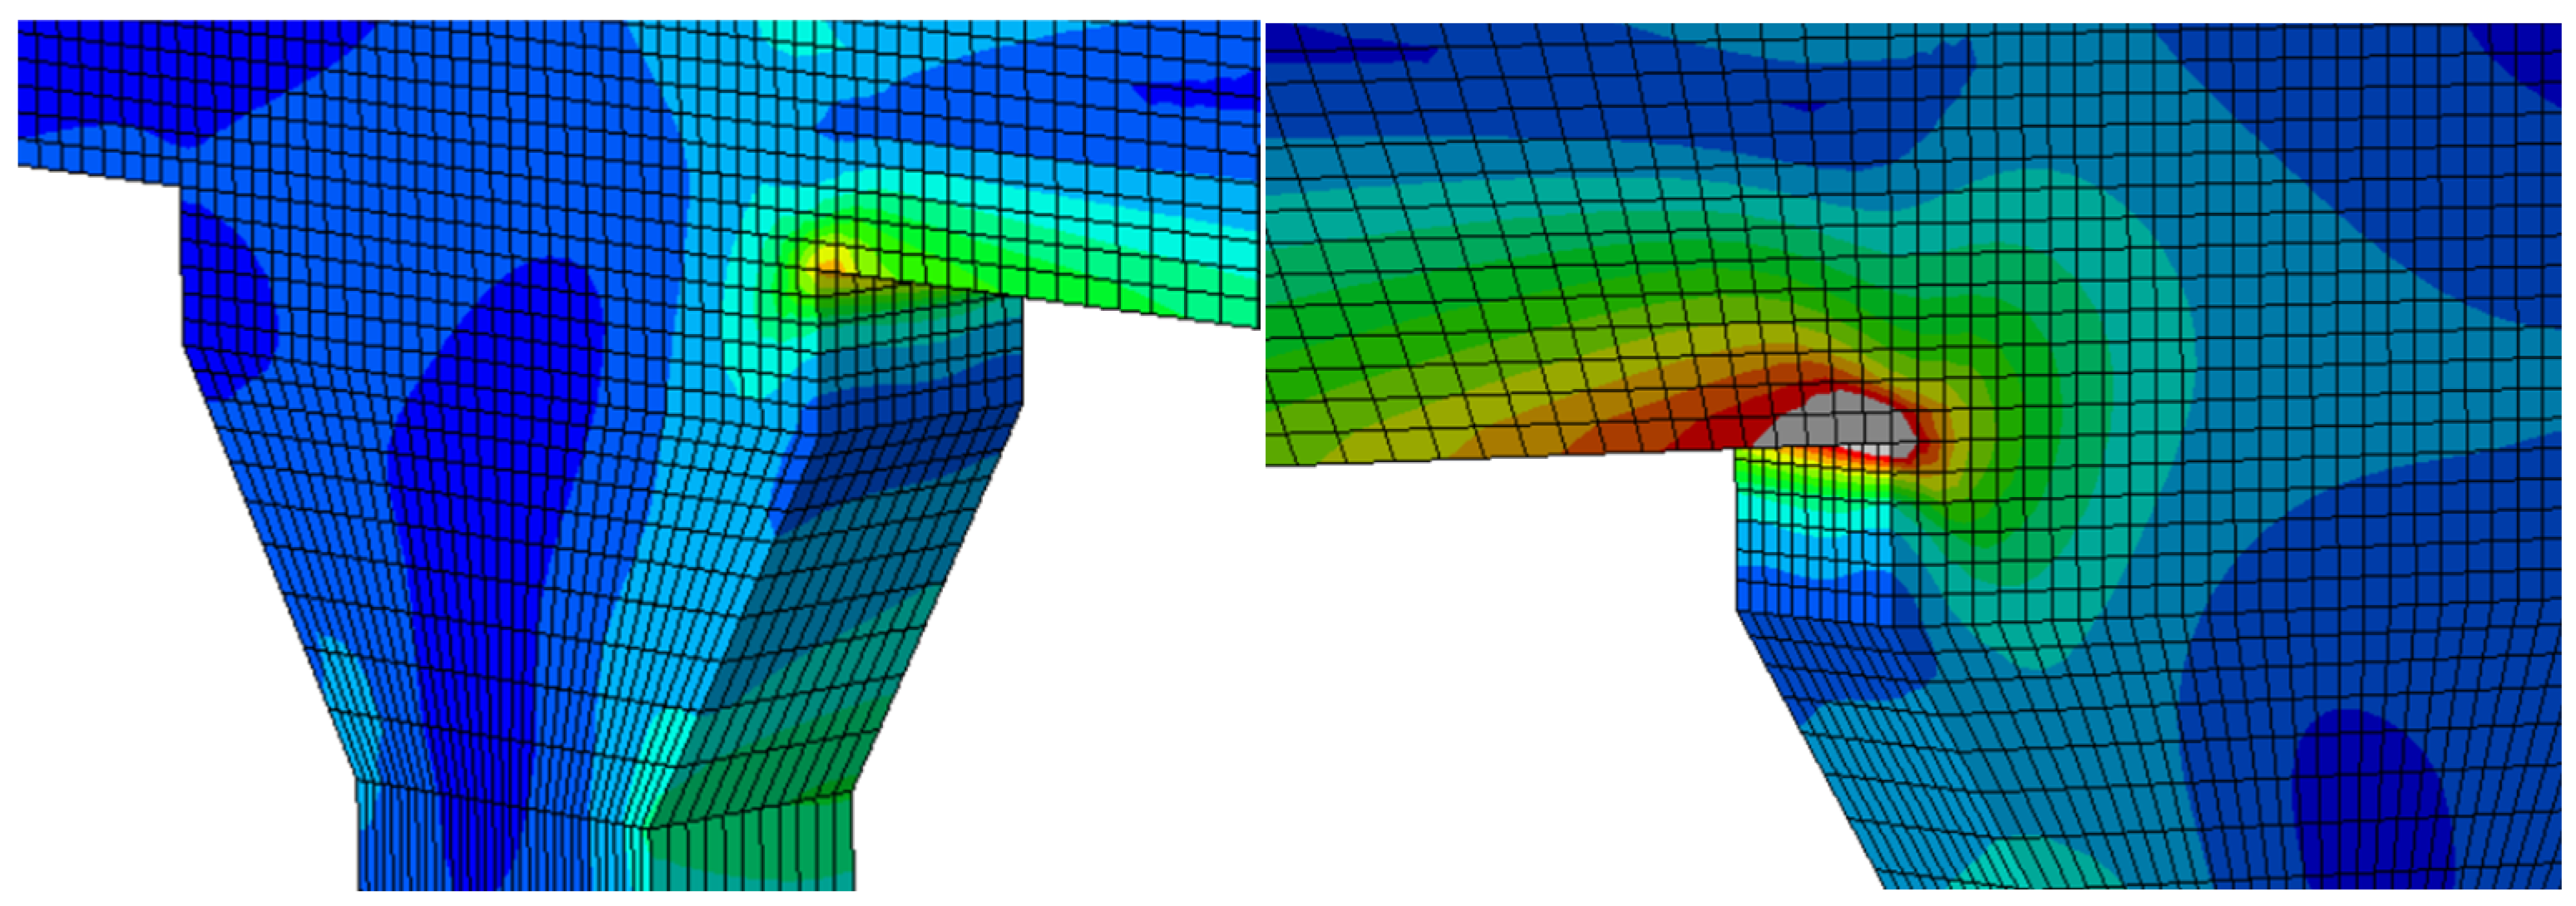
4.2. Scenario Analysis—Passage of Overweight Vehicles
4.3. Scenario Analysis Loss of Foundation Due to Scouring
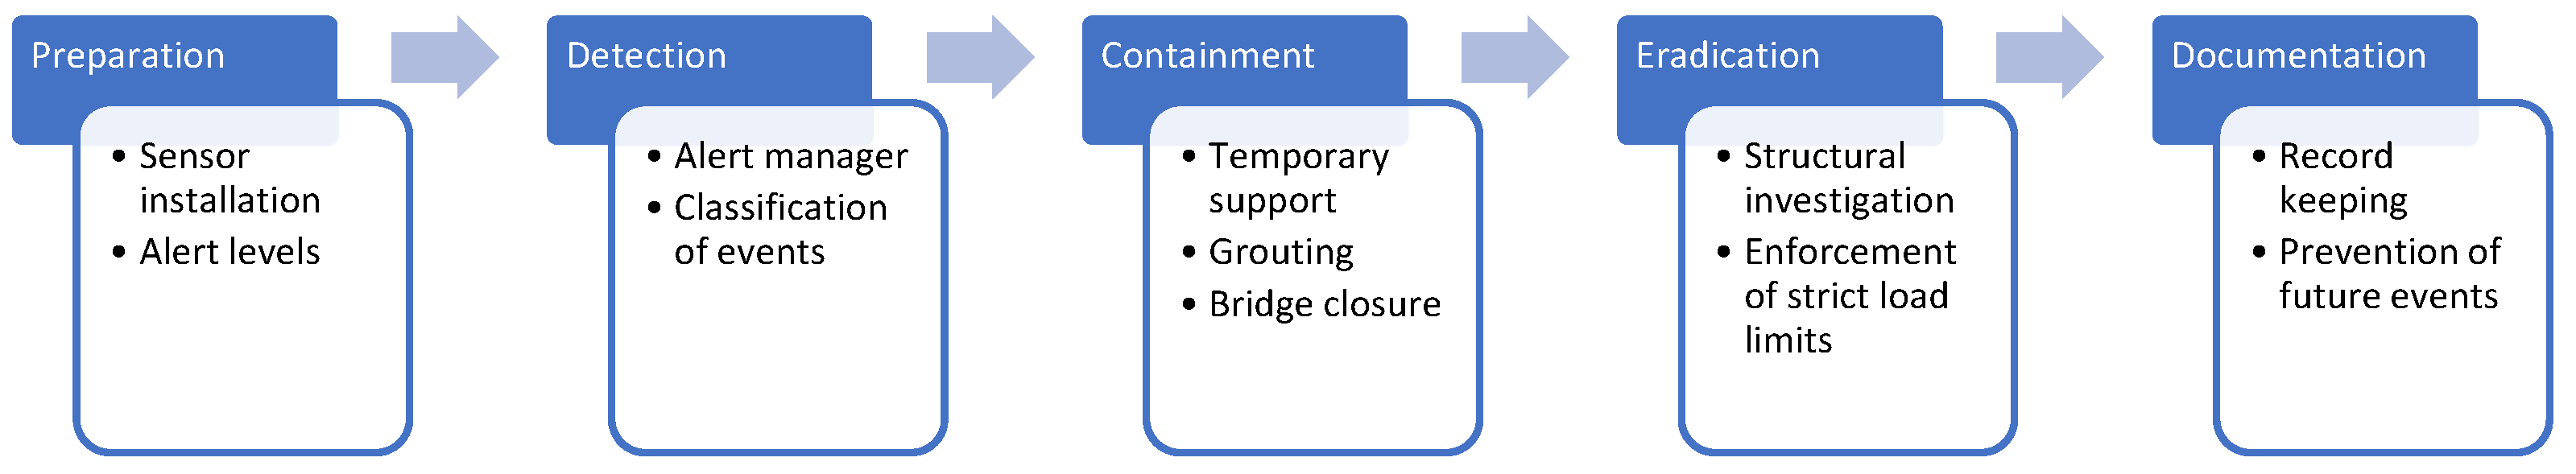
5. Proposed Incident Response Framework for Heritage Bridges
5.1. Phase 1—Preparation
5.2. Phase 2—Incident Detection and Classification
- Minor Incident: Events that exceed the established benchmark but remain within 50% above the permissible threshold. Typical examples include superficial issues such as hairline cracks or localized surface corrosion on steel components.
- Moderate Incident: Events that surpass the minor incident threshold (i.e., more than 50% above the benchmark) but remain under 75% of the allowable limit. Examples include noticeable girder deflections beyond tolerance, non-critical foundation settlements, or progressive cracking in the deck slab.
- Major Incident: Events that exceed 75% of the permissible limit. These include critical issues such as bearing misalignments, partial failures of girders or pier caps, or extensive corrosion and cracking that may compromise structural integrity.
- Emergency Incident: Severe, sudden, and unanticipated events that significantly exceed allowable thresholds and impair the functionality of the bridge. Examples include natural disasters (e.g., earthquakes, cyclones) or catastrophic impacts (e.g., vehicle or aircraft collision), which necessitate the immediate suspension of all structural use to prevent potential collapse.
- Minor: >Benchmark but ≤50% of permissible limit
- Moderate: >50% but ≤75% of permissible limit
- Major: >75% of permissible limit
- Emergency: Far exceeds permissible limits; sudden and disruptive
5.3. Phase 3: Containment
5.4. Phase 4: Eradication
5.5. Phase 5—Documentation
6. Conclusions
Author Contributions
Funding
Institutional Review Board Statement
Informed Consent Statement
Data Availability Statement
Acknowledgments
Conflicts of Interest
References
- Valente, I.; Ramos, L.F.; Vasquez, K.; Guimarães, P.; Lourenço, P.B. Non-Destructive Tests for the Structural Assessment of a Historical Bridge over the Tua River. Key Eng. Mater. 2013, 569–570, 390–397. [Google Scholar] [CrossRef]
- Batar, O.S.; Tercan, E.; Emsen, E. Ayvalıkemer (Sillyon) historical masonry arch bridge: A multidisciplinary approach for structural assessment using point cloud data obtained by terrestrial laser scanning (TLS). J. Civ. Struct. Health Monit. 2021, 11, 1239–1252. [Google Scholar] [CrossRef]
- Alpaslan, E.; Yilmaz, M.F.; Şengönül, B.D. Rating and reliability assessment of a historical masonry arch bridge. J. Civ. Struct. Health Monit. 2023, 13, 1003–1021. [Google Scholar] [CrossRef]
- Granata, M.F.; Messina, D.; Colajanni, P.; La Mendola, L.; Giudice, E.L. Performance of a historical cantilever reinforced concrete bridge with half-joint degradation. Structures 2022, 37, 561–575. [Google Scholar] [CrossRef]
- Ademović, N. Structural assessment & strengthening of the first singe-arch RC bridge in Sarajevo, BIH. Eng. Struct. 2021, 235, 112002. [Google Scholar]
- Bayane, I.; Brühwiler, E. Structural condition assessment of reinforced-concrete bridges based on acoustic emission and strain measurements. J. Civ. Struct. Health Monit. 2020, 10, 1037–1055. [Google Scholar] [CrossRef]
- Zhao, X.; Liu, H.; Yu, Y.; Xu, X.; Hu, W.; Li, M.; Ou, J. Bridge Displacement Monitoring Method Based on Laser Projection-Sensing Technology. Sensors 2015, 15, 8444–8463. [Google Scholar] [CrossRef]
- Brown, N.; Schumacher, T.; Vicente, M.A. Evaluation of a novel video- and laser-based displacement sensor prototype for civil infrastructure applications. J. Civ. Struct. Health Monit. 2021, 11, 265–281. [Google Scholar] [CrossRef]
- Waqas, H.A.; Sahil, M.; Riaz, A.; Ahmed, S.; Waseem, M.; Seitz, H. Efficient bridge steel bearing health monitoring using laser displacement sensors and wireless accelerometers. Front. Built Environ. 2024, 10, 1396815. [Google Scholar] [CrossRef]
- Pan, B.; Tian, L.; Song, X. Real-time, non-contact and targetless measurement of vertical deflection of bridges using off-axis digital image correlation. NDT E Int. 2016, 79, 73–80. [Google Scholar] [CrossRef]
- Lee, A.; Su, R.; Chan, R.W. Structural behaviour of post-installed reinforcement bars in moment connections of wall-slabs. Eng. Struct. 2019, 195, 536–550. [Google Scholar] [CrossRef]
- Qiu, Q.; Lau, D. Real-time detection of cracks in tiled sidewalks using YOLO-based method applied to unmanned aerial vehicle (UAV) images. Autom. Constr. 2023, 147, 104745. [Google Scholar] [CrossRef]
- Zhang, J.; Qian, S.; Tan, C. Automated bridge surface crack detection and segmentation using computer vision-based deep learning model. Eng. Appl. Artif. Intell. 2022, 115, 105225. [Google Scholar] [CrossRef]
- Huang, L.; Fan, G.; Li, J.; Hao, H. Deep learning for automated multiclass surface damage detection in bridge inspections. Autom. Constr. 2024, 166, 105601. [Google Scholar] [CrossRef]
- Yang, Y.B.; Xu, H.; Mo, X.Q.; Wang, Z.L.; Wu, Y.T. An effective procedure for extracting the first few bridge frequencies from a test vehicle. Acta Mech. 2021, 232, 1227–1251. [Google Scholar] [CrossRef]
- Li, Z.; Lan, Y.; Lin, W. Indirect damage detection for bridges using sensing and temporarily parked vehicles. Eng. Struct. 2023, 291, 116459. [Google Scholar] [CrossRef]
- Feng, K.; Hester, D.; Taylor, S.; O’HIggins, C.; Ferguson, A.; Zhu, Z.; Zou, G.; Lydon, M.; Early, J. Experimental modal identification of a pedestrian bridge through drive-by monitoring integrated with shared-mobility vehicles. Dev. Built Environ. 2024, 20, 100562. [Google Scholar] [CrossRef]
- Li, Z.; Lan, Y.; Lin, W. Indirect Frequency Identification of Footbridges with Pedestrians Using the Contact-Point Response of Shared Scooters. J. Bridg. Eng. 2024, 29, 04024036. [Google Scholar] [CrossRef]
- Martucci, D.; Civera, M.; Surace, C. Bridge monitoring: Application of the extreme function theory for damage detection on the I-40 case study. Eng. Struct. 2023, 279, 115573. [Google Scholar] [CrossRef]
- Hasuike, R.; Kinoshita, K.; Hatano, H.; Morimoto, H.; Rokugo, K. Clarification of Performance Requirements for Utilizing Robotic Technology for Regular Inspection of Steel Bridges; CRC Press: Boca Raton, FL, USA, 2021. [Google Scholar]
- Hasuike, R.; Kinoshita, K.; Hatano, H.; Morimoto, H.; Rokugo, K. Suggestion of the requirement for robotic technology utilizing into periodic inspection of steel bridges. J. Struct. Eng. A 2020, 66, 629–638. [Google Scholar]
- AS5100.7; Bridge design, Part 7: Bridge assessment. Standards Australia: Sydney, Australia, 2017.
- VicRoads. Bridge Maintenance and Repair Manual; Victoria State Government: Melbourne, VIC, Australia, 2018. [Google Scholar]
- Heritage Act; State of Victoria: Melbourne, VIC, Australia, 2017.
- Traffic Volume, Open Data Hub, 4 May 2023. Available online: https://vicroadsopendata-vicroadsmaps.opendata.arcgis.com/datasets/traffic-volume/explore (accessed on 6 June 2025).
- Shayan, A.; Xu, A.; Giummarra, G.; Al-Mahaidi, R.; Andrews, F. Condition Assessment of St Kilda Street Bridge Over Elwood Canal, Its Load Capacity and Maintenance Strategy. In Proceedings of the 21st ARRB and 11th REAAA Conference, Cairns, Australia, 18–23 May 2003. [Google Scholar]
- GHD. Report for VicRoads—St Kilda Street Bridge; GHD: Melbourne, Australia, 2015. [Google Scholar]
- Campbell, S. Thousands affected as St Kilda Street Bridge closes for two weeks. In Herald Sun; News Corp Australia: Melbourne, Australia, 2015. [Google Scholar]
- Qin, Q.; Li, H.; Qian, L.; Lau, C.-K. Modal Identification of Tsing Ma Bridge by Using Improved Eigensystem Realization Algorithm. J. Sound Vib. 2001, 247, 325–341. [Google Scholar] [CrossRef]
- Brincker, R.; Zhang, L.; Andersen, P. Modal identification of output-only systems using frequency domain decomposition. Smart Mater. Struct. 2001, 10, 441–445. [Google Scholar] [CrossRef]
- Magalhães, F.; Cunha, Á.; Caetano, E. Online automatic identification of the modal parameters of a long span arch bridge. Mech. Syst. Signal Process. 2009, 23, 316–329. [Google Scholar] [CrossRef]
- AASHTO. AASHTO Standard Specifications for Highway Bridges, 17th ed.; American Association of State Highway and Transportation Officials, Inc.: Washington, DC, USA, 2002. [Google Scholar]
- Austroads. Bridge Design Code; Austroads Publication: New South Wales, Australia, 1992; ISBN 0855884053/9780855884055. [Google Scholar]
- AS5100.2; Bridge Design-Design Loads. Standards Australia: Sydney, Australia, 2017.
- AASHTO. Manual for Bridge Evaluation, 3rd ed.; American Association of State Highway and Transportation Officials (AASHTO): Washington, DC, USA, 2020. [Google Scholar]
- FHWA. Hydraulic Engineering Circular No. 18 (HEC-18), 5th ed.; Federal Highway Administration (FHWA): Washington, DC, USA, 2012. [Google Scholar]
- Abdulkarem, M.; Samsudin, K.; Rokhani, F.Z.; A Rasid, M.F. Wireless sensor network for structural health monitoring: A contemporary review of technologies, challenges, and future direction. Struct. Health Monit. 2019, 19, 693–735. [Google Scholar] [CrossRef]
- Moreno-Gomez, A.; Perez-Ramirez, C.A.; Dominguez-Gonzalez, A.; Valtierra-Rodriguez, M.; Chavez-Alegria, O.; Amezquita-Sanchez, J.P. Sensors Used in Structural Health Monitoring. State Art Rev. 2018, 25, 901–918. [Google Scholar] [CrossRef]
- Wu, T.; Liu, G.; Fu, S.; Xing, F. Recent Progress of Fiber-Optic Sensors for the Structural Health Monitoring of Civil Infrastructure. Sensors 2020, 20, 4517. [Google Scholar] [CrossRef]


| Parameters | Values |
|---|---|
| Concrete strength (beam) | 12.4 MPa 1 |
| Concrete strength (column) | 17.2 MPa 1 |
| Concrete Elastic Modulus | 22,500 MPa |
| Corrosion | Low to moderate |
| Porosity | High |
| Chloride content | Low |
| Field Measurement | FE Model | Difference (%) |
|---|---|---|
| 20.15 Hz | 19.51 Hz | 3.2% |
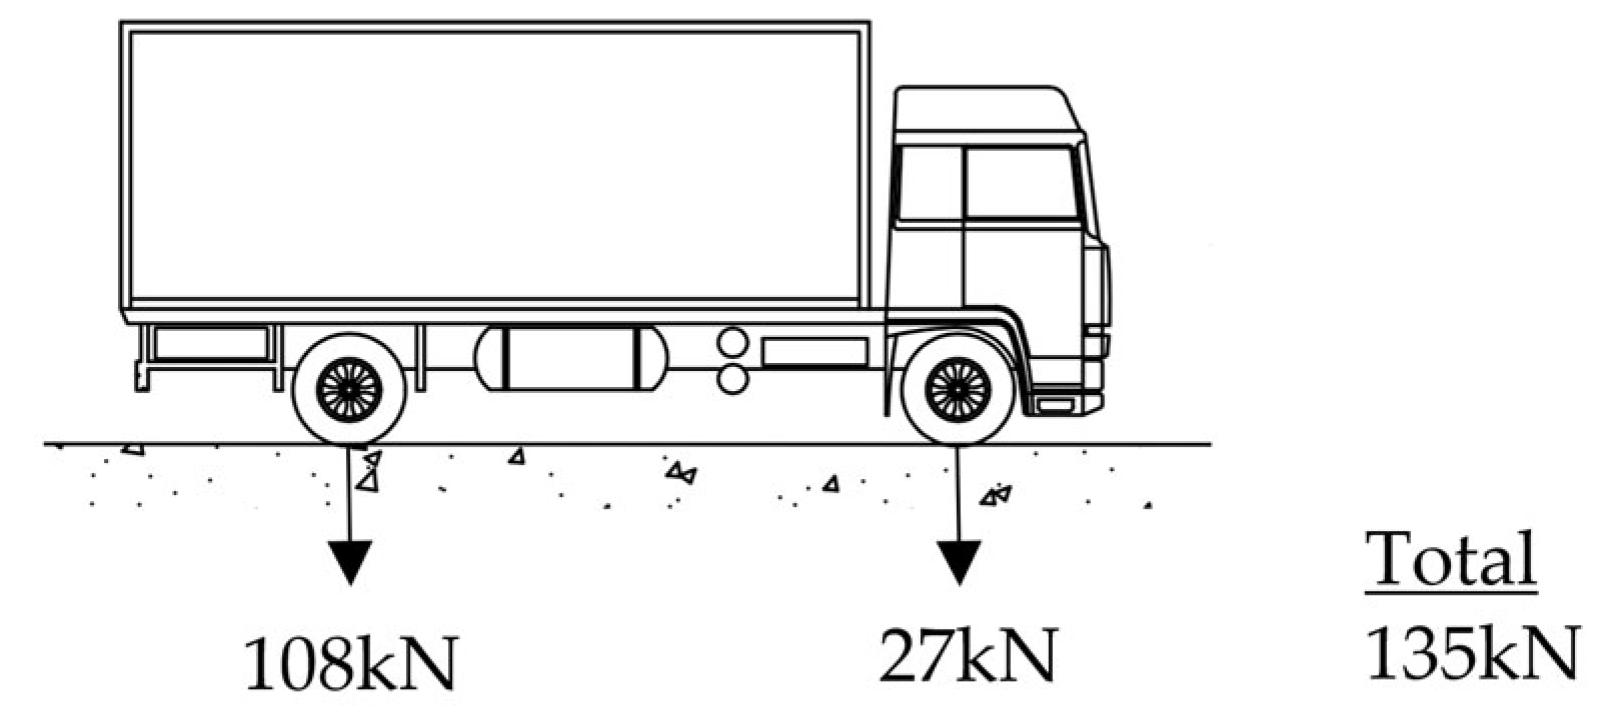
| Design Vehicle | M13.5 (AASHTO [32]) | T44 (1992 Austroads [33]) | M1600 (AS5100.2-2017 [34]) |
|---|---|---|---|
| Total vehicle weight | 135 kN | 432 kN | 1440 kN |
| No. axle | 2 | 5 | 12 |
| Edge girder-max. shear force (kN) | 12.3 | 20.7 | 38.1 |
| Edge girder-max. bending moment (kNm) | 9.99 | 18.1 | 33.5 |
| Interior girder-max. shear force (kN) | 48.2 | 76.1 | 117.1 |
| Interior girder–max. bending moment (kNm) | 34.7 | 57.1 | 110.4 |
| Max deflection (mm) | 1.3 (L/4040) | 2.0 (L/2613) | 3.2 (L/1650) |
| No Damage | Scour C1 | Scour C1 & D1 |
|---|---|---|
| 19.51 Hz | 10.54 Hz | 7.91Hz |
Disclaimer/Publisher’s Note: The statements, opinions and data contained in all publications are solely those of the individual author(s) and contributor(s) and not of MDPI and/or the editor(s). MDPI and/or the editor(s) disclaim responsibility for any injury to people or property resulting from any ideas, methods, instructions or products referred to in the content. |
© 2025 by the authors. Licensee MDPI, Basel, Switzerland. This article is an open access article distributed under the terms and conditions of the Creative Commons Attribution (CC BY) license (https://creativecommons.org/licenses/by/4.0/).
Share and Cite
Chan, R.W.K.; Iwata, T. Risk Mitigation of a Heritage Bridge Using Noninvasive Sensors. Sensors 2025, 25, 3727. https://doi.org/10.3390/s25123727
Chan RWK, Iwata T. Risk Mitigation of a Heritage Bridge Using Noninvasive Sensors. Sensors. 2025; 25(12):3727. https://doi.org/10.3390/s25123727
Chicago/Turabian StyleChan, Ricky W. K., and Takahiro Iwata. 2025. "Risk Mitigation of a Heritage Bridge Using Noninvasive Sensors" Sensors 25, no. 12: 3727. https://doi.org/10.3390/s25123727
APA StyleChan, R. W. K., & Iwata, T. (2025). Risk Mitigation of a Heritage Bridge Using Noninvasive Sensors. Sensors, 25(12), 3727. https://doi.org/10.3390/s25123727