

Characterizing Neurocardiovascular Responses to an Active Stand Test in Older Women: A Pilot Study Using Functional Data Analysis


Abstract
1. Introduction
2. Materials and Methods
2.1. Study Sample
2.2. Participant Characteristics
2.3. Active Stand
2.4. Instrumentation
2.4.1. Continuous Cardiovascular Signals
2.4.2. Continuous Neurovascular Signals
2.5. Signal Acquisition and Synchronization
2.6. Functional Data Analysis
3. Results
4. Discussion
Author Contributions
Funding
Institutional Review Board Statement
Informed Consent Statement
Data Availability Statement
Conflicts of Interest
References
- Romero-Ortuno, R.; Cogan, L.; Foran, T.; Kenny, R.A.; Fan, C.W. Continuous noninvasive orthostatic blood pressure measurements and their relationship with orthostatic intolerance, falls, and frailty in older people. J. Am. Geriatr. Soc. 2011, 59, 655–665. [Google Scholar] [CrossRef] [PubMed]
- Christopoulos, E.M.; Tran, J.; Hillebrand, S.L.; Lange, P.W.; Iseli, R.K.; Meskers, C.G.M.; Maier, A.B. Initial orthostatic hypotension and orthostatic intolerance symptom prevalence in older adults: A systematic review. Int. J. Cardiol. Hypertens. 2021, 8, 100071. [Google Scholar] [CrossRef] [PubMed]
- Lee, J.F.; Harrison, M.L.; Christmas, K.M.; Kim, K.; Hurr, C.; Brothers, R.M. Elevated resting heart rate and reduced orthostatic tolerance in obese humans. Clin. Auton. Res. 2014, 24, 39–46. [Google Scholar] [CrossRef] [PubMed]
- Goswami, N.; Blaber, A.P.; Hinghofer-Szalkay, H.; Montani, J.P. Orthostatic Intolerance in Older Persons: Etiology and Countermeasures. Front. Physiol. 2017, 8, 803. [Google Scholar] [CrossRef]
- Okyar Bas, A.; Guner Oytun, M.; Kahyaoglu, Z.; Coteli, S.; Ceylan, S.; Boga, I.; Dogu, B.B.; Cankurtaran, M.; Halil, M.G. Orthostatic intolerance: A frailty marker for older adults. Eur. Geriatr. Med. 2022, 13, 675–684. [Google Scholar] [CrossRef]
- Harms, M.P.M.; Finucane, C.; Perez-Denia, L.; Juraschek, S.P.; van Wijnen, V.K.; Lipsitz, L.A.; van Lieshout, J.J.; Wieling, W. Systemic and cerebral circulatory adjustment within the first 60 s after active standing: An integrative physiological view. Auton. Neurosci. 2021, 231, 102756. [Google Scholar] [CrossRef]
- Wieling, W.; Krediet, C.T.; van Dijk, N.; Linzer, M.; Tschakovsky, M.E. Initial orthostatic hypotension: Review of a forgotten condition. Clin. Sci. 2007, 112, 157–165. [Google Scholar] [CrossRef]
- Tran, J.; Hillebrand, S.L.; Meskers, C.G.M.; Iseli, R.K.; Maier, A.B. Prevalence of initial orthostatic hypotension in older adults: A systematic review and meta-analysis. Age Ageing 2021, 50, 1520–1528. [Google Scholar] [CrossRef]
- Xue, F.; Monaghan, A.; Jennings, G.; Byrne, L.; Foran, T.; Duggan, E.; Romero-Ortuno, R. A Novel Methodology for the Synchronous Collection and Multimodal Visualization of Continuous Neurocardiovascular and Neuromuscular Physiological Data in Adults with Long COVID. Sensors 2022, 22, 1758. [Google Scholar] [CrossRef]
- Xue, F.; Knight, S.; Connolly, E.; O’Halloran, A.; Shirsath, M.A.; Newman, L.; Duggan, E.; Kenny, R.A.; Romero-Ortuno, R. Were Frailty Identification Criteria Created Equal? A Comparative Case Study on Continuous Non-Invasively Collected Neurocardiovascular Signals during an Active Standing Test in the Irish Longitudinal Study on Ageing (TILDA). Sensors 2024, 24, 442. [Google Scholar] [CrossRef]
- Gertheiss, J.; Rugamer, D.; Liew, B.X.W.; Greven, S. Functional Data Analysis: An Introduction and Recent Developments. Biom. J. 2024, 66, e202300363. [Google Scholar] [CrossRef]
- Duggan, E. Sarcopenia and Orthostatic Hypotension: Investigating the Underlying Haemodynamics. Ph.D. Thesis, Trinity College Dublin, School of Medicine, Discipline of Medical Gerontology, Dublin, Ireland, 2024. Available online: https://www.tara.tcd.ie/handle/2262/110507 (accessed on 4 May 2025).
- WHO. Obesity. 2025. Available online: https://www.who.int/health-topics/obesity (accessed on 4 May 2025).
- Romero-Ortuno, R.; Walsh, C.D.; Lawlor, B.A.; Kenny, R.A. A frailty instrument for primary care: Findings from the Survey of Health, Ageing and Retirement in Europe (SHARE). BMC Geriatr. 2010, 10, 57. [Google Scholar] [CrossRef]
- Cho, J. Current Status and Prospects of Health-Related Sensing Technology in Wearable Devices. J. Healthc. Eng. 2019, 2019, 3924508. [Google Scholar] [CrossRef] [PubMed]
- Parati, G.; Casadei, R.; Groppelli, A.; Di Rienzo, M.; Mancia, G. Comparison of finger and intra-arterial blood pressure monitoring at rest and during laboratory testing. Hypertension 1989, 13 Pt 1, 647–655. [Google Scholar] [CrossRef]
- Schutte, A.; Huisman, H.; Van Rooyen, J.; Malan, N.; Schutte, R. Validation of the Finometer device for measurement of blood pressure in black women. J. Hum. Hypertens. 2004, 18, 79–84. [Google Scholar] [CrossRef]
- Ferrari, M.; Quaresima, V. A brief review on the history of human functional near-infrared spectroscopy (fNIRS) development and fields of application. Neuroimage 2012, 63, 921–935. [Google Scholar] [CrossRef]
- Scholkmann, F.; Kleiser, S.; Metz, A.J.; Zimmermann, R.; Mata Pavia, J.; Wolf, U.; Wolf, M. A review on continuous wave functional near-infrared spectroscopy and imaging instrumentation and methodology. Neuroimage 2014, 85 Pt 1, 6–27. [Google Scholar] [CrossRef]
- Cortese, L.; Zanoletti, M.; Karadeniz, U.; Pagliazzi, M.; Yaqub, M.A.; Busch, D.R.; Mesquida, J.; Durduran, T. Performance Assessment of a Commercial Continuous-Wave Near-Infrared Spectroscopy Tissue Oximeter for Suitability for Use in an International, Multi-Center Clinical Trial. Sensors 2021, 21, 6957. [Google Scholar] [CrossRef]
- Pham, T.; Tgavalekos, K.; Sassaroli, A.; Blaney, G.; Fantini, S. Quantitative measurements of cerebral blood flow with near-infrared spectroscopy. Biomed. Opt. Express 2019, 10, 2117–2134. [Google Scholar] [CrossRef]
- Ferrari, M.; Muthalib, M.; Quaresima, V. The use of near-infrared spectroscopy in understanding skeletal muscle physiology: Recent developments. Philos. Trans. A Math. Phys. Eng. Sci. 2011, 369, 4577–4590. [Google Scholar] [CrossRef]
- Boas, D.A.; Elwell, C.E.; Ferrari, M.; Taga, G. Twenty years of functional near-infrared spectroscopy: Introduction for the special issue. Neuroimage 2014, 85 Pt 1, 1–5. [Google Scholar] [CrossRef]
- Newman, L.; Nolan, H.; Carey, D.; Reilly, R.B.; Kenny, R.A. Age and sex differences in frontal lobe cerebral oxygenation in older adults-Normative values using novel, scalable technology: Findings from the Irish Longitudinal Study on Ageing (TILDA). Arch. Gerontol. Geriatr. 2020, 87, 103988. [Google Scholar] [CrossRef] [PubMed]
- Klem, G.H.; Lüders, H.O.; Jasper, H.H.; Elger, C. The ten-twenty electrode system of the International Federation. The International Federation of Clinical Neurophysiology. Electroencephalogr. Clin. Neurophysiol. Suppl. 1999, 52, 3–6. [Google Scholar] [PubMed]
- Ramsay, J.O.; Silverman, B.W. Applied Functional Data Analysis: Methods and Case Studies; Springer: Berlin/Heidelberg, Germany, 2002. [Google Scholar]
- Ullah, S.; Finch, C. Applications of functional data analysis: A systematic review. BMC Med. Res. Methodol. 2013, 13, 43. [Google Scholar] [CrossRef]
- Ramsay, J.; Silverman, B.W. Functional Data Analysis; Springer: New York, NY, USA, 2005. [Google Scholar]
- Wieling, W.; van Brederode, J.F.; de Rijk, L.G.; Borst, C.; Dunning, A.J. Reflex control of heart rate in normal subjects in relation to age: A data base for cardiac vagal neuropathy. Diabetologia 1982, 22, 163–166. [Google Scholar] [CrossRef]
- Dambrink, J.H.; Wieling, W. Circulatory response to postural change in healthy male subjects in relation to age. Clin. Sci. 1987, 72, 335–341. [Google Scholar] [CrossRef]
- Finucane, C.; O’Connell, M.D.; Fan, C.W.; Savva, G.M.; Soraghan, C.J.; Nolan, H.; Cronin, H.; Kenny, R.A. Age-related normative changes in phasic orthostatic blood pressure in a large population study: Findings from The Irish Longitudinal Study on Ageing (TILDA). Circulation 2014, 130, 1780–1789. [Google Scholar] [CrossRef] [PubMed]
- Knight, S.P.; Laird, E.; Williamson, W.; O’Connor, J.; Newman, L.; Carey, D.; De Looze, C.; Fagan, A.J.; Chappell, M.A.; Meaney, J.F.; et al. Obesity is associated with reduced cerebral blood flow—Modified by physical activity. Neurobiol. Aging 2021, 105, 35–47. [Google Scholar] [CrossRef]
- Klop, M. Rise & Shine: Capturing Postural Cerebral Oxygenation and Blood Pressure Changes with Nearinfrared Light. Ph.D. Dissertation, Radboud University, Nijmegen, The Netherlands, 2025. Available online: https://repository.ubn.ru.nl/handle/2066/317914 (accessed on 4 May 2025).
- Klop, M.; Claassen, J.; Floor-Westerdijk, M.J.; van Wezel, R.J.A.; Maier, A.B.; Meskers, C.G.M. Home-based monitoring of cerebral oxygenation in response to postural changes using near-infrared spectroscopy. Geroscience 2024, 46, 6331–6346. [Google Scholar] [CrossRef]
- Consensus statement on the definition of orthostatic hypotension, pure autonomic failure, and multiple system atrophy. The Consensus Committee of the American Autonomic Society and the American Academy of Neurology. Neurology 1996, 46, 1470.
- de Bruine, E.S.; Reijnierse, E.M.; Trappenburg, M.C.; Pasma, J.H.; de Vries, O.J.; Meskers, C.G.; Maier, A.B. Standing Up Slowly Antagonises Initial Blood Pressure Decrease in Older Adults with Orthostatic Hypotension. Gerontology 2017, 63, 137–143. [Google Scholar] [CrossRef] [PubMed]
- van Twist, D.J.L.; Harms, M.P.M.; van Wijnen, V.K.; Claydon, V.E.; Freeman, R.; Cheshire, W.P.; Wieling, W. Diagnostic criteria for initial orthostatic hypotension: A narrative review. Clin. Auton. Res. 2021, 31, 685–698. [Google Scholar] [CrossRef] [PubMed]
- Hui, G.; Xiahuan, C.; Yanjun, W.; Wenyi, L.; Meilin, L. Influencing factors and hemodynamic study of initial and sustained orthostatic hypotension in middle-aged and elderly patients. J. Clin. Hypertens. 2022, 24, 1491–1497. [Google Scholar] [CrossRef] [PubMed]
- Palatini, P. Orthostatic Hypertension: A Newcomer Among the Hypertension Phenotypes. Hypertension 2023, 80, 1993–2002. [Google Scholar] [CrossRef]


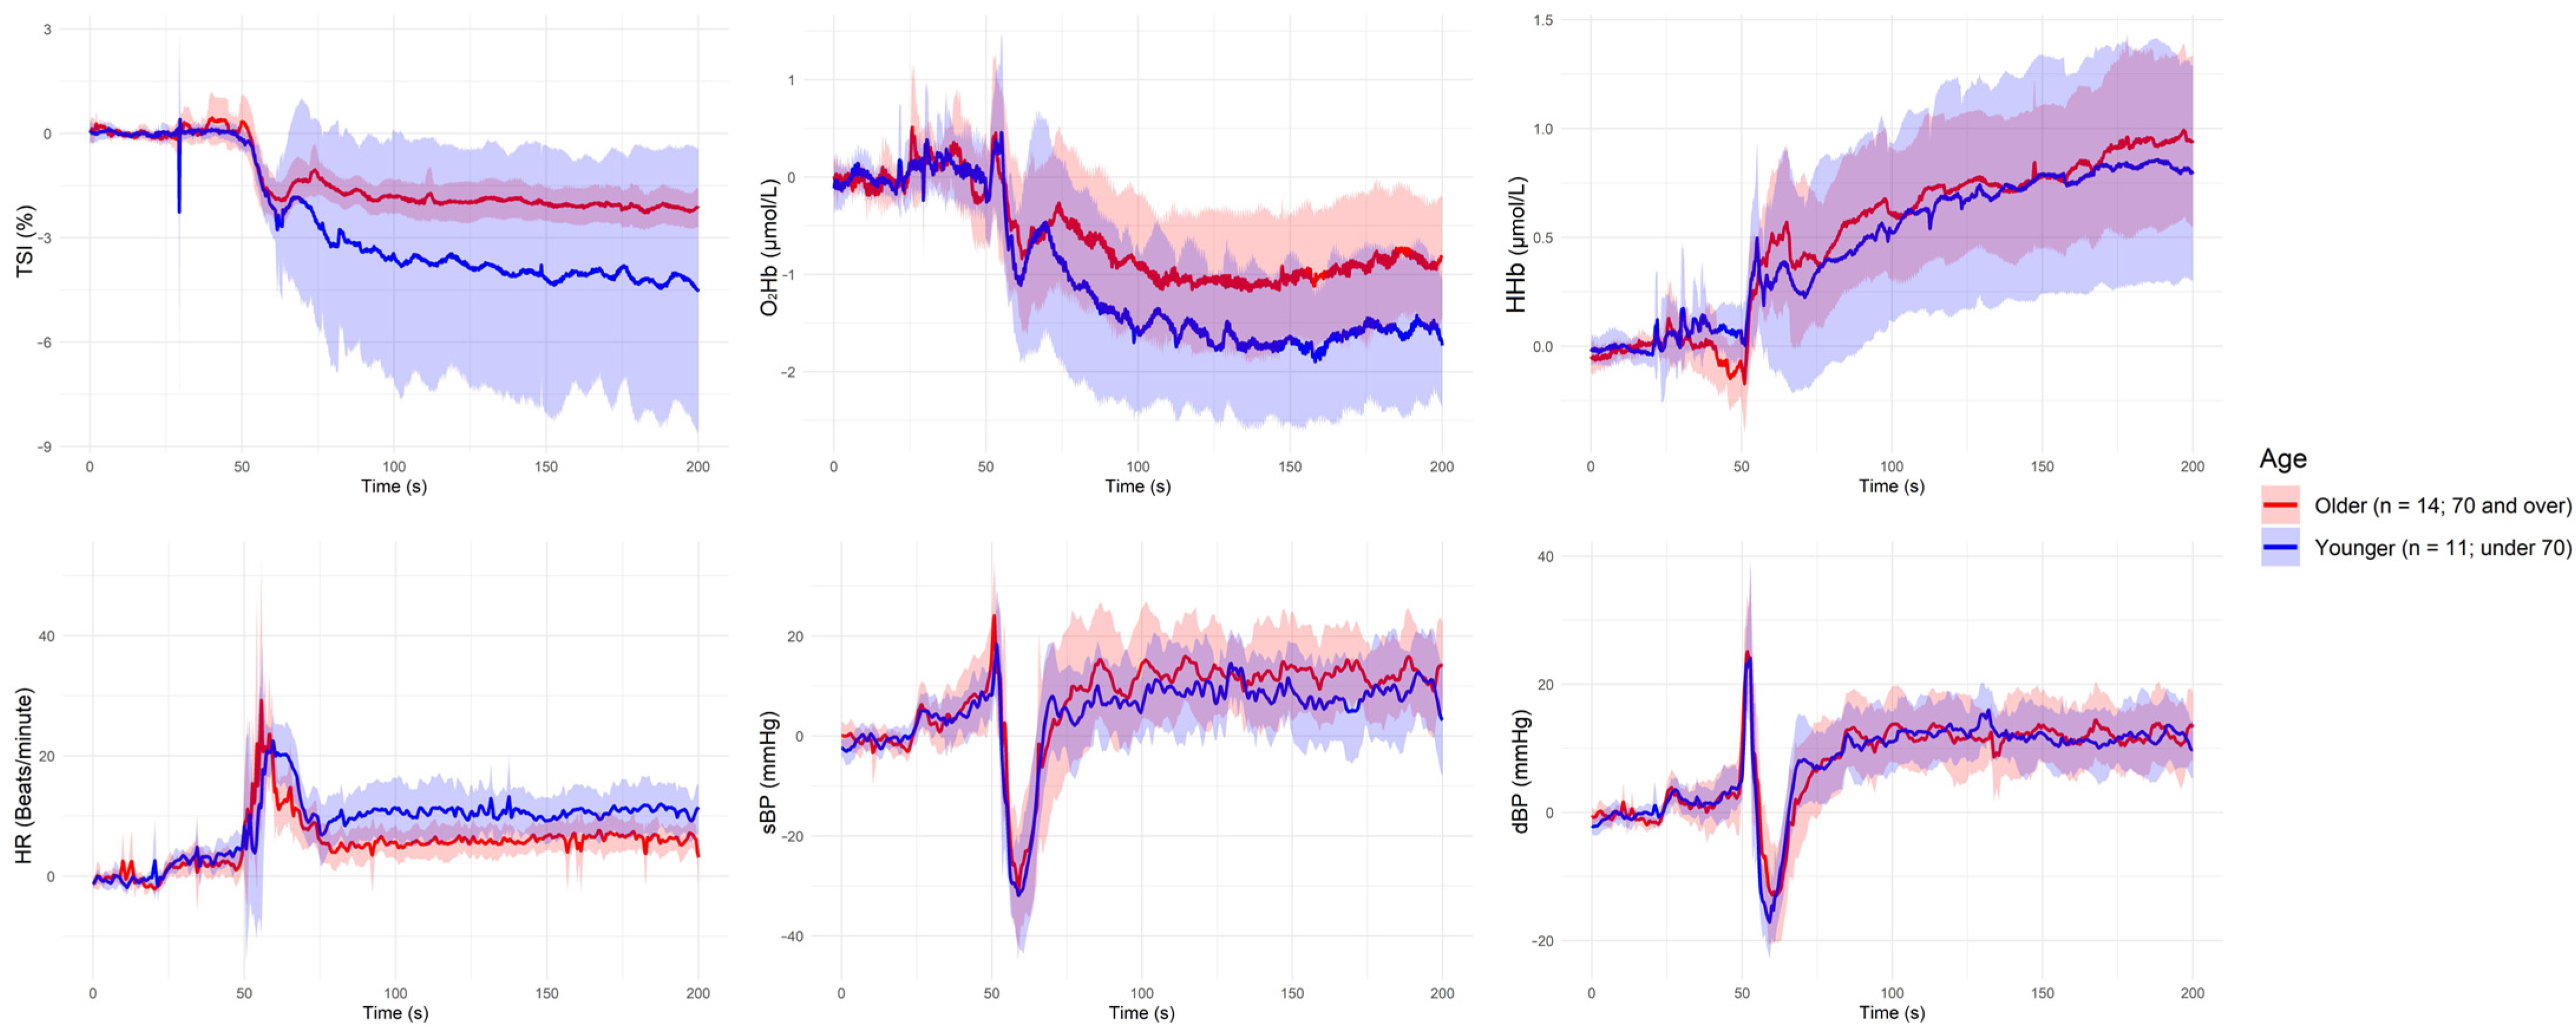
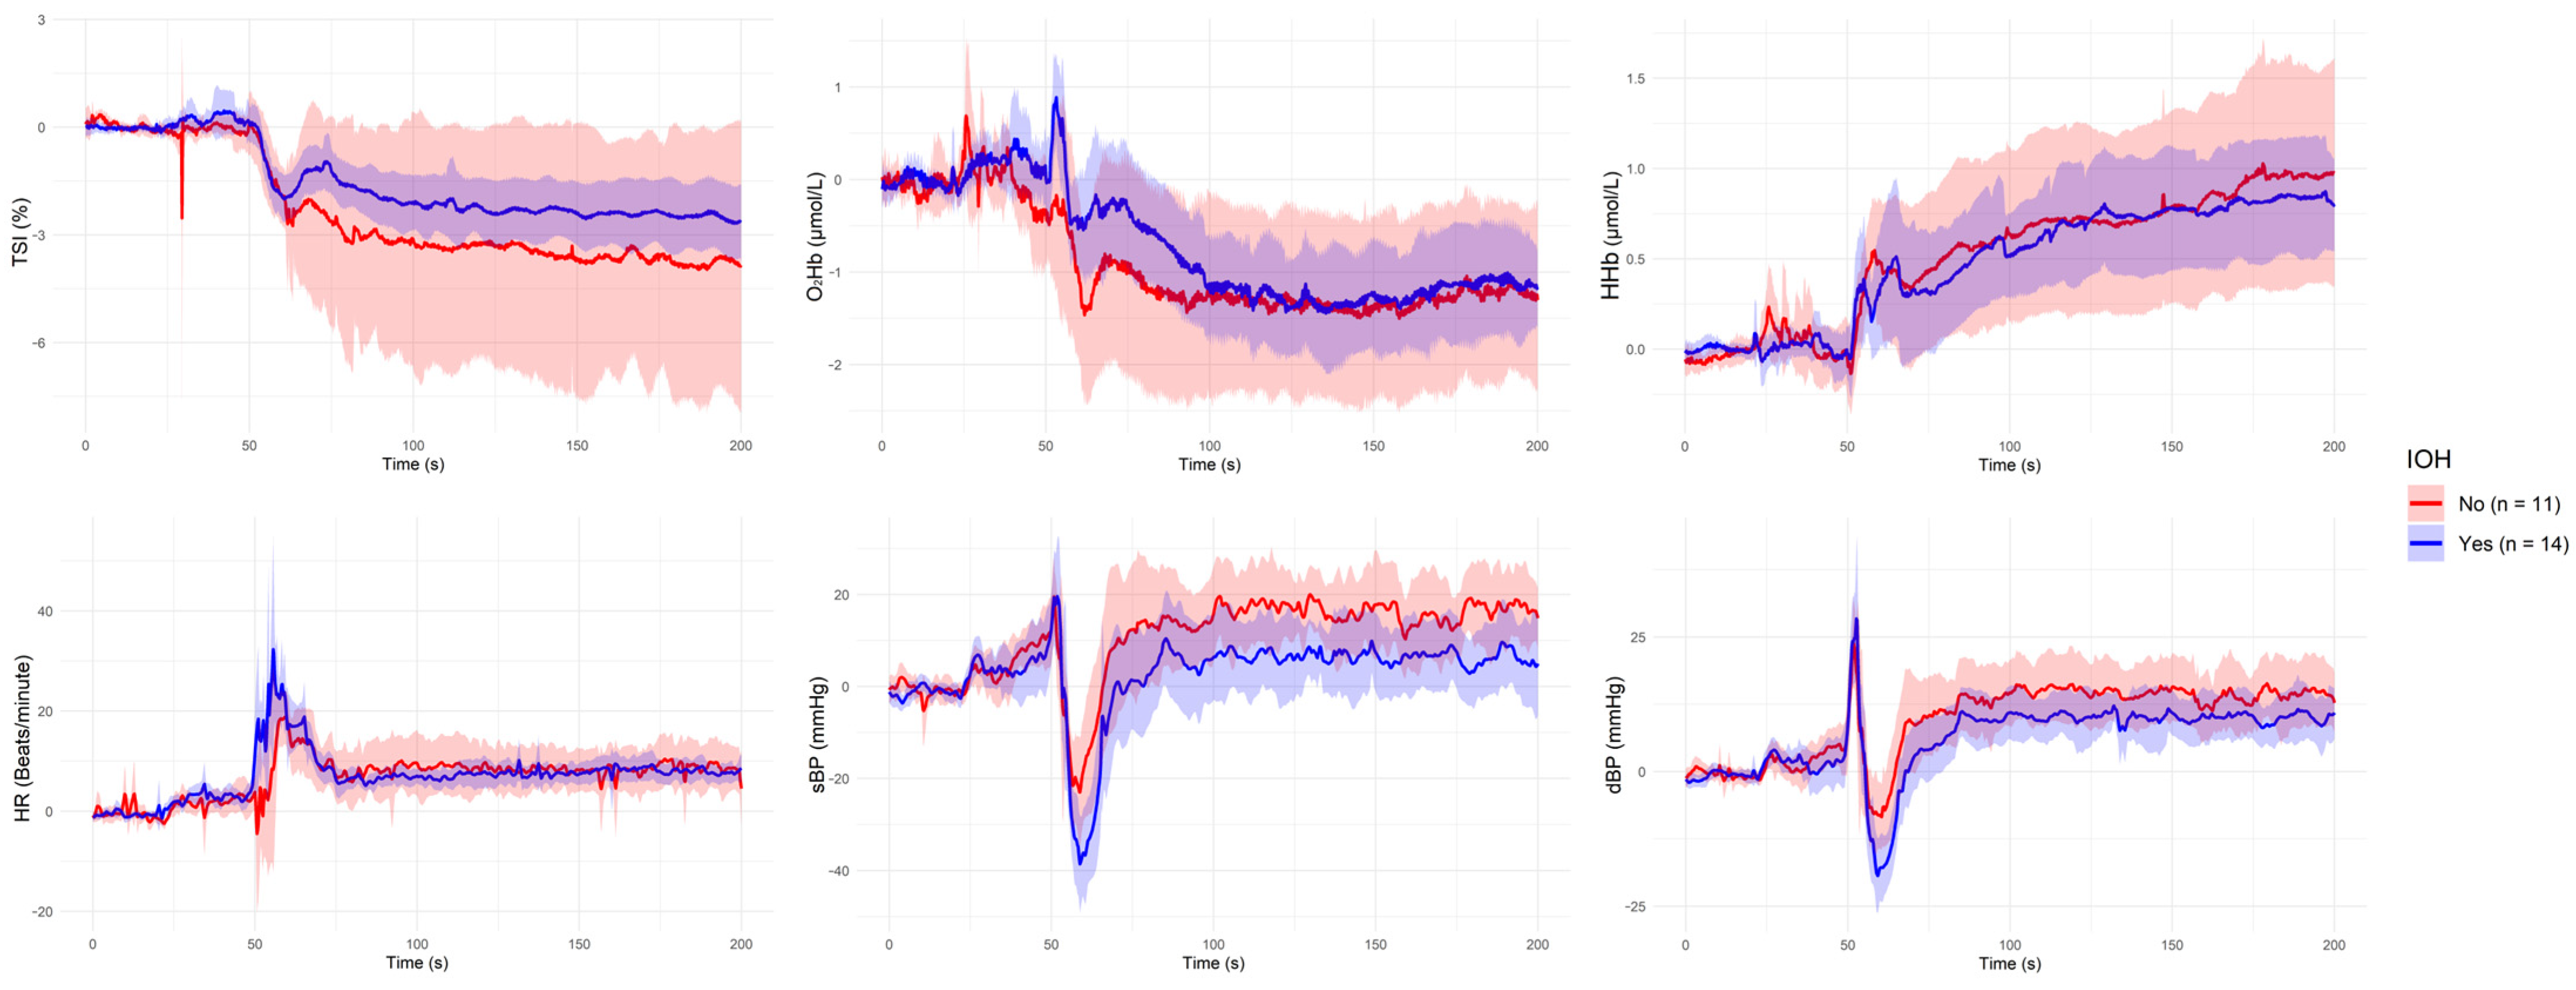
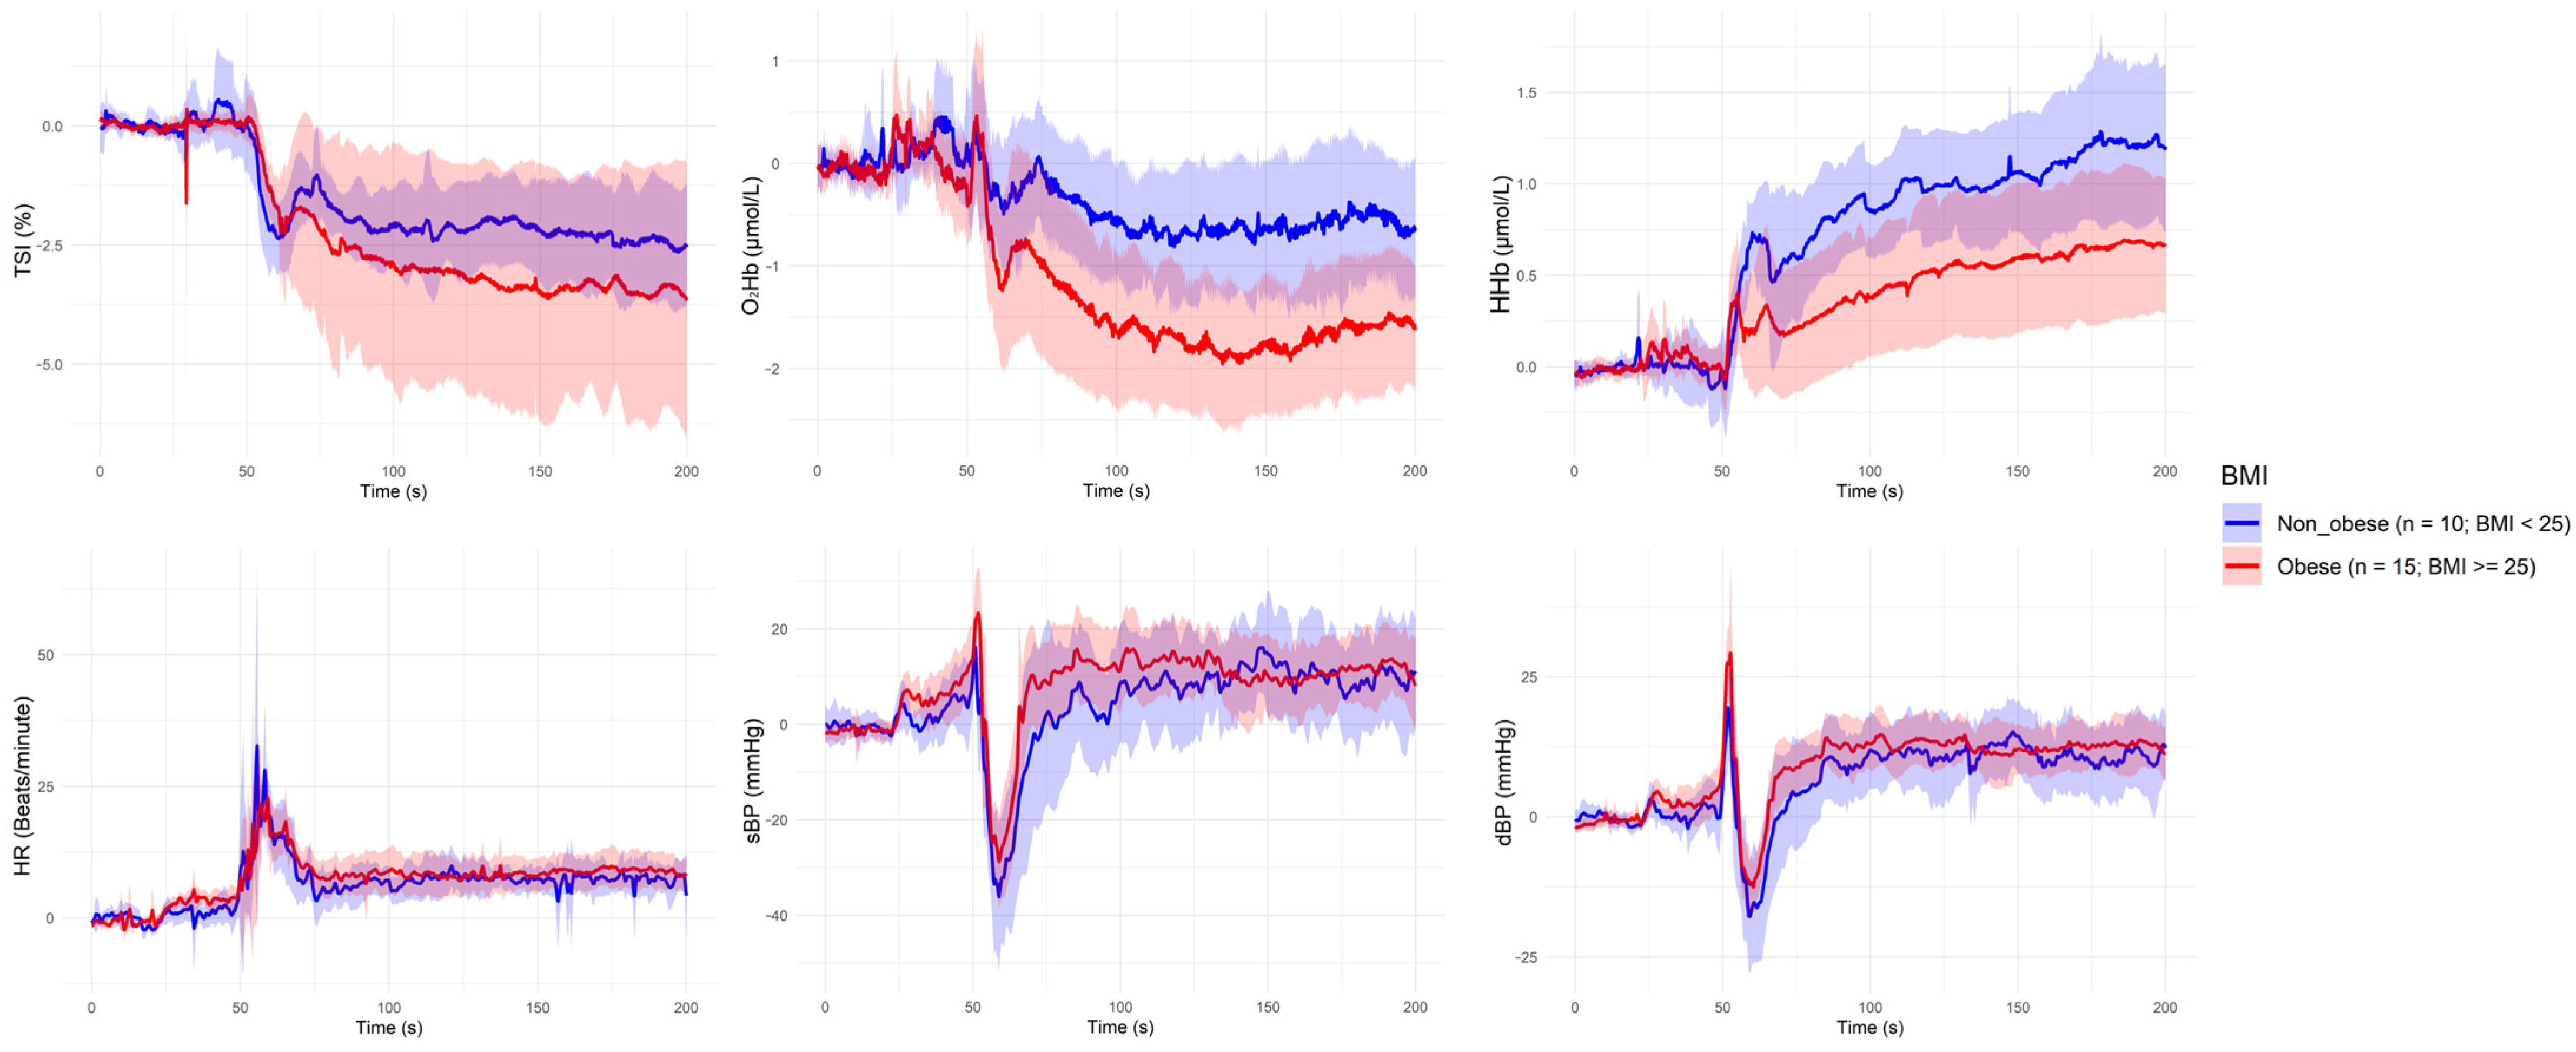
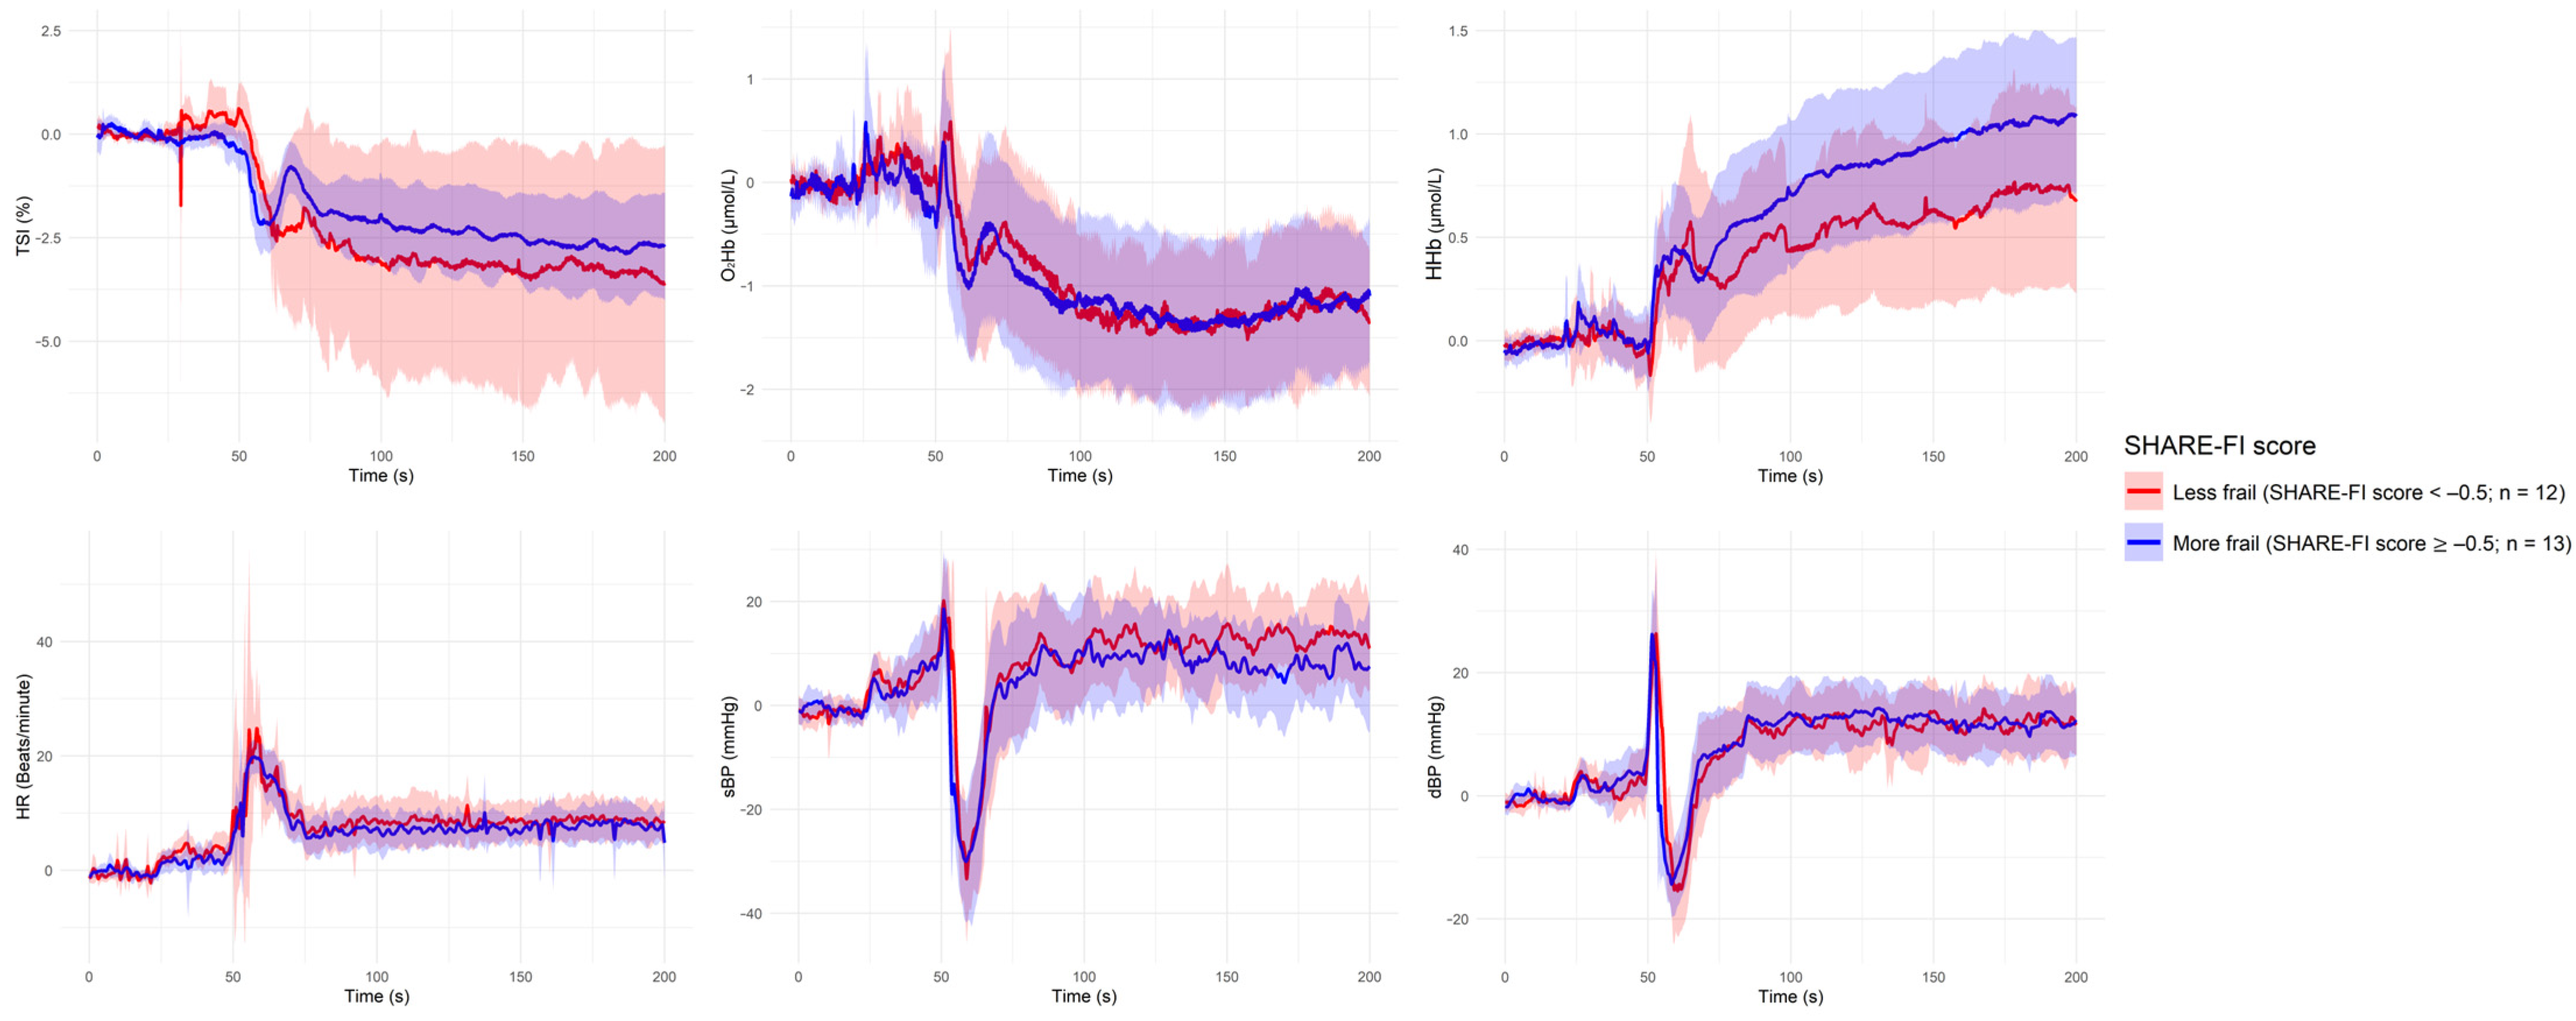
| Grouping Criterion | Signal | Direction of Difference (Group with Lower Value) | Significant Period (s) |
|---|---|---|---|
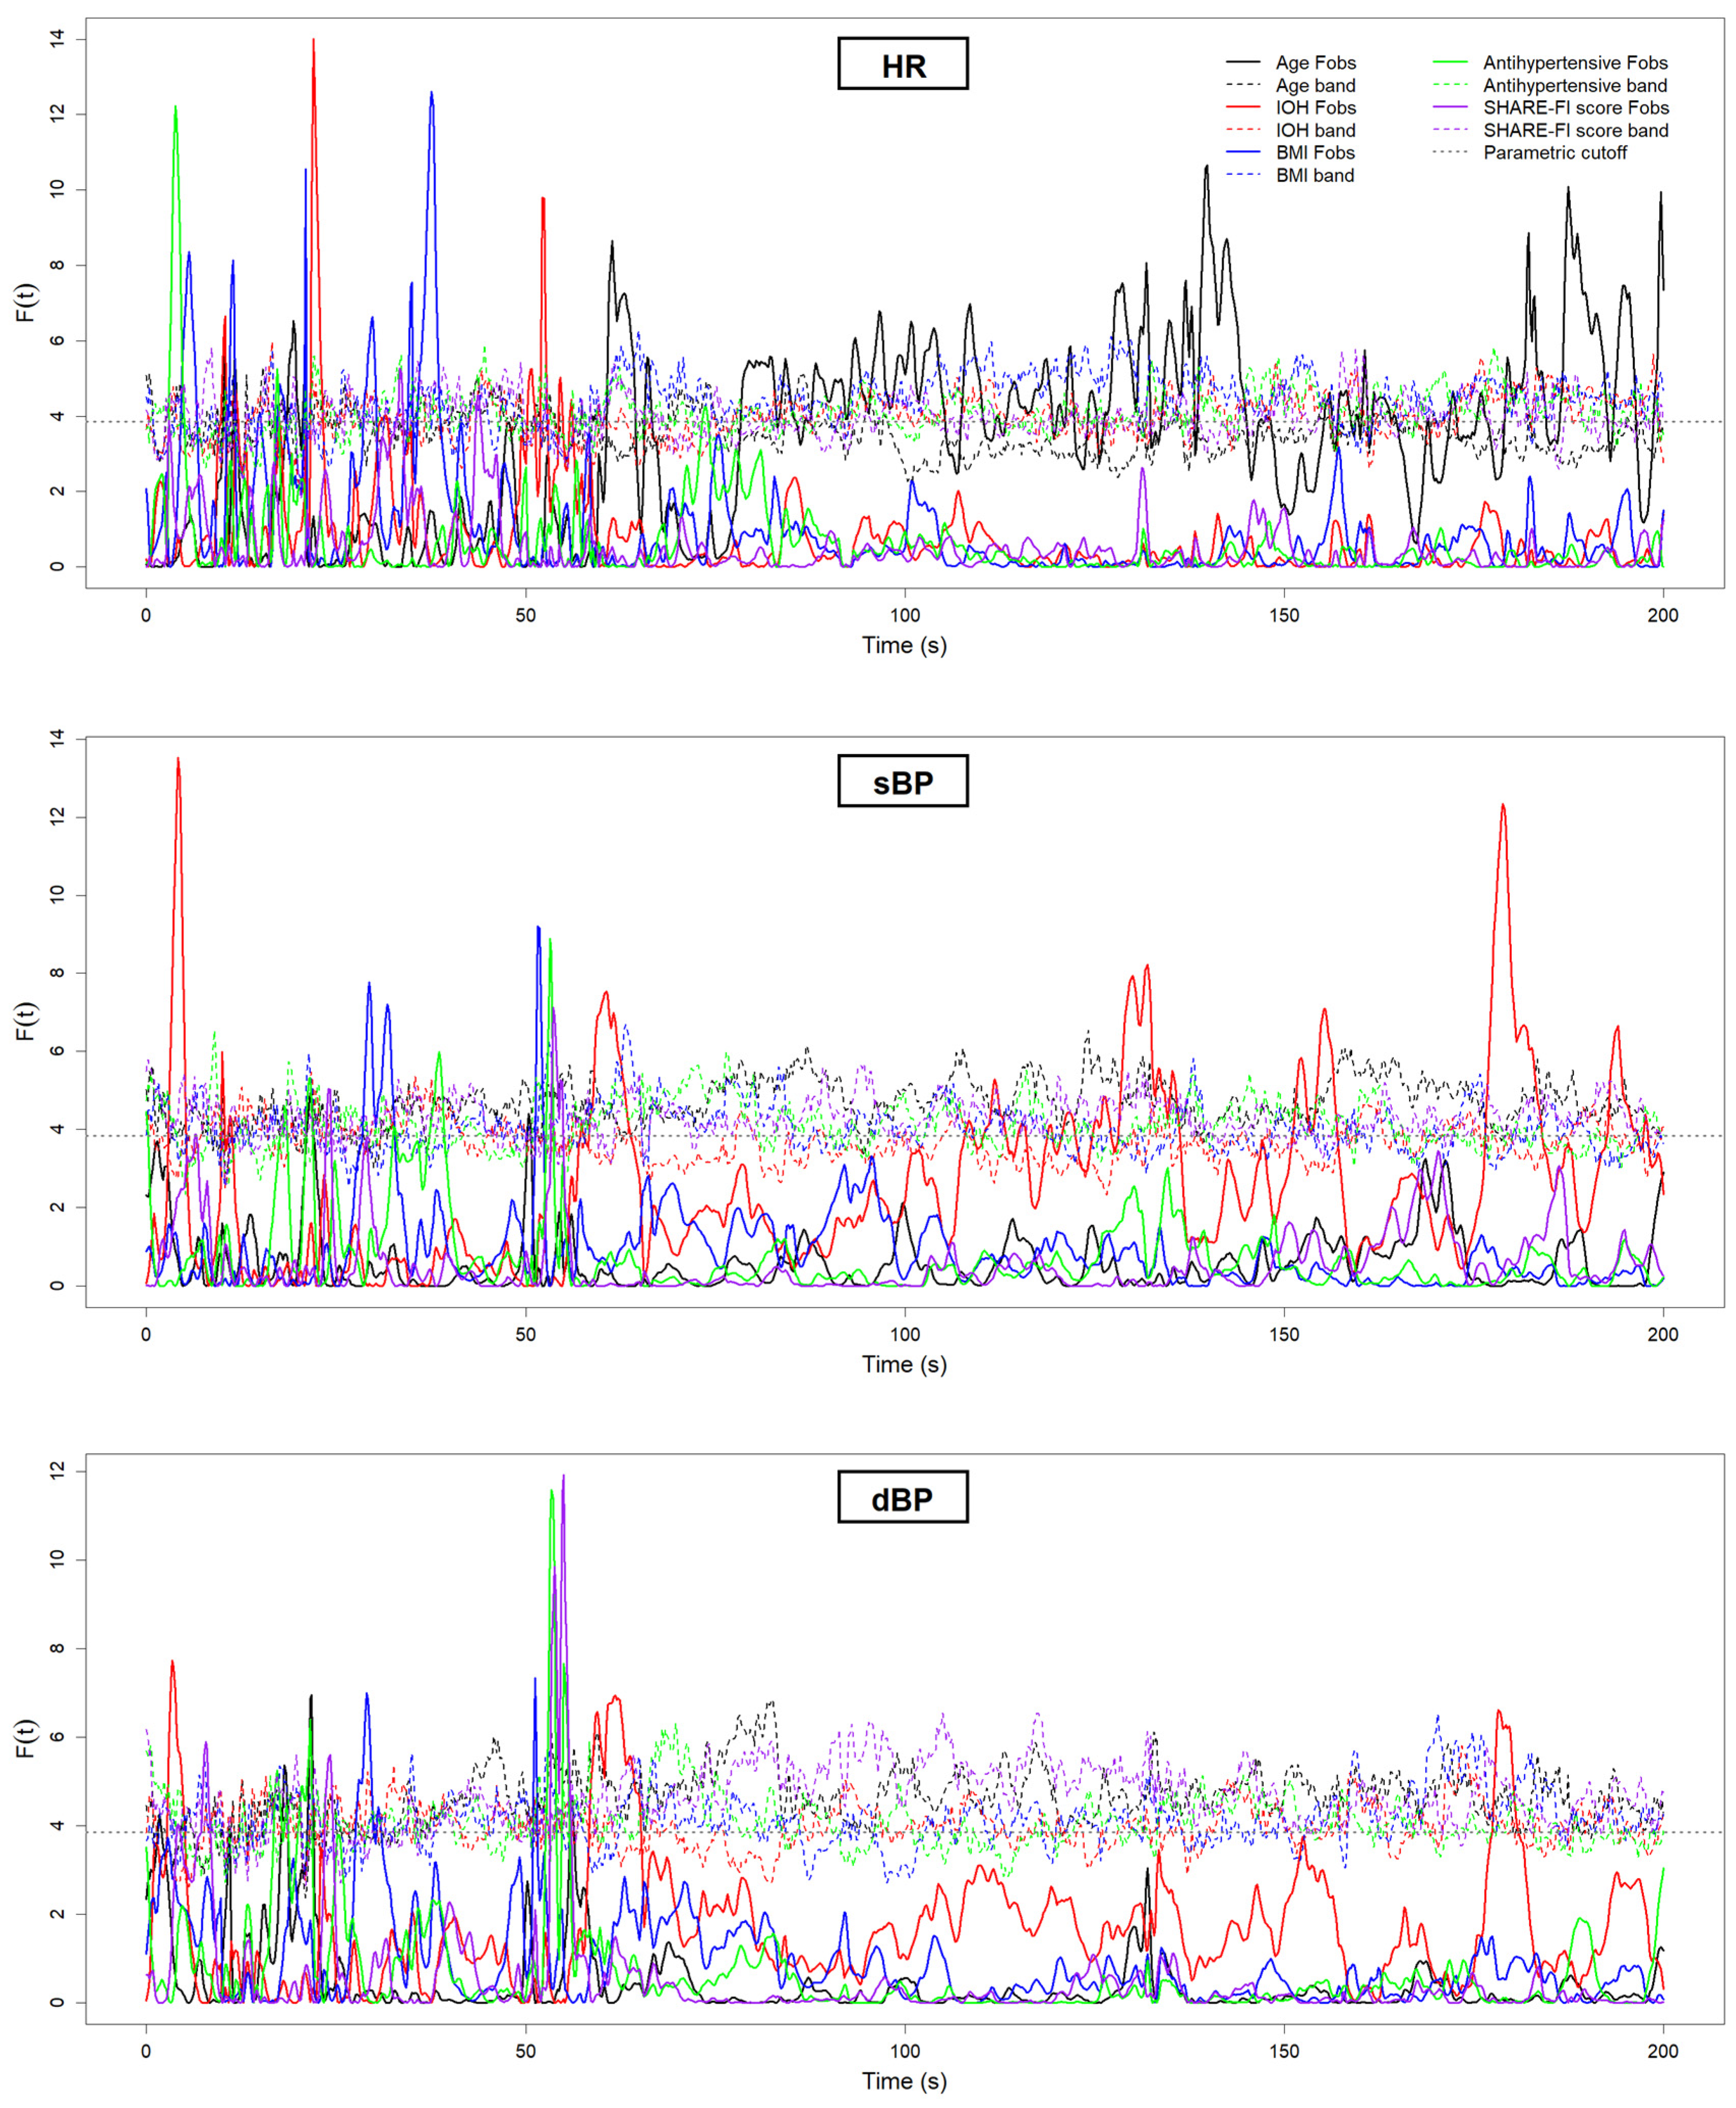
| Younger (<70 years) | HR | Aged (≥70 years) < Younger | ~60 s, ~80 s, ~140 s, ~190 s |
| IOH: Yes | sBP | IOH < Non-IOH | ~60 s, ~130 s, ~180 s |
| IOH: Yes | dBP | IOH < Non-IOH | ~60 s |
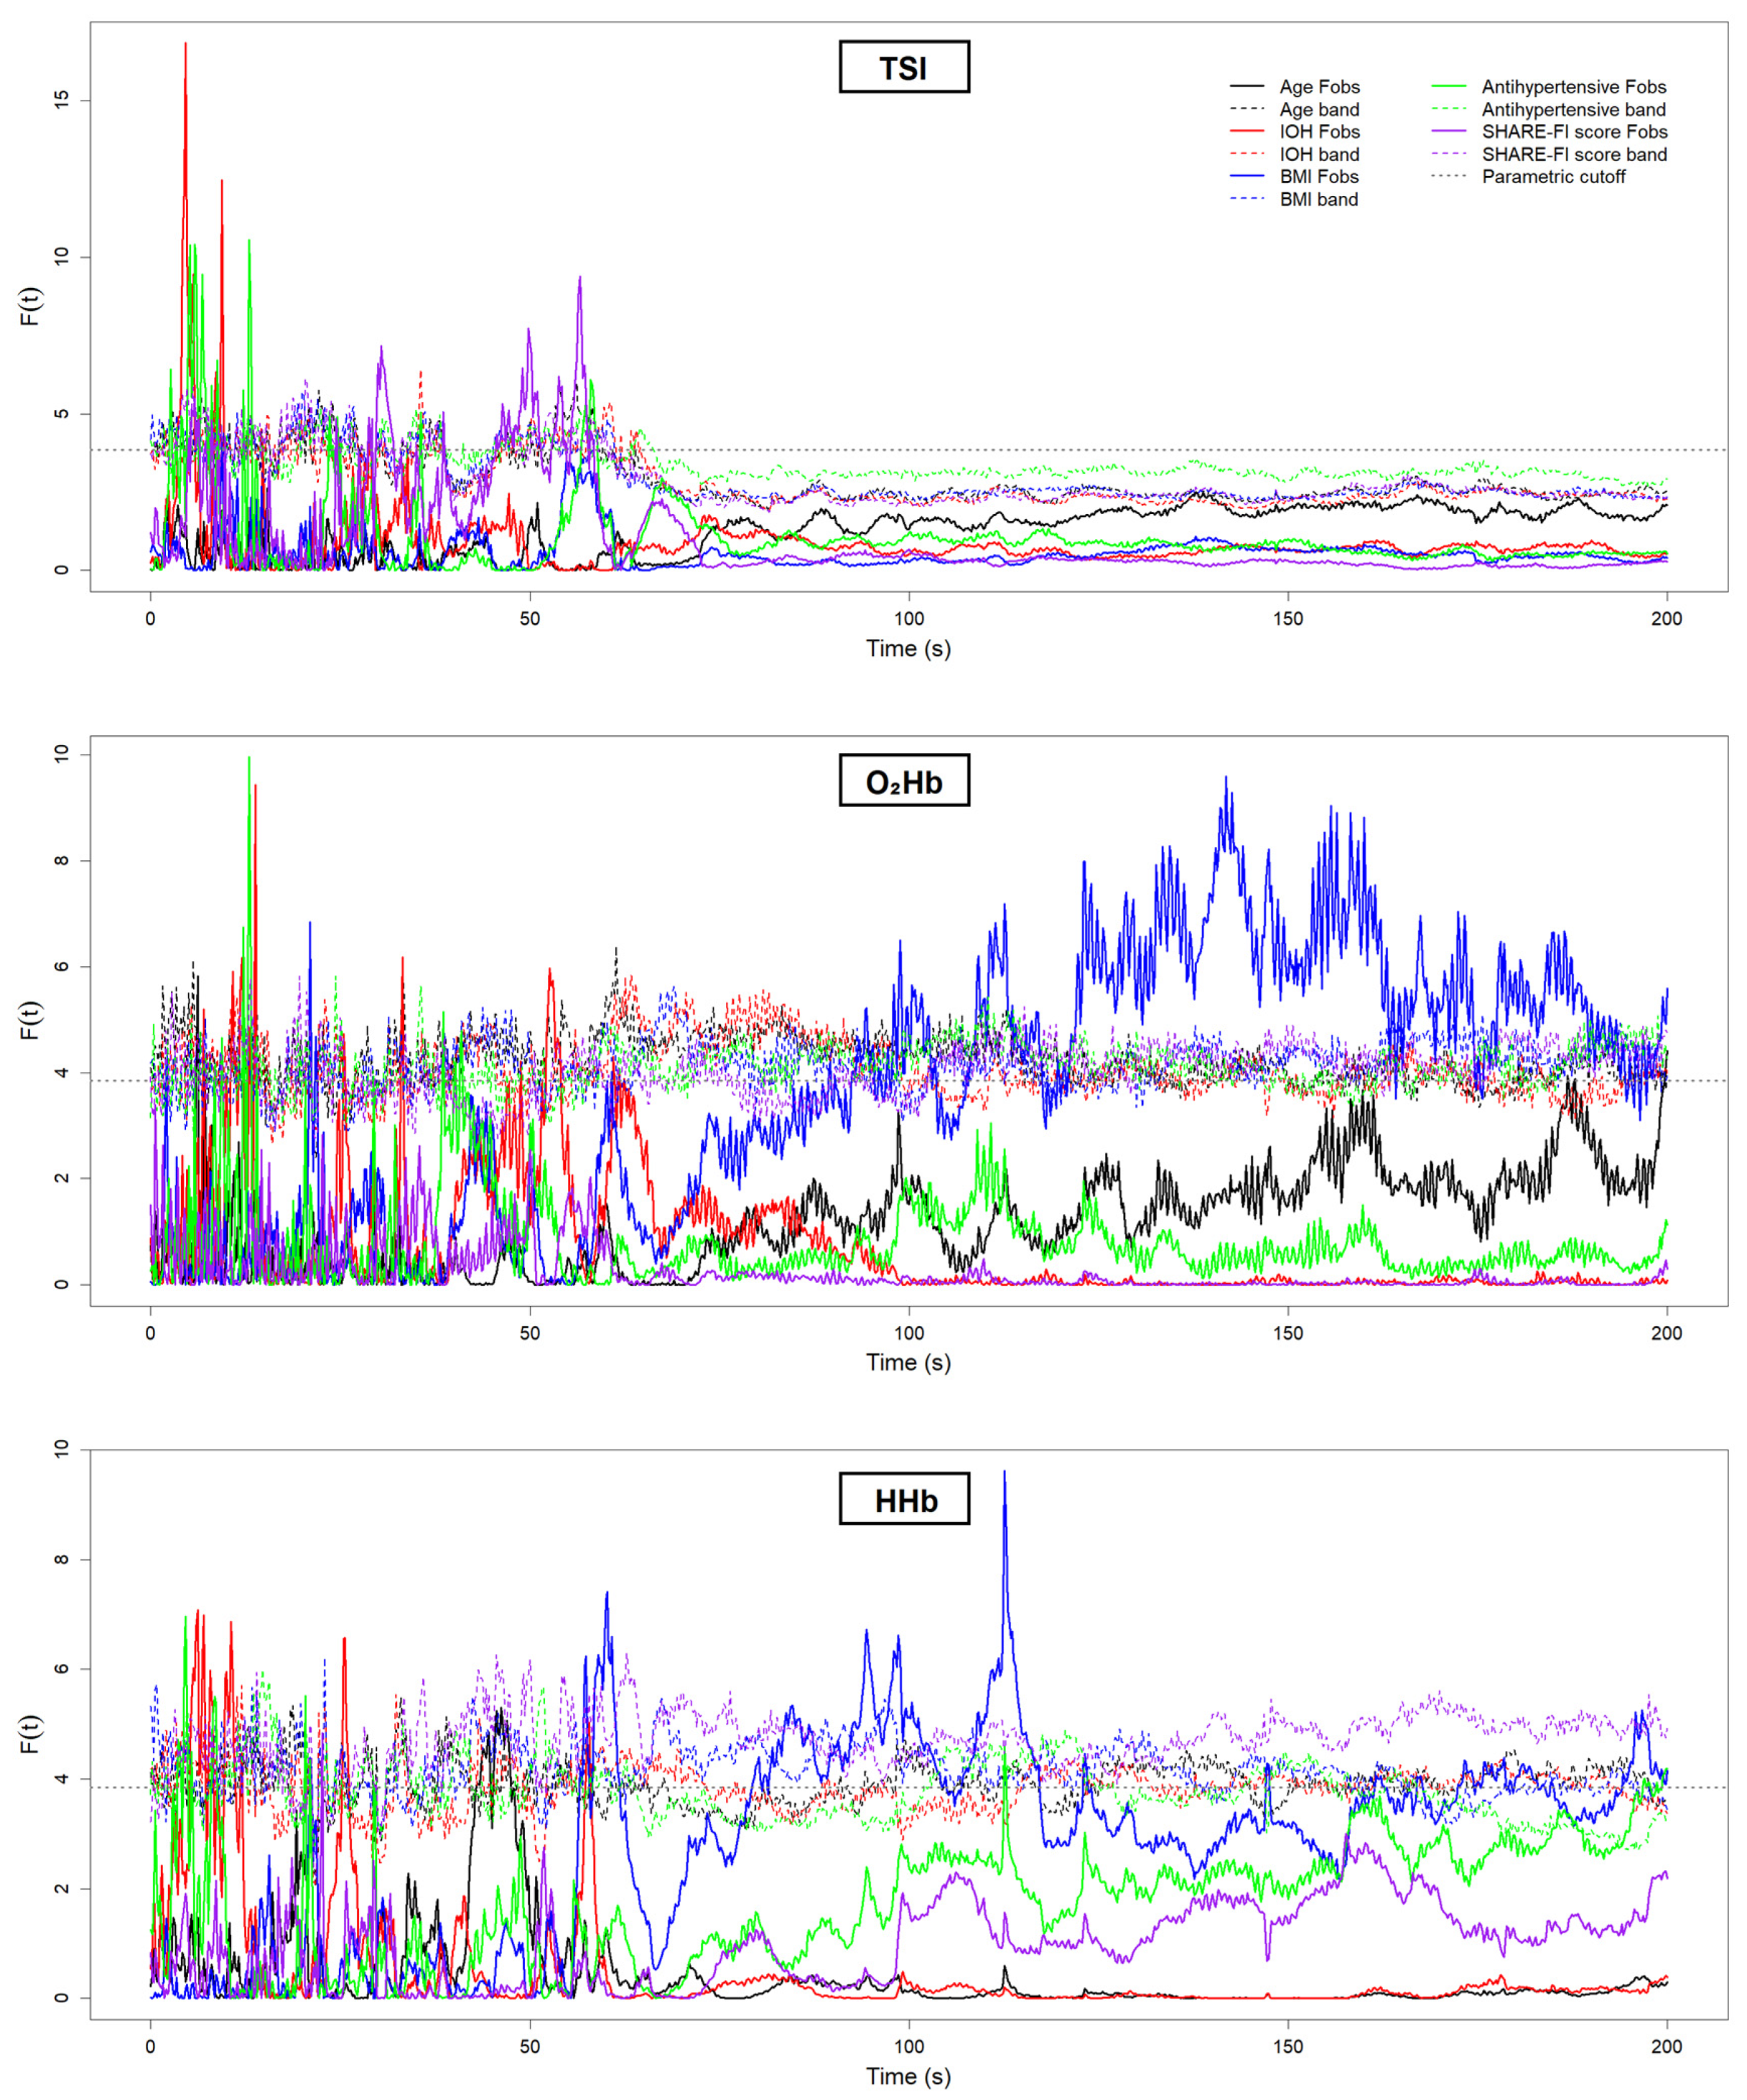
| Overweight (BMI ≥ 25 kg/m2) | HHb | Overweight < Non-overweight | ~60 s, ~90–100 s, ~110 s |
| Overweight (BMI ≥ 25 kg/m2) | O2Hb | Overweight < Non-overweight | ~100 s, ~110 s, ~120–160 s, ~180 s |
| Antihypertensive Use: Yes | None | — | — |
| Frailty (SHARE-FI ≥ −0.5) | None | — | — |
Disclaimer/Publisher’s Note: The statements, opinions and data contained in all publications are solely those of the individual author(s) and contributor(s) and not of MDPI and/or the editor(s). MDPI and/or the editor(s) disclaim responsibility for any injury to people or property resulting from any ideas, methods, instructions or products referred to in the content. |
© 2025 by the authors. Licensee MDPI, Basel, Switzerland. This article is an open access article distributed under the terms and conditions of the Creative Commons Attribution (CC BY) license (https://creativecommons.org/licenses/by/4.0/).
Share and Cite
Xue, F.; Romero-Ortuno, R. Characterizing Neurocardiovascular Responses to an Active Stand Test in Older Women: A Pilot Study Using Functional Data Analysis. Sensors 2025, 25, 3616. https://doi.org/10.3390/s25123616
Xue F, Romero-Ortuno R. Characterizing Neurocardiovascular Responses to an Active Stand Test in Older Women: A Pilot Study Using Functional Data Analysis. Sensors. 2025; 25(12):3616. https://doi.org/10.3390/s25123616
Chicago/Turabian StyleXue, Feng, and Roman Romero-Ortuno. 2025. "Characterizing Neurocardiovascular Responses to an Active Stand Test in Older Women: A Pilot Study Using Functional Data Analysis" Sensors 25, no. 12: 3616. https://doi.org/10.3390/s25123616
APA StyleXue, F., & Romero-Ortuno, R. (2025). Characterizing Neurocardiovascular Responses to an Active Stand Test in Older Women: A Pilot Study Using Functional Data Analysis. Sensors, 25(12), 3616. https://doi.org/10.3390/s25123616