
Development of a Bicycle Road Surface Roughness and Risk Assessment Method Using Smartphone Sensor Technology


Abstract
1. Introduction
2. Materials and Methods
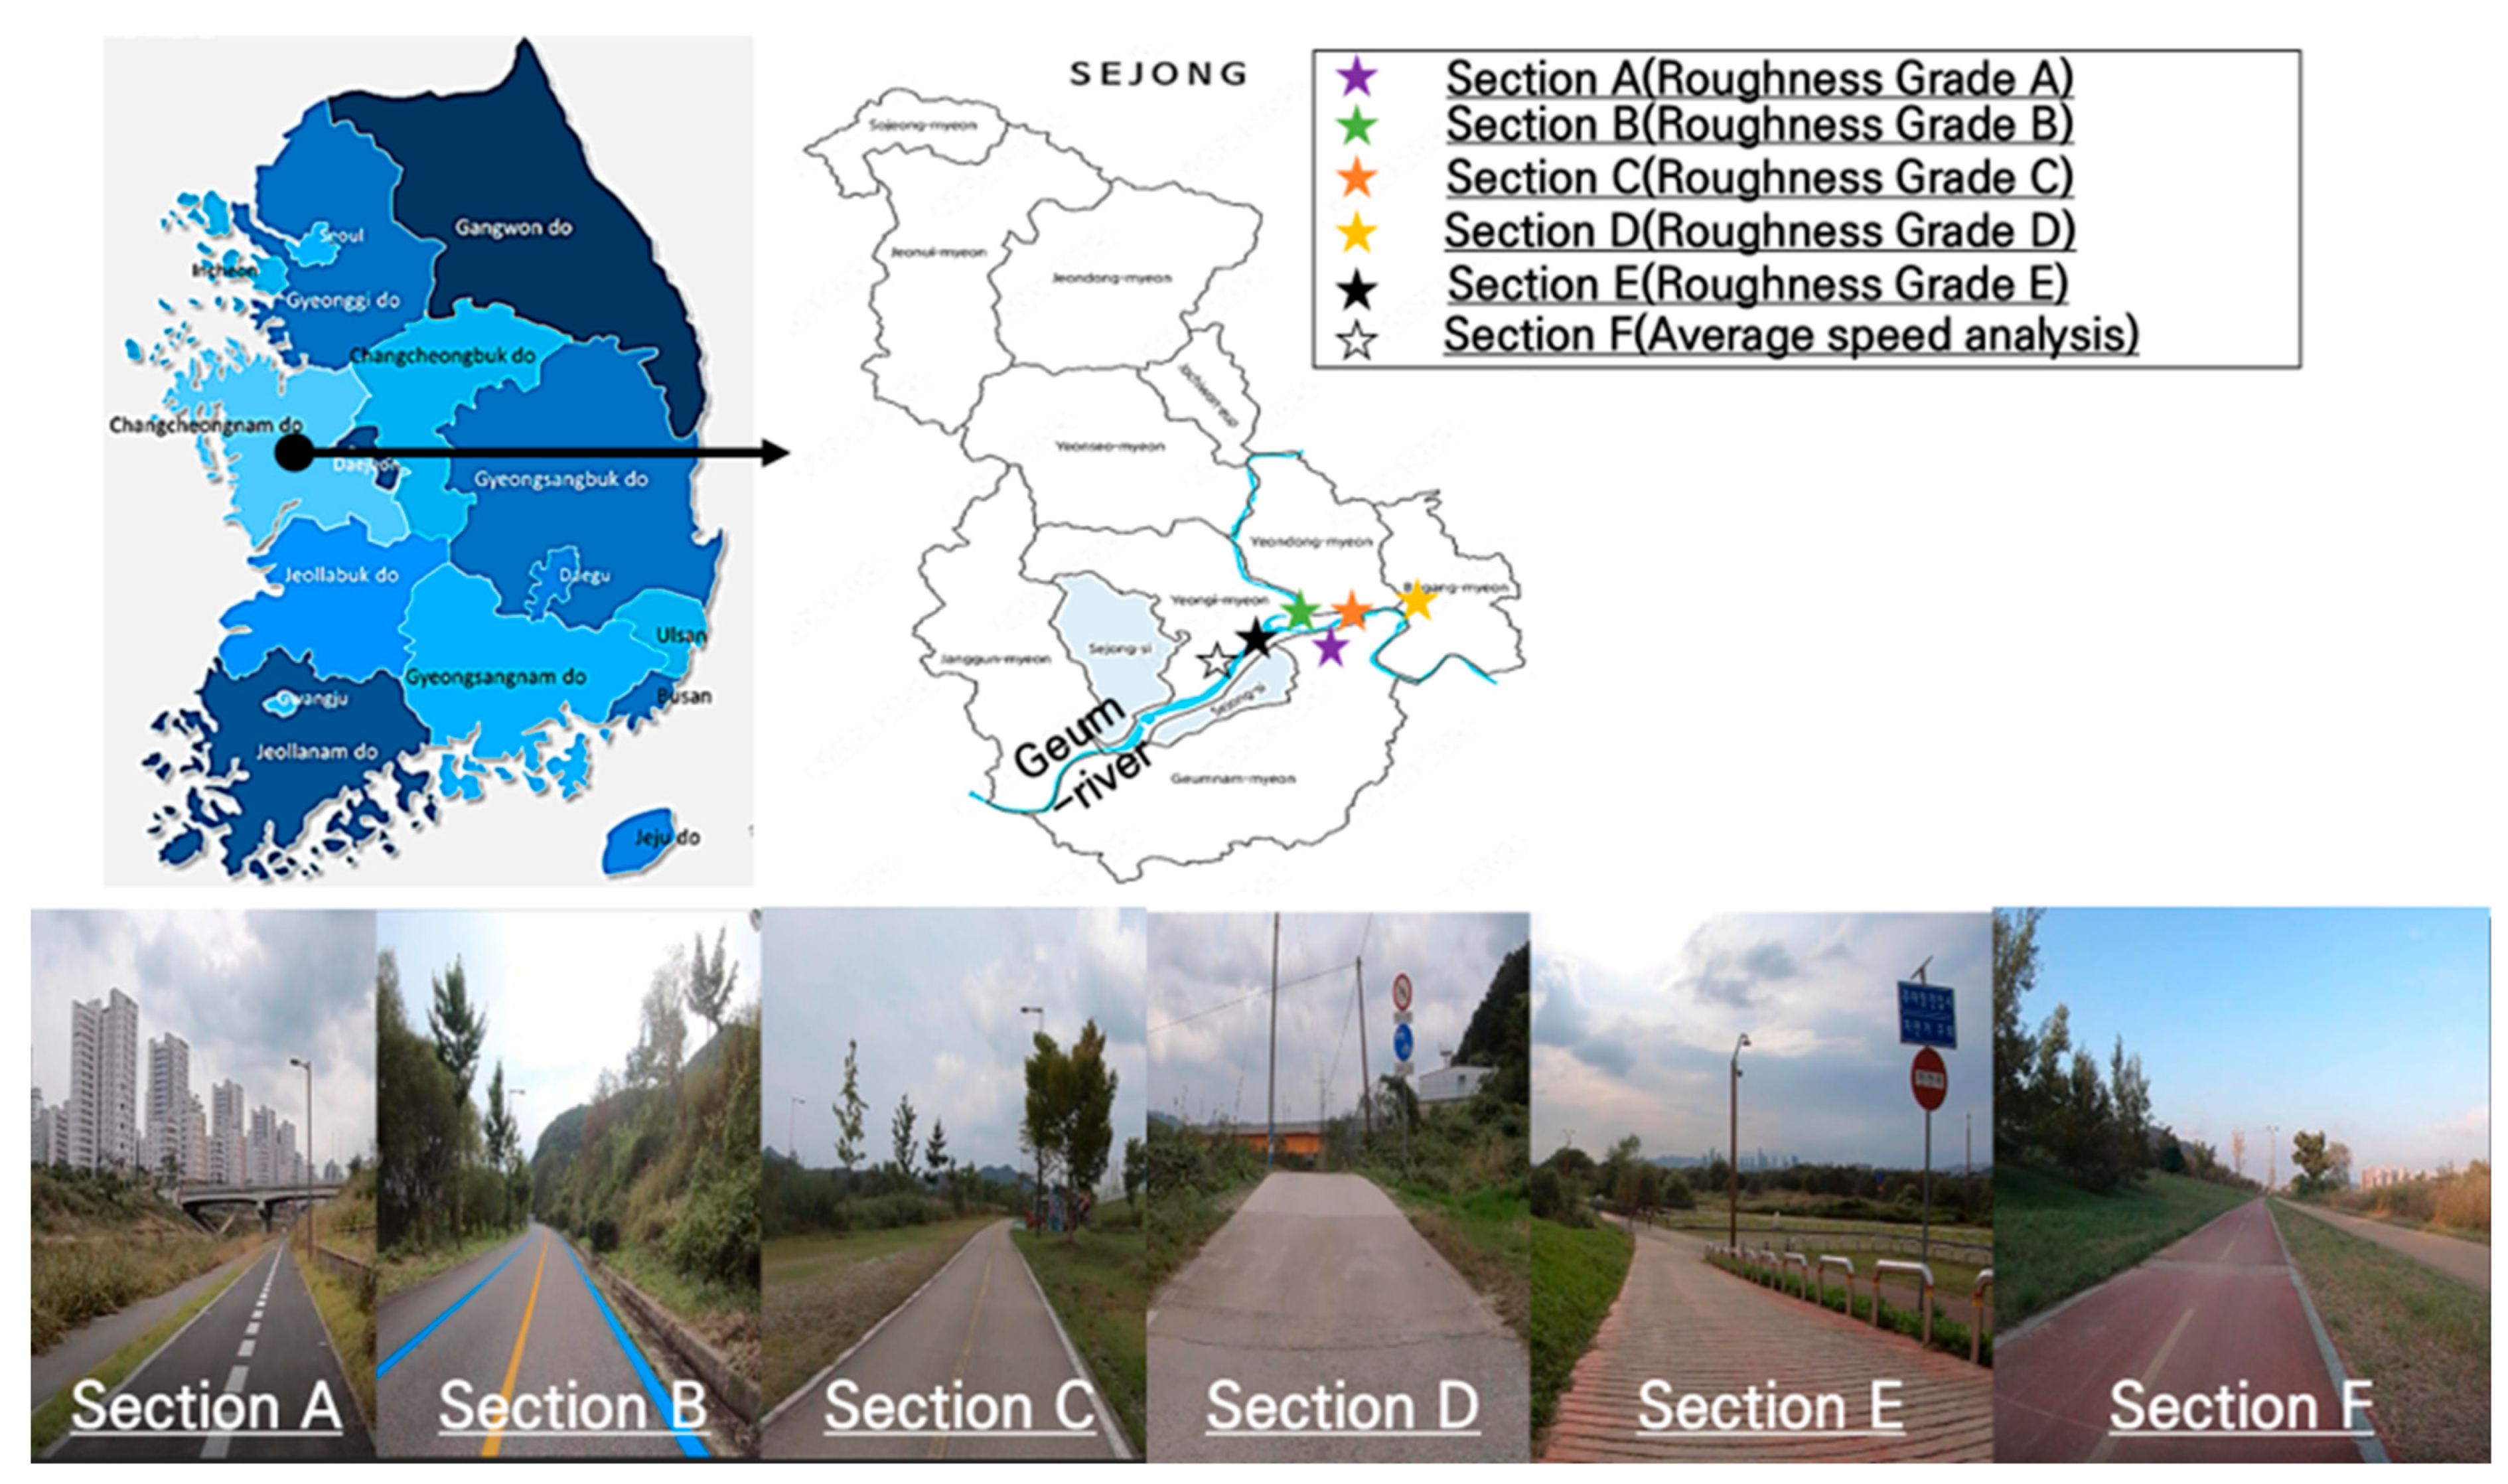
2.1. Study Area
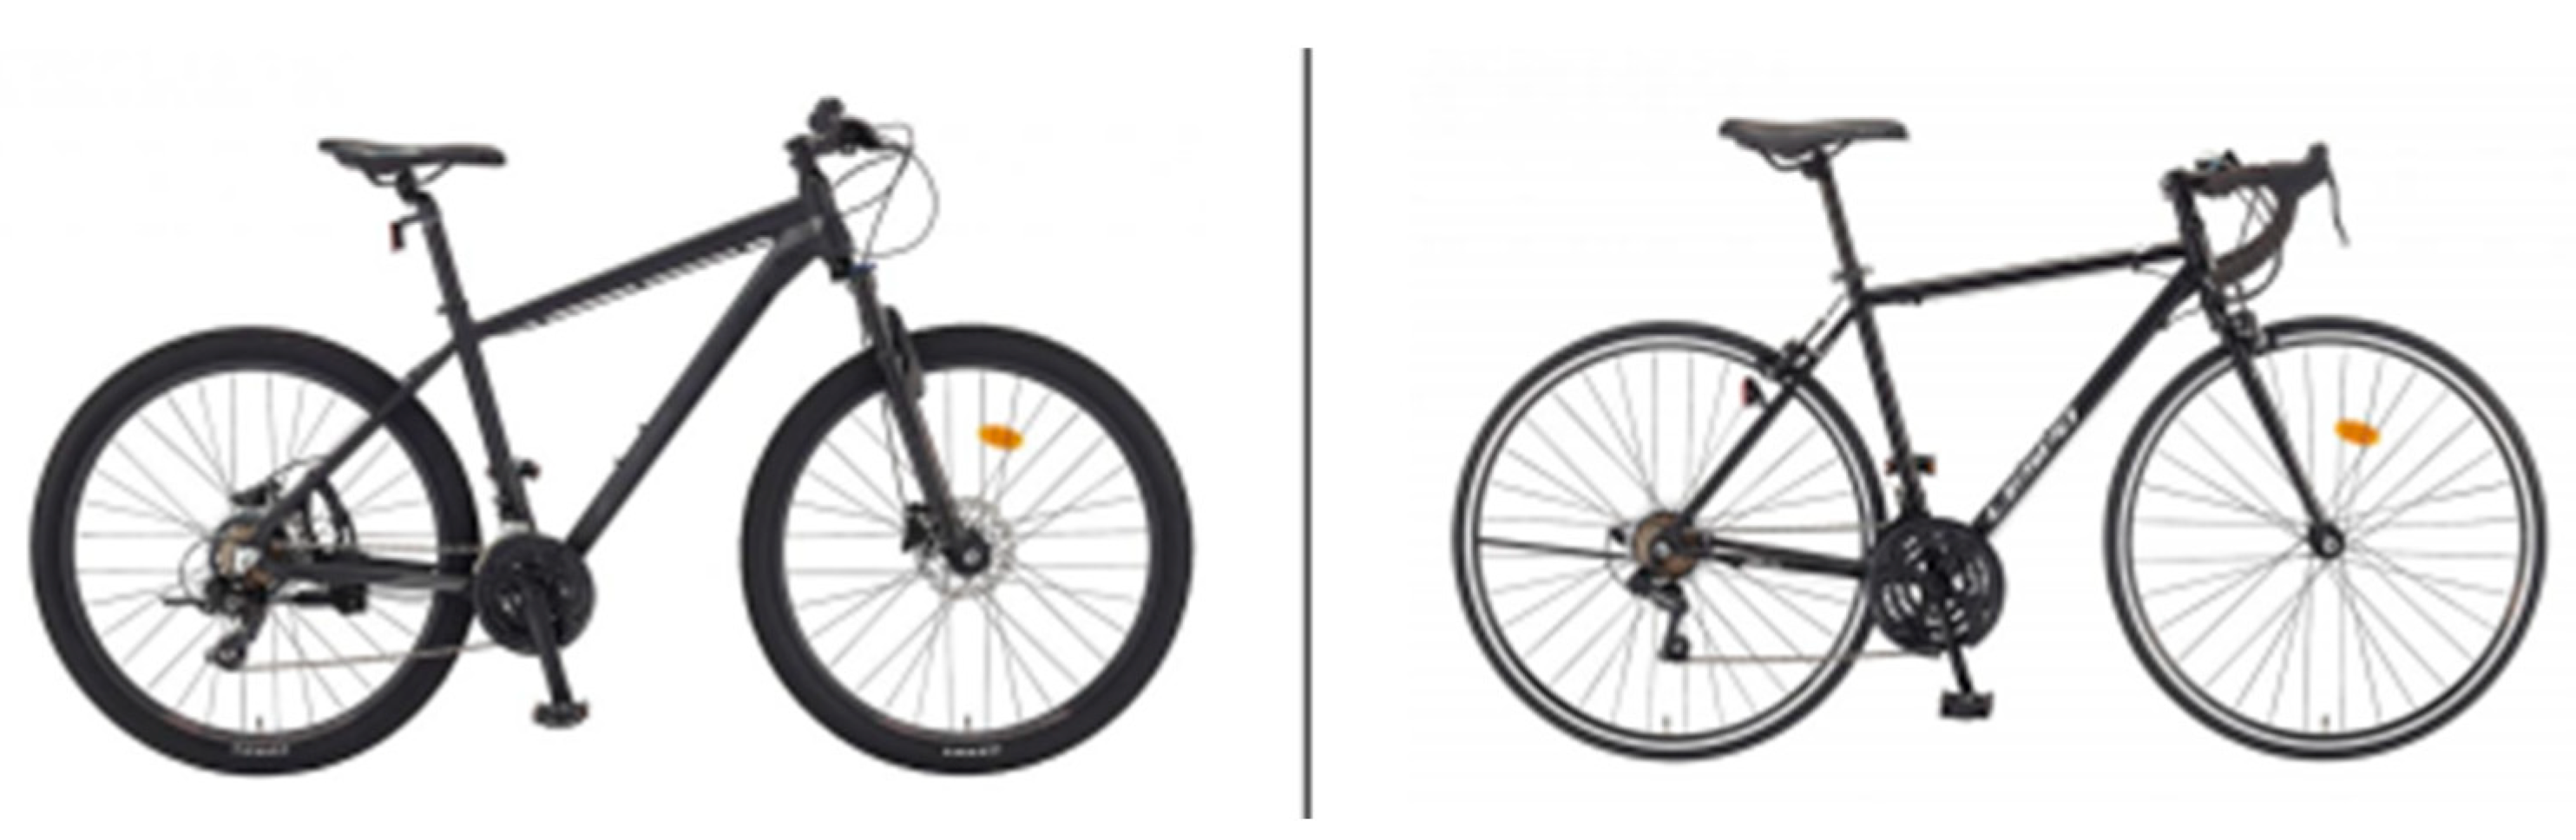
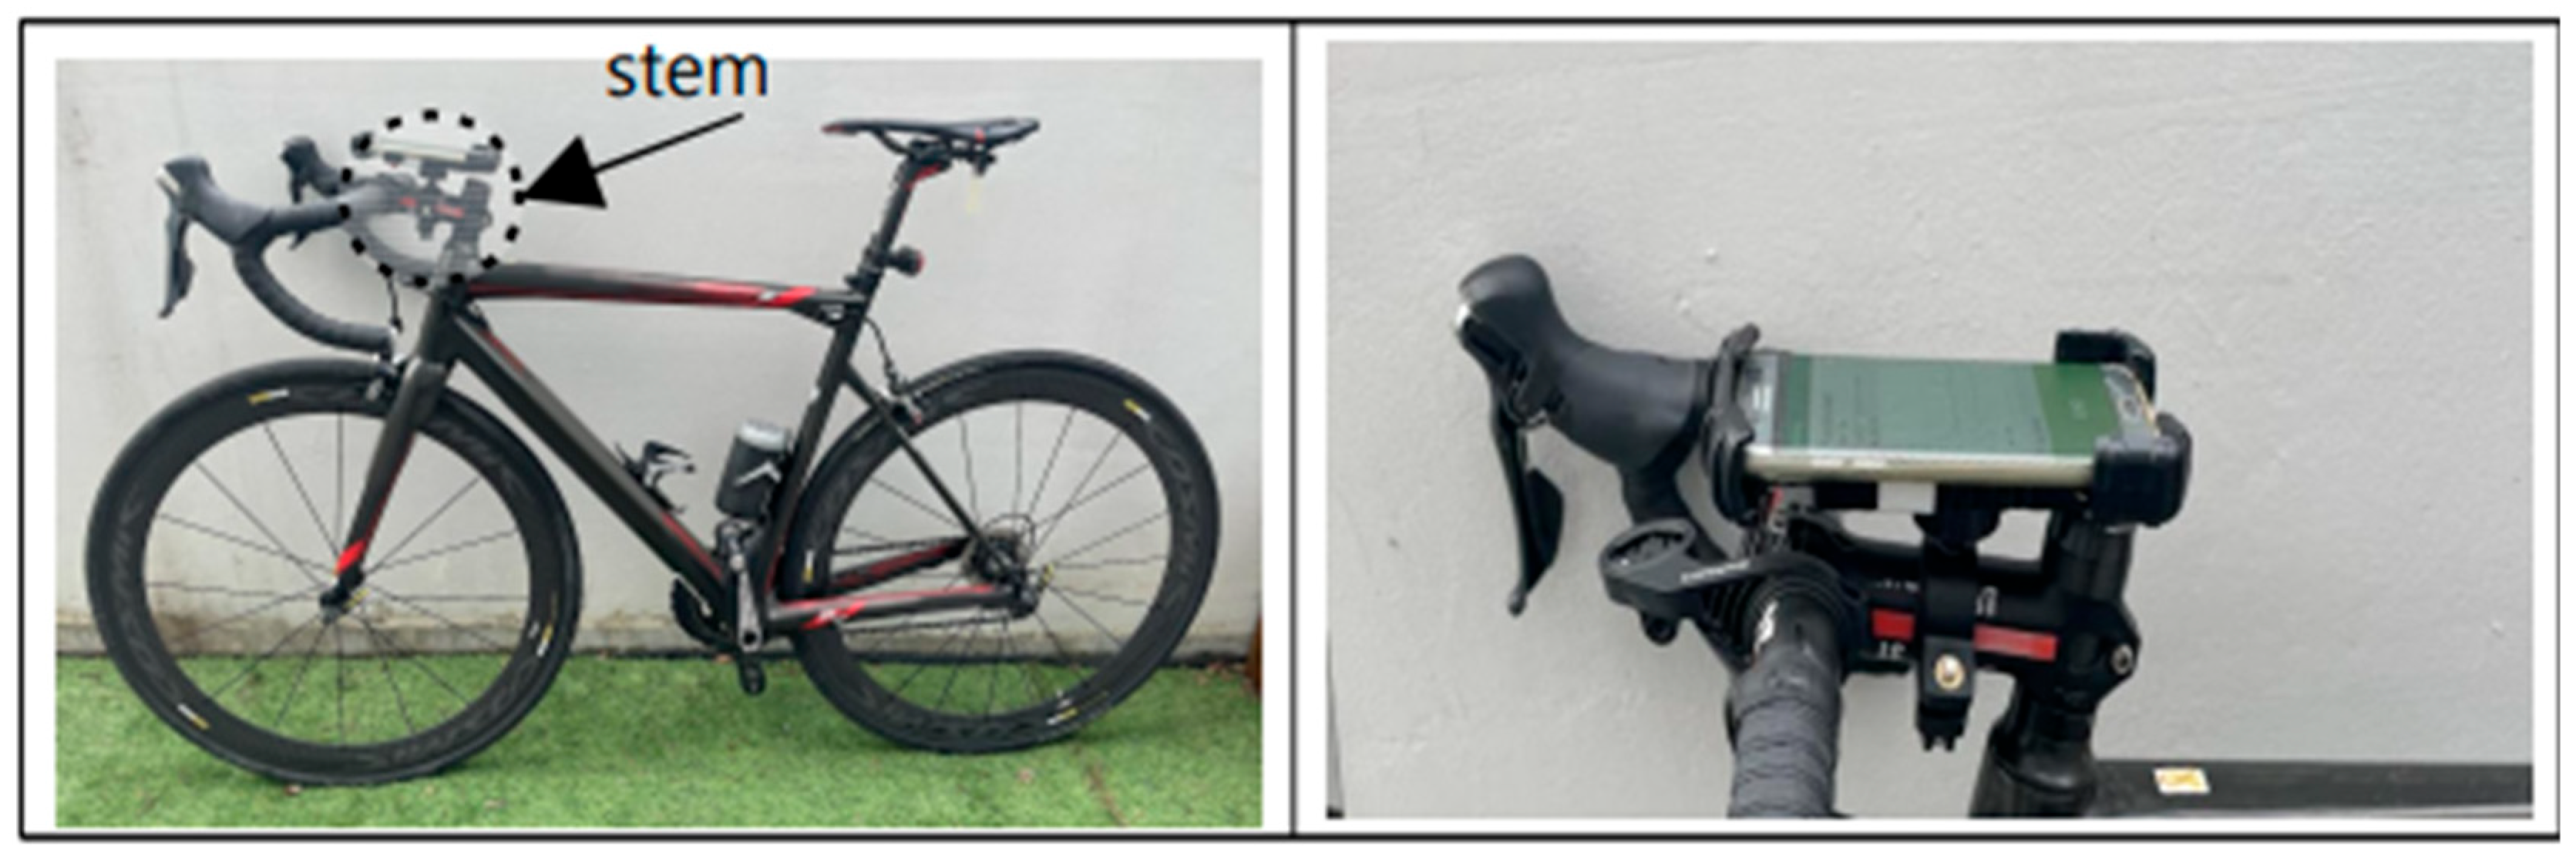
2.2. Measurement Equipment and Speed Determination for Roughness Evaluation
2.3. BRI Calculation
- T
- L
- V
2.4. Acceleration Sensor Measurements for Risk Point Determination
- That. L > 2r)
- e
- s
- L = pothole diameter
- downward step differences)
- )
- 3-axis linear acceleration change of the pothole (m/s²)
2.5. Risk Assessment Survey Method Using Step Difference Experiment
- s
- i
- i
- i
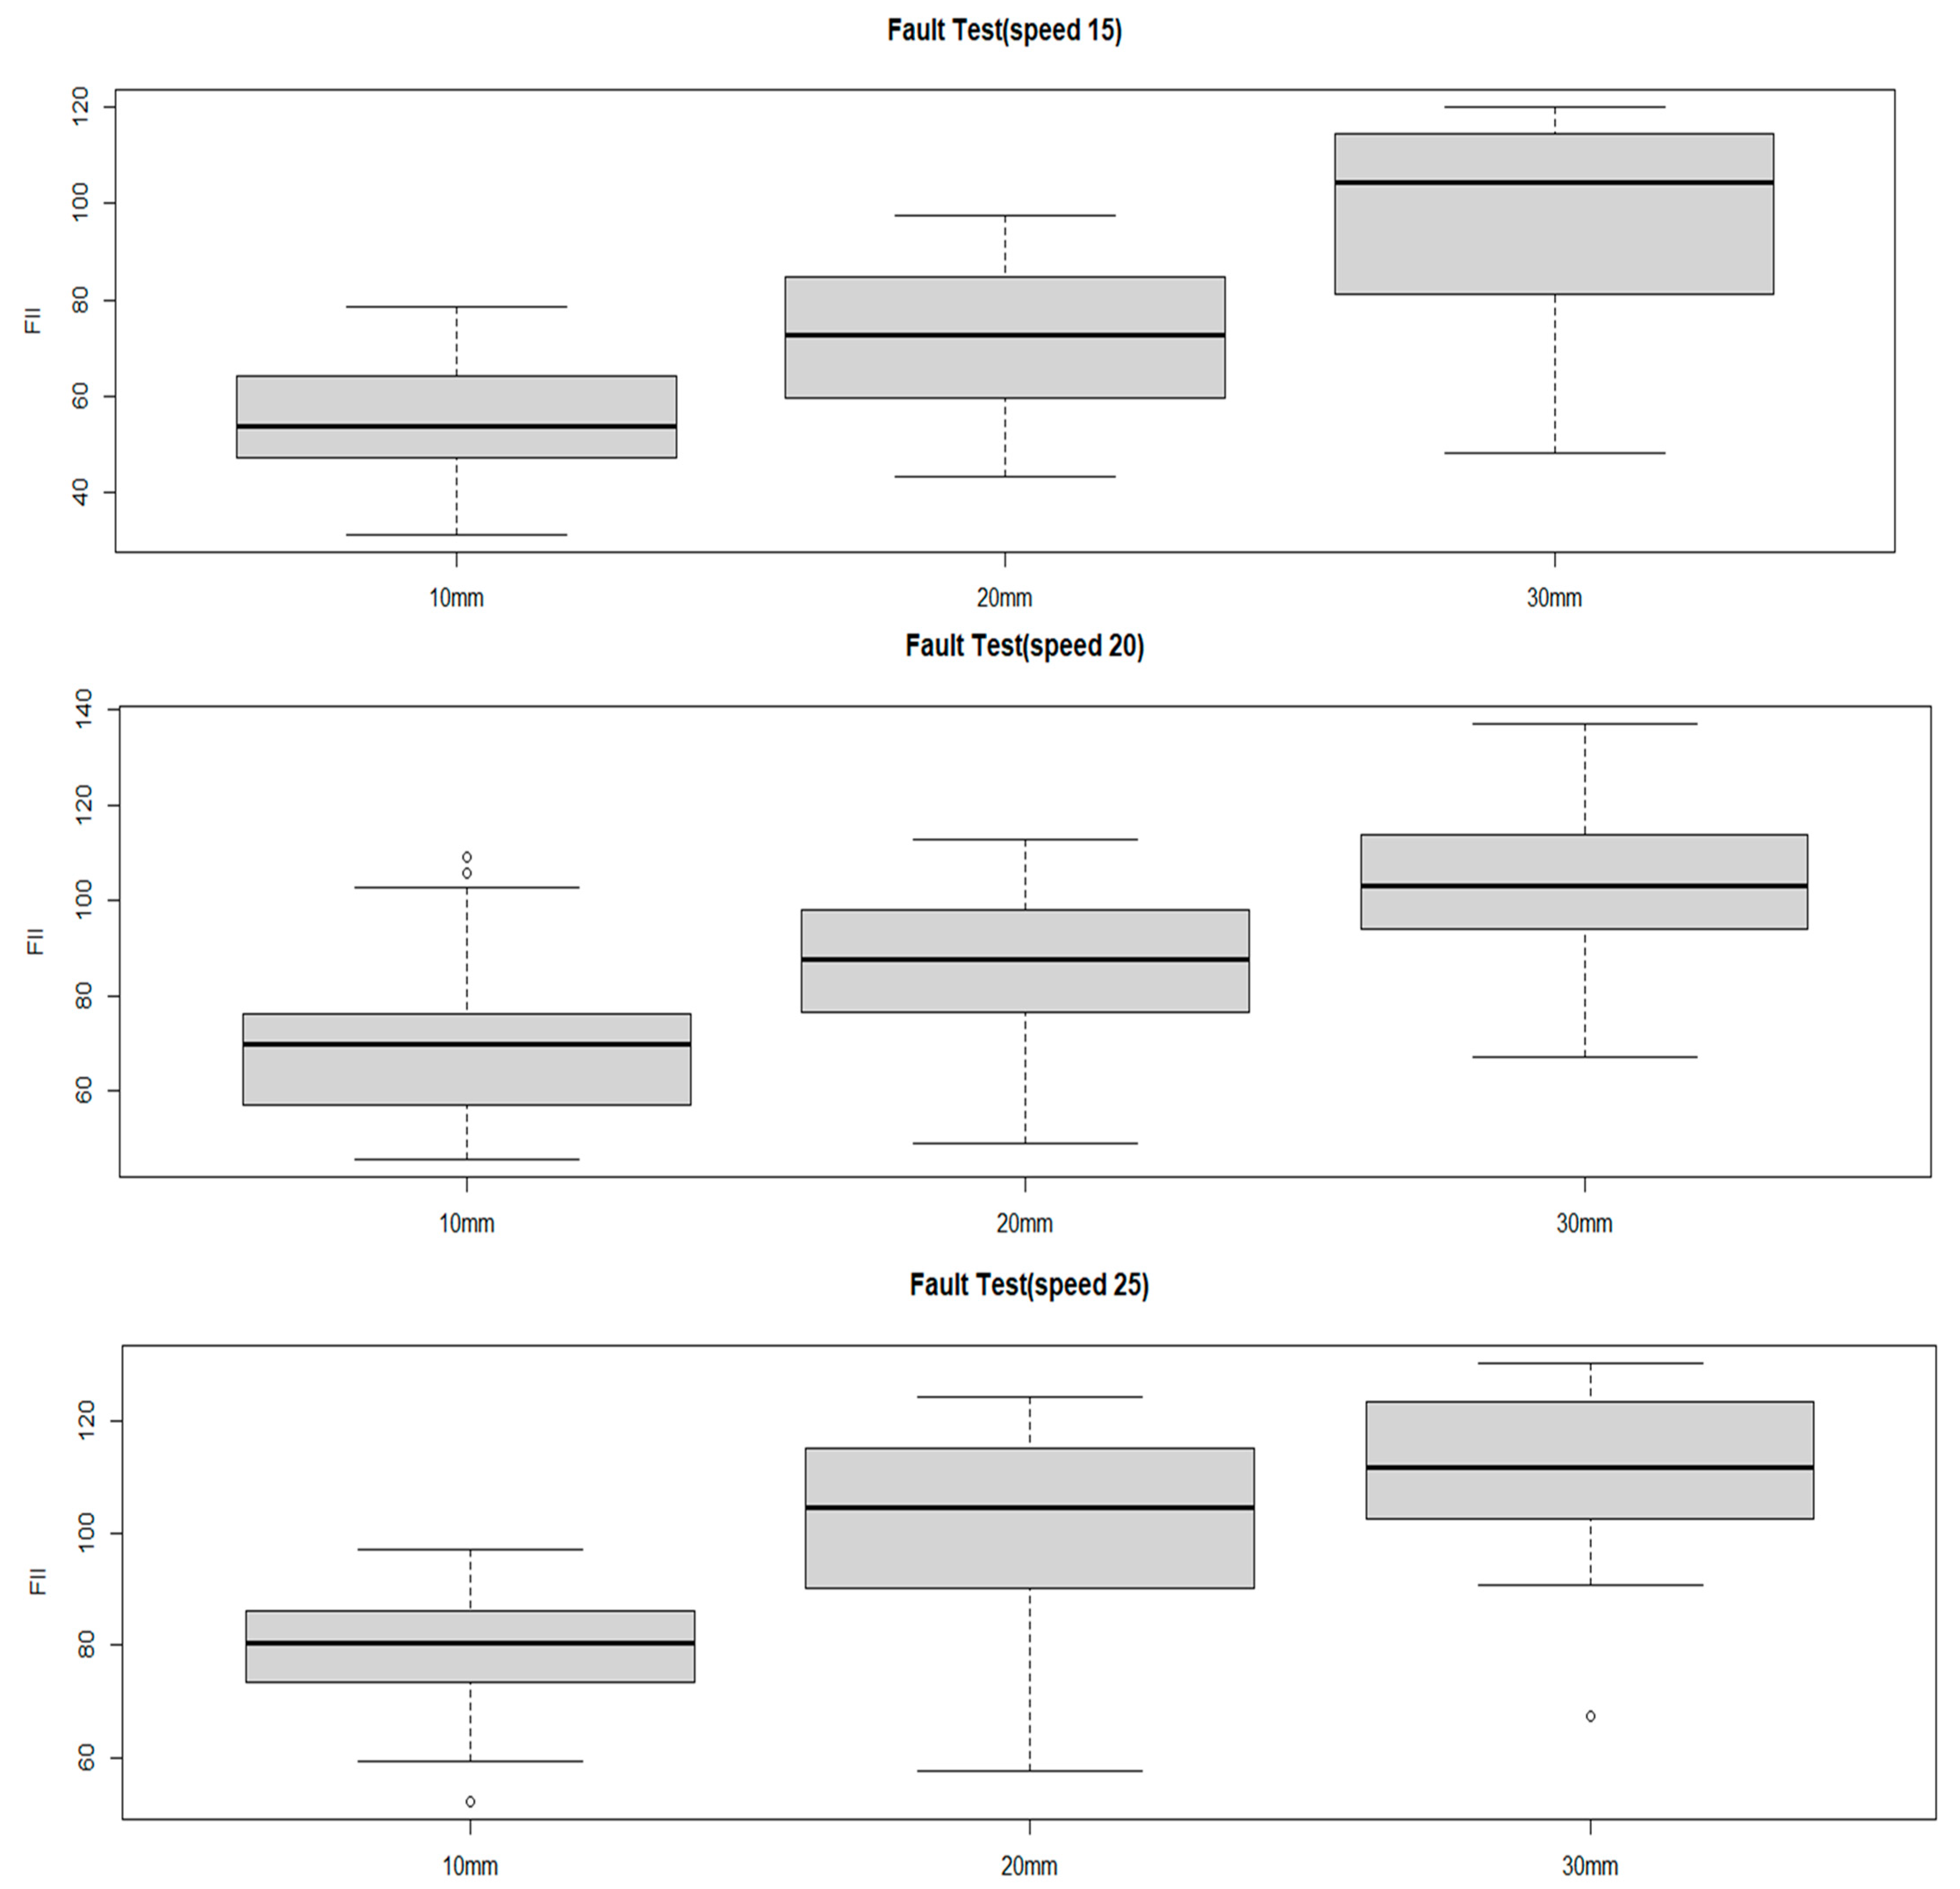
2.6. Experiment on Faulting FII Based on Step Size and Speed Variations
3. Results
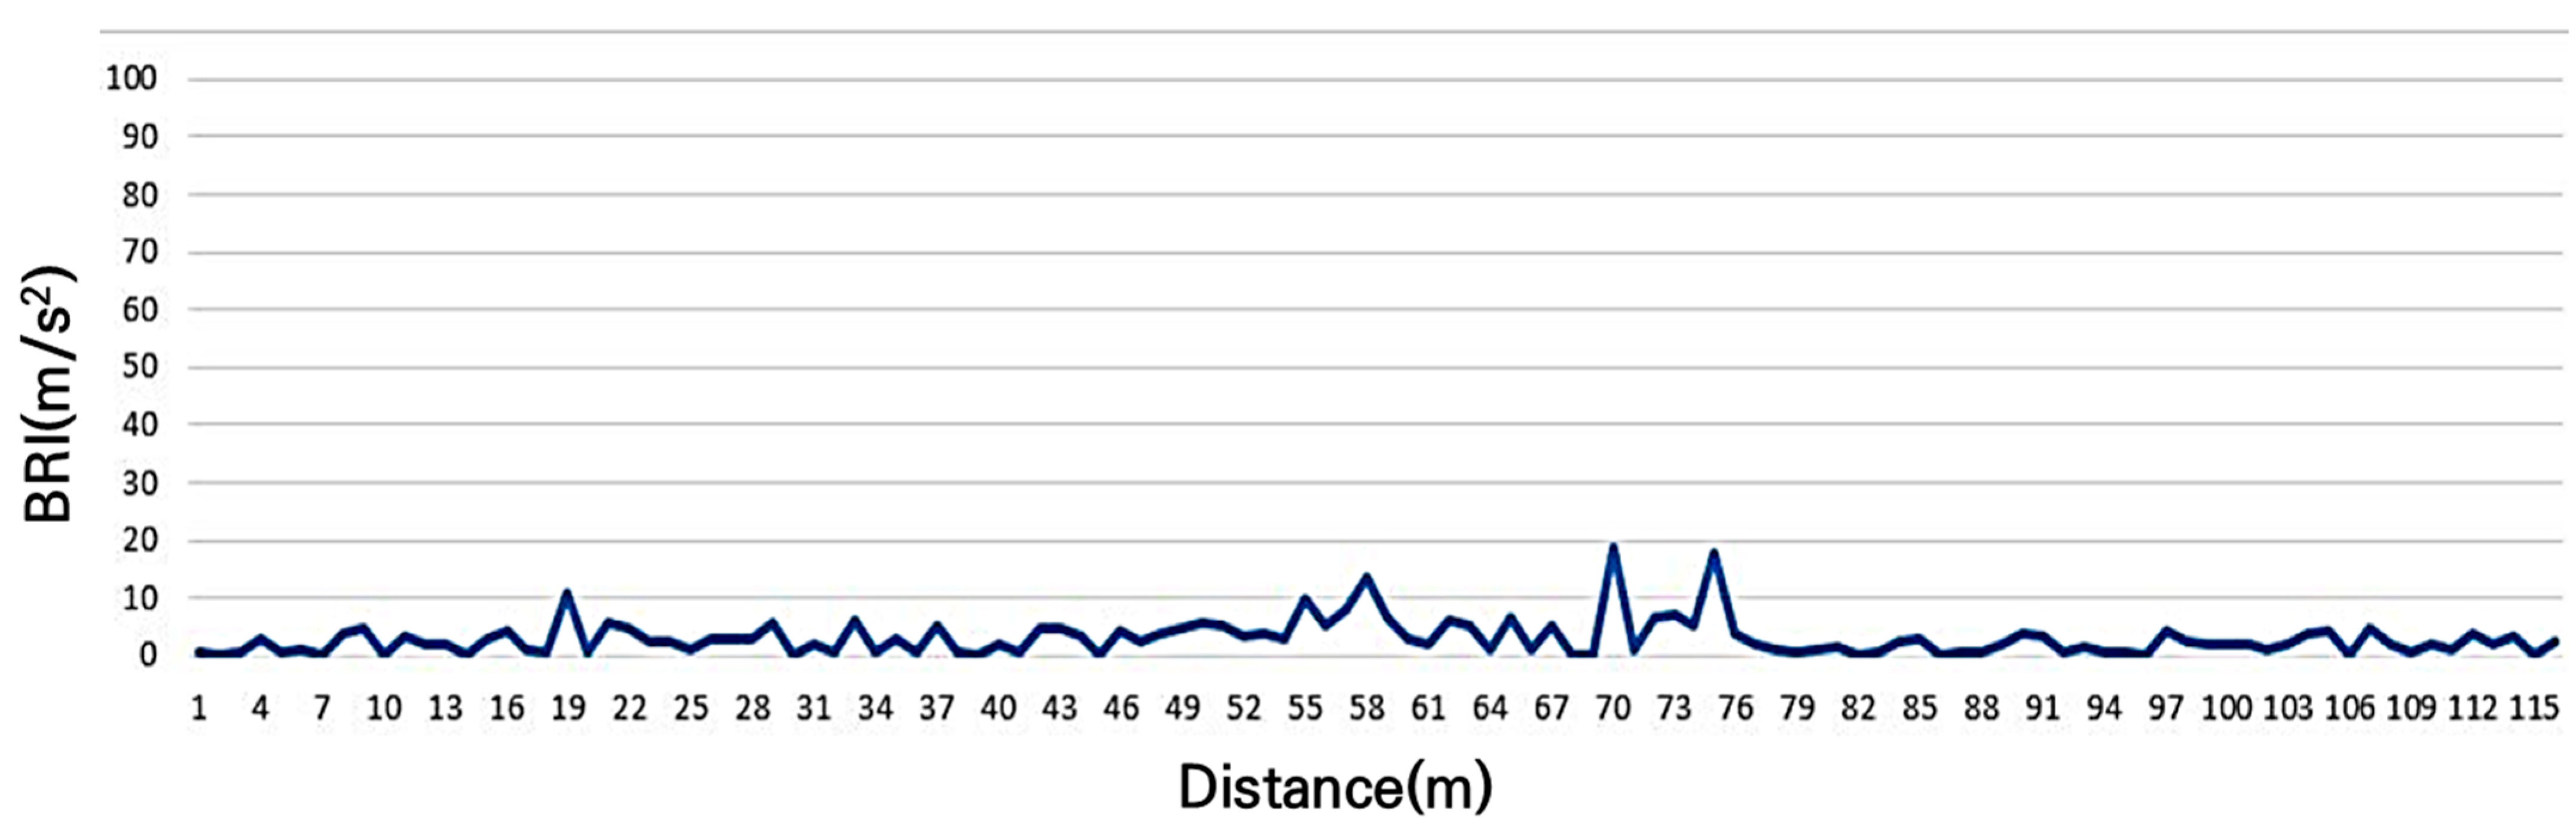
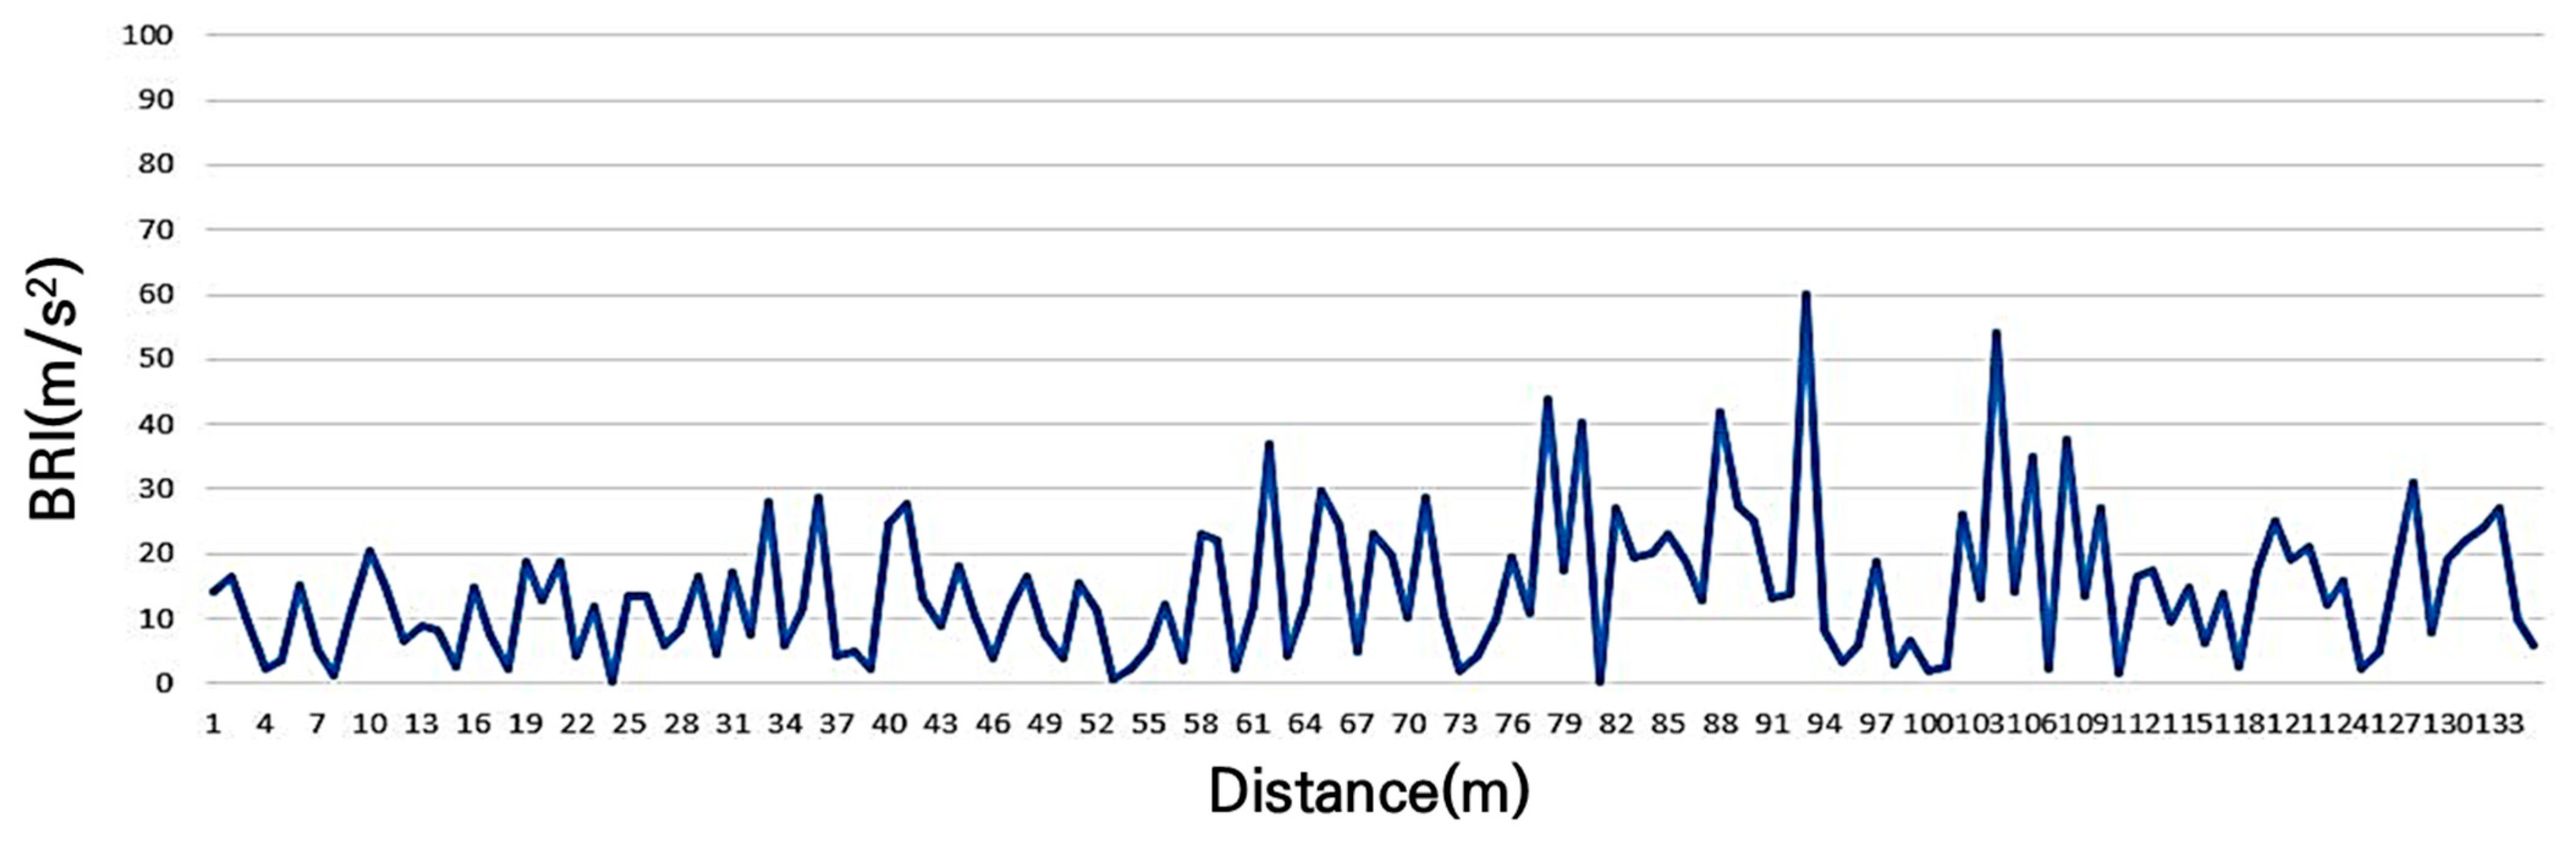
3.1. Results of BRI with the Different Bicycle Road Roughness Grade
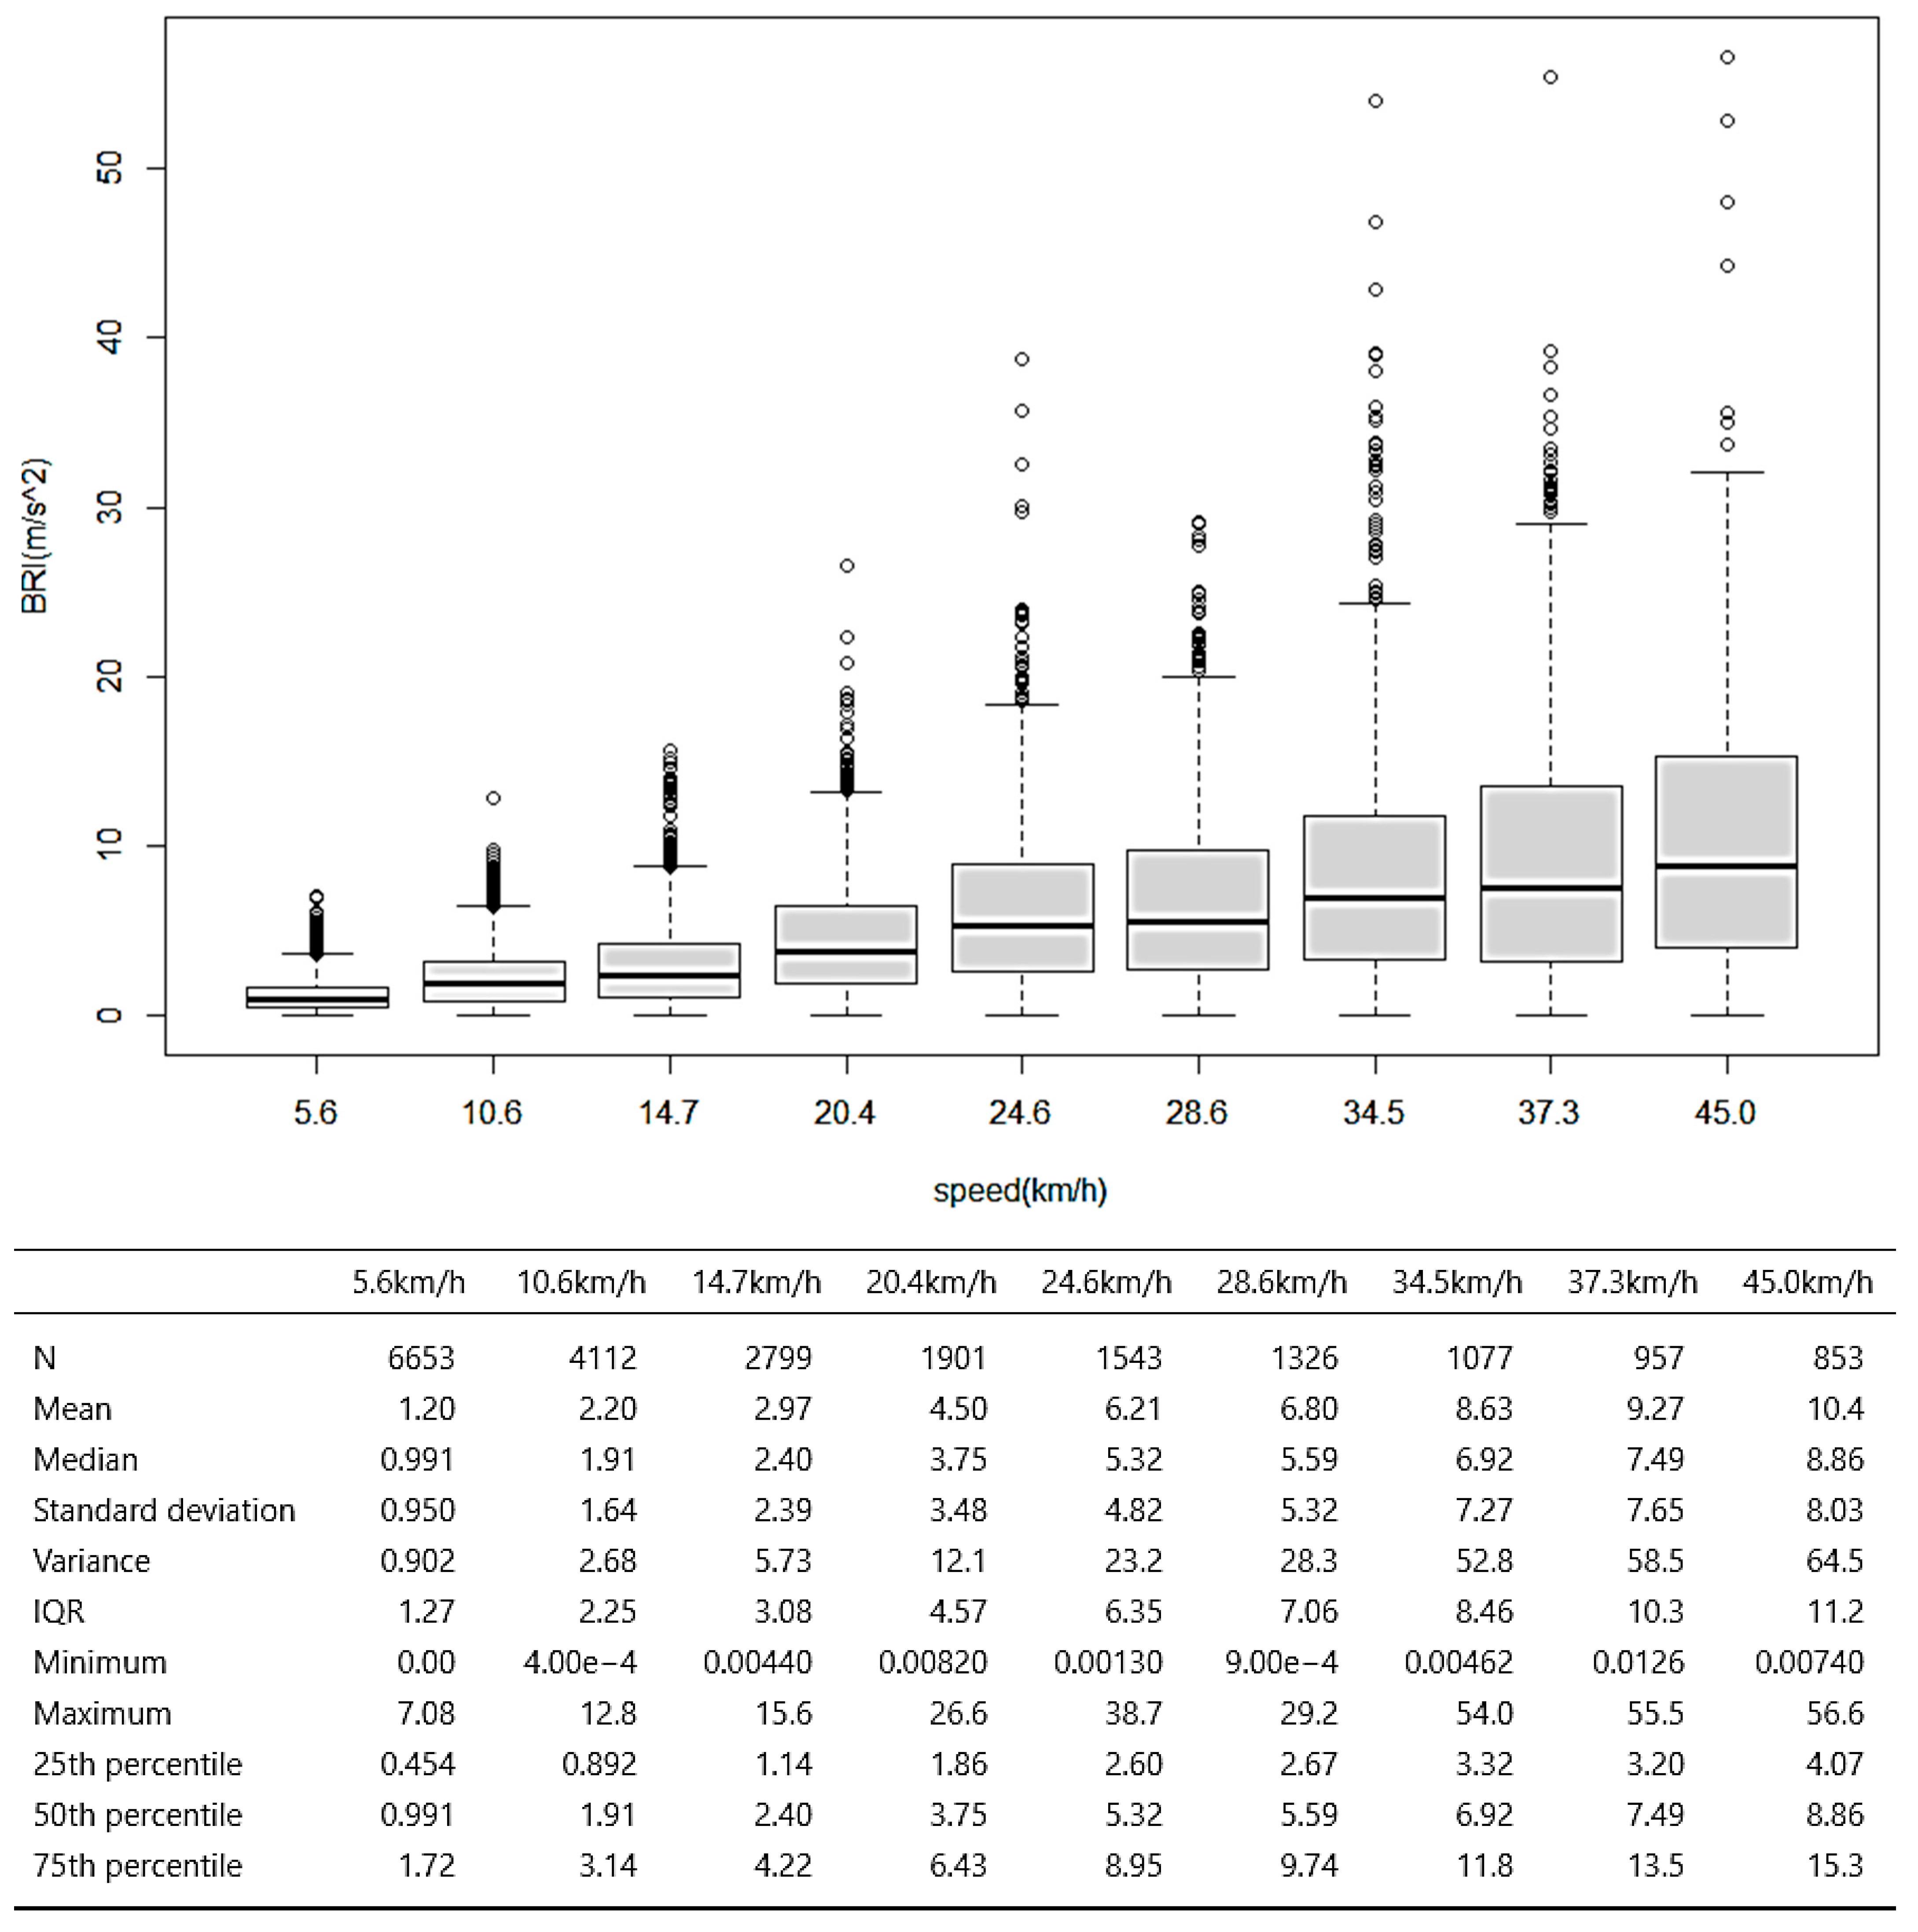
3.2. Improvement of BRI Model for Minimizing Speed Error
- x
- d
- x
- i
- j Time to traverse the unit section for roughness evaluation (Recommended section length: 100 m)
- n
- i
- n
3.3. Three-Axis Acceleration Changes When Measuring Flatness and Risk
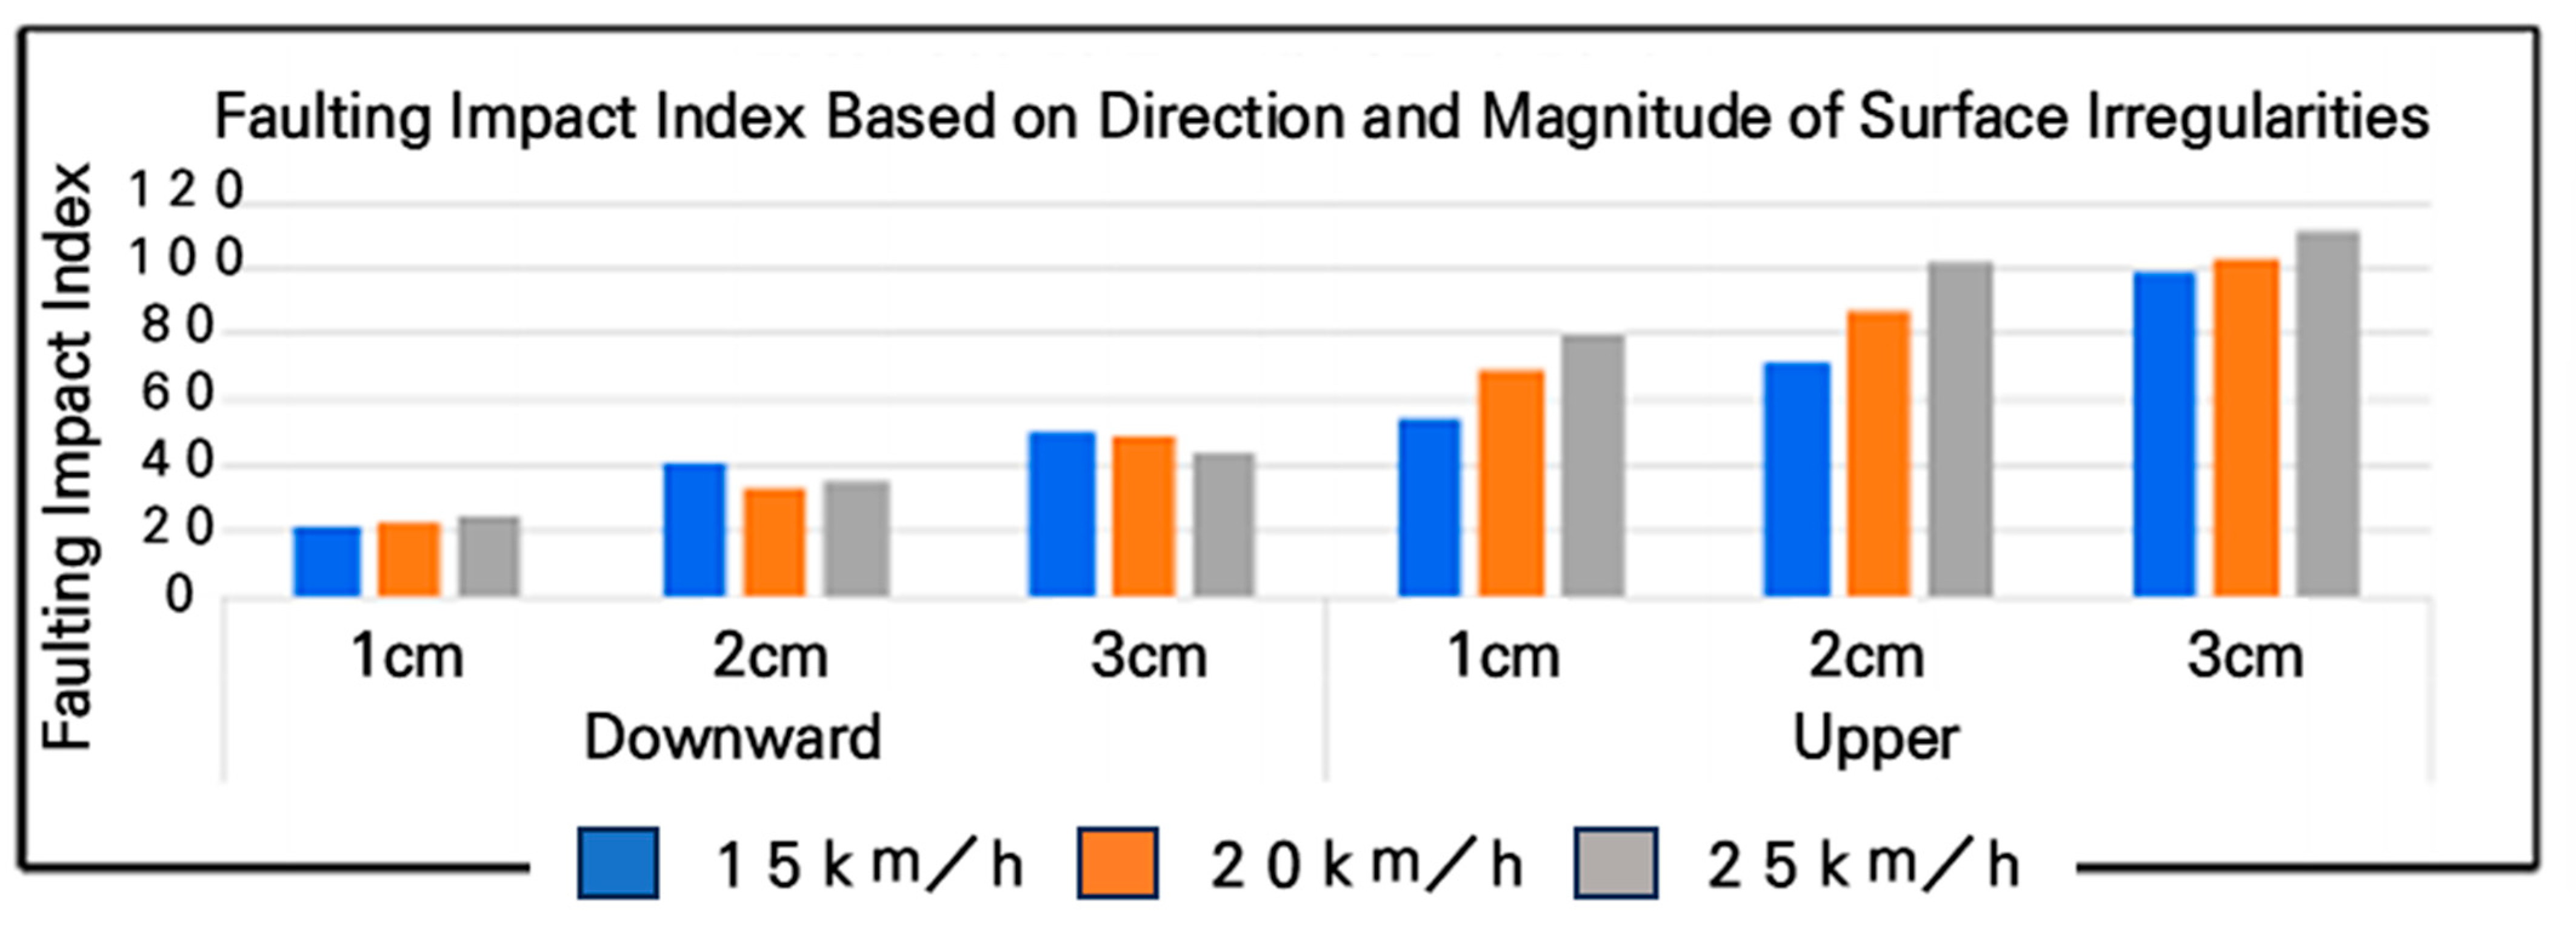
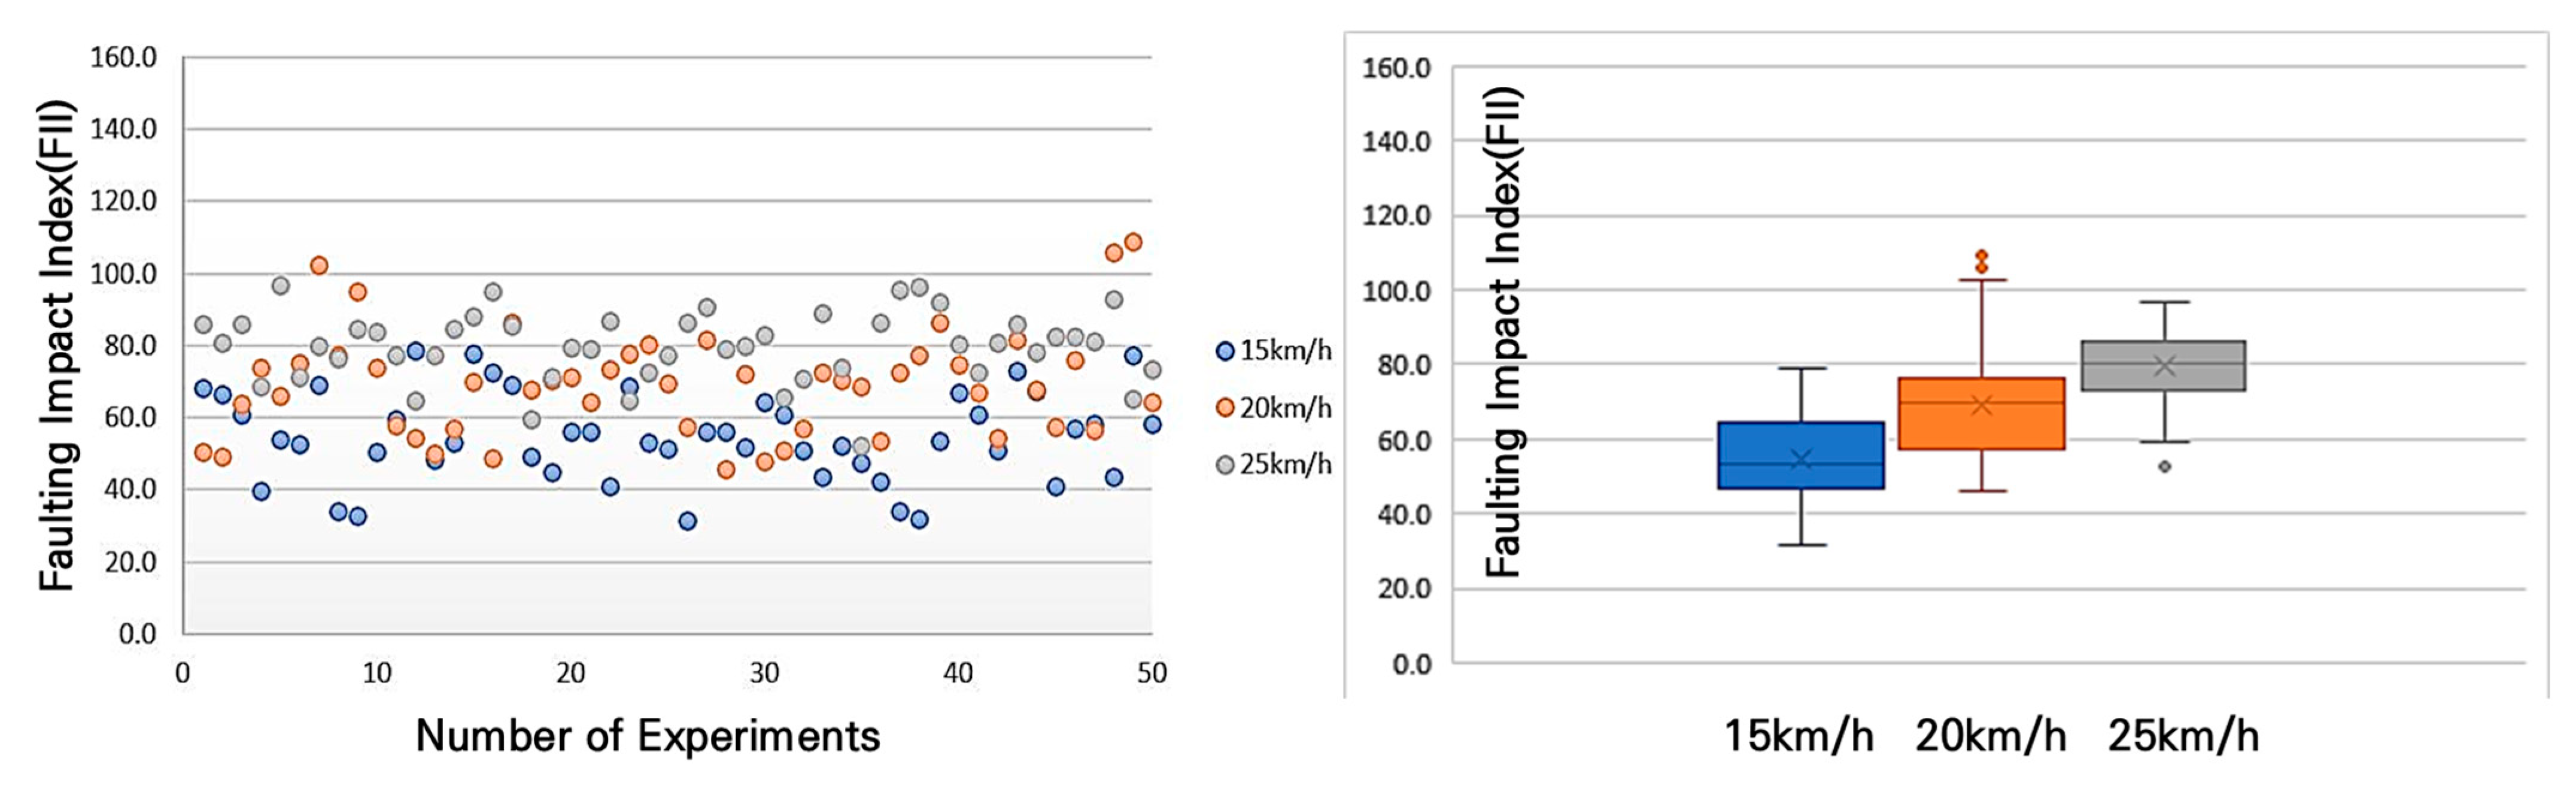
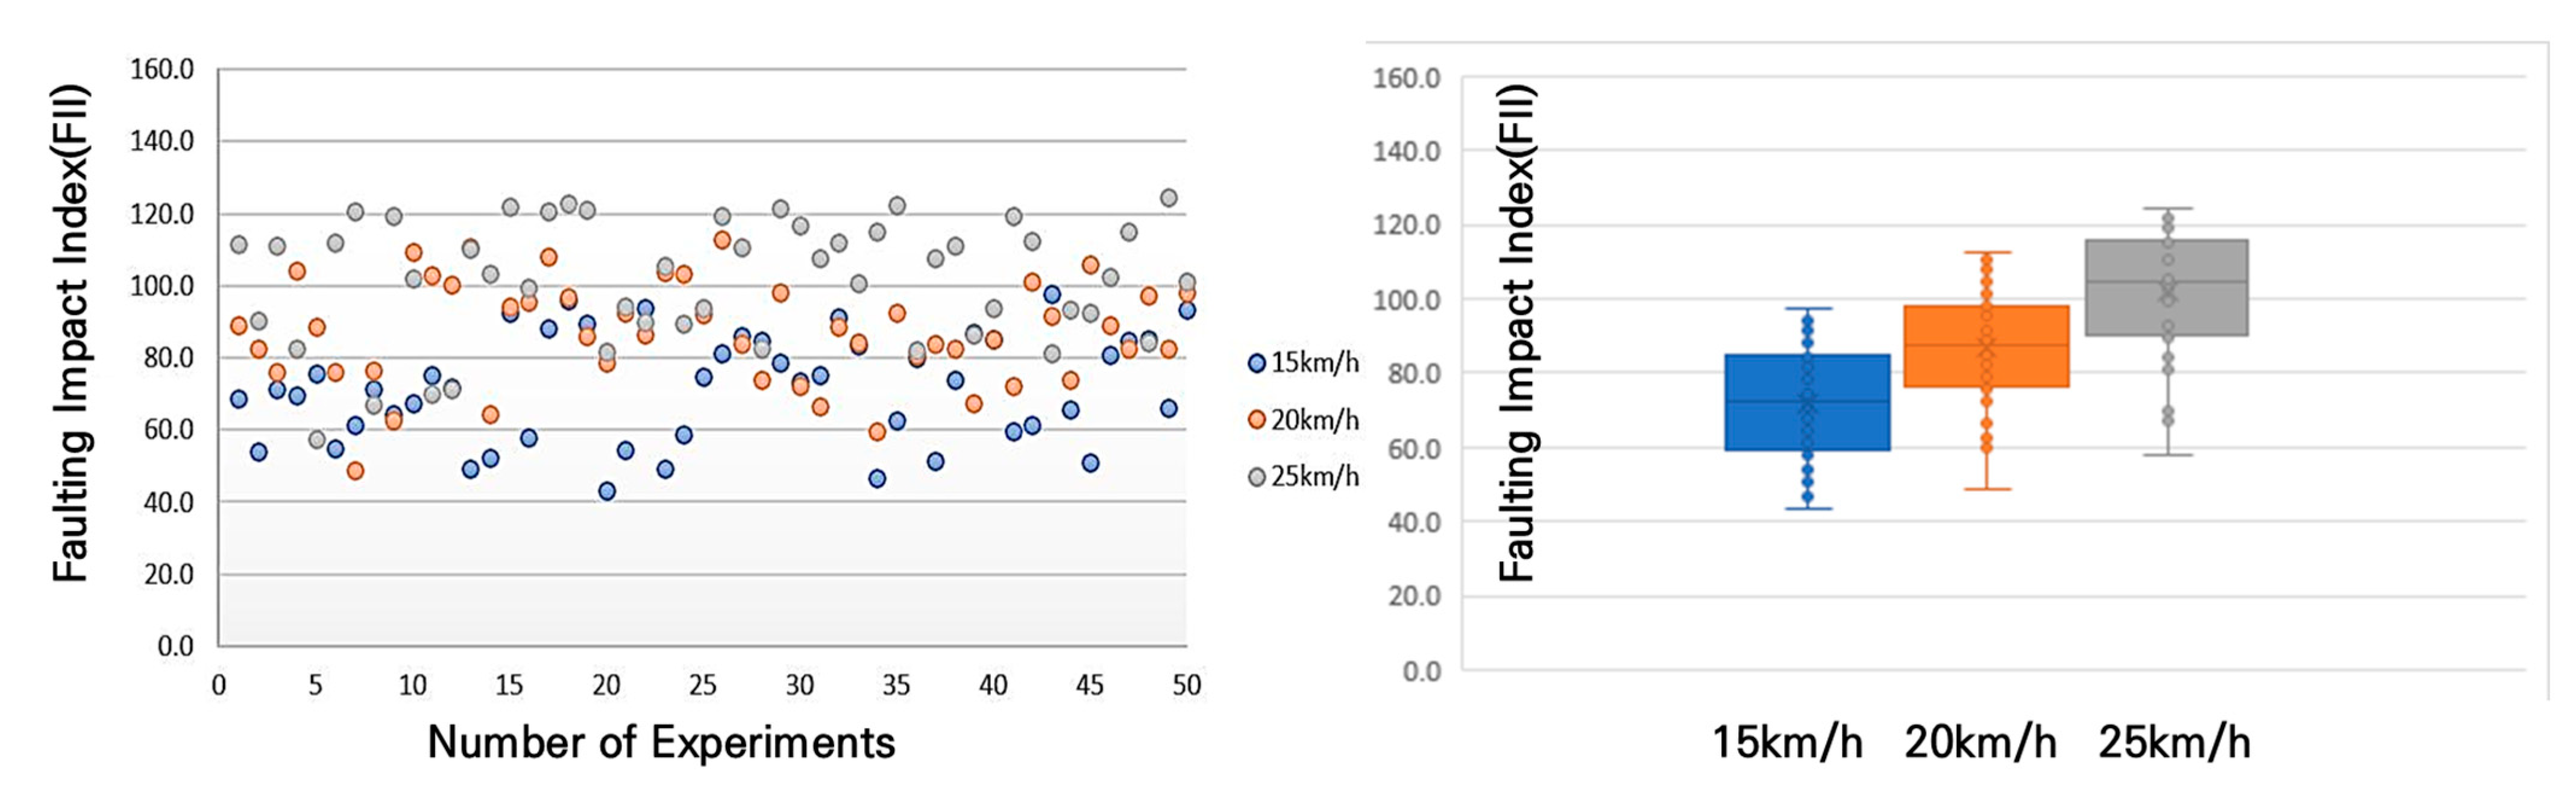
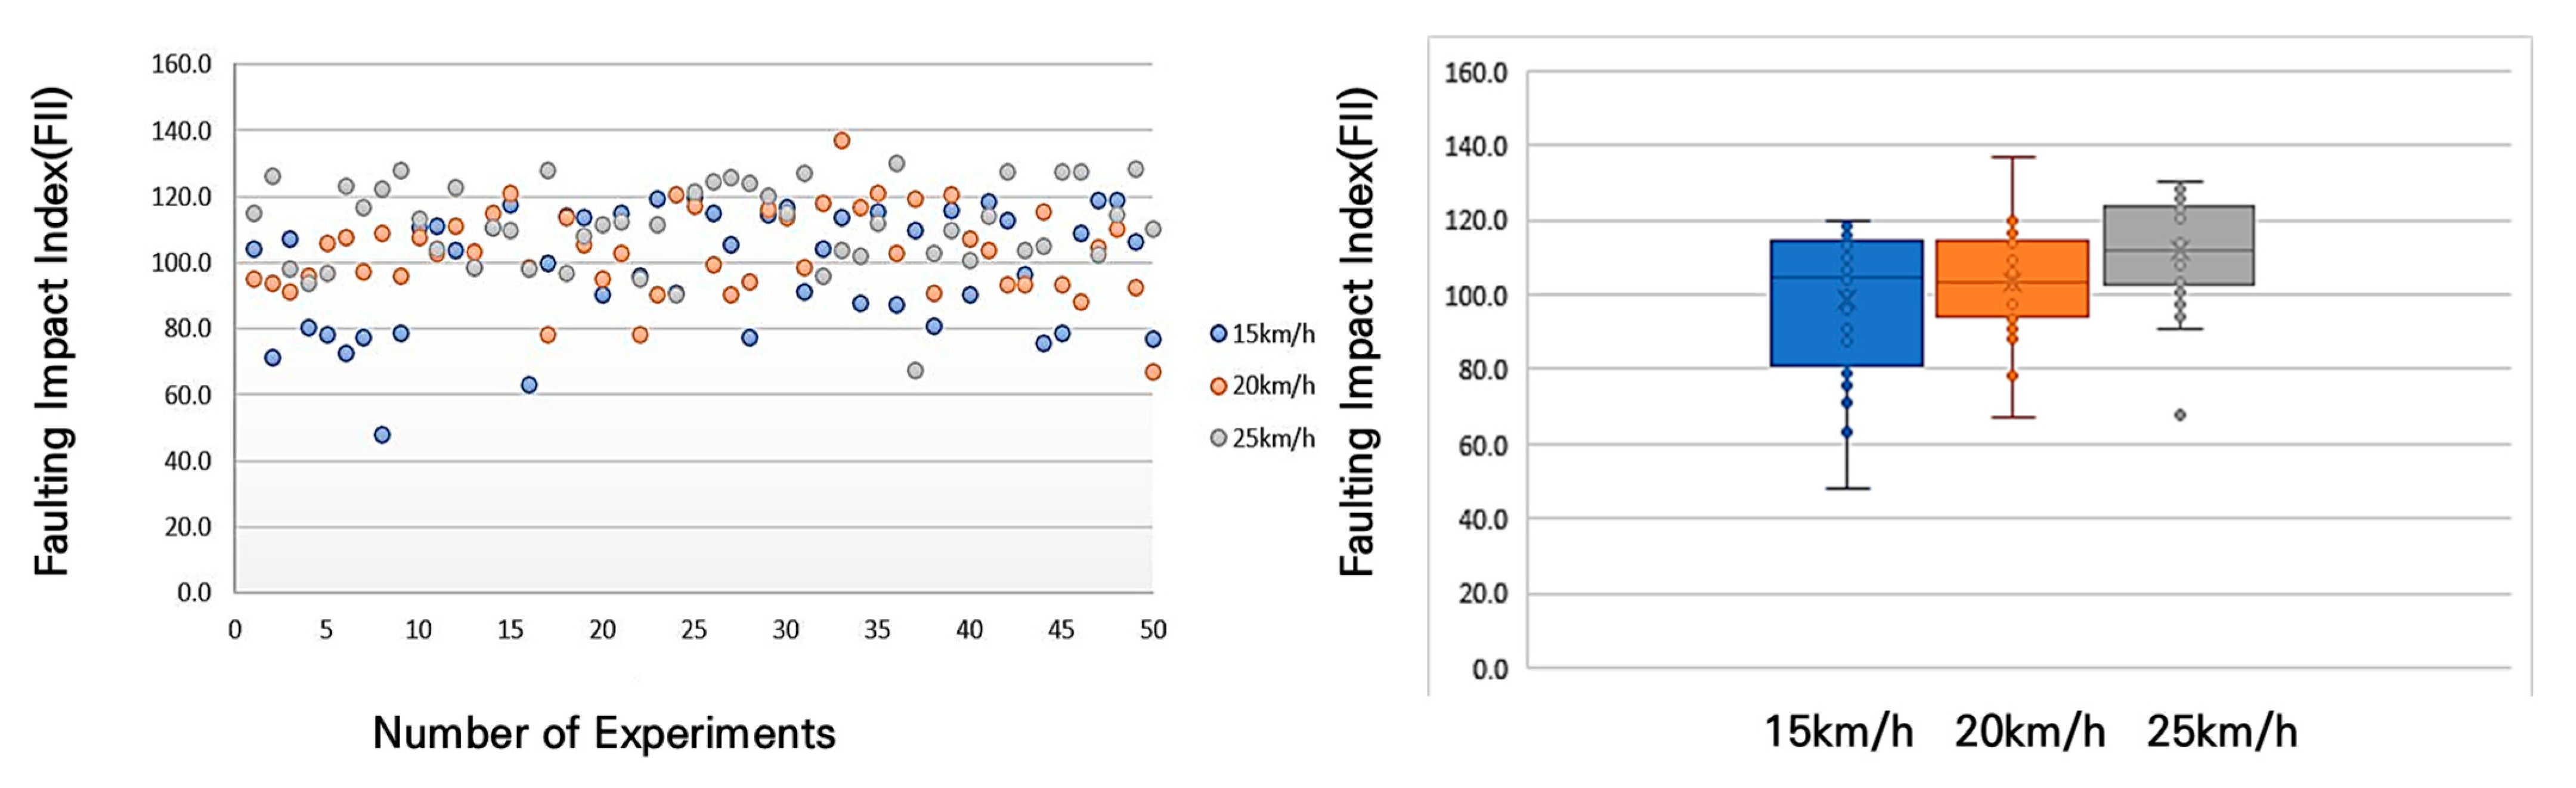
3.4. FII Based on Surface Irregularities
4. Discussion
5. Conclusions
- -
- Bicycle Road Roughness: The roughness of bicycle lanes was evaluated using a smartphone’s three-axis accelerometer, with a focus on the vertical (z-axis) acceleration. The absolute mean value of vertical acceleration, adjusted by a speed correction factor, was used to calculate the Bicycle Road Roughness Index (BRI). Field tests indicated that BRI values ranged from 0.2 to 0.8, with sections exceeding 0.5 being classified as hazardous, significantly reducing riding comfort.
- -
- Risk Assessment: Bump impact tests were conducted using different fault sizes (10 mm, 20 mm, 30 mm) and bicycle approach speeds (15 km/h, 20 km/h, 30 km/h). Nine scenarios were tested, with 50 repetitions each. Results showed that as both bump size and approach speed increased, the Faulting Impact Index (FII) rose proportionally. For instance, at a speed of 25 km/h, a 10 mm bump resulted in an FII value of 80 m/s2, while bumps larger than 30 mm caused the FII to sharply exceed 130 m/s2.
- -
- FII Calculation: The FII was derived by aggregating acceleration changes across the x, y, and z axes, offering a quantitative measure of the shock experienced by cyclists. This method provides a reliable way to identify and prioritize hazardous points based on scientific criteria, facilitating targeted road maintenance.
- -
- Smartphone-Based Measurement Method: The smartphone-based method proposed is cost-effective, simple to implement, and ideal for use in areas where specialized equipment is unavailable. By attaching a smartphone to a bicycle, real-time road condition data can be easily collected, enabling road administrators to efficiently identify areas needing maintenance. The proposed method can also be used to evaluate newly constructed bicycle lanes, ensuring they adhere to safety and comfort standards.
Author Contributions
Funding
Institutional Review Board Statement
Informed Consent Statement
Data Availability Statement
Acknowledgments
Conflicts of Interest
References
- Smith, K.; Ram, P. Measures and Specifying Pavement Smoothness; FHWA: Washington, DC, USA, 2016. [Google Scholar]
- Chang, C.L.; He, S.; Qian, J.Z.; Mao, L.J. Pavement flatness test technology summary. J. Highw. Transp. Res. Dev. 2006, 4, 6,7,13. [Google Scholar]
- Son, D. A Study on the Evaluation of Road Smoothness Considering Ride Comfortableness and Localized Roughness. Ph.D. Thesis, Department of Civil and Environmental Engineering, Myongji University, Yongin, Republic of Korea, 2018. [Google Scholar]
- Kim, K.; Lee, B.; Cho, C.; Yang, S. A Study on the Relation between IRI and PrI. J. Korean Soc. Pavement Eng. 2003, 5, 11–18. [Google Scholar]
- Setiawan, E.; Nurdin, H. Road Quality Assessment Using International Roughness Index Method and Accelerometer on Android. J. Inf. Technol. Intell. Syst. 2019, 10, 62–72. [Google Scholar] [CrossRef]
- Zang, K.; Shen, J.; Huang, H.; Wan, M.; Shi, J. Assessing and Mapping of Road Surface Roughness based on GPS and Accelerometer Sensors on Bicycle-Mounted Smartphones. Sensors 2018, 18, 914. [Google Scholar] [CrossRef] [PubMed]
- Ministry of Government Legislation, Republic of Korea. Act on Encouragement of Bicycle Riding; Act No. 14617; Ministry of Government Legislation: Sejong-si, Republic of Korea, 2017. [Google Scholar]
- Jeong, K.; Lee, J.; Lee, D. Construction and Utilization of Big Data for Personal Mobility Using Smart Devices; Korea Transport Institute: Sejong-si, Republic of Korea, 2021; pp. 83–139. [Google Scholar]
- Kim, K.; Jo, S.H.; Ahn, J.; Kim, N. A Study on the Evaluation Criteria of Pavement Condition Using Investigation Equipment of Bicycle Road. KSCE J. Civ. Environ. Eng. Res. 2016, 36, 1125–1131. [Google Scholar] [CrossRef]
- Douangphachanh, V.; Oneyama, H. Using smartphones to estimate road pavement condition. In Proceedings of the International Symposium for Next Generation Infrastructure, Wollongong, Australia, 1–4 October 2013. [Google Scholar]
- Lah, T.J.; Lee, H.; Cho, Y. The Four Major Rivers Restoration Project of South Korea: An Assessment of Its Process, Program, and Political Dimensions. J. Environ. Dev. 2015, 24, 375–394. [Google Scholar] [CrossRef]
- Ministry of the Interior and Safety; Ministry of Land, Infrastructure and Transport. Guidelines for Installation and Management of Bicycle Facilities; Ministry of the Interior and Safety: Sejong, Republic of Korea, 2022; pp. 66–81, 157. Available online: https://www.scribd.com/document/686733214 (accessed on 31 May 2025). (In Korean)
- Kim, C.-Y.; Samsung Tops, S. Korean Smartphone Market with 76% Share. KED Global, 22 August 2024. Available online: https://www.kedglobal.com/tech,-media-telecom/newsView/ked202408220010 (accessed on 23 August 2024.).
- Macdermid, P.W.; Fink, P.W.; Stannard, R. Transference of 3D Accelerations During Cross Country Mountain Biking. J. Biomech. 2014, 47, 1829–1837. [Google Scholar] [CrossRef] [PubMed]
- Macdermid, P.M.; Stannard, S. Mechanical Work and Physiological Responses to Simulated Cross Country Mountain Bike Racing. J. Sports Sci. 2012, 30, 1491–1501. [Google Scholar] [CrossRef] [PubMed]
- Hurst, H.T.; Sinclair, J.; Atkins, S.; Rylands, L.; Metcalfe, J. The Effect of Mountain Bike Wheel Size on Cross-Country Performance. J. Sports Sci. 2017, 35, 1349–1354. [Google Scholar] [CrossRef] [PubMed]
- Olieman, M.; Marin-Perianu, R.; Marin-Perianu, M. Measurement of Dynamic Comfort in Cycling Using Wireless Acceleration Sensors. Procedia Eng. 2012, 34, 568–573. [Google Scholar] [CrossRef]
- Karantonis, D.M.; Narayanan, M.R.; Mathie, M.; Lovell, N.H.; Celler, B.G. Implementation of a Real-Time Human Movement Classifier Using a Triaxial Accelerometer for Ambulatory Monitoring. IEEE Trans. Inf. Technol. Biomed. 2006, 10, 156–167. [Google Scholar] [CrossRef] [PubMed]
- Plati, C.; Gkyrtis, K.; Loizos, A. A Practice-Based Approach to Diagnose Pavement Roughness Problems. Int. J. Civ. Eng. 2024, 22, 453–465. [Google Scholar] [CrossRef]
- Argyros, D.; Fjendbo Jensen, A.; Rich, J.; Dalyot, S. Riding Smooth: A Cost-Benefit Assessment of Surface Quality on Copenhagen’s Bicycle Network. Sustain. Cities Soc. 2024, 108, 105473. [Google Scholar] [CrossRef]
- Siddiqui, O.; DiBiase, S.; Hoang, R.; Nguyen, B.; Khan, O.; Famiglietti, N. Evaluating the Accuracy and Reliability of Bicycle GPS Devices. SAE Int. J. Adv. Curr. Prac. Mobil. 2021, 3, 3093–3114. [Google Scholar] [CrossRef]
- Lee, S.; Bae, Y.; Kwon, Y.-C.; Kim, J.-H. A Study for Pavement Smoothness Index Reflecting Urban Road Characteristics. Seoul Stud. 2015, 16, 129–145. [Google Scholar] [CrossRef]
- Kim, N.; Joo, S.; Kang, H.; Kim, S.; Song, T.-J. Methodology for Identifying Hazardous Driving Longitudinal Events on E-Scooter Using GPS Trajectory Data. J. Korean Soc. Transp. 2022, 40, 735–749. [Google Scholar] [CrossRef]


| Roughness Grade | Criteria |
|---|---|
| A | A road that provides a high level of ride comfort with a newly constructed pavement condition, showing no signs of deterioration |
| B | A road with high ride quality, some signs of surface deterioration but still providing a smooth ride, though not as a newly constructed road |
| C | A road with visible cracks or surface wear, but re-paved, allowing for high-speed travel despite a decrease in ride comfort |
| D | A road with significant surface deterioration that negatively impacts travel speed |
| E | A road where normal travel is not possible due to severe deterioration |
| Category | Experiment | Height | Bicycle Speed |
|---|---|---|---|
| Step difference (Upper) |  | 1 cm 2 cm 3 cm 4 cm | 15 km/h 20 km/h 25 km/h |
| Pothole/Sinkhole (Downward) | 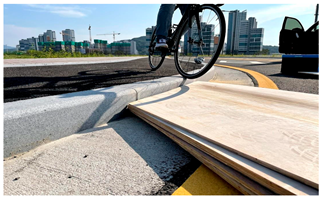 | 1 cm 2 cm 3 cm 4 cm | 15 km/h 20 km/h 25 km/h |
| Roughness Test | Risk Assessment Test | ||
|---|---|---|---|
| Category | Contents | Category | Contents |
| Experiment Objective | Bicycle road surface roughness by expected service level | Experiment Objective | Measurement of FII according to bump height and approach speed |
| Road type and Pavement type | Level A (excellent): Exclusive bicycle road, asphalt pavement Level B (good): Separated bicycle-pedestrian shared road, asphalt pavement Level C (fair): Exclusive bicycle road, concrete pavement Level D (poor): Shared automobile-bicycle road, concrete pavement Level E (Very Poor): Shared automobile-bicycle road, concrete pavement | Hazard type | Wooden square timber k (used for upward step measurement) |
| Road surface Characteristics | Service A (excellent): Newly constructed bicycle road Service Level B (good): Excellent roughness condition Service Level C (fair): Partial roughness degradation due to labeling, etc. Service Level D (poor): Occurrence of labeling, spalling, cracks, etc. Service Level E (very poor): Excessive anti-slip pavement causing difficulty in riding | Scenario | 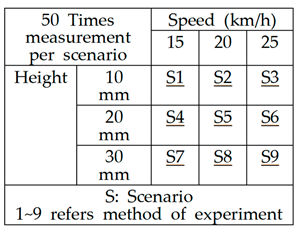 |
| Experimental Conditions | Measurement device: Road bicycle (wheel size 700 C, tire pressure 110 psi) Measurement smart device: Samsung Galaxy Note Sensor type: 3-axis accelerometer and GPS sensor Measurement interval: 0.1 s Measurement content: Z-axis acceleration | Experimental Conditions | -Measurement device: Road bicycle (wheel size 700 C, tire pressure 110 psi) -Measurement smart device: Samsung Galaxy Note Sensor type: 3-axis accelerometer and GPS sensor -Measurement interval: 0.01 s -Measurement content: FII (sum of 3-axis accelerations at the moment of maximum combined x, y, z acceleration during impact) |
| Experimental Method | Mount smartphone using fixed equipment on the measuring device Measure 3-axis acceleration Ride the target section at 25 km/h and end measurement | Experimental Method | -Smartphone using fixed equipment on the measuring device -Run the 3-axis accelerometer application -Impact the wooden square timber of specified bump height while maintaining the designated speed |
| Category | Scenario 1 | Scenario 2 | Scenario 3 | Scenario 4 | Scenario 5 |
|---|---|---|---|---|---|
| Mean | 3.040162 | 2.28489 | 6.774157 | 14.4497 | 22.58115 |
| Standard error | 0.29189 | 0.17931 | 0.50507 | 0.94367 | 2.14620 |
| Median | 2.2535 | 2.0793 | 5.9453 | 12.9231 | 12.4256 |
| Standard deviation | 3.14374 | 1.93124 | 4.71104 | 10.9645 | 23.9952 |
| Variance | 9.8831 | 3.7297 | −0.8017 | 120.2209 | 575.7736 |
| Kurtosis | 2.5369 | −0.1688 | 0.4969 | 2.5284 | −0.0706 |
| Skewness | 18.7104 | 0.7899 | 0.4969 | 1.3254 | 1.0836 |
| Range | 0.0176 | 7.5635 | 17.8878 | 59.7315 | 86.7817 |
| Minimum | 0.0176 | 0.0023 | 0.0554 | 0.2447 | 0.2093 |
| Maximum | 18.7280 | 7.5658 | 17.9432 | 59.9762 | 86.991 |
| Category | Results | ||||||||
|---|---|---|---|---|---|---|---|---|---|
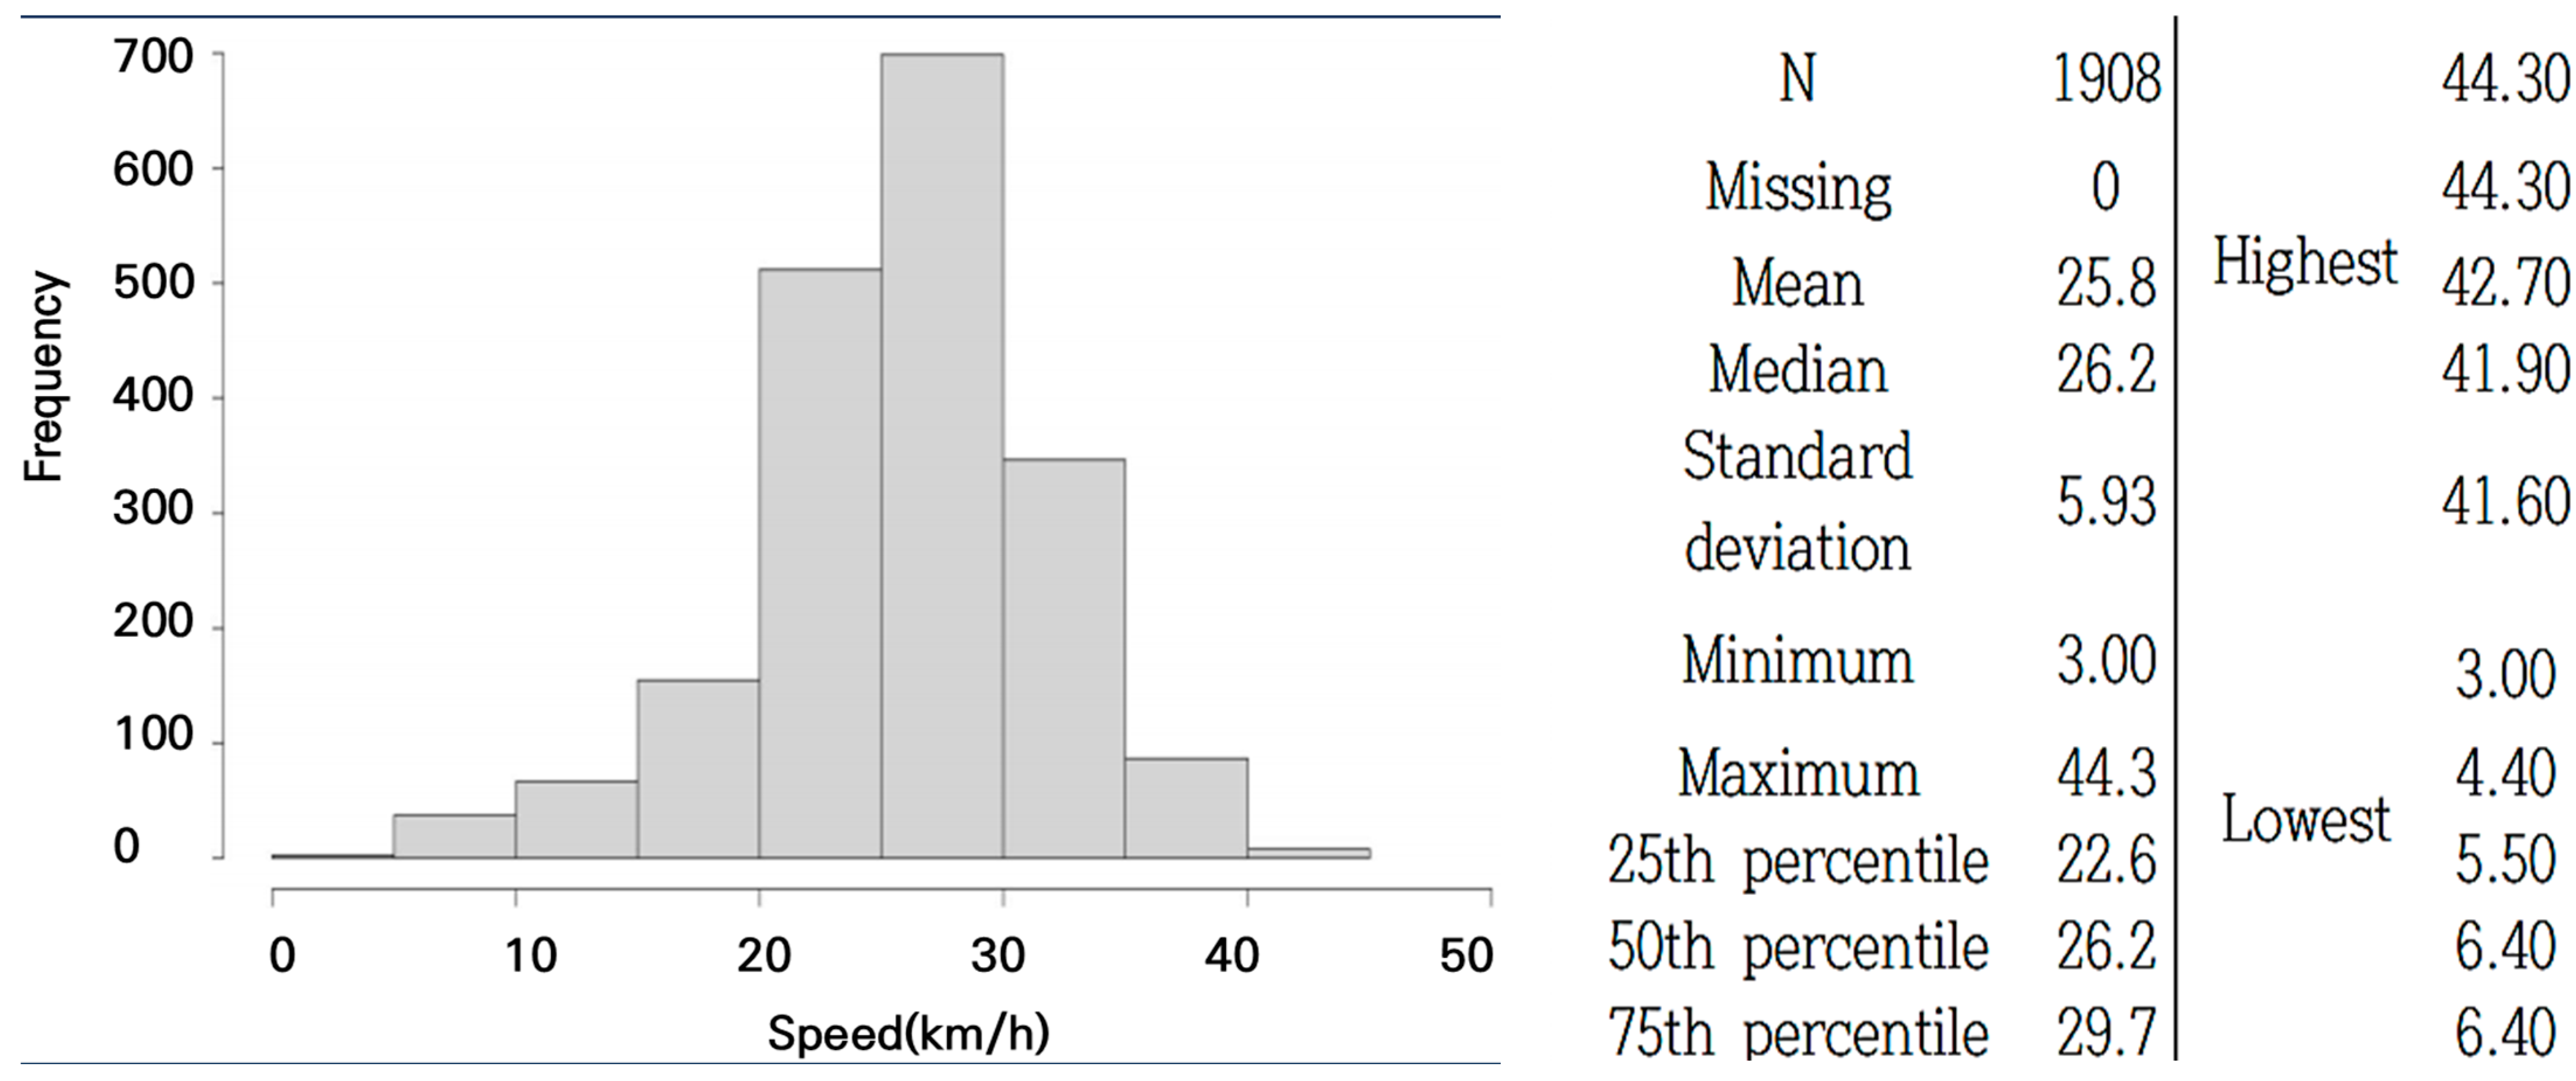
| Target speed(km/h) | 5.0 | 10.0 | 15.0 | 20.0 | 25.0 | 30.0 | 35.0 | 40.0 | 45.0 |
| Actual speed(km/h) | 5.6 | 10.6 | 14.7 | 20.4 | 24.6 | 28.6 | 34.5 | 37.3 | 45.0 |
| Driver error(km/h) | 0.6 | 0.6 | 0.3 | 0.4 | 0.4 | 1.4 | 0.5 | 2.7 | 0 |
(km/h) | (km/h) | (km/h) | (km/h) | ||||
|---|---|---|---|---|---|---|---|
| 6 | 4.25 | 16 | 1.57 | 26 | 0.96 | 36 | 0.69 |
| 7 | 3.63 | 17 | 1.47 | 27 | 0.93 | 37 | 0.67 |
| 8 | 3.16 | 18 | 1.39 | 28 | 0.89 | 38 | 0.66 |
| 9 | 2.81 | 19 | 1.32 | 29 | 0.86 | 39 | 0.64 |
| 10 | 2.52 | 20 | 1.25 | 30 | 0.83 | 40 | 0.62 |
| 11 | 2.29 | 21 | 1.19 | 31 | 0.81 | 41 | 0.61 |
| 12 | 2.10 | 22 | 1.14 | 32 | 0.78 | 42 | 0.59 |
| 13 | 1.93 | 23 | 1.09 | 33 | 0.76 | - | - |
| 14 | 1.79 | 24 | 1.04 | 34 | 0.73 | - | - |
| 15 | 1.67 | 25 | 1.00 | 35 | 0.71 | - | - |
| Category | 15 km/h | 20 km/h | 25 km/h | ||||||
|---|---|---|---|---|---|---|---|---|---|
| S1 | S4 | S7 | S2 | S5 | S8 | S3 | S6 | S9 | |
| Maximum | 78.7 | 97.6 | 119.9 | 109.0 | 112.9 | 137.0 | 96.9 | 124.4 | 130.3 |
| Minimum | 31.4 | 43.4 | 48.2 | 45.7 | 48.9 | 67.0 | 52.3 | 57.6 | 67.5 |
| Average | 54.8 | 71.9 | 98.8 | 69.1 | 87.2 | 103.4 | 79.9 | 101.8 | 116.6 |
| Median | 53.6 | 72.7 | 104.4 | 69.7 | 87.6 | 103.2 | 80.4 | 101.4 | 118.8 |
| Standard Deviation | 12.2 | 14.6 | 17.6 | 14.6 | 14.3 | 13.0 | 9.6 | 16.7 | 12.9 |
| Bump Height | Driving Speed 15 km/h | Driving Speed 20 km/h | Driving Speed 30 km/h |
|---|---|---|---|
| 10 mm | 54.8 | 69.1 | 79.9 |
| 20 mm | 71.9 | 87.2 | 101.8 |
| 30 mm | 98.8 | 103.4 | 111.6 |
Disclaimer/Publisher’s Note: The statements, opinions and data contained in all publications are solely those of the individual author(s) and contributor(s) and not of MDPI and/or the editor(s). MDPI and/or the editor(s) disclaim responsibility for any injury to people or property resulting from any ideas, methods, instructions or products referred to in the content. |
© 2025 by the authors. Licensee MDPI, Basel, Switzerland. This article is an open access article distributed under the terms and conditions of the Creative Commons Attribution (CC BY) license (https://creativecommons.org/licenses/by/4.0/).
Share and Cite
Lee, D.-y.; Yoo, H.-j.; Lee, J.-y.; Jeong, G.-o. Development of a Bicycle Road Surface Roughness and Risk Assessment Method Using Smartphone Sensor Technology. Sensors 2025, 25, 3520. https://doi.org/10.3390/s25113520
Lee D-y, Yoo H-j, Lee J-y, Jeong G-o. Development of a Bicycle Road Surface Roughness and Risk Assessment Method Using Smartphone Sensor Technology. Sensors. 2025; 25(11):3520. https://doi.org/10.3390/s25113520
Chicago/Turabian StyleLee, Dong-youn, Ho-jun Yoo, Jae-yong Lee, and Gyeong-ok Jeong. 2025. "Development of a Bicycle Road Surface Roughness and Risk Assessment Method Using Smartphone Sensor Technology" Sensors 25, no. 11: 3520. https://doi.org/10.3390/s25113520
APA StyleLee, D.-y., Yoo, H.-j., Lee, J.-y., & Jeong, G.-o. (2025). Development of a Bicycle Road Surface Roughness and Risk Assessment Method Using Smartphone Sensor Technology. Sensors, 25(11), 3520. https://doi.org/10.3390/s25113520