
A Dual Immunosensor Based on Optical Weak Value Amplification for Simultaneous Detection of CA125 and HE4

 , , , and
Abstract
1. Introduction
2. Materials and Methods
2.1. Materials
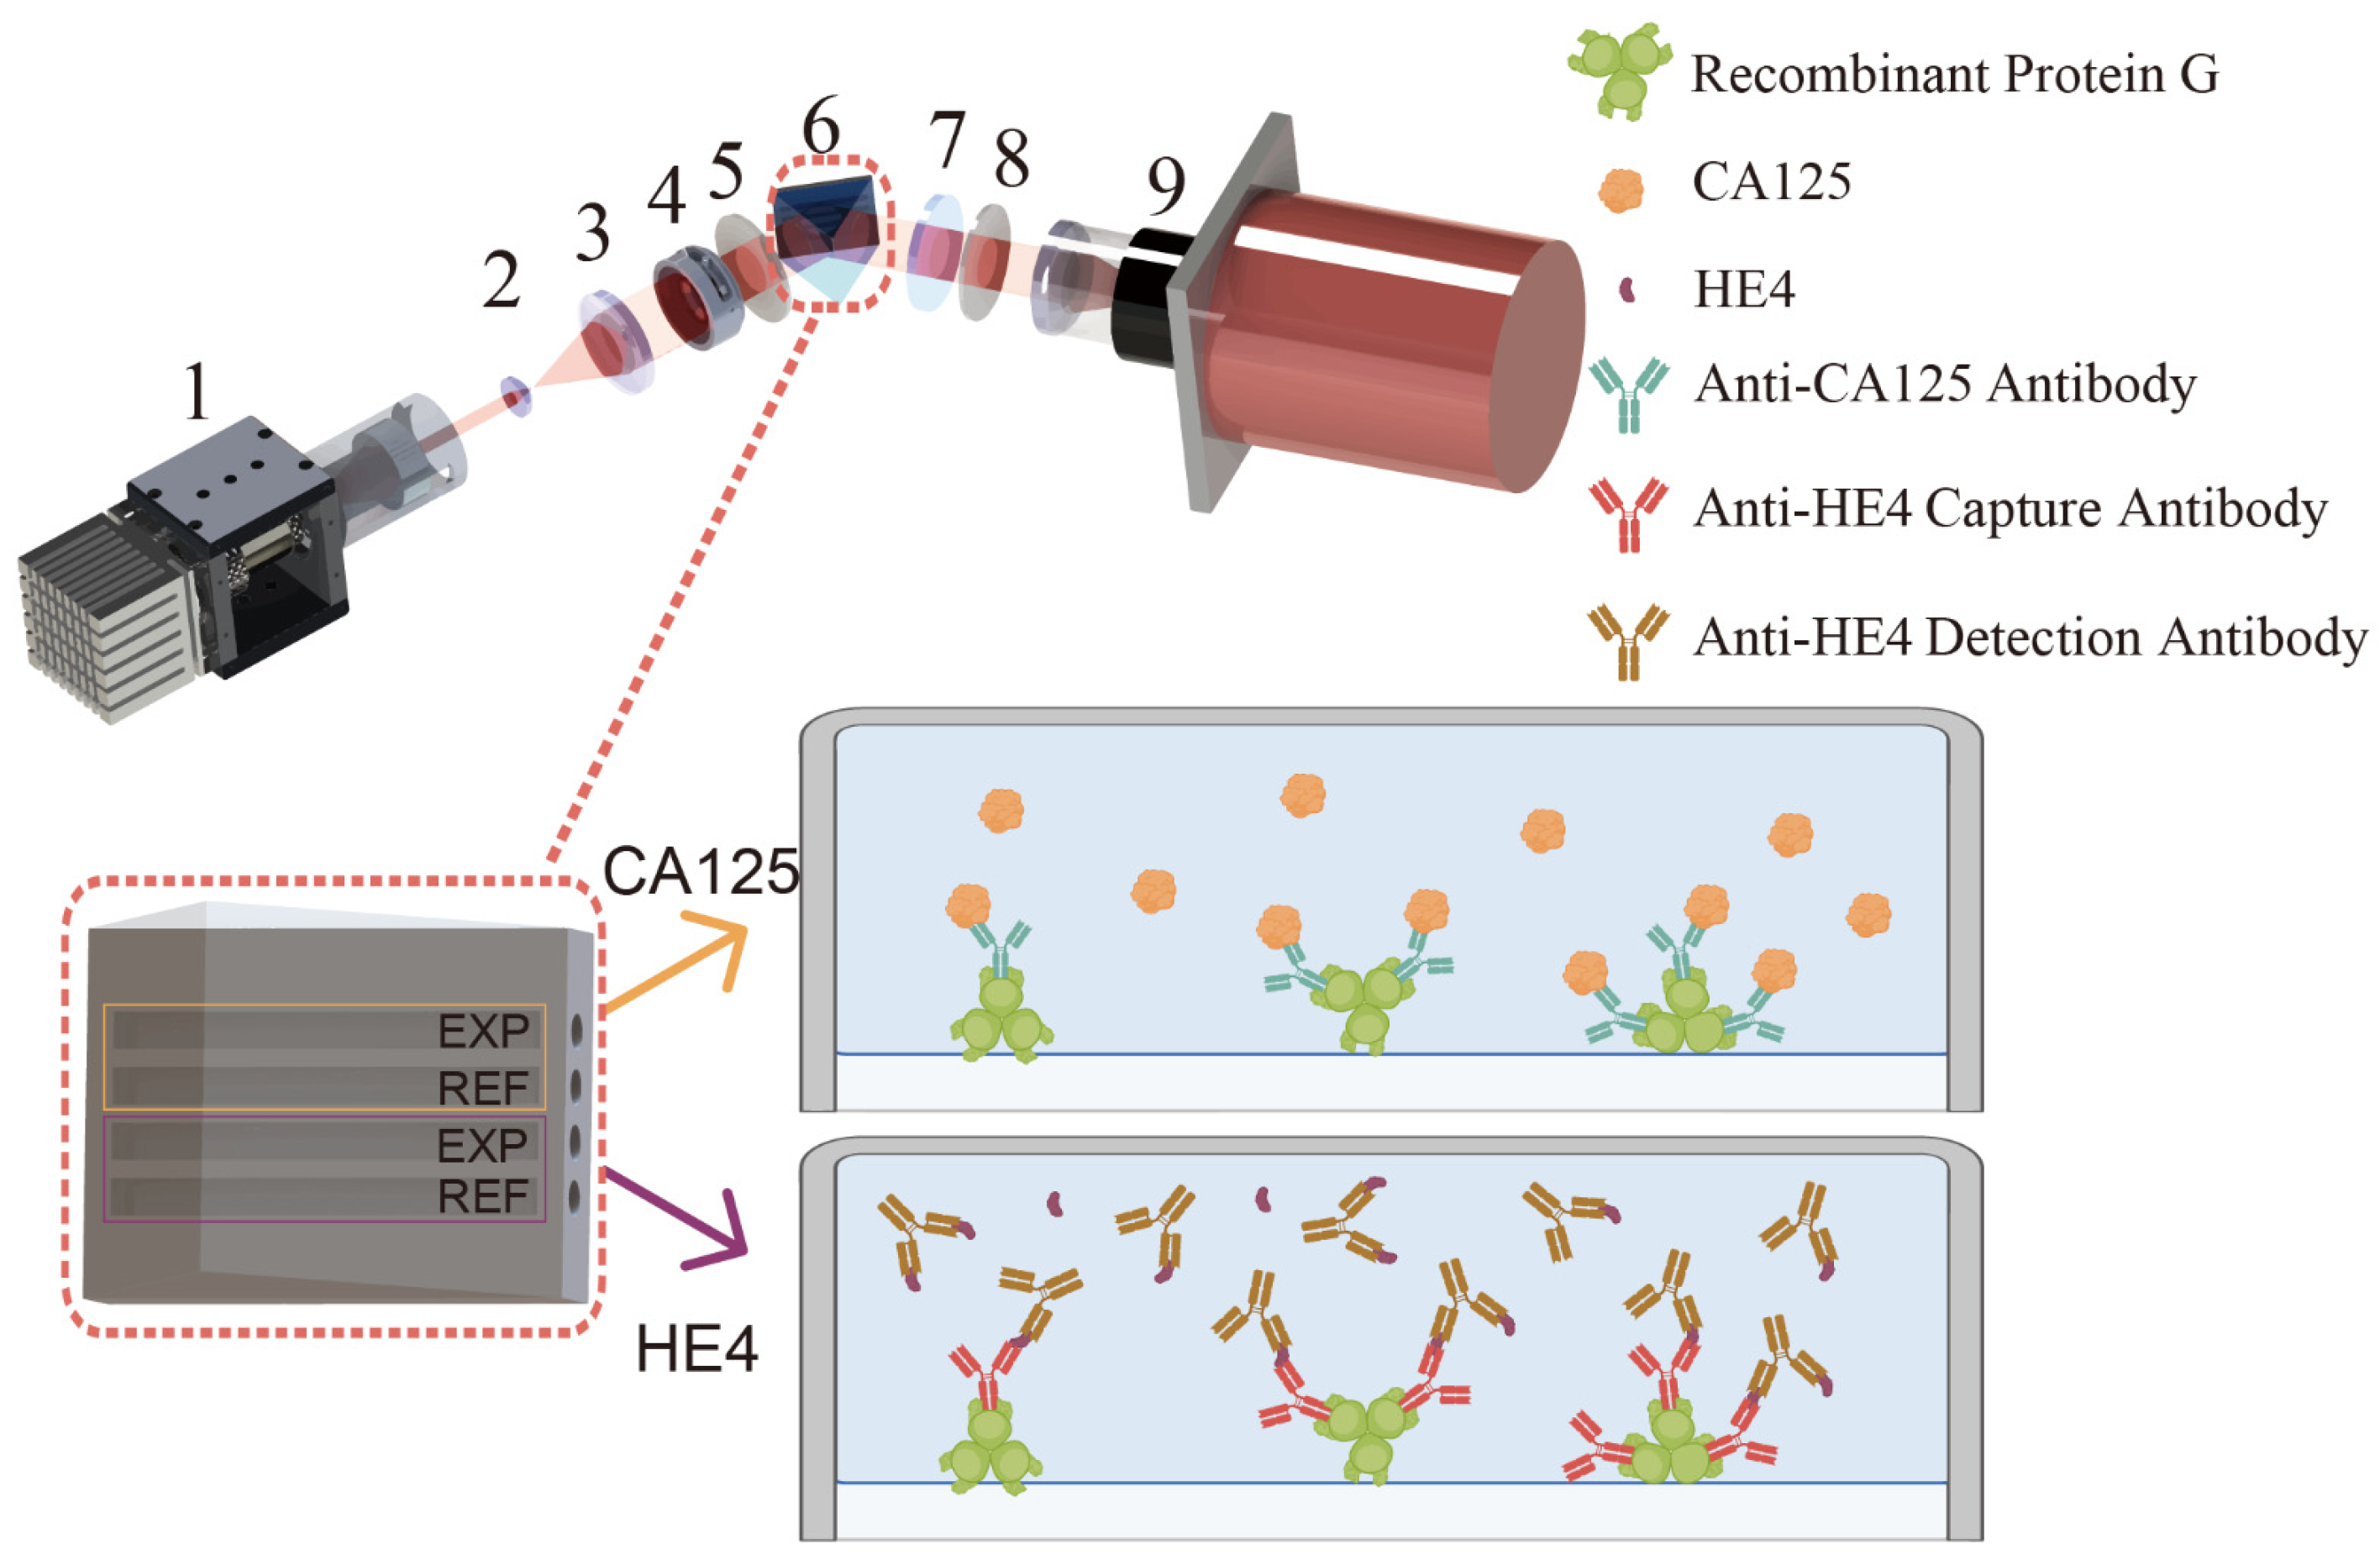
2.2. System Setup
2.3. Construction of the Dual CA125-HE4 Immunosensor
3. Results and Discussion
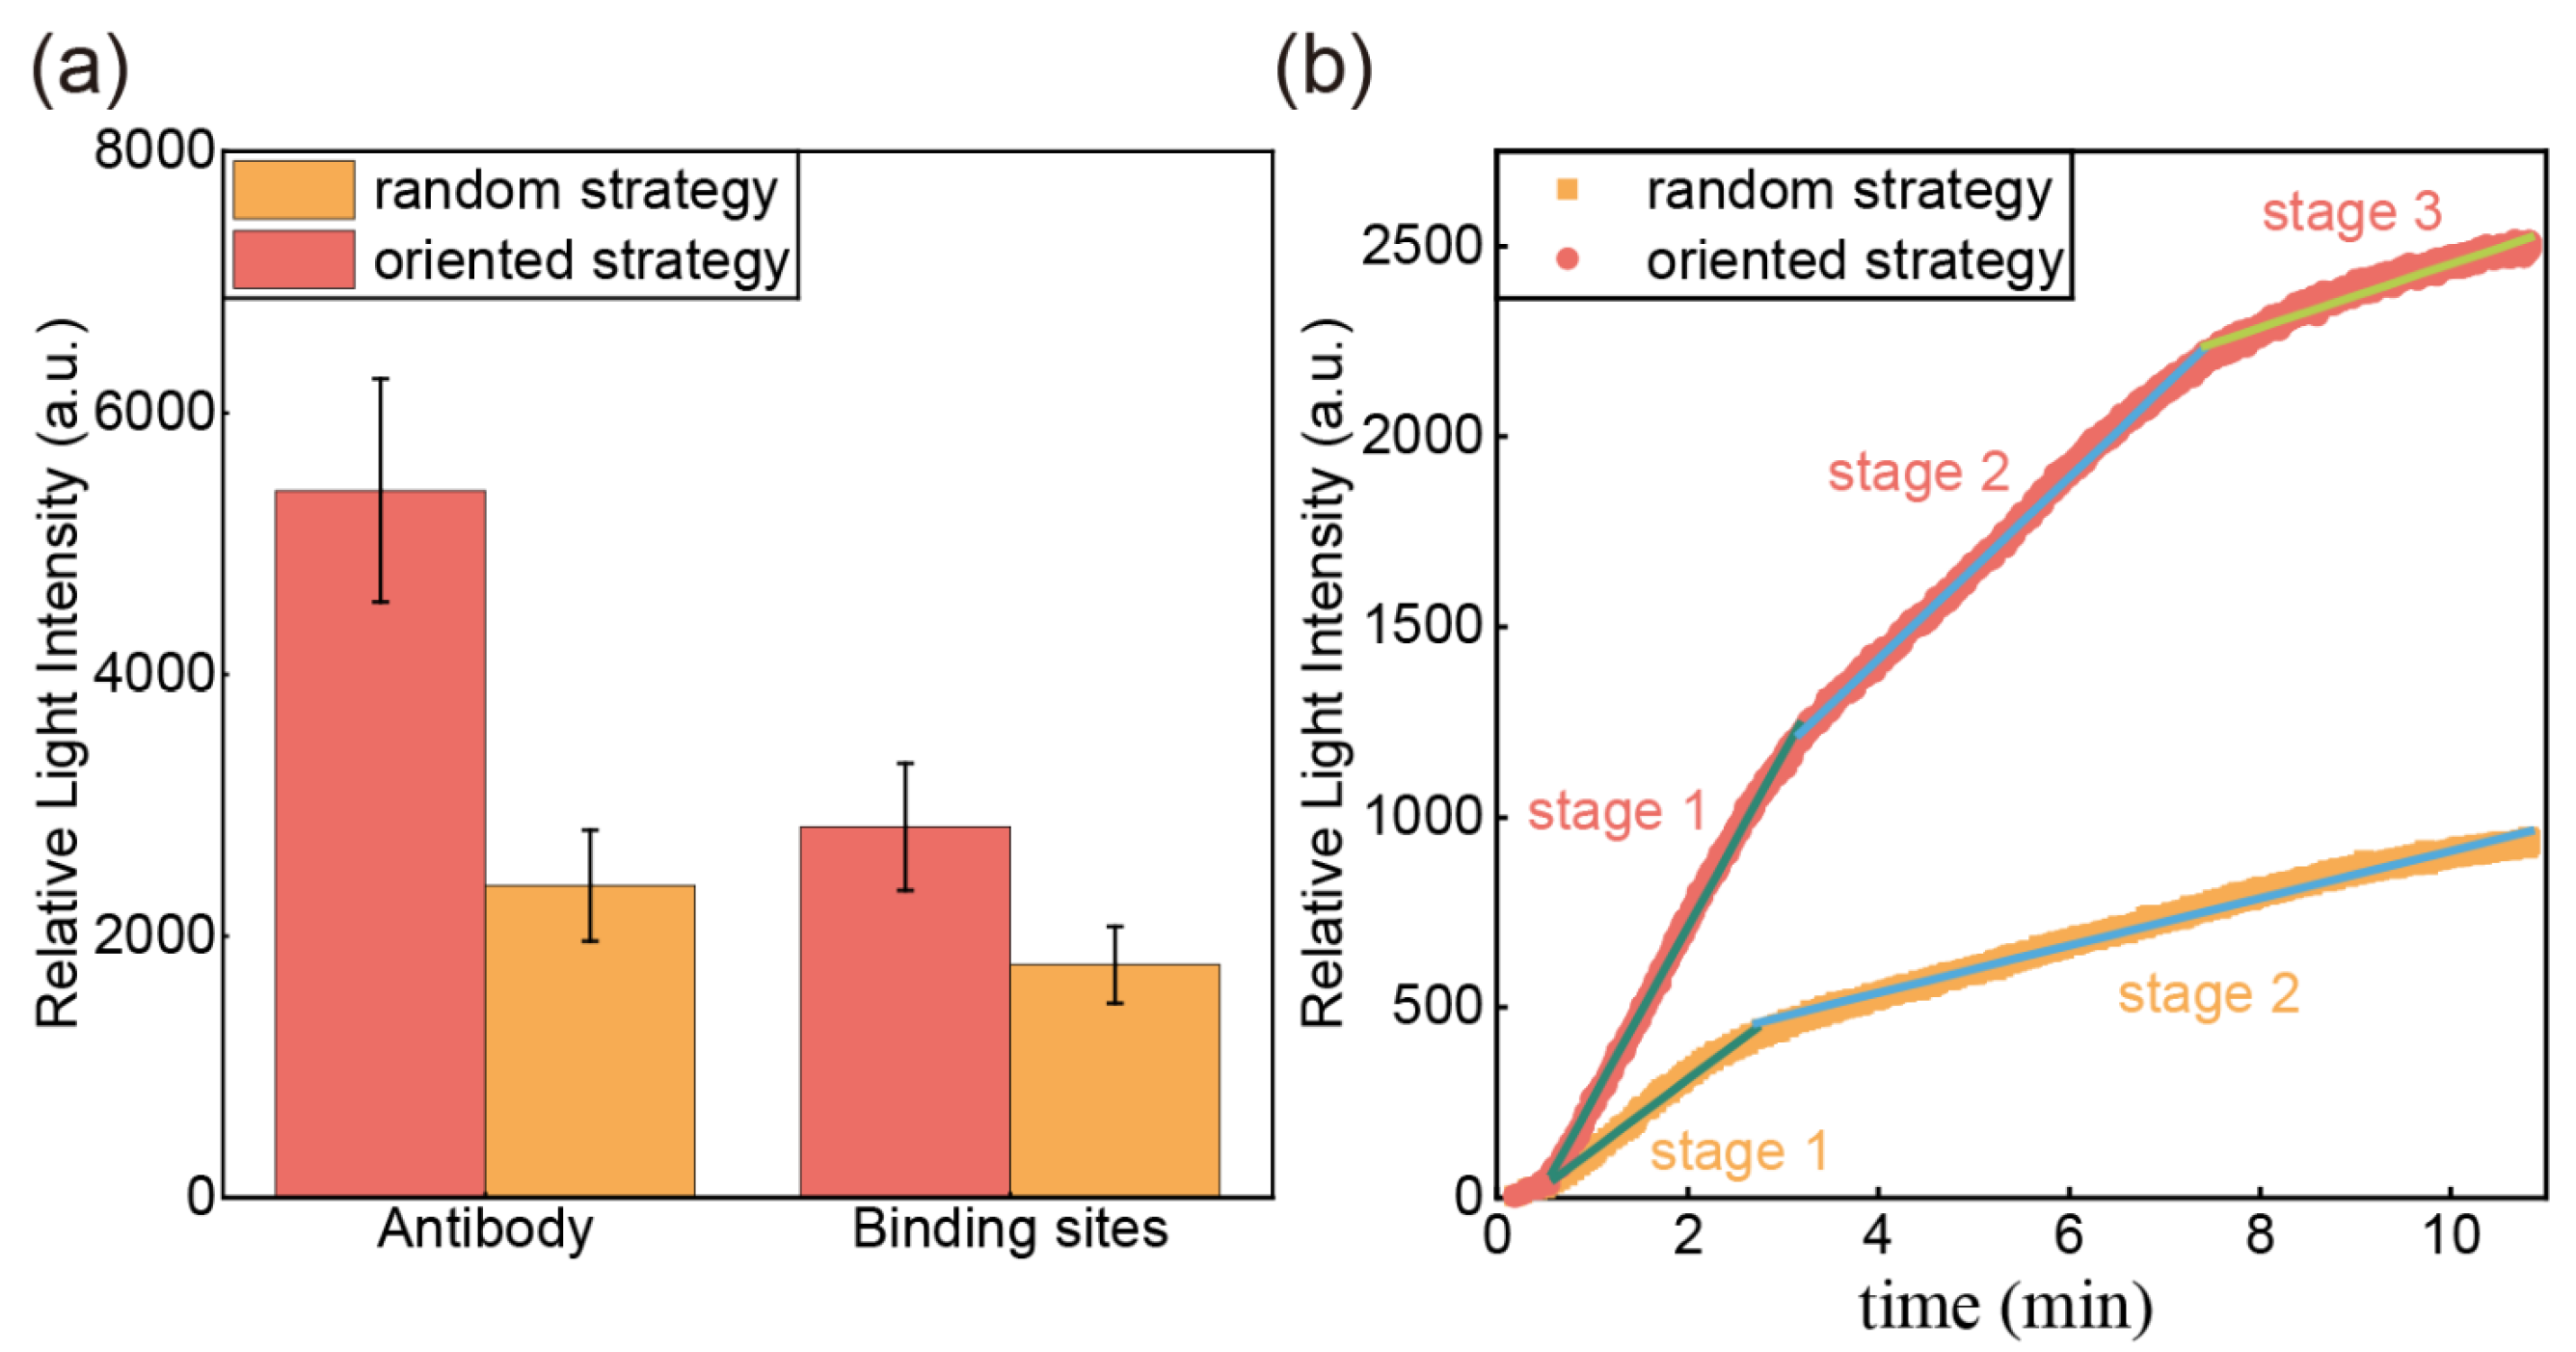
3.1. Comparison of Antibody Immobilization Strategies
3.2. WVA Response of Modification and Detection
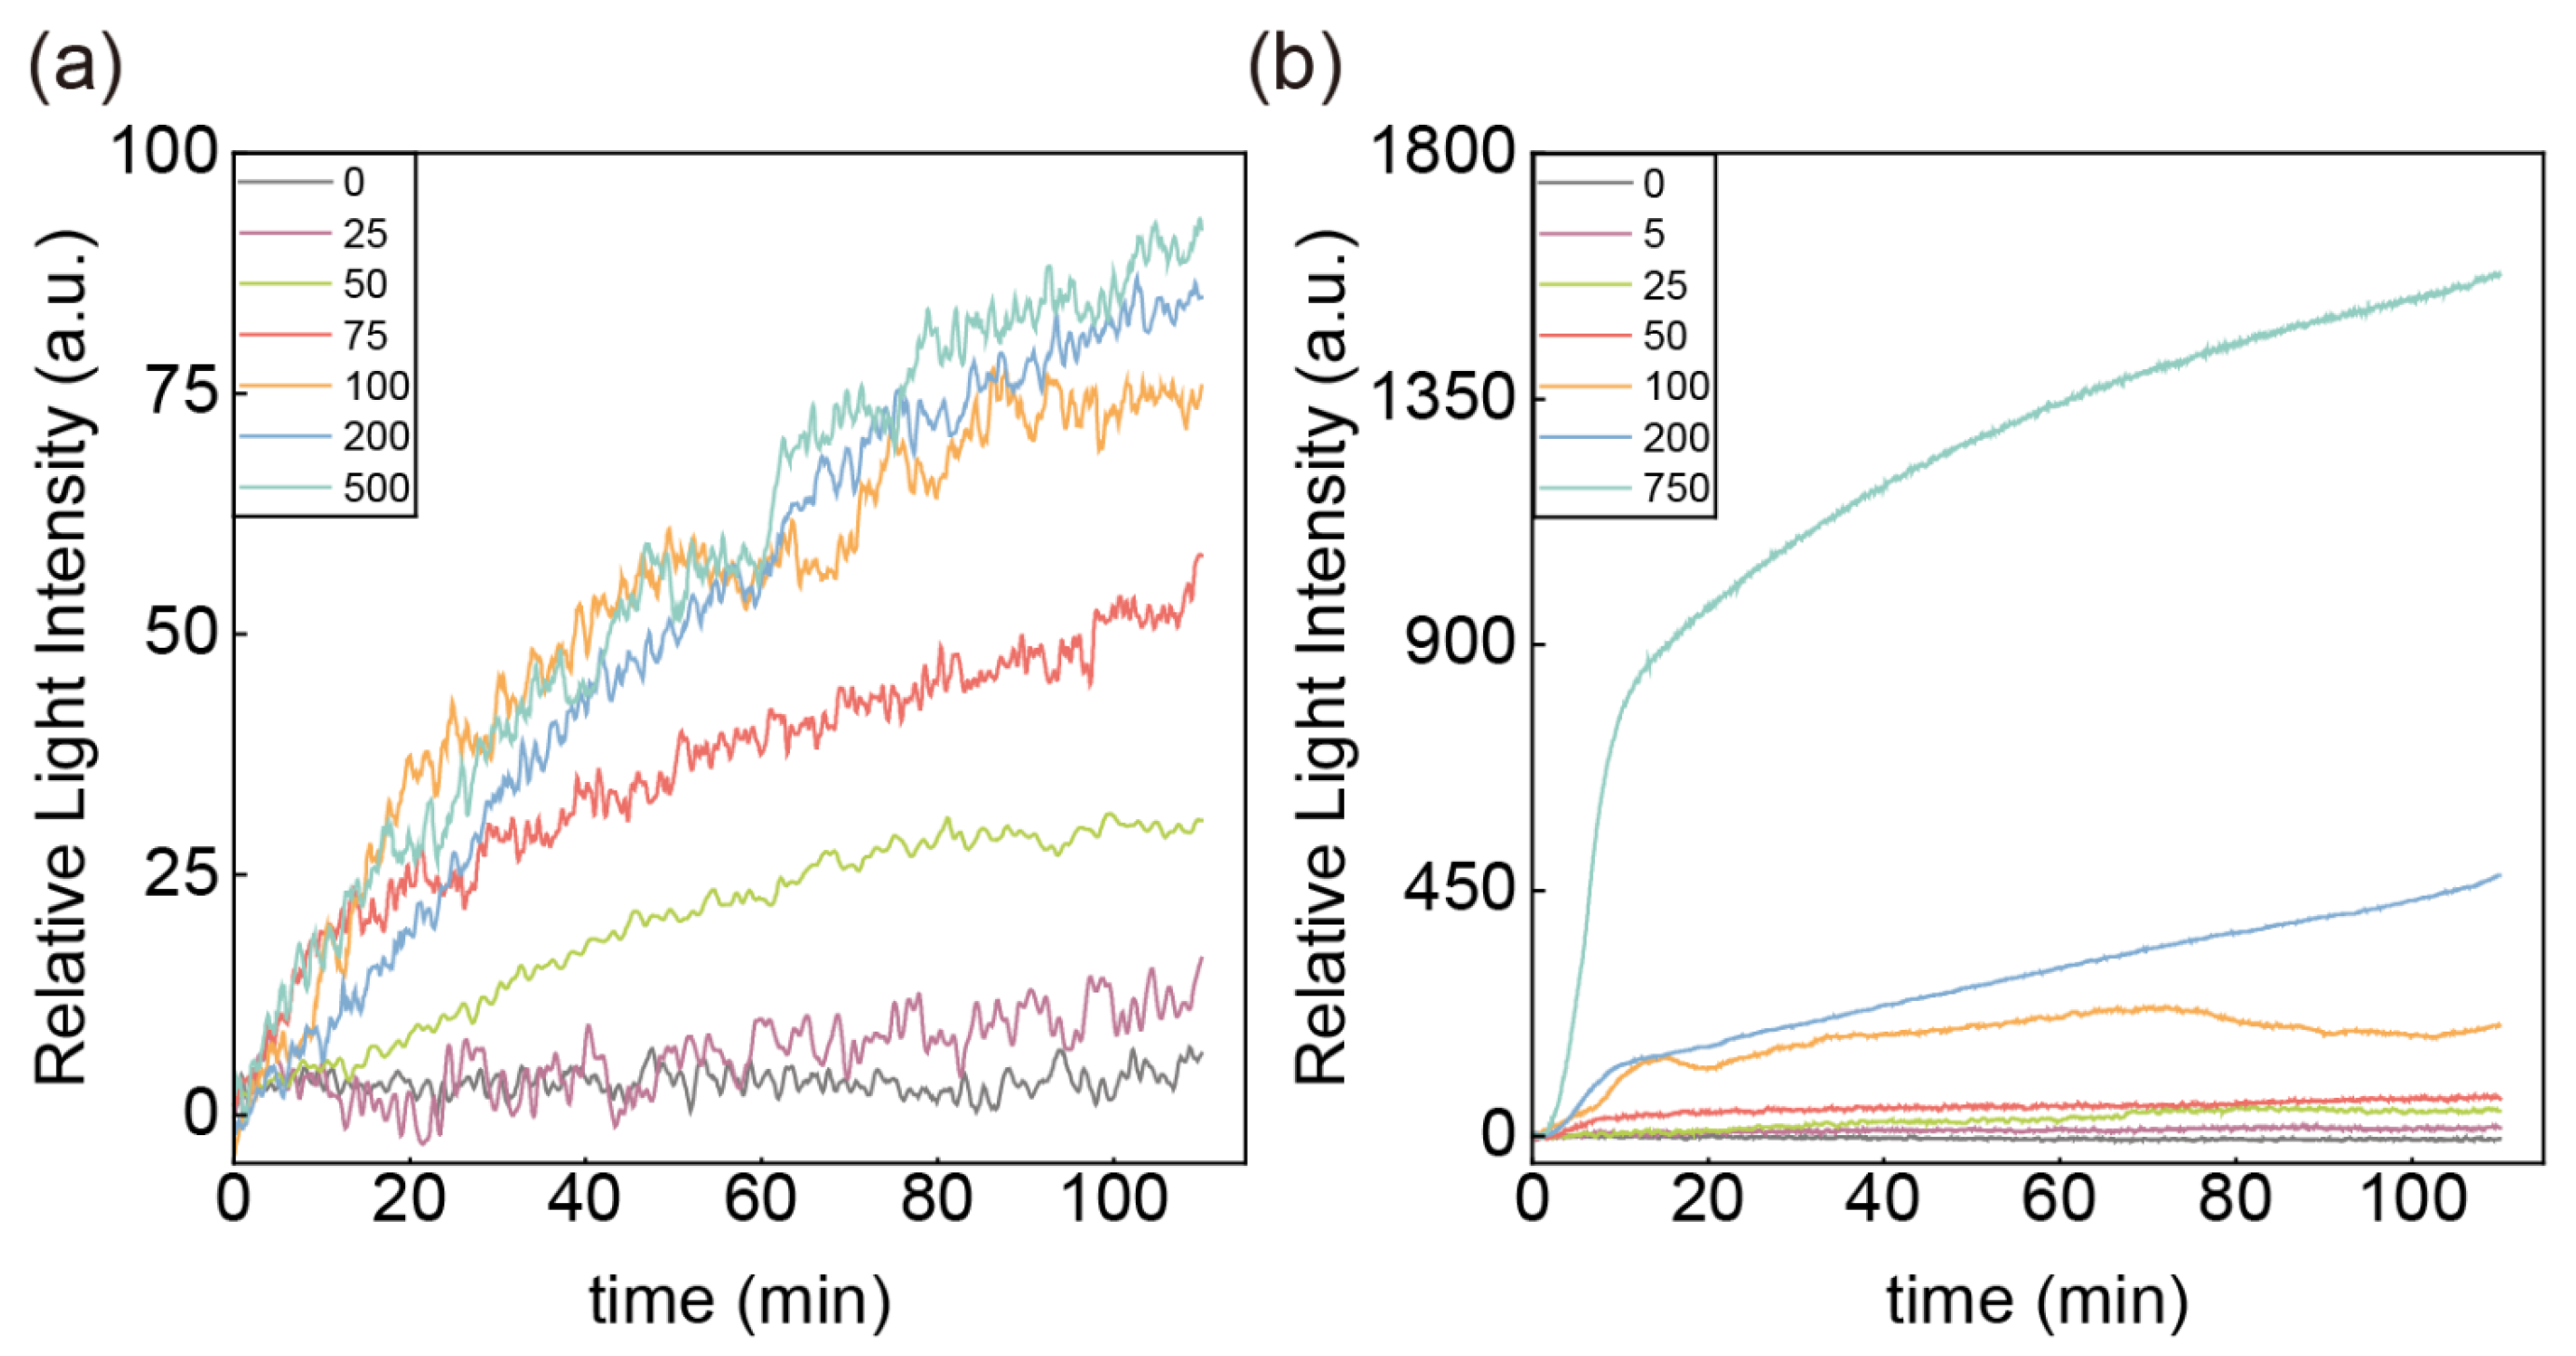
3.3. Performance Analysis of the CA125-HE4 Biosensor
3.4. Selectivity of the Sensor
4. Conclusions
Supplementary Materials
Author Contributions
Funding
Institutional Review Board Statement
Informed Consent Statement
Data Availability Statement
Acknowledgments
Conflicts of Interest
References
- Bray, F.; Laversanne, M.; Sung, H.; Ferlay, J.; Siegel, R.L.; Soerjomataram, I.; Jemal, A. Global cancer statistics 2022: Globocan estimates of incidence and mortality worldwide for 36 cancers in 185 countries. CA A Cancer J. Clin. 2024, 74, 229–263. [Google Scholar] [CrossRef] [PubMed]
- Ullah, M.F.; Aatif, M. The footprints of cancer development: Cancer biomarkers. Cancer Treat. Rev. 2009, 35, 193–200. [Google Scholar] [CrossRef] [PubMed]
- Hao, C.; Zhang, G.; Zhang, L. Chapter Eleven—Serum CEA levels in 49 different types of cancer and noncancer diseases. In Progress in Molecular Biology and Translational Science; Zhang, L., Ed.; Academic Press: Cambridge, MA, USA, 2019; Volume 162, pp. 213–227. [Google Scholar]
- Bast, R.C.; Feeney, M.; Lazarus, H.; Nadler, L.; Colvin, R.; Knapp, R. Reactivity of a monoclonal antibody with human ovarian carcinoma. J. Clin. Investig. 1981, 68, 1331–1337. [Google Scholar] [CrossRef]
- Jacobs, I.J.; Skates, S.; Davies, A.P.; Woolas, R.P.; Jeyerajah, A.; Weidemann, P.; Sibley, K.; Oram, D.H. Risk of diagnosis of ovarian cancer after raised serum CA 125 concentration: A prospective cohort study. bmj 1996, 313, 1355–1358. [Google Scholar] [CrossRef]
- Moore, R.G.; McMeekin, D.S.; Brown, A.K.; DiSilvestro, P.; Miller, M.C.; Allard, W.J.; Gajewski, W.; Kurman, R.; Bast, R.C.; Skates, S.J. A novel multiple marker bioassay utilizing HE4 and CA125 for the prediction of ovarian cancer in patients with a pelvic mass. Gynecol. Oncol. 2009, 112, 40–46. [Google Scholar] [CrossRef]
- Cymbaluk-Płoska, A.; Chudecka-Głaz, A.; Pius-Sadowska, E.; Machaliński, B.; Menkiszak, J.; Sompolska-Rzechuła, A. Suitability assessment of baseline concentration of MMP3, TIMP3, HE4 and CA125 in the serum of patients with ovarian cancer. J. Ovarian Res. 2018, 11, 1. [Google Scholar] [CrossRef]
- Lycke, M.; Kristjansdottir, B.; Sundfeldt, K. A multicenter clinical trial validating the performance of HE4, CA125, risk of ovarian malignancy algorithm and risk of malignancy index. Gynecol. Oncol. 2018, 151, 159–165. [Google Scholar] [CrossRef]
- Chen, F.; Jing, S.; Jianwei, W.; Pengwei, C.; Huang, Y. Clinical analysis of four serum tumor markers in 458 patients with ovarian tumors: Diagnostic value of the combined use of HE4, CA125, CA19-9, and CEA in ovarian tumors. Cancer Manag. Res. 2018, 10, 1313–1318. [Google Scholar] [CrossRef]
- Chudecka-Głaz, A.; Cymbaluk-Płoska, A.; Luterek-Puszyńska, K.; Menkiszak, J. Diagnostic usefulness of the Risk of Ovarian Malignancy Algorithm using the electrochemiluminescence immunoassay for HE4 and the chemiluminescence microparticle immunoassay for CA125. Oncol. Lett. 2016, 12, 3101–3114. [Google Scholar] [CrossRef]
- Park, Y.; Kim, Y.; Lee, E.Y.; Lee, J.-H.; Kim, H.-S. Reference ranges for HE4 and CA125 in a large Asian population by automated assays and diagnostic performances for ovarian cancer. Int. J. Cancer 2012, 130, 1136–1144. [Google Scholar] [CrossRef]
- Scholler, N.; Crawford, M.; Sato, A.; Drescher, C.W.; O’Briant, K.C.; Kiviat, N.; Anderson, G.L.; Urban, N. Bead-Based ELISA for Validation of Ovarian Cancer Early Detection Markers. Clin. Cancer Res. 2006, 12, 2117–2124. [Google Scholar] [CrossRef] [PubMed]
- Bilgi Kamaç, M.; Altun, M.; Yilmaz, M.; Sezgintürk, M.K. A label-free dual immunosensor for the simultaneous electrochemical determination of CA125 and HE4 biomarkers for the early diagnosis of ovarian cancer. Anal. Bioanal. Chem. 2023, 415, 1709–1718. [Google Scholar] [CrossRef] [PubMed]
- Bilgi Kamaç, M.; Altun, M.; Yılmaz, M.; Yılmaz Aktan, A.; Aktan, S.; Sezgintürk, M.K. Point-of-care testing: A disposable label-free electrochemical CA125 and HE4 immunosensors for early detection of ovarian cancer. Biomed. Microdevices 2023, 25, 18. [Google Scholar] [CrossRef]
- Szymanska, B.; Lukaszewski, Z.; Zelazowska-Rutkowska, B.; Hermanowicz-Szamatowicz, K.; Gorodkiewicz, E. An SPRi Biosensor for Determination of the Ovarian Cancer Marker HE4 in Human Plasma. Sensors 2021, 21, 3567. [Google Scholar] [CrossRef]
- Wu, Y.; Wang, C.; Wang, C.; Wang, P.; Chang, X.; Han, L.; Zhang, Y. Multiple Biomarker Simultaneous Detection in Serum via a Nanomaterial-Functionalized Biosensor for Ovarian Tumor/Cancer Diagnosis. Micromachines 2022, 13, 2046. [Google Scholar] [CrossRef] [PubMed]
- Aharonov, Y.; Albert, D.Z.; Vaidman, L. How the result of a measurement of a component of the spin of a spin-1/2 particle can turn out to be 100. Phys. Rev. Lett. 1988, 60, 1351. [Google Scholar] [CrossRef]
- Ritchie, N.; Story, J.G.; Hulet, R.G. Realization of a measurement of a “weak value”. Phys. Rev. Lett. 1991, 66, 1107. [Google Scholar] [CrossRef]
- Hosten, O.; Kwiat, P. Observation of the Spin Hall Effect of Light via Weak Measurements. Science 2008, 319, 787–790. [Google Scholar] [CrossRef]
- Dixon, P.B.; Starling, D.J.; Jordan, A.N.; Howell, J.C. Ultrasensitive beam deflection measurement via interferometric weak value amplification. Phys. Rev. Lett. 2009, 102, 173601. [Google Scholar] [CrossRef]
- Egan, P.; Stone, J.A. Weak-value thermostat with 0.2 mK precision. Opt. Lett. 2012, 37, 4991–4993. [Google Scholar] [CrossRef]
- Li, D.; Shen, Z.; He, Y.; Zhang, Y.; Chen, Z.; Ma, H. Application of quantum weak measurement for glucose concentration detection. Appl. Opt. 2016, 55, 1697–1702. [Google Scholar] [CrossRef] [PubMed]
- Li, D.; He, Q.; He, Y.; Xin, M.; Zhang, Y.; Shen, Z. Molecular imprinting sensor based on quantum weak measurement. Biosens. Bioelectron. 2017, 94, 328–334. [Google Scholar] [CrossRef] [PubMed]
- Xu, Y.; Zhou, C.; Li, D.; Guo, C.; Li, Z.; Xing, X.; Li, S.; Guan, T.; Liu, L.; He, Y. A stabilized weak measurement sensor for aptamer detection. Sens. Actuators B Chem. 2022, 371, 132509. [Google Scholar] [CrossRef]
- Xu, Y.; Zhou, C.; Shi, L.; Zhang, X.; Guan, T.; Guo, C.; Li, Z.; Xing, X.; Ji, Y.; Liu, L.; et al. Imaging Sensor for the Detection of the Flow Battery Via Weak Value Amplification. Anal. Chem. 2021, 93, 12914–12920. [Google Scholar] [CrossRef]
- Jung, Y.; Jeong, J.Y.; Chung, B.H. Recent advances in immobilization methods of antibodies on solid supports. Analyst 2008, 133, 697–701. [Google Scholar] [CrossRef]
- Jonkheijm, P.; Weinrich, D.; Schröder, H.; Niemeyer, C.M.; Waldmann, H. Chemical Strategies for Generating Protein Biochips. Angew. Chem. Int. Ed. 2008, 47, 9618–9647. [Google Scholar] [CrossRef]
- Seo, J.-s.; Lee, S.; Poulter, C.D. Regioselective covalent immobilization of recombinant antibody-binding proteins A, G, and L for construction of antibody arrays. J. Am. Chem. Soc. 2013, 135, 8973–8980. [Google Scholar] [CrossRef]
- Zhou, J.; Zeng, Y.; Wang, X.; Wu, C.; Cai, Z.; Gao, B.Z.; Gu, D.; Shao, Y. The capture of antibodies by antibody-binding proteins for ABO blood typing using SPR imaging-based sensing technology. Sens. Actuators B Chem. 2020, 304, 127391. [Google Scholar] [CrossRef]
- Sauer-Eriksson, A.E.; Kleywegt, G.J.; Uhlén, M.; Jones, T.A. Crystal structure of the C2 fragment of streptococcal protein G in complex with the Fc domain of human IgG. Structure 1995, 3, 265–278. [Google Scholar] [CrossRef]
- Bergström, G.; Mandenius, C.-F. Orientation and capturing of antibody affinity ligands: Applications to surface plasmon resonance biochips. Sens. Actuators B Chem. 2011, 158, 265–270. [Google Scholar] [CrossRef]
- Åkerström, B.; Björck, L. Protein L: An immunoglobulin light chain-binding bacterial protein: Characterization of binding and physicochemical properties. J. Biol. Chem. 1989, 264, 19740–19746. [Google Scholar] [CrossRef] [PubMed]
- Asuquo, E.; Martin, A.; Nzerem, P.; Siperstein, F.; Fan, X. Adsorption of Cd(II) and Pb(II) ions from aqueous solutions using mesoporous activated carbon adsorbent: Equilibrium, kinetics and characterisation studies. J. Environ. Chem. Eng. 2017, 5, 679–698. [Google Scholar] [CrossRef]
- Ahmadi, K.; Ghaedi, M.; Ansari, A. Comparison of nickel doped Zinc Sulfide and/or palladium nanoparticle loaded on activated carbon as efficient adsorbents for kinetic and equilibrium study of removal of Congo Red dye. Spectrochim. Acta Part A Mol. Biomol. Spectrosc. 2015, 136, 1441–1449. [Google Scholar] [CrossRef] [PubMed]
- Tran, L.-H.; Graulus, G.-J.; Vincke, C.; Smiejkowska, N.; Kindt, A.; Devoogdt, N.; Muyldermans, S.; Adriaensens, P.; Guedens, W. Nanobodies for the Early Detection of Ovarian Cancer. Int. J. Mol. Sci. 2022, 23, 13687. [Google Scholar] [CrossRef]
- Yavas, O.; Aćimović, S.S.; Garcia-Guirado, J.; Berthelot, J.; Dobosz, P.; Sanz, V.; Quidant, R. Self-Calibrating On-Chip Localized Surface Plasmon Resonance Sensing for Quantitative and Multiplexed Detection of Cancer Markers in Human Serum. ACS Sens. 2018, 3, 1376–1384. [Google Scholar] [CrossRef]
- Torati, S.R.; Kasturi, K.C.S.B.; Lim, B.; Kim, C. Hierarchical gold nanostructures modified electrode for electrochemical detection of cancer antigen CA125. Sens. Actuators B Chem. 2017, 243, 64–71. [Google Scholar] [CrossRef]
- Barr, C.E.; Njoku, K.; Owens, G.L.; Crosbie, E.J. Urine CA125 and HE4 for the detection of ovarian cancer in symptomatic women. Cancers 2023, 15, 1256. [Google Scholar] [CrossRef]
- Han, C.; Chen, R.; Wu, X.; Shi, N.; Duan, T.; Xu, K.; Huang, T. Fluorescence turn-on immunosensing of HE4 biomarker and ovarian cancer cells based on target-triggered metal-enhanced fluorescence of carbon dots. Anal. Chim. Acta 2021, 1187, 339160. [Google Scholar] [CrossRef]
- Gedi, V.; Song, C.K.; Kim, G.B.; Lee, J.O.; Oh, E.; Shin, B.S.; Jung, M.; Shim, J.; Lee, H.; Kim, Y.-P. Sensitive on-chip detection of cancer antigen 125 using a DNA aptamer/carbon nanotube network platform. Sens. Actuators B Chem. 2018, 256, 89–97. [Google Scholar] [CrossRef]
- Tang, Y.; Liu, Y.; Xia, Y.; Zhao, F.; Zeng, B. Simultaneous detection of ovarian cancer-concerned HE4 and CA125 markers based on Cu single-atom-triggered CdS QDs and Eu MOF@ Isoluminol ECL. Anal. Chem. 2023, 95, 4795–4802. [Google Scholar] [CrossRef]


| Kinetic Stages | Parameters | Oriented Strategy | Random Strategy |
|---|---|---|---|
| Surface diffusion | 454.1 | 187.3 | |
| R2 | 0.9967 | 0.9899 | |
| Intraparticle diffusion | 238.7 | 62.1 | |
| R2 | 0.9977 | 0.9907 | |
| 83.9 | / | ||
| R2 | 0.9652 | / |
| Adsorption Models | R2 | KD | 1/n | ||
|---|---|---|---|---|---|
| CA125 | Langmuir | 0.9086 | 113.1 | 83.9 | / |
| Freundlich | 0.7833 | 10.6 | / | 0.36 | |
| Sips | 0.9669 | 92.3 | 4290.8 | 2.05 | |
| HE4 | Langmuir | 0.9964 | 5734.7 | 2163.4 | / |
| Freundlich | 0.9943 | 4.2 | / | 0.88 | |
| Sips | 0.9996 | 2100.9 | 7523.4 | 1.48 |
| Mechanism | Material | LOD | Characteristic |
|---|---|---|---|
| ELISA [35] | Anti-CA125-HRP, TMB Nanobodies, AP conjugated | CA125: 5 U/mL HE4: 5.03 ng/mL | Pros: high-sensitivity, specificity |
| Cons: complex operation, no real-time monitor | |||
| Localized Surface Plasmon Resonance [36] | Gold nanorods | CA125: 138 U/mL | Pros: label-free, real-time monitor |
| Cons: complexity, high cost, dependence on precious metal coatings | |||
| Electrochemistry [13,37] | Gold nanoparticles | CA125: 5.5 U/mL HE4: 1.32 ng/mL | Pros: label-free, high-sensitivity Cons: high cost, dependence on precious |
| Chemiluminescent Enzyme Immunoassay [38] | Immunoassay reagent cartridge, chemiluminescent substrates | CA125: 35 U/mL HE4: 77 pmol/L | Pros: high-sensitivity, rapid results (20–30 min) Cons: high cost, special enzyme-labeled antibodies and substrates required |
| Fluorescence enhancement immunosensor [39] | Fluorescent CDs, Anti-HE4-labeled AgNPs | HE4: 2.3 pM | Pros: enhanced sensitivity through signal amplification Cons: high cost, susceptible to background fluorescence and photobleaching |
| Aptamer-based biosensor [40] | ssDNA, 3DN-CNT, GO | CA125: 10 pg/mL | Pros: high-sensitivity, specificity, label-free Cons: high production cost and lengthy fabrication process, difficulty in obtaining suitable aptamers |
| Dual-electrode ECL Immunoassay [41] | Gold nanoparticles, CdS quantum dots | CA125: 0.37 pg/mL HE4: 1.58 pg/mL | Pros: high-sensitivity, wide dynamic range Cons: complexity, high cost, long assay time |
| Weak Value Amplification | / | CA125: 5.39 U/mL HE4: 1.79 ng/mL | Pros: label-free, low cost, real-time monitor, easy operation, without precious metal coatings or nanostructures |
Disclaimer/Publisher’s Note: The statements, opinions and data contained in all publications are solely those of the individual author(s) and contributor(s) and not of MDPI and/or the editor(s). MDPI and/or the editor(s) disclaim responsibility for any injury to people or property resulting from any ideas, methods, instructions or products referred to in the content. |
© 2025 by the authors. Licensee MDPI, Basel, Switzerland. This article is an open access article distributed under the terms and conditions of the Creative Commons Attribution (CC BY) license (https://creativecommons.org/licenses/by/4.0/).
Share and Cite
Wang, B.; Liang, G.; Meng, L.; Li, H.; Song, Z.; Xu, Y.; He, Y.; Duan, D.; Shi, Q.; Guan, T.; et al. A Dual Immunosensor Based on Optical Weak Value Amplification for Simultaneous Detection of CA125 and HE4. Sensors 2025, 25, 3347. https://doi.org/10.3390/s25113347
Wang B, Liang G, Meng L, Li H, Song Z, Xu Y, He Y, Duan D, Shi Q, Guan T, et al. A Dual Immunosensor Based on Optical Weak Value Amplification for Simultaneous Detection of CA125 and HE4. Sensors. 2025; 25(11):3347. https://doi.org/10.3390/s25113347
Chicago/Turabian StyleWang, Bei, Gengyu Liang, Lingqin Meng, Han Li, Zishuo Song, Yang Xu, Yonghong He, Deling Duan, Qiuxia Shi, Tian Guan, and et al. 2025. "A Dual Immunosensor Based on Optical Weak Value Amplification for Simultaneous Detection of CA125 and HE4" Sensors 25, no. 11: 3347. https://doi.org/10.3390/s25113347
APA StyleWang, B., Liang, G., Meng, L., Li, H., Song, Z., Xu, Y., He, Y., Duan, D., Shi, Q., Guan, T., & Gong, Y. (2025). A Dual Immunosensor Based on Optical Weak Value Amplification for Simultaneous Detection of CA125 and HE4. Sensors, 25(11), 3347. https://doi.org/10.3390/s25113347