

Ultrasonic Beamforming-Based Visual Localisation of Minor and Multiple Gas Leaks Using a Microelectromechanical System (MEMS) Microphone Array


Abstract
Highlights
- A universal, non-contact ultrasonic imaging method was developed for real-time gas leak detection and localisation in pressure vessels, pipelines, valves, and connectors.The proposed system achieved high-precision localisation (0.68 cm error at 1 m) and detected minor leaks as small as 24 mL/min while distinguishing multiple leak sources.
- The method enhances industrial and environmental safety by providing an effective, scalable solution for detecting and visualising gas leaks.Its integration into embedded systems enables real-time monitoring, supporting predictive maintenance and reducing the risk of hazardous incidents
Abstract
1. Introduction
2. Materials and Methods
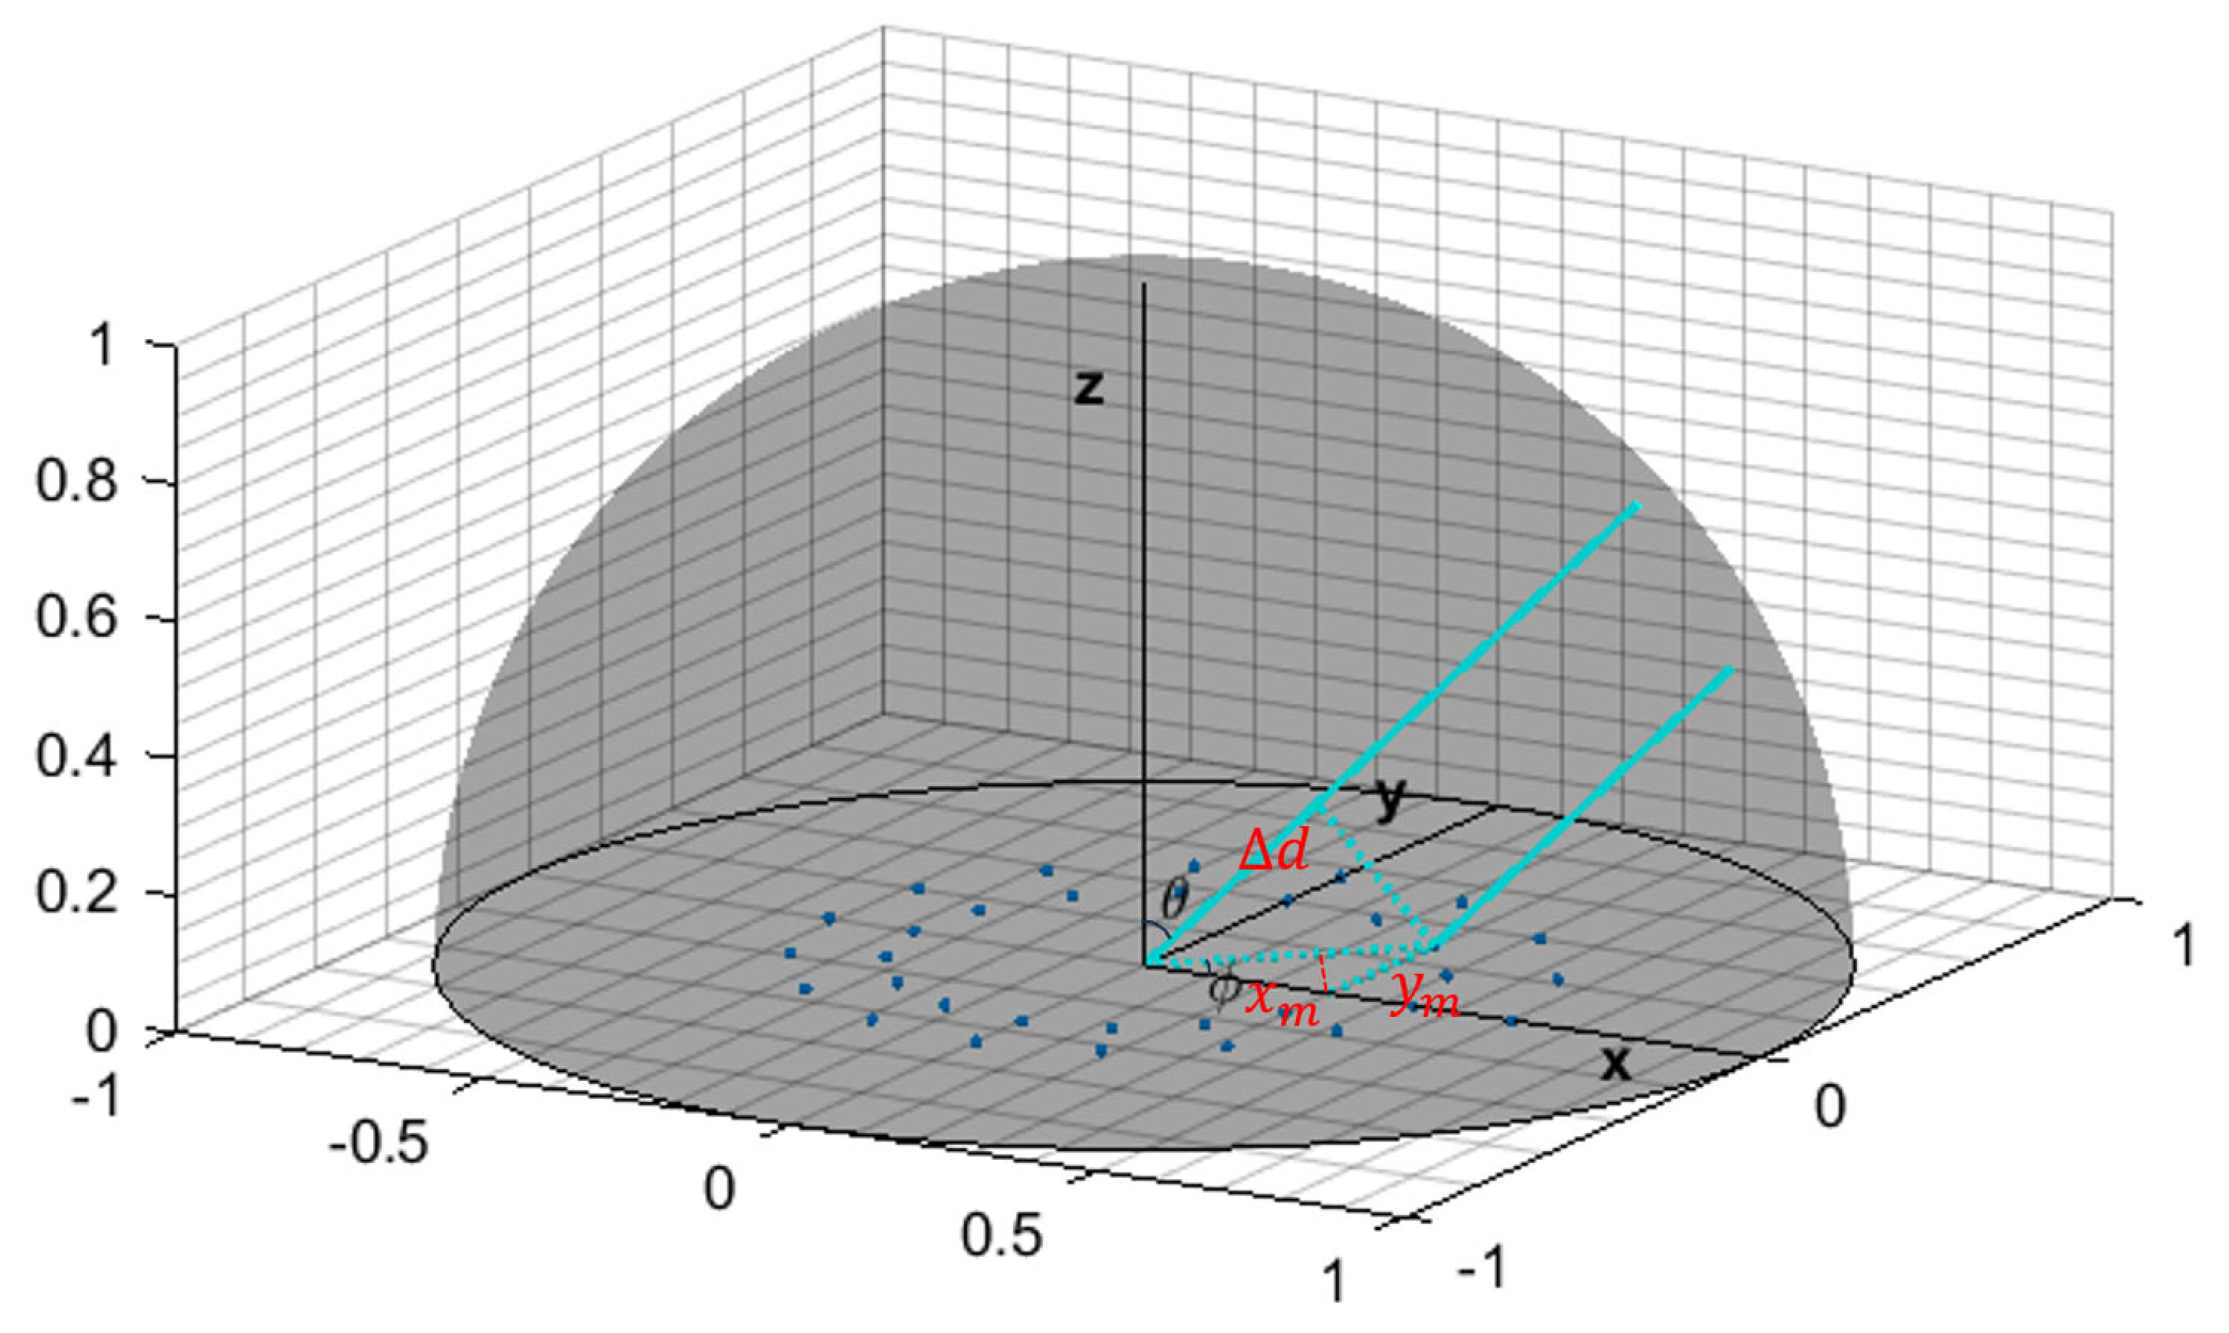
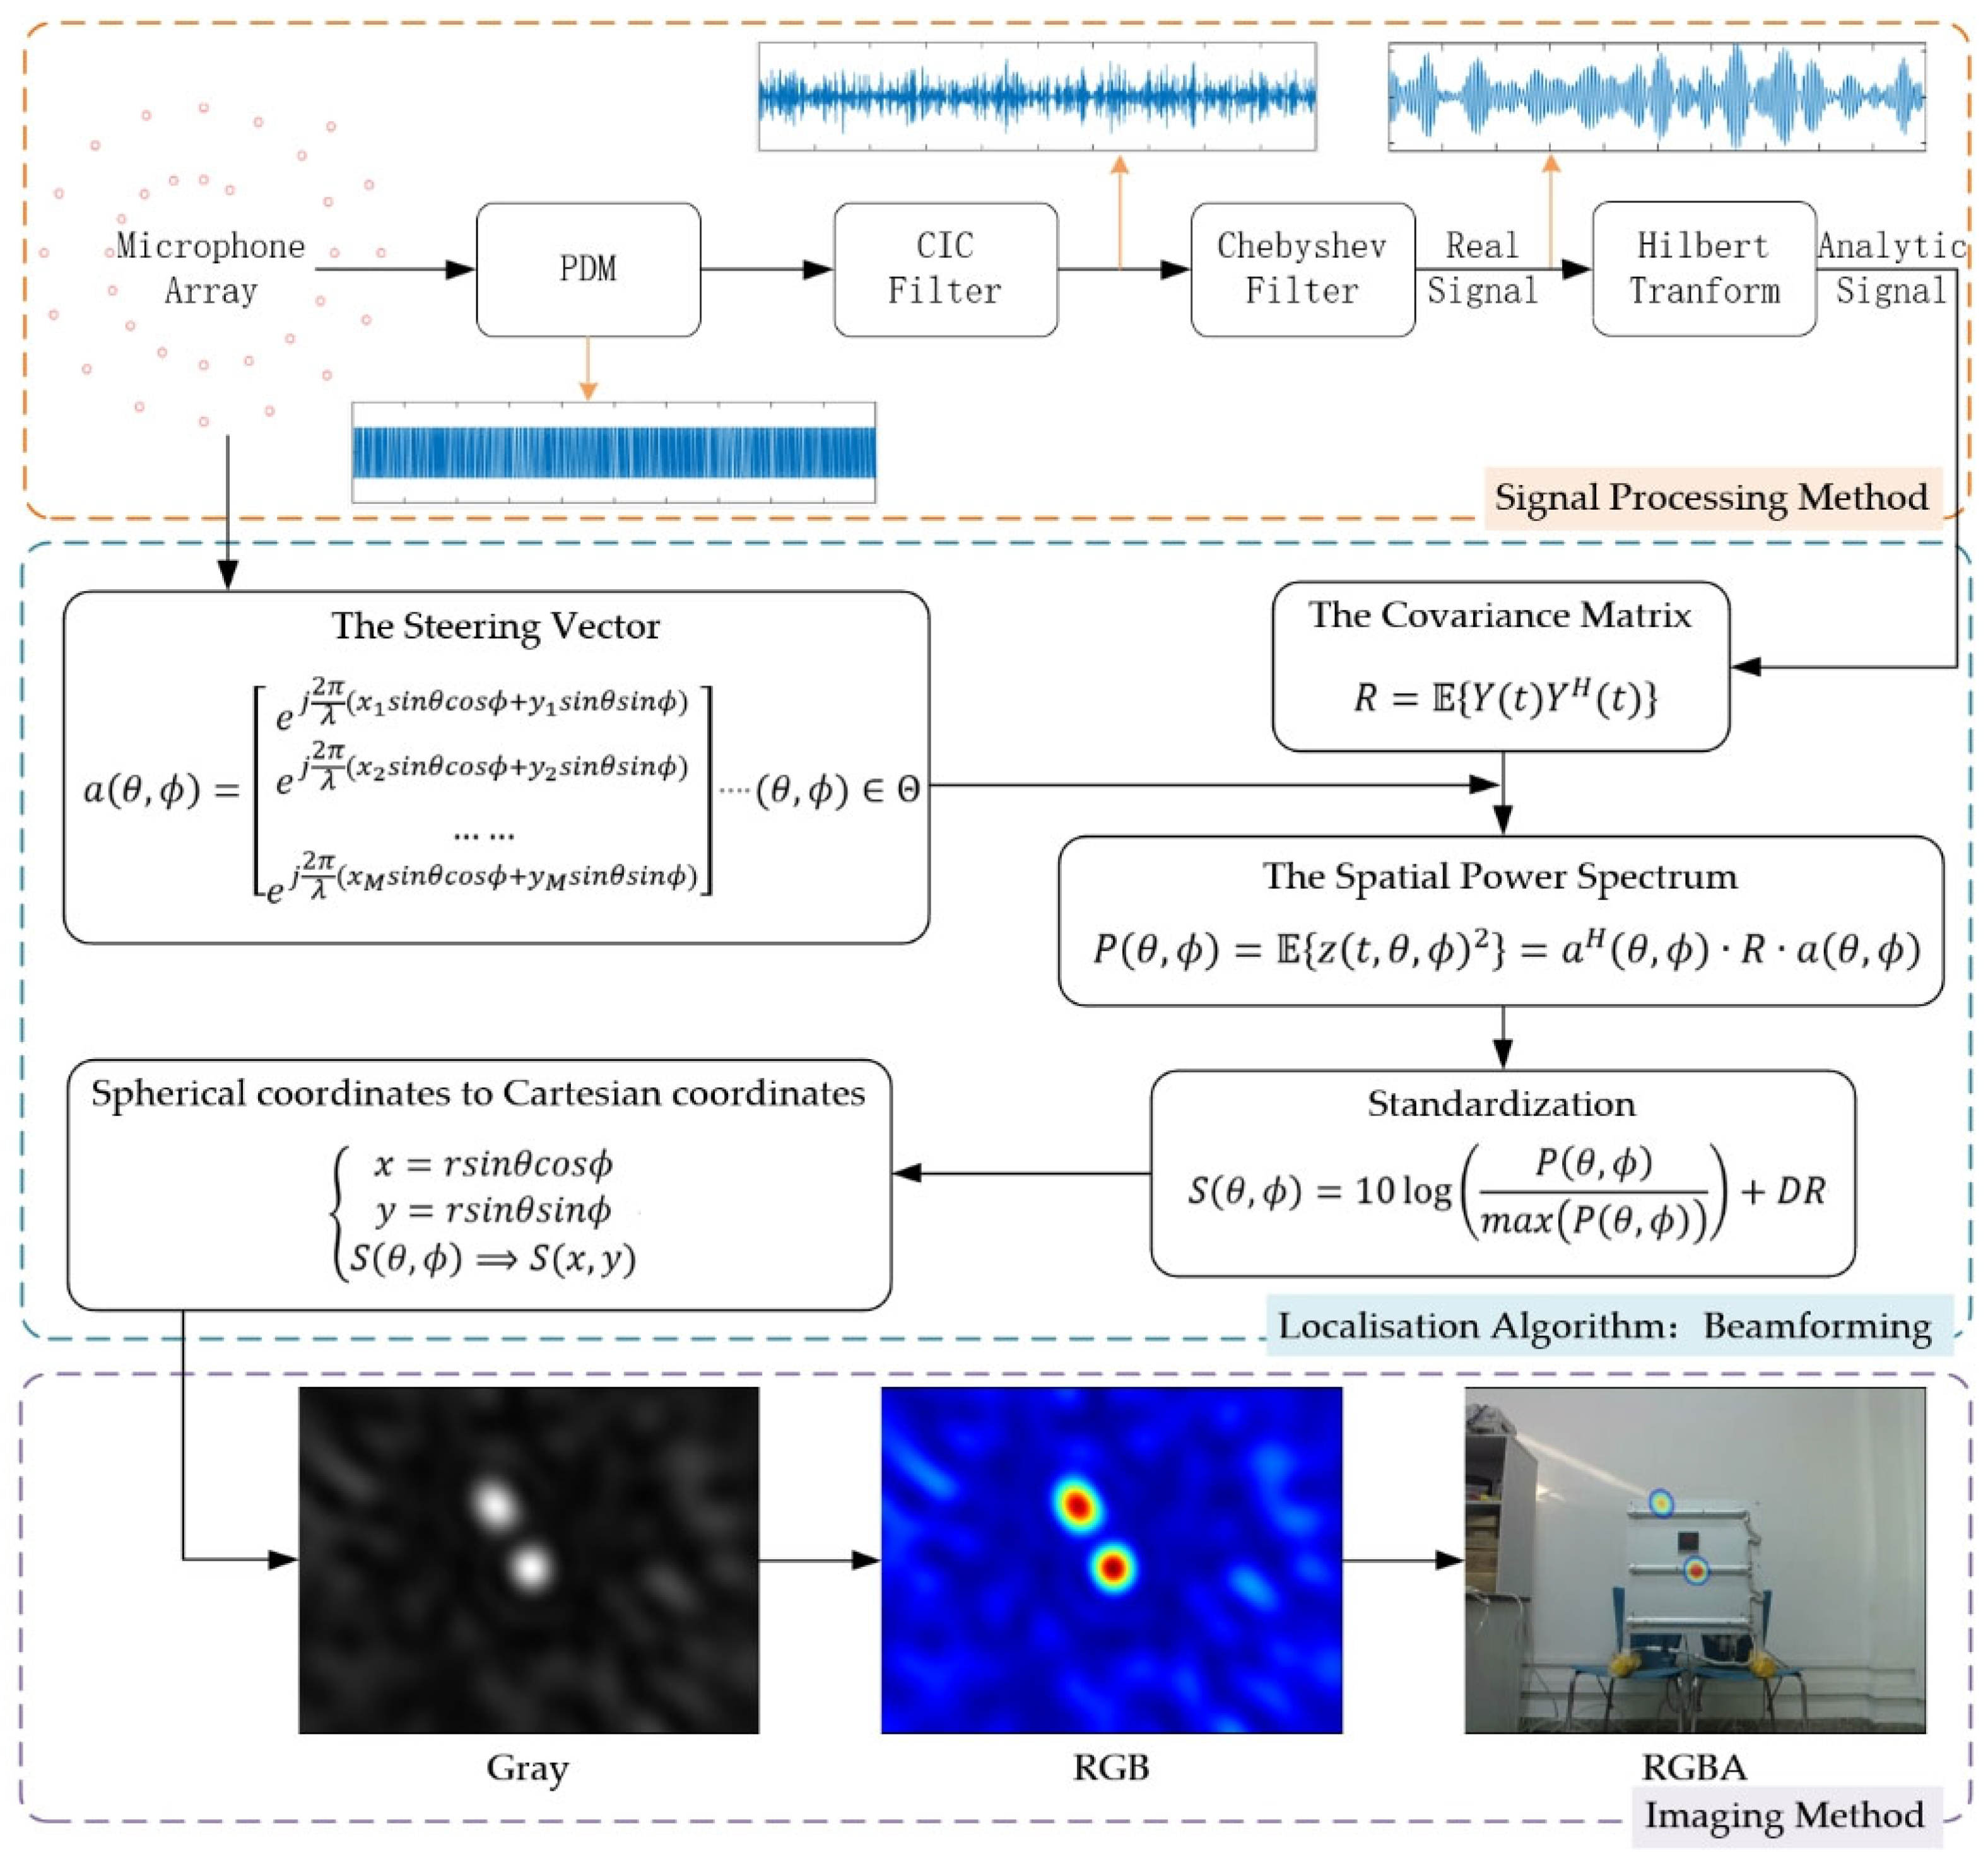
2.1. Localisation Algorithm
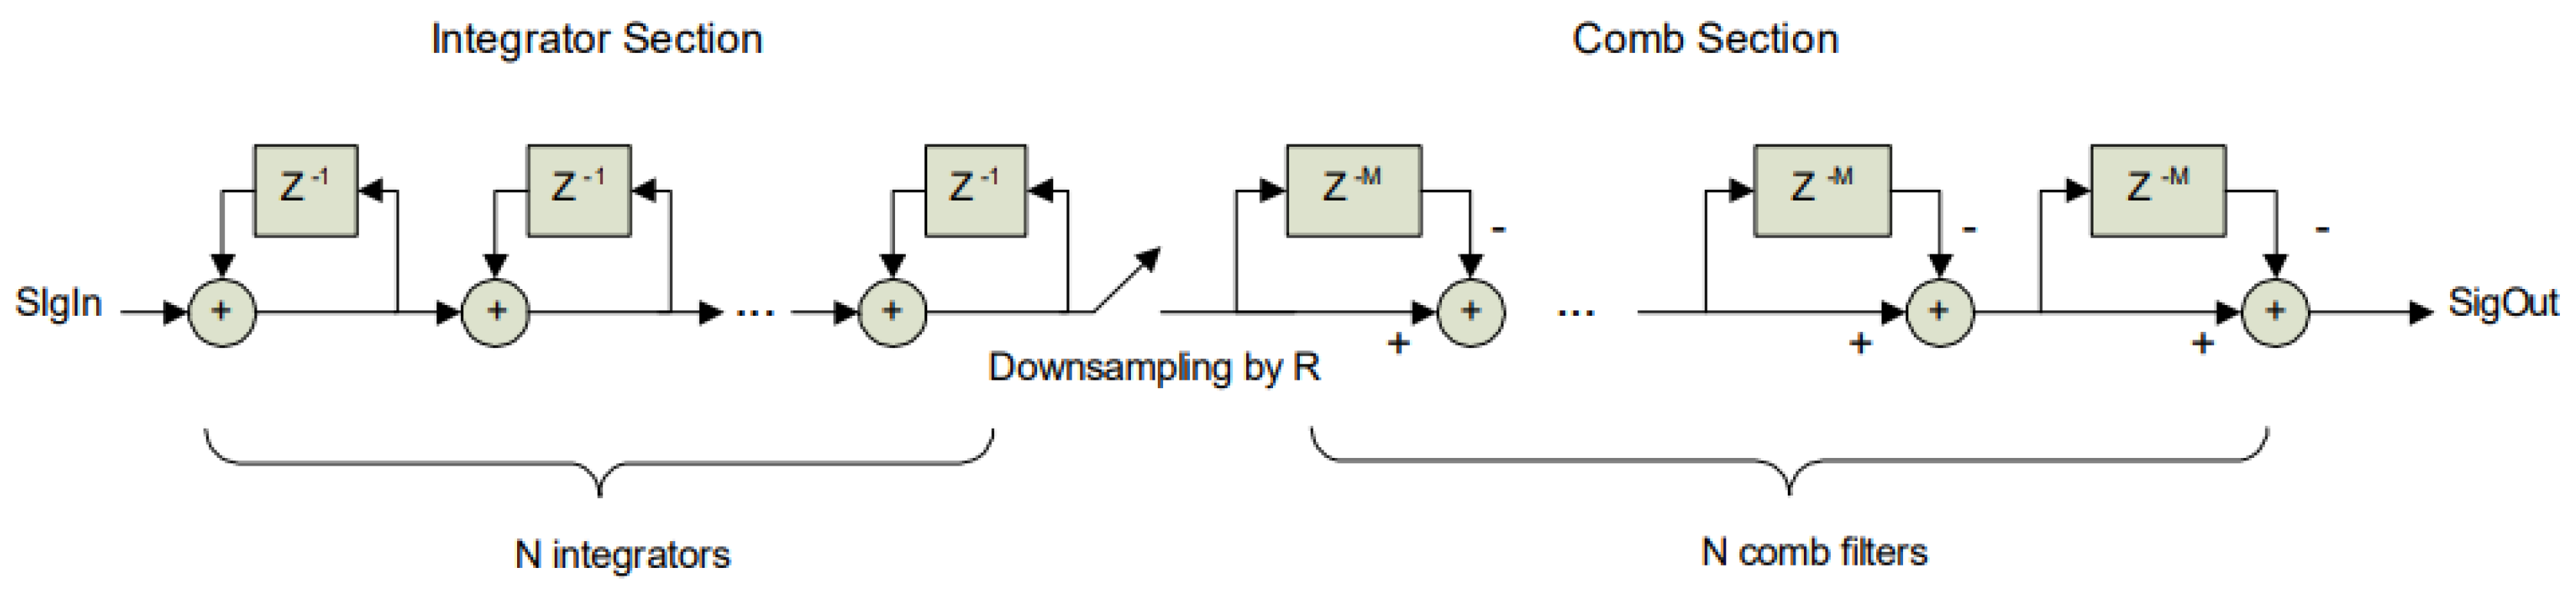
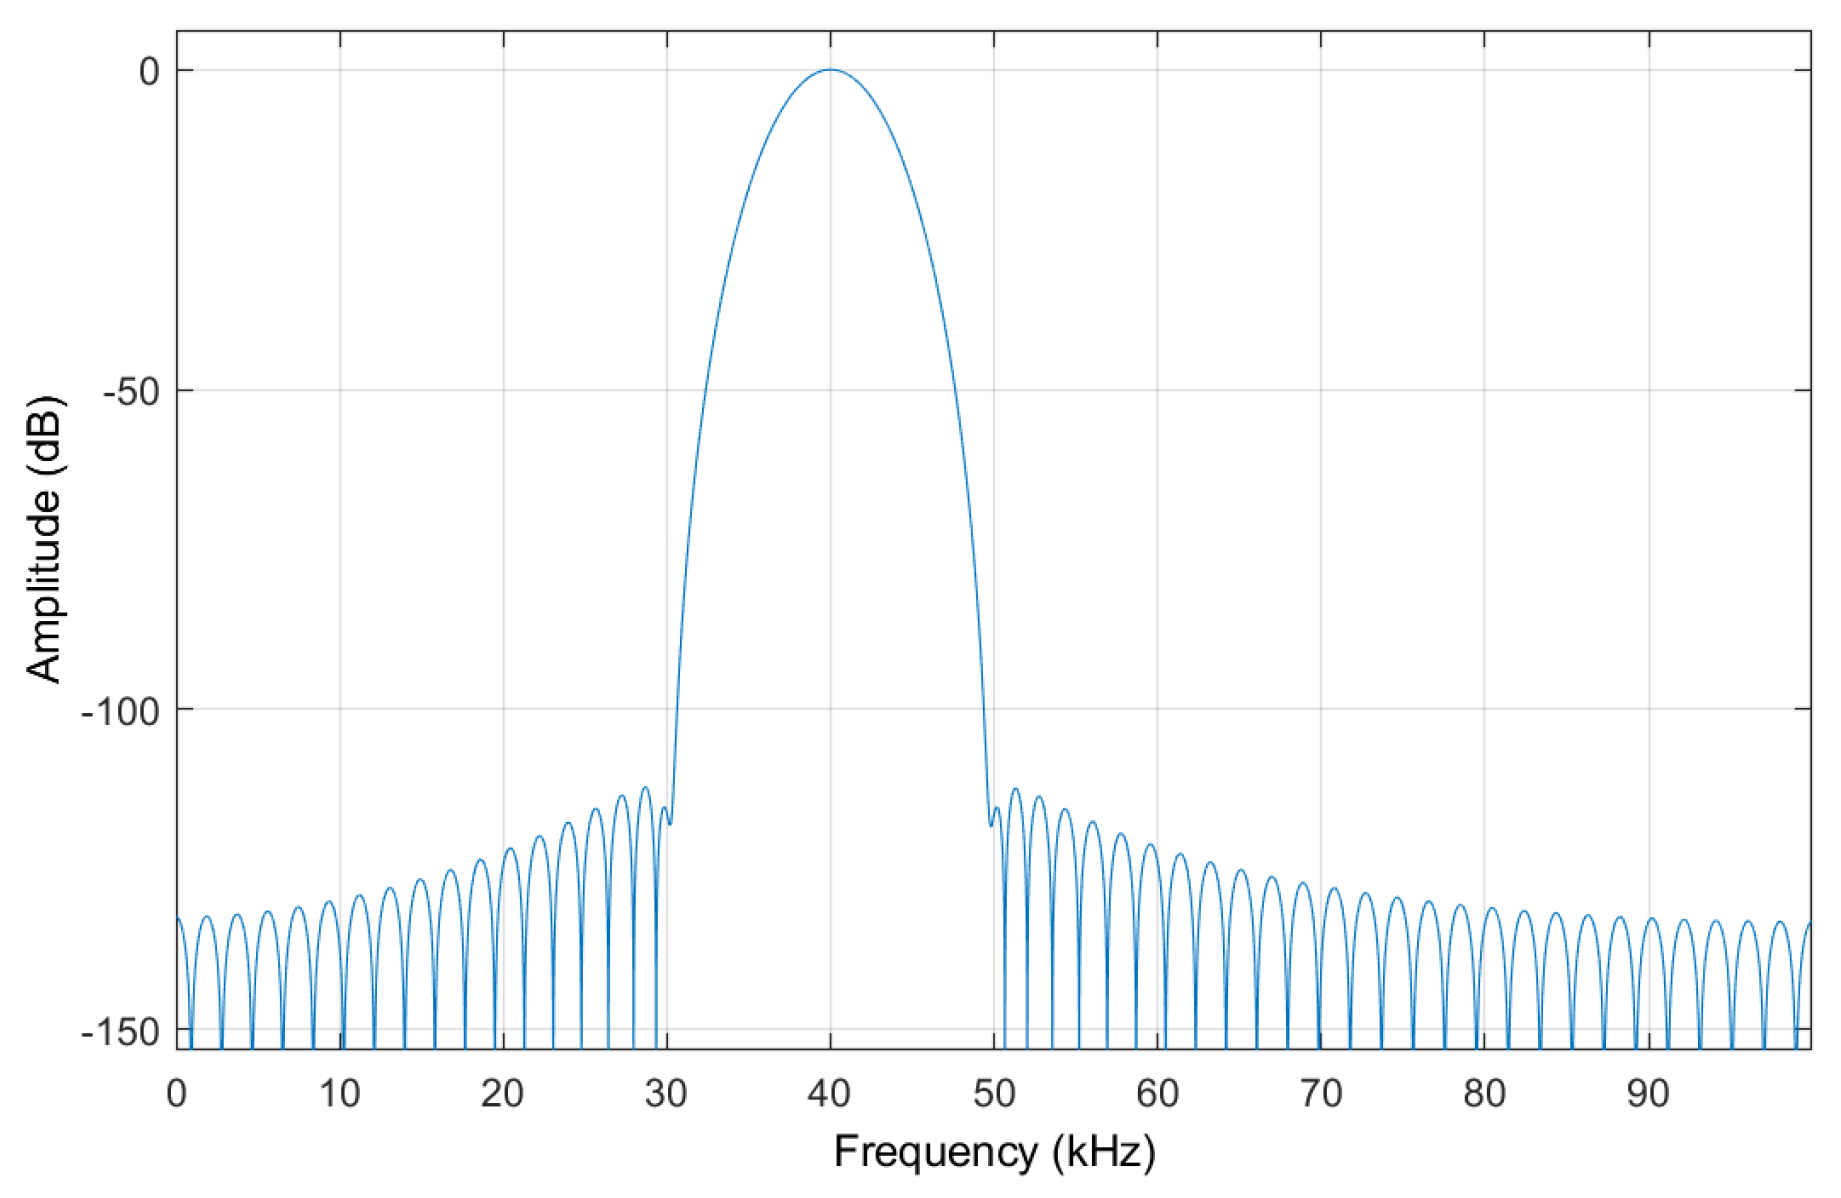
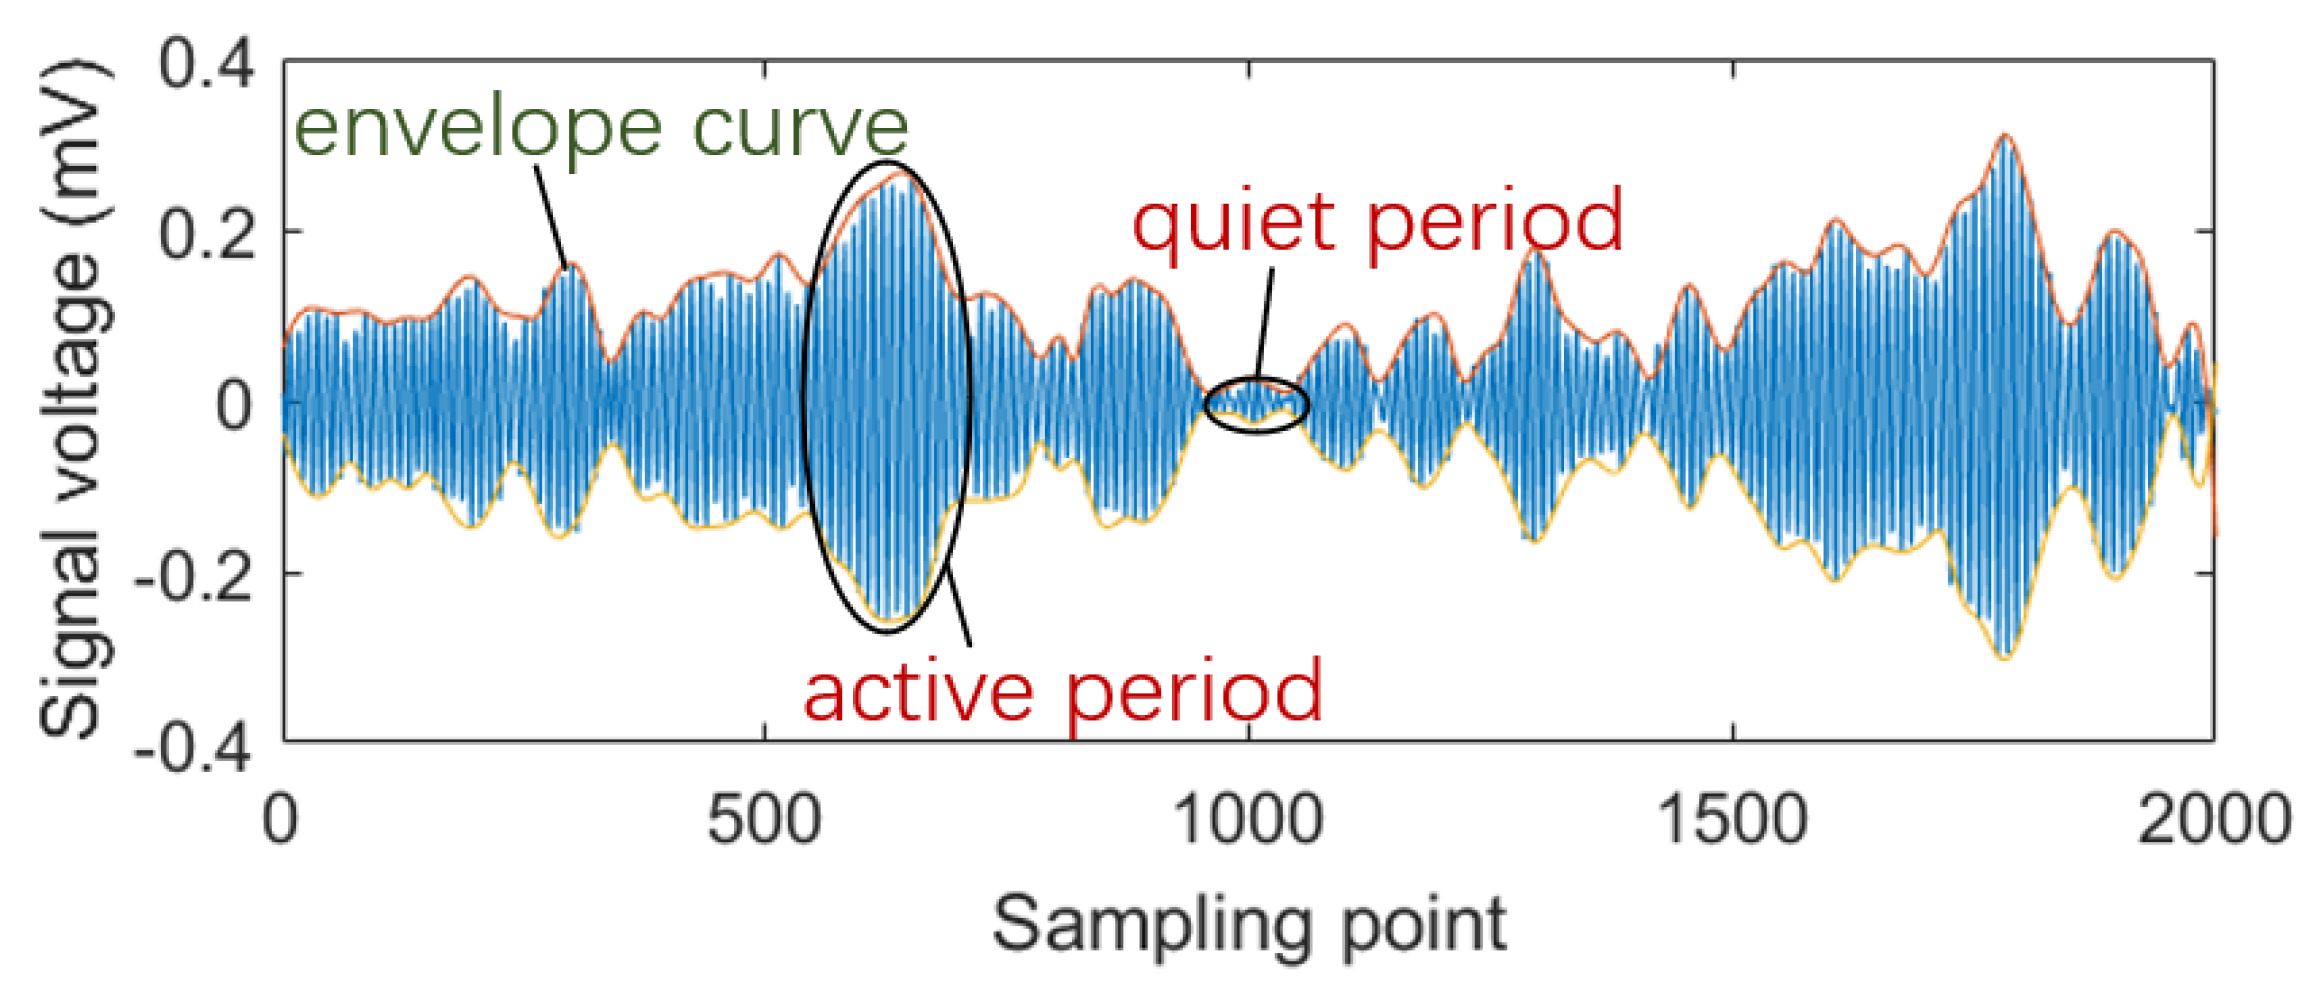
2.2. Signal Processing Method
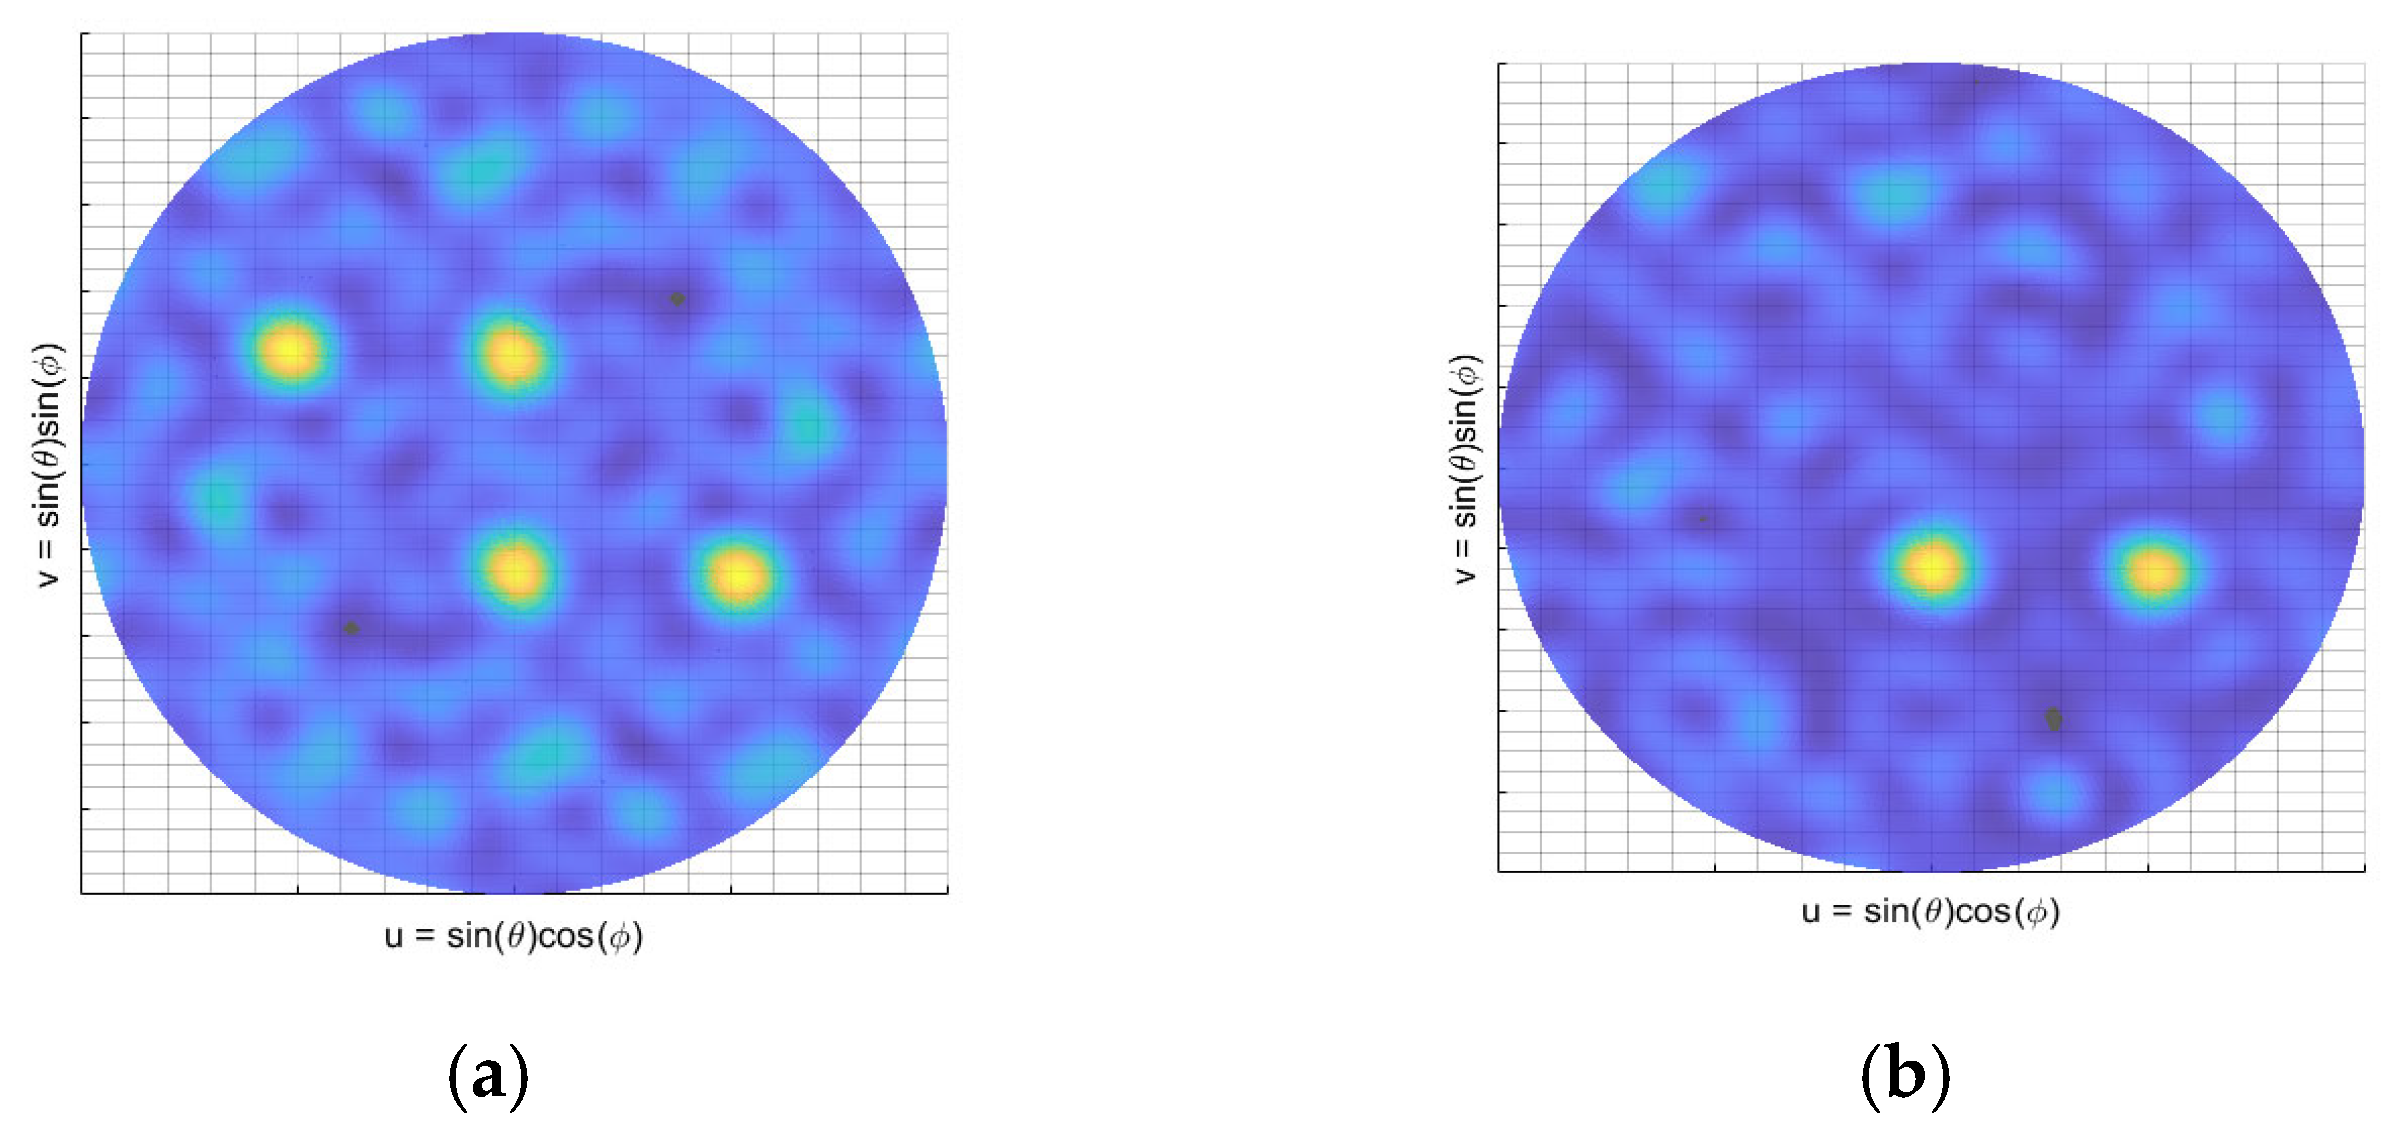
2.3. Imaging Method
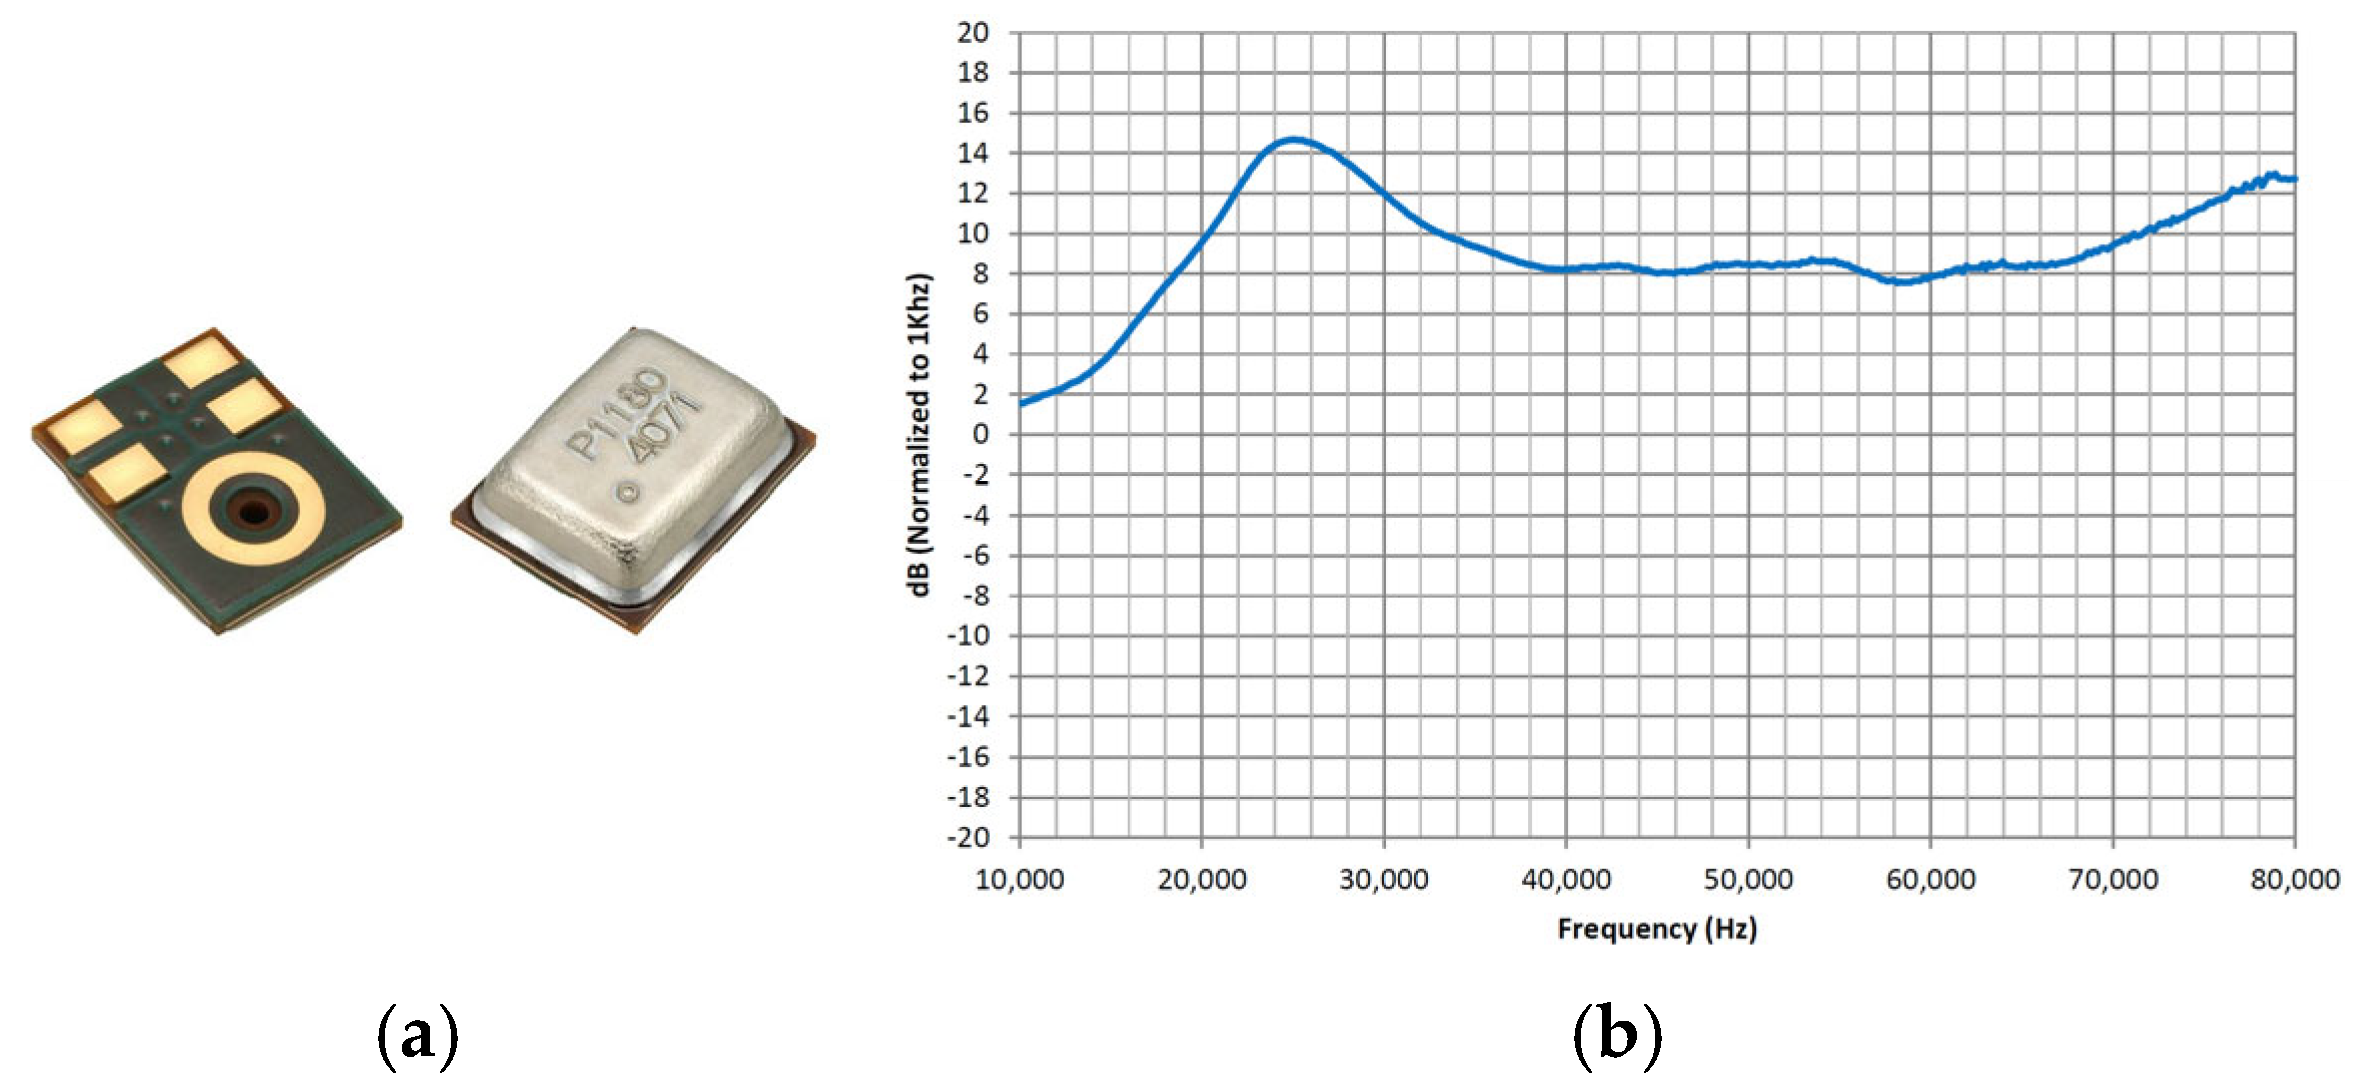
3. Array Design
4. Experiments and Results
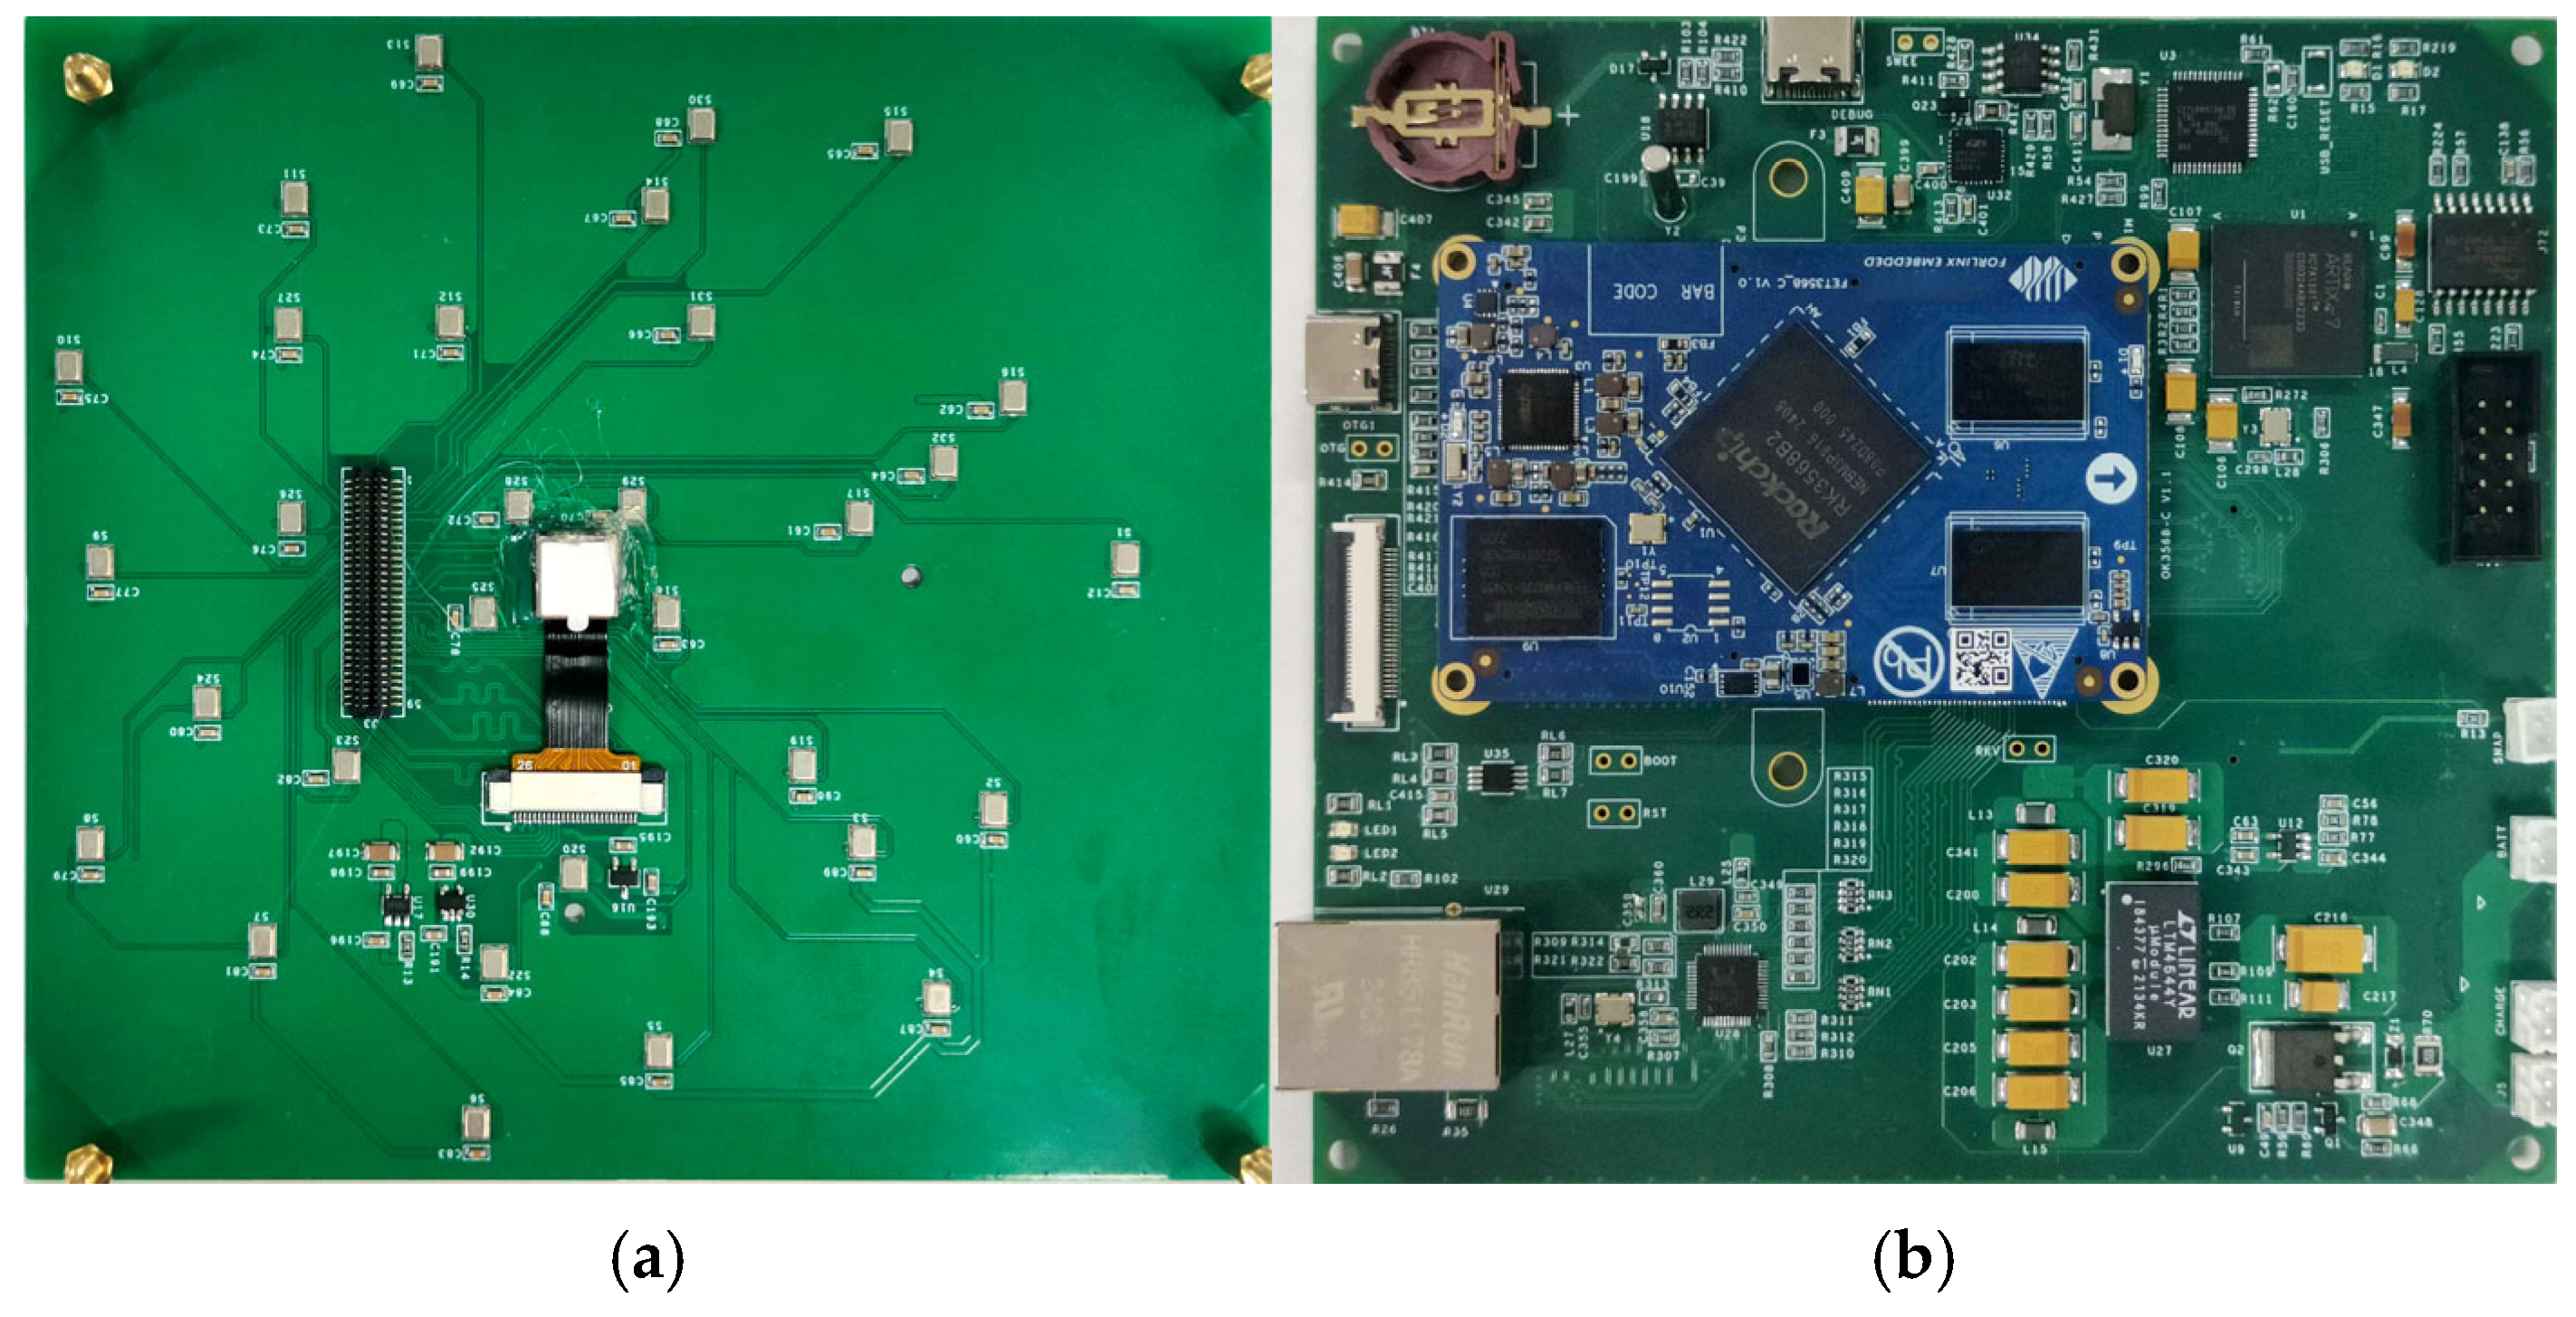
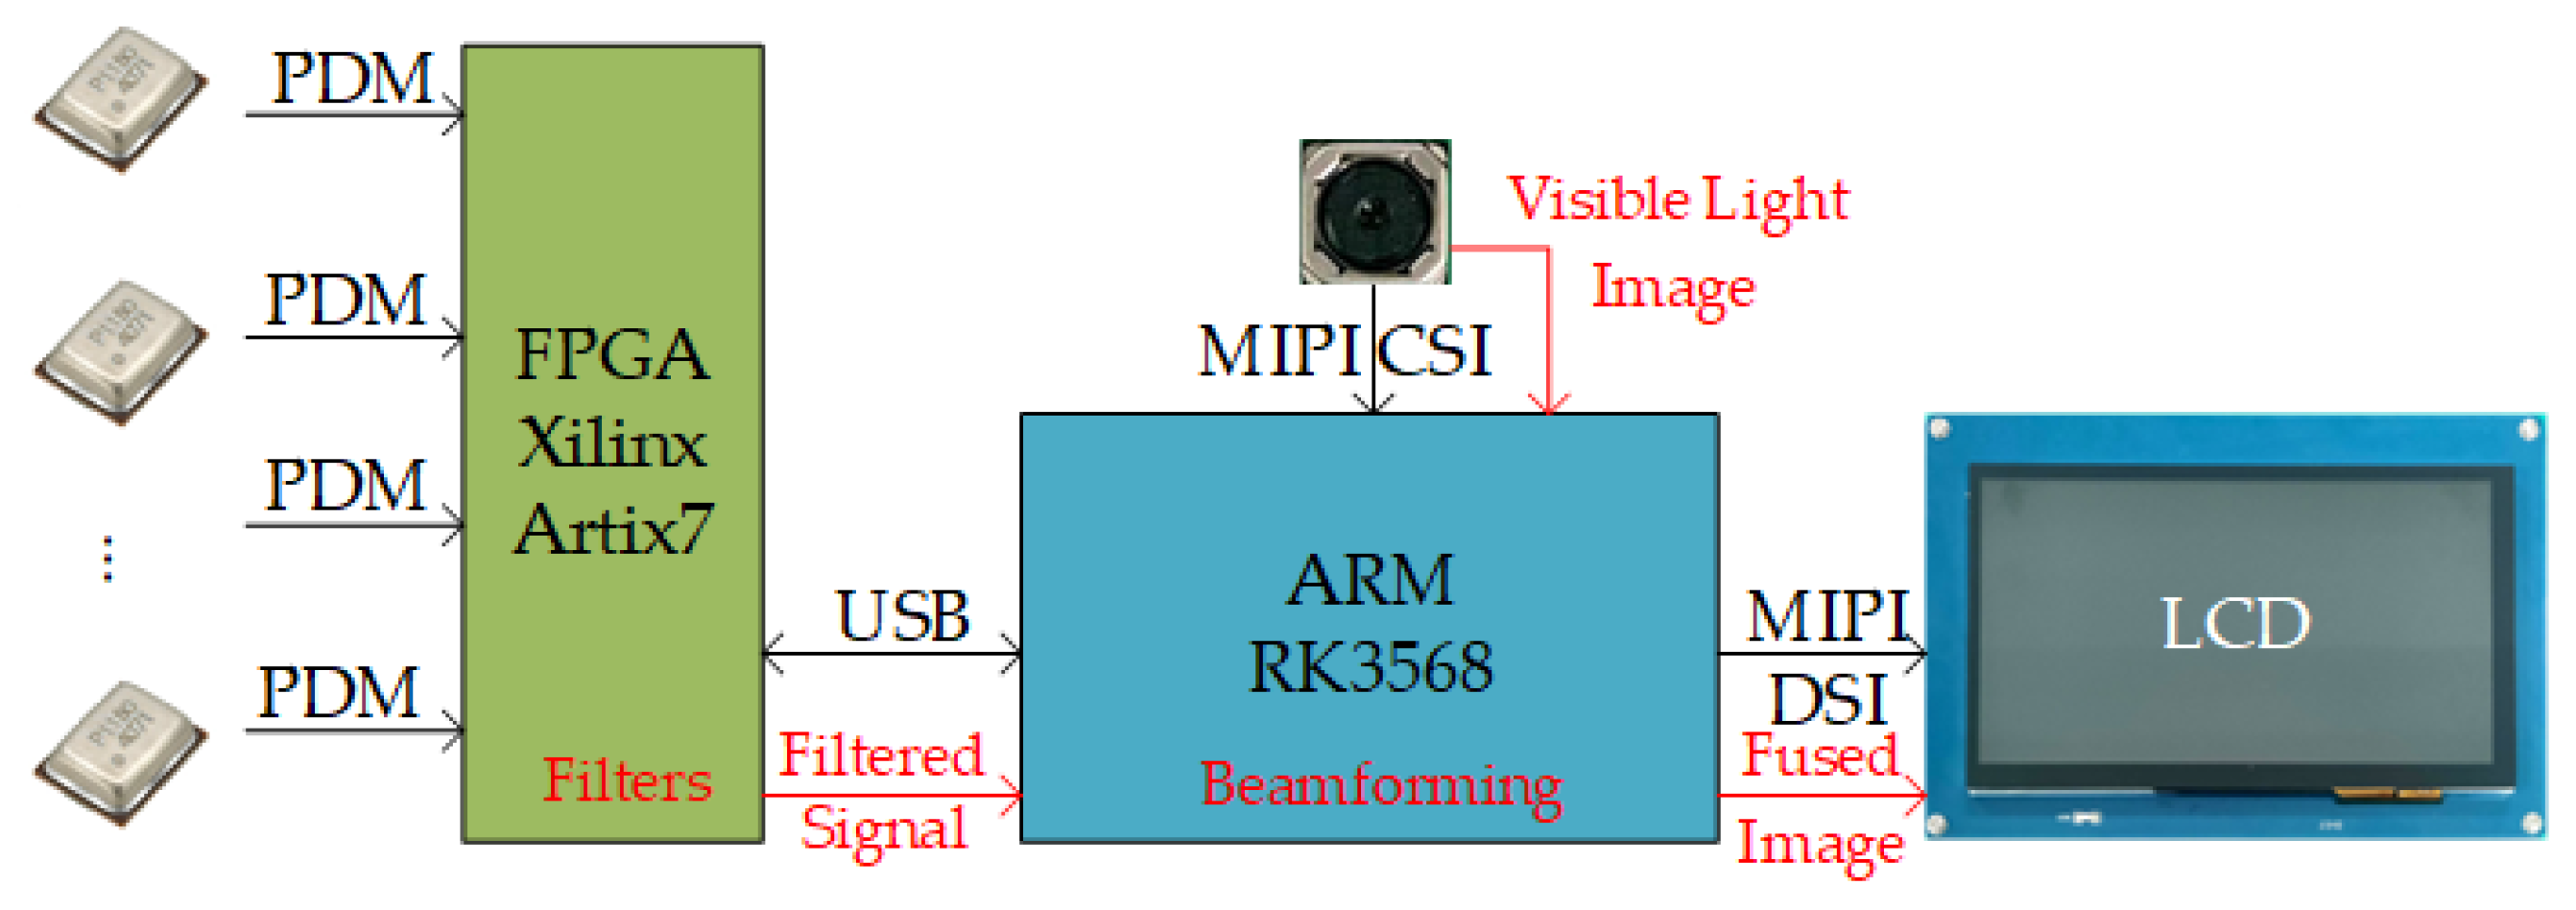
4.1. Design of the Embedded System
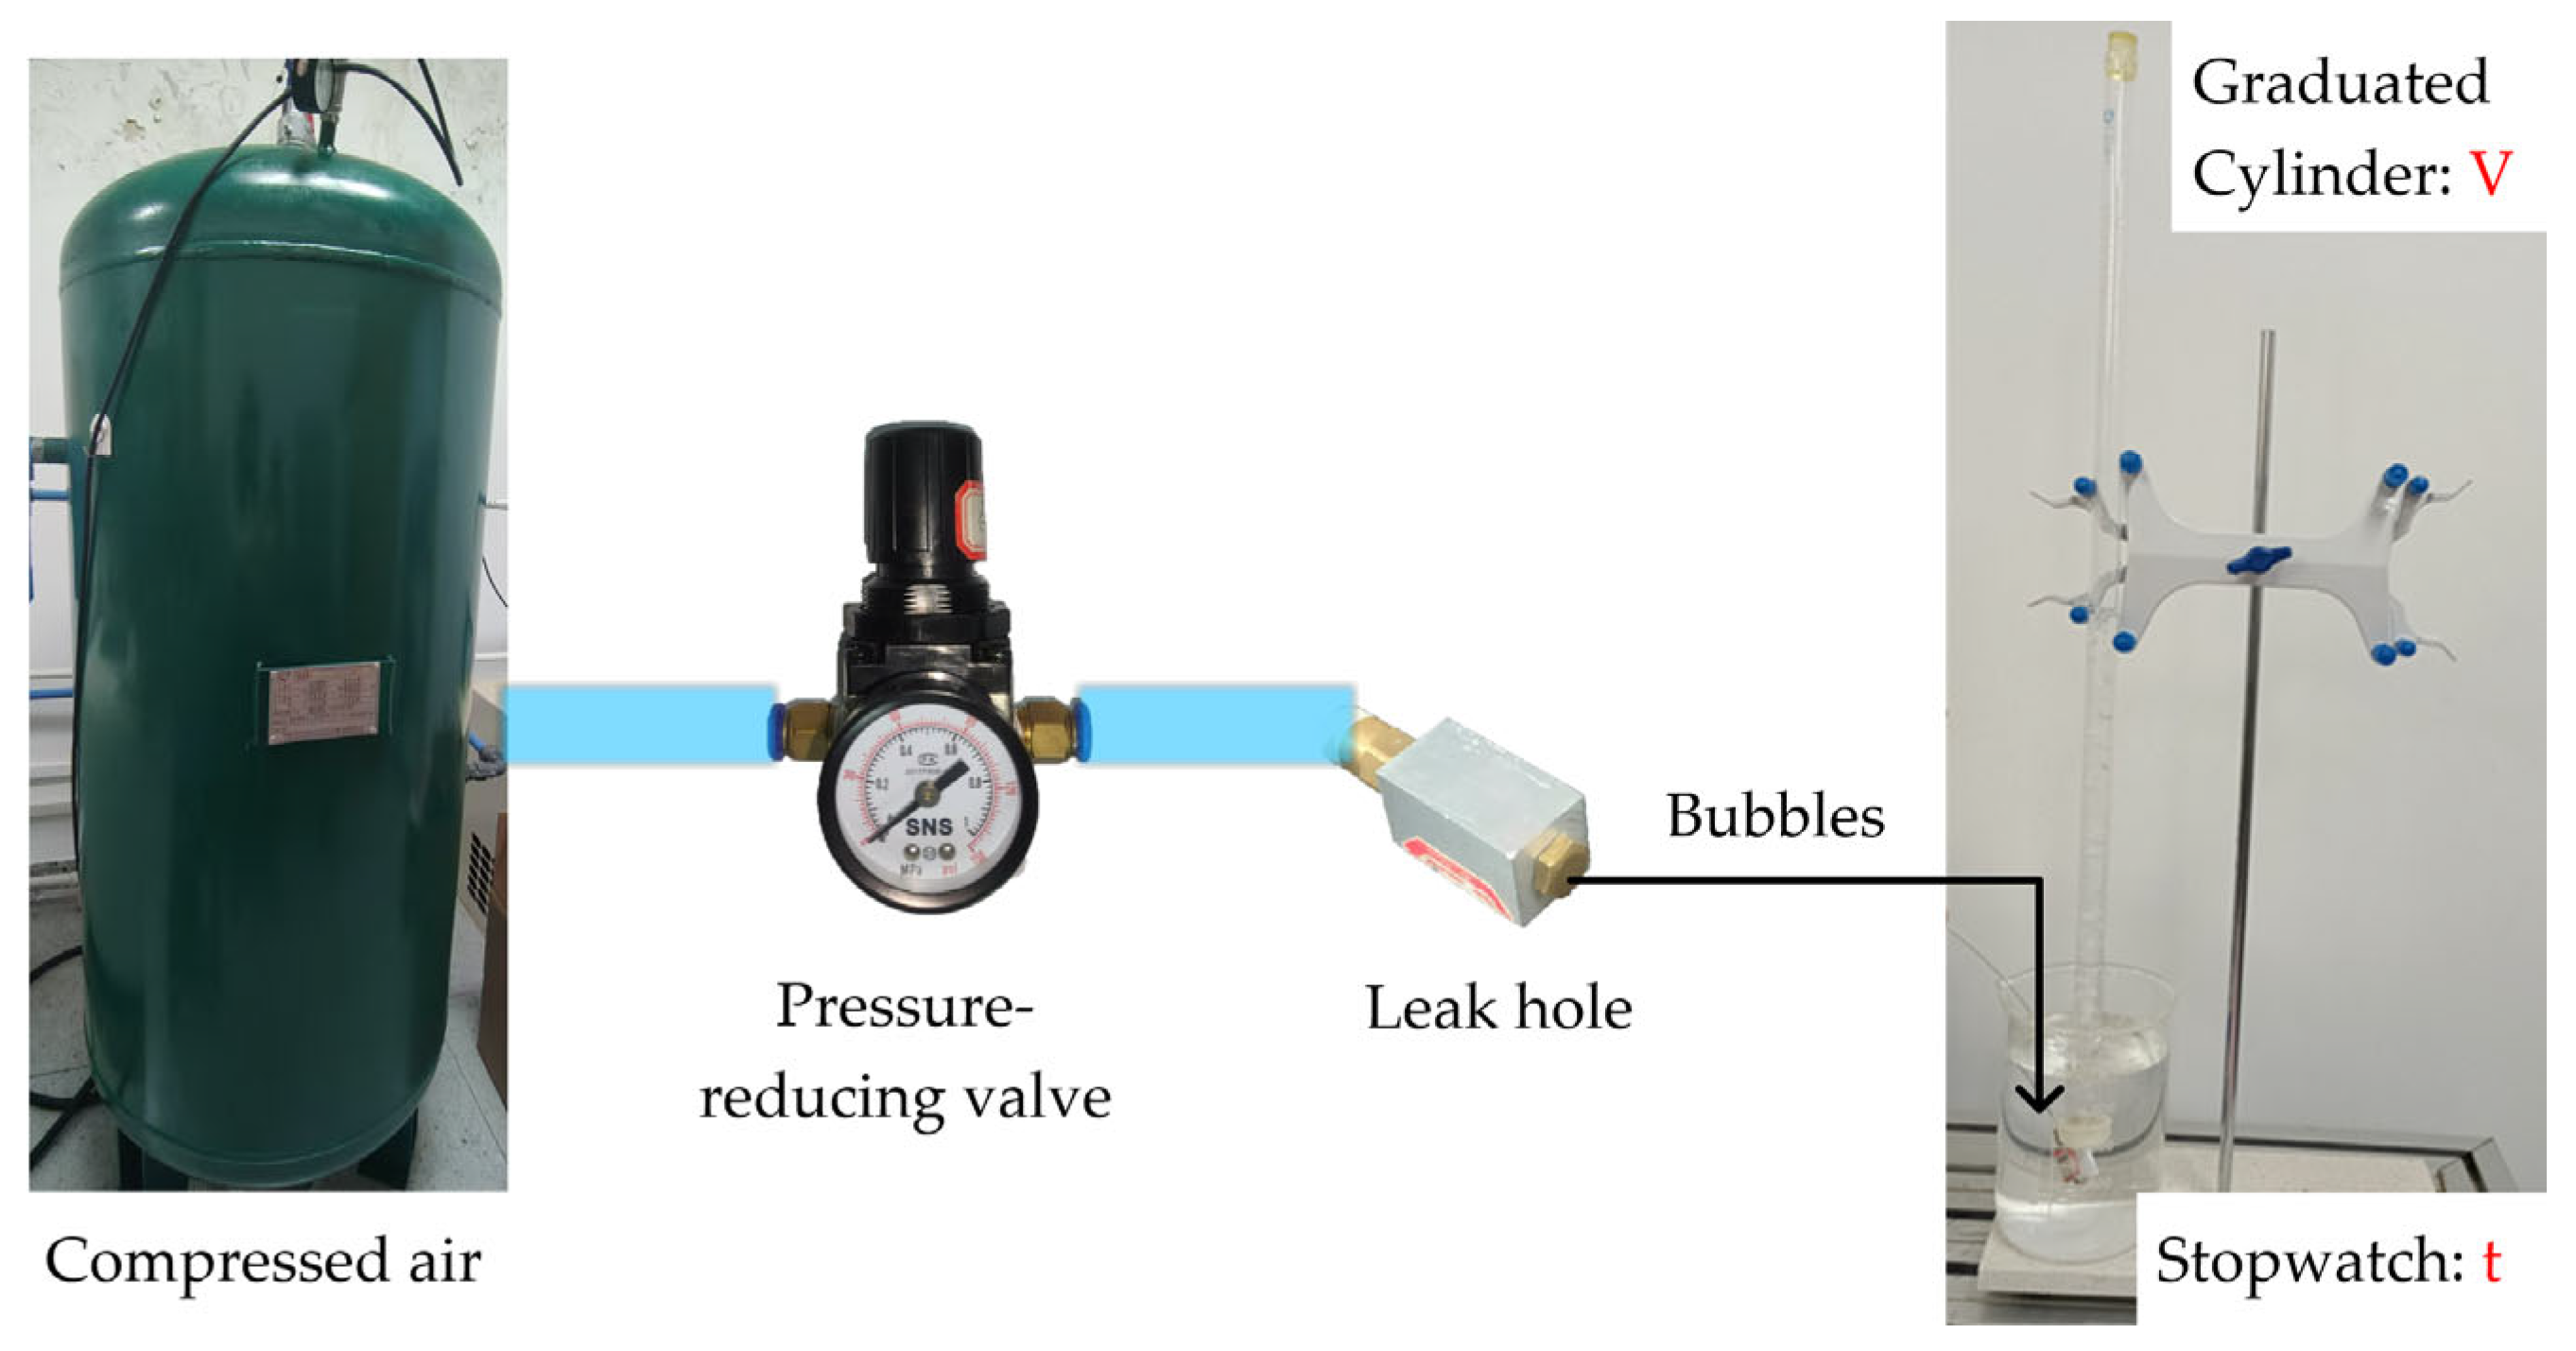
4.2. Calibration Method for Gas Leakage Rate
4.3. Comparison of Algorithm Performance
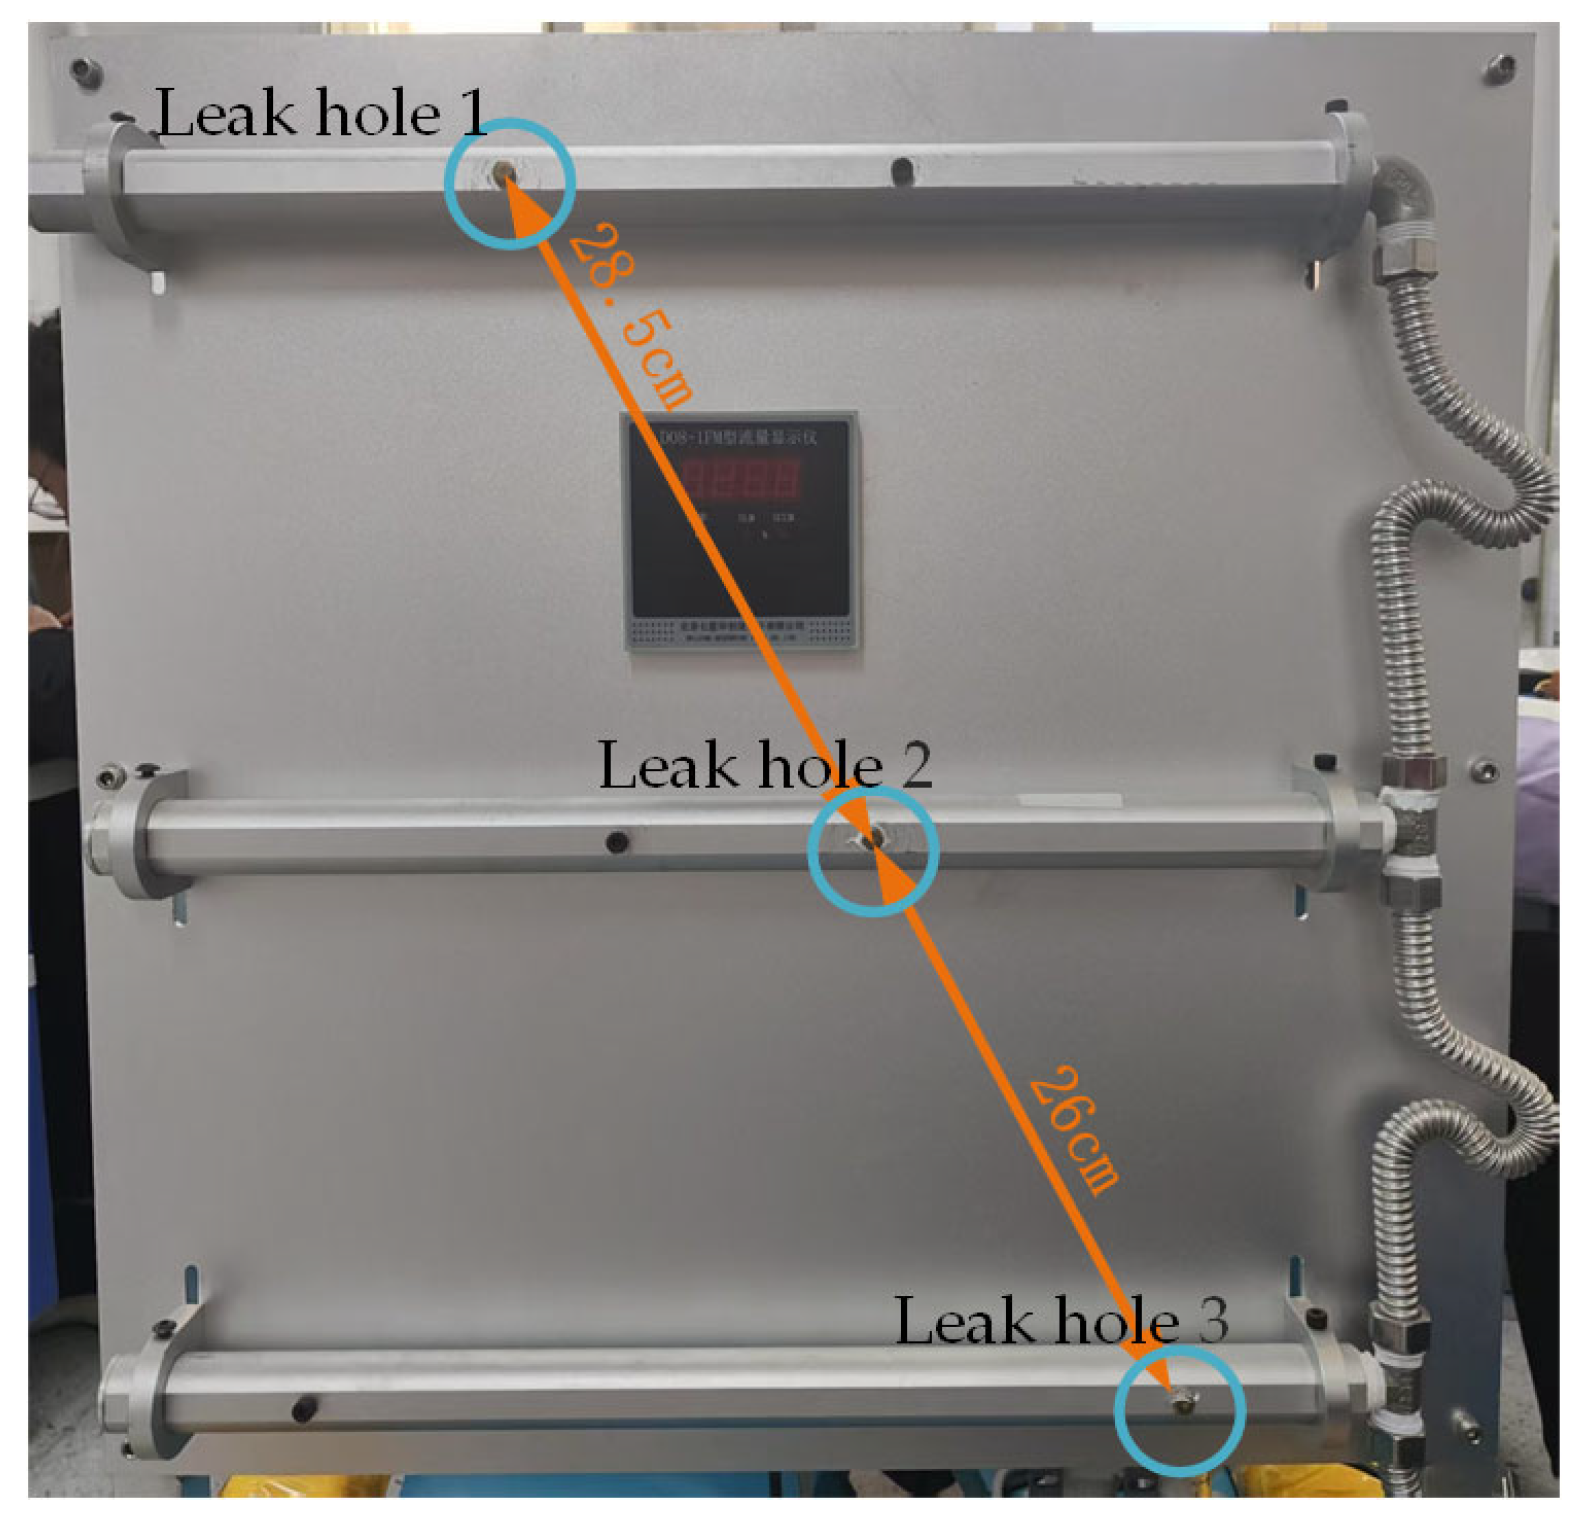
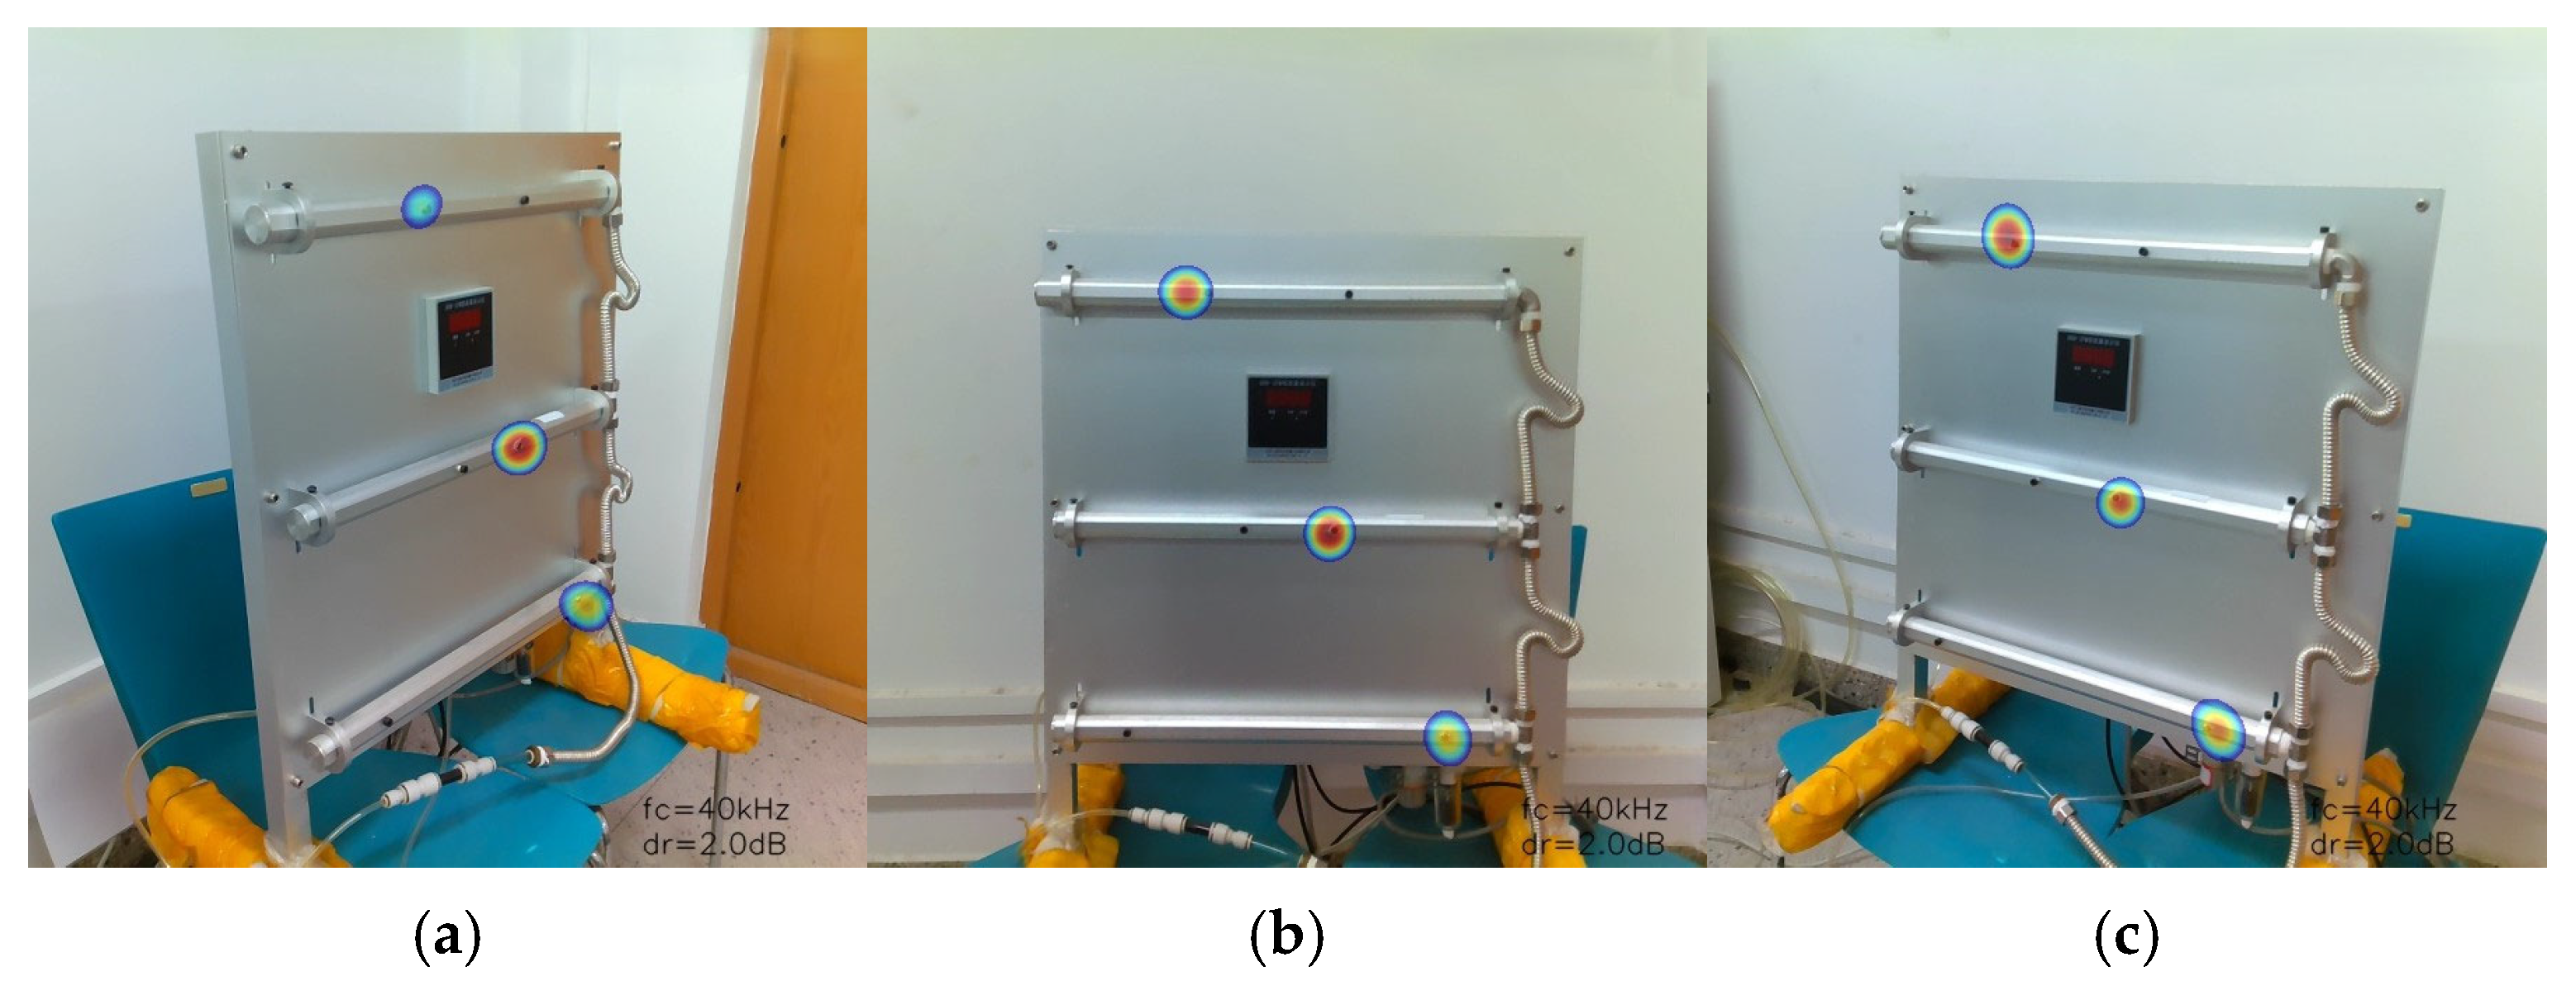
4.4. Single-Point Gas Leak Test
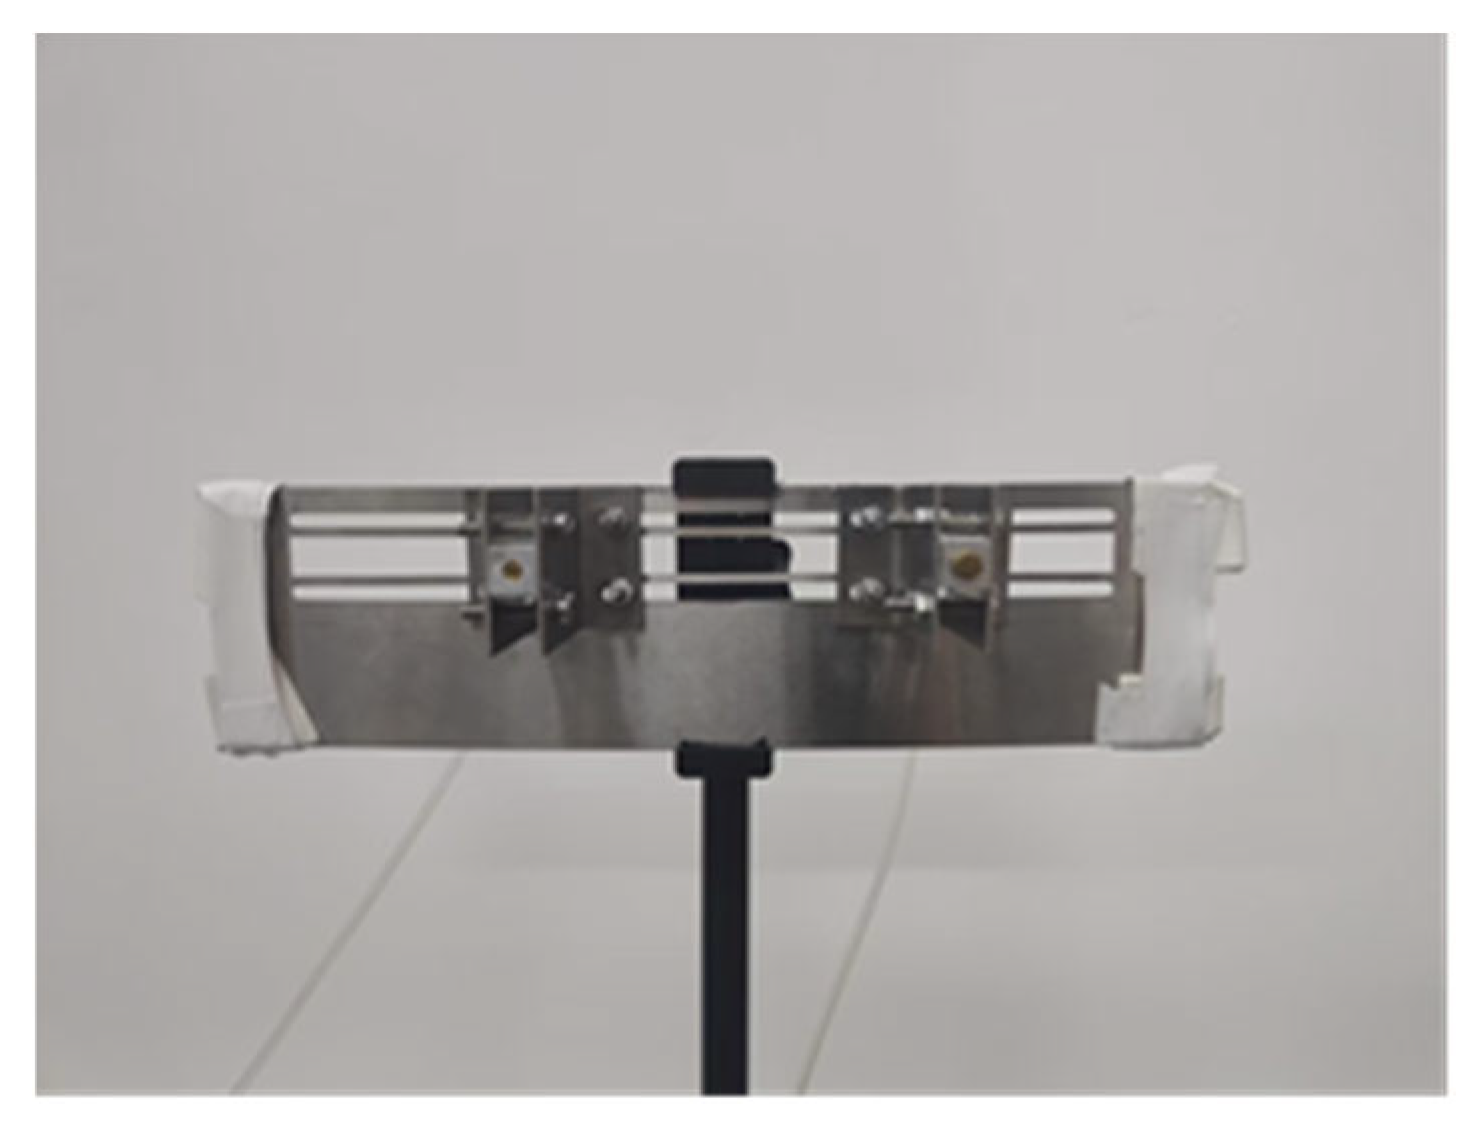
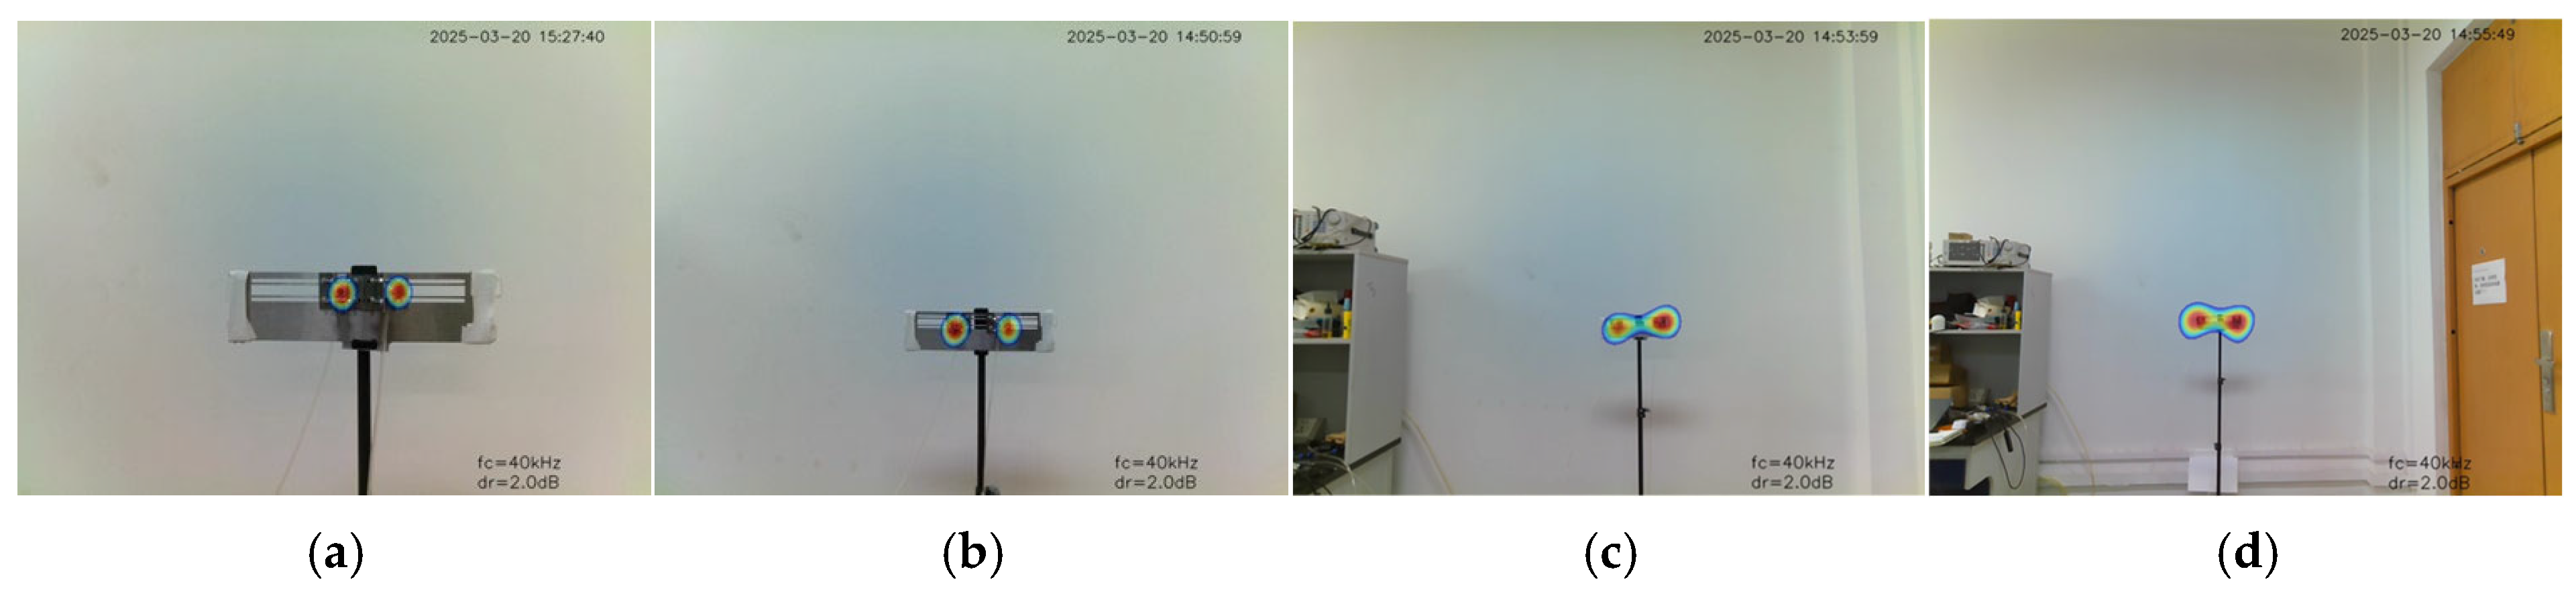
4.5. Multi-Point Gas Leak Test
4.6. Real-Time Performance of Embedded System
5. Conclusions
Author Contributions
Funding
Institutional Review Board Statement
Informed Consent Statement
Data Availability Statement
Conflicts of Interest
Abbreviations
| FFT | Fast Fourier Transform |
| TDOA | Time Difference of Arrival |
| ED | Energy Decay |
| MEMS | Microelectromechanical System |
| PDM | Pulse-Density Modulation |
| PCM | Pulse Code Modulation |
| CIC | Cascaded Integrator-Comb |
| NAH | Near-Field Acoustic Holography |
| SOMP | Simultaneous Orthogonal Matching Pursuit |
| SBL | Sparse Bayesian Learning |
| CBF | Conventional Beamforming |
References
- Xiao, Q.; Li, J.; Sun, J.; Feng, H.; Jin, S. Natural-Gas Pipeline Leak Location Using Variational Mode Decomposition Analysis and Cross-Time–Frequency Spectrum. Measurement 2018, 124, 163–172. [Google Scholar] [CrossRef]
- Zhou, M.; Xu, Y.; Cui, B.; Hu, Y.; Guo, T.; Cai, Y.; Sun, X. Pipeline Leakage Detection and Localization Using a Reliable Pipeline-Mechanism Model Incorporating a Bayesian Model Updating Approach. Water 2022, 14, 1255. [Google Scholar] [CrossRef]
- Wang, T.; Yang, M.; Ji, J.; Lan, J.; Wang, B. Visualized Detection of Gas Leaks Based on Improved TDOA. In Proceedings of the 12th JFPS international Symposium on Fluid Power, Hiroshima, Japan, 22–25 October 2024. [Google Scholar]
- Kazeminia, M.; Bouzid, A.-H. Leak Prediction through Porous Compressed Packing Rings: A Comparison Study. Int. J. Press. Vessels Pip. 2018, 166, 1–8. [Google Scholar] [CrossRef]
- Wang, T.; Wang, X.; Wang, B.; Fan, W. Gas Leak Location Method Based on Annular Ultrasonic Sensor Array. In Proceedings of the 2018 IEEE International Instrumentation and Measurement Technology Conference (I2MTC), Houston, TX, USA, 14–17 May 2018; pp. 1–6. [Google Scholar]
- Wang, D.; Zhao, F.; Wang, T. The Ultrasonic Characteristics Study of Weak Gas Leakage. In Proceedings of the 2015 International Conference on Fluid Power and Mechatronics (FPM), Harbin, China, 5–7 August 2015; pp. 681–685. [Google Scholar]
- Asgari, H.R.; Maghrebi, M.F. Application of Nodal Pressure Measurements in Leak Detection. Flow Meas. Instrum. 2016, 50, 128–134. [Google Scholar] [CrossRef]
- Kroll, A.; Baetz, W.; Peretzki, D. On Autonomous Detection of Pressured Air and Gas Leaks Using Passive IR-Thermography for Mobile Robot Application. In Proceedings of the 2009 IEEE International Conference on Robotics and Automation, Kobe, Japan, 12–17 May 2009; pp. 921–926. [Google Scholar]
- Lambrecht, A.; Maier, E.; Pernau, H.-F.; Strahl, T.; Herbst, J. Gas Leak Detection by Dilution of Atmospheric Oxygen. Sensors 2017, 17, 2804. [Google Scholar] [CrossRef] [PubMed]
- Xu, M.; Tao, W. Study on Gas Leakage Localization Method Based on Ultrasonic Sensor Area Array. In Proceedings of the 2017 IEEE International Conference on Advanced Intelligent Mechatronics (AIM), Munich, Germany, 3–7 July 2017; IEEE: Piscataway, NJ, USA, 2017; pp. 136–141. [Google Scholar]
- Wang, T.; Wang, X.; Hong, M. Gas Leak Location Detection Based on Data Fusion with Time Difference of Arrival and Energy Decay Using an Ultrasonic Sensor Array. Sensors 2018, 18, 2985. [Google Scholar] [CrossRef] [PubMed]
- Brooks, T.F.; Humphreys, W.M. A Deconvolution Approach for the Mapping of Acoustic Sources (DAMAS) Determined from Phased Microphone Arrays. J. Sound Vib. 2006, 294, 856–879. [Google Scholar] [CrossRef]
- Yang, C.; Wang, Y.S.; Wang, Y.; Hu, D.Y.; Guo, H. An Improved Functional Beamforming Algorithm for Far-Field Multi-Sound Source Localization Based on Hilbert Curve. Appl. Acoust. 2022, 192, 108729. [Google Scholar] [CrossRef]
- Joshi, A.; Rahman, M.M.; Hickey, J.-P. Recent Advances in Passive Acoustic Localization Methods via Aircraft and Wake Vortex Aeroacoustics. Fluids 2022, 7, 218. [Google Scholar] [CrossRef]
- Seo, S.-W.; Kim, M. 3D Impulsive Sound-Source Localization Method through a 2D MEMS Microphone Array Using Delay-and-Sum Beamforming. In Proceedings of the 9th International Conference on Signal Processing Systems, Auckland, New Zealand, 27 November 2017; ACM: New York, NY, USA, 2017; pp. 170–174. [Google Scholar]
- Li, L.; Yang, K.; Bian, X.; Liu, Q.; Yang, Y.; Ma, F. A Gas Leakage Localization Method Based on a Virtual Ultrasonic Sensor Array. Sensors 2019, 19, 3152. [Google Scholar] [CrossRef] [PubMed]
- Chu, Z.; Yang, Y.; Shen, L. Resolution and Quantification Accuracy Enhancement of Functional Delay and Sum Beamforming for Three-Dimensional Acoustic Source Identification with Solid Spherical Arrays. Mech. Syst. Signal Process. 2017, 88, 274–289. [Google Scholar] [CrossRef]
- Grythe, J.; Norsonic, A.S. Beamforming Algorithms-Beamformers. Technol. Note Norsonic Nor. 2015. Available online: https://norsonic.no/wp-content/uploads/2023/09/TN-beamformers.pdf (accessed on 1 April 2025).
- Da Silva, B.; Braeken, A.; Touhafi, A. FPGA-Based Architectures for Acoustic Beamforming with Microphone Arrays: Trends, Challenges and Research Opportunities. Computers 2018, 7, 41. [Google Scholar] [CrossRef]
- Izquierdo, A.; Villacorta, J.; Del Val Puente, L.; Suárez, L. Design and Evaluation of a Scalable and Reconfigurable Multi-Platform System for Acoustic Imaging. Sensors 2016, 16, 1671. [Google Scholar] [CrossRef] [PubMed]
- Zhao, S.; Cheng, E.; Qiu, X.; Burnett, I.; Liu, J.C. Pressure Spectra in Turbulent Flows in the Inertial and the Dissipation Ranges. J. Acoust. Soc. Am. 2016, 140, 4178–4182. [Google Scholar] [CrossRef] [PubMed]
- Nian, T.; Tao, W.; Manjun, Z.; Li, L.; Dongwei, S.; Xiaodian, L.; Jianglong, L.; Jiawen, J.; Ming, Y. High-Accuracy Detection and Location of Gas Leaks Based on Adaptive Weighted Data Fusion Using an Ultrasonic Transducer Array. Insight Non-Destr. Test. Cond. Monit. 2024, 66, 729–736. [Google Scholar] [CrossRef]
- Prime, Z.; Doolan, C. A Comparison of Popular Beamforming Arrays. Proc. Aust. Acoust. Soc. AAS2013 Victor Harb. 2013, 1, 5. [Google Scholar]
- Amaral, F.R.D.; Serrano Rico, J.C.; Medeiros, M.A.F.D. Design of Microphone Phased Arrays for Acoustic Beamforming. J. Braz. Soc. Mech. Sci. Eng. 2018, 40, 1–13. [Google Scholar] [CrossRef]
- Li, L.; Wang, S.; Li, F.; Zheng, X.; Wu, Y.; Gao, Y.; Qiao, Y. Three-Dimensional Localization of Gas Leakage Using Acoustic Holography. Mech. Syst. Signal Process. 2022, 171, 108952. [Google Scholar] [CrossRef]
- Tropp, J.A.; Gilbert, A.C.; Strauss, M.J. Algorithms for Simultaneous Sparse Approximation. Part I: Greedy Pursuit. Signal Process. 2006, 86, 572–588. [Google Scholar] [CrossRef]
- Gerstoft, P.; Mecklenbräuker, C.F.; Xenaki, A.; Nannuru, S. Multisnapshot Sparse Bayesian Learning for DOA. IEEE Signal Process. Lett. 2016, 23, 1469–1473. [Google Scholar] [CrossRef]


| Array Types | BW | DR (dB) | DR Variance |
|---|---|---|---|
| Ring | 3.90° | 8.97 | 1.9784 |
| Archimedean spiral | 4.50° | 8.06 | 0.0089 |
| Dougherty log-spiral | 4.10° | 8.21 | 0.0275 |
| Arcondoulis spiral | 3.90° | 8.01 | 0.0973 |
| Rose spiral | 4.70° | 8.81 | 0.0884 |
| Sunflower | 3.50° | 5.54 | 0.0001 |
| Underbrink array | 4.50° | 7.39 | 0.0001 |
| Annular array | 4.50° | 9.32 | 0.0012 |
| Resolution | Algorithm | Time Complexity | Space Complexity | Runtime | Localisation Error (Pixels) |
|---|---|---|---|---|---|
| 45 × 60 | CBF | O(M·N) | O(N) | 0.003050 s | 0.67 |
| SOMP | O(T·M·N) | O(N·L) | 0.076395 s | 0.67 | |
| SBL | O(K·M·N2) | O(N2) | 32.915978 s | 0.34 | |
| 240 × 320 | CBF | O(M·N) | O(N) | 0.046363 s | 4.485 |
| SOMP | O(T·M·N) | O(N·L) | 1.521570 s | 4.955 | |
| SBL | O(K·M·N2) | O(N2) | Out of Memory | Out of Memory |
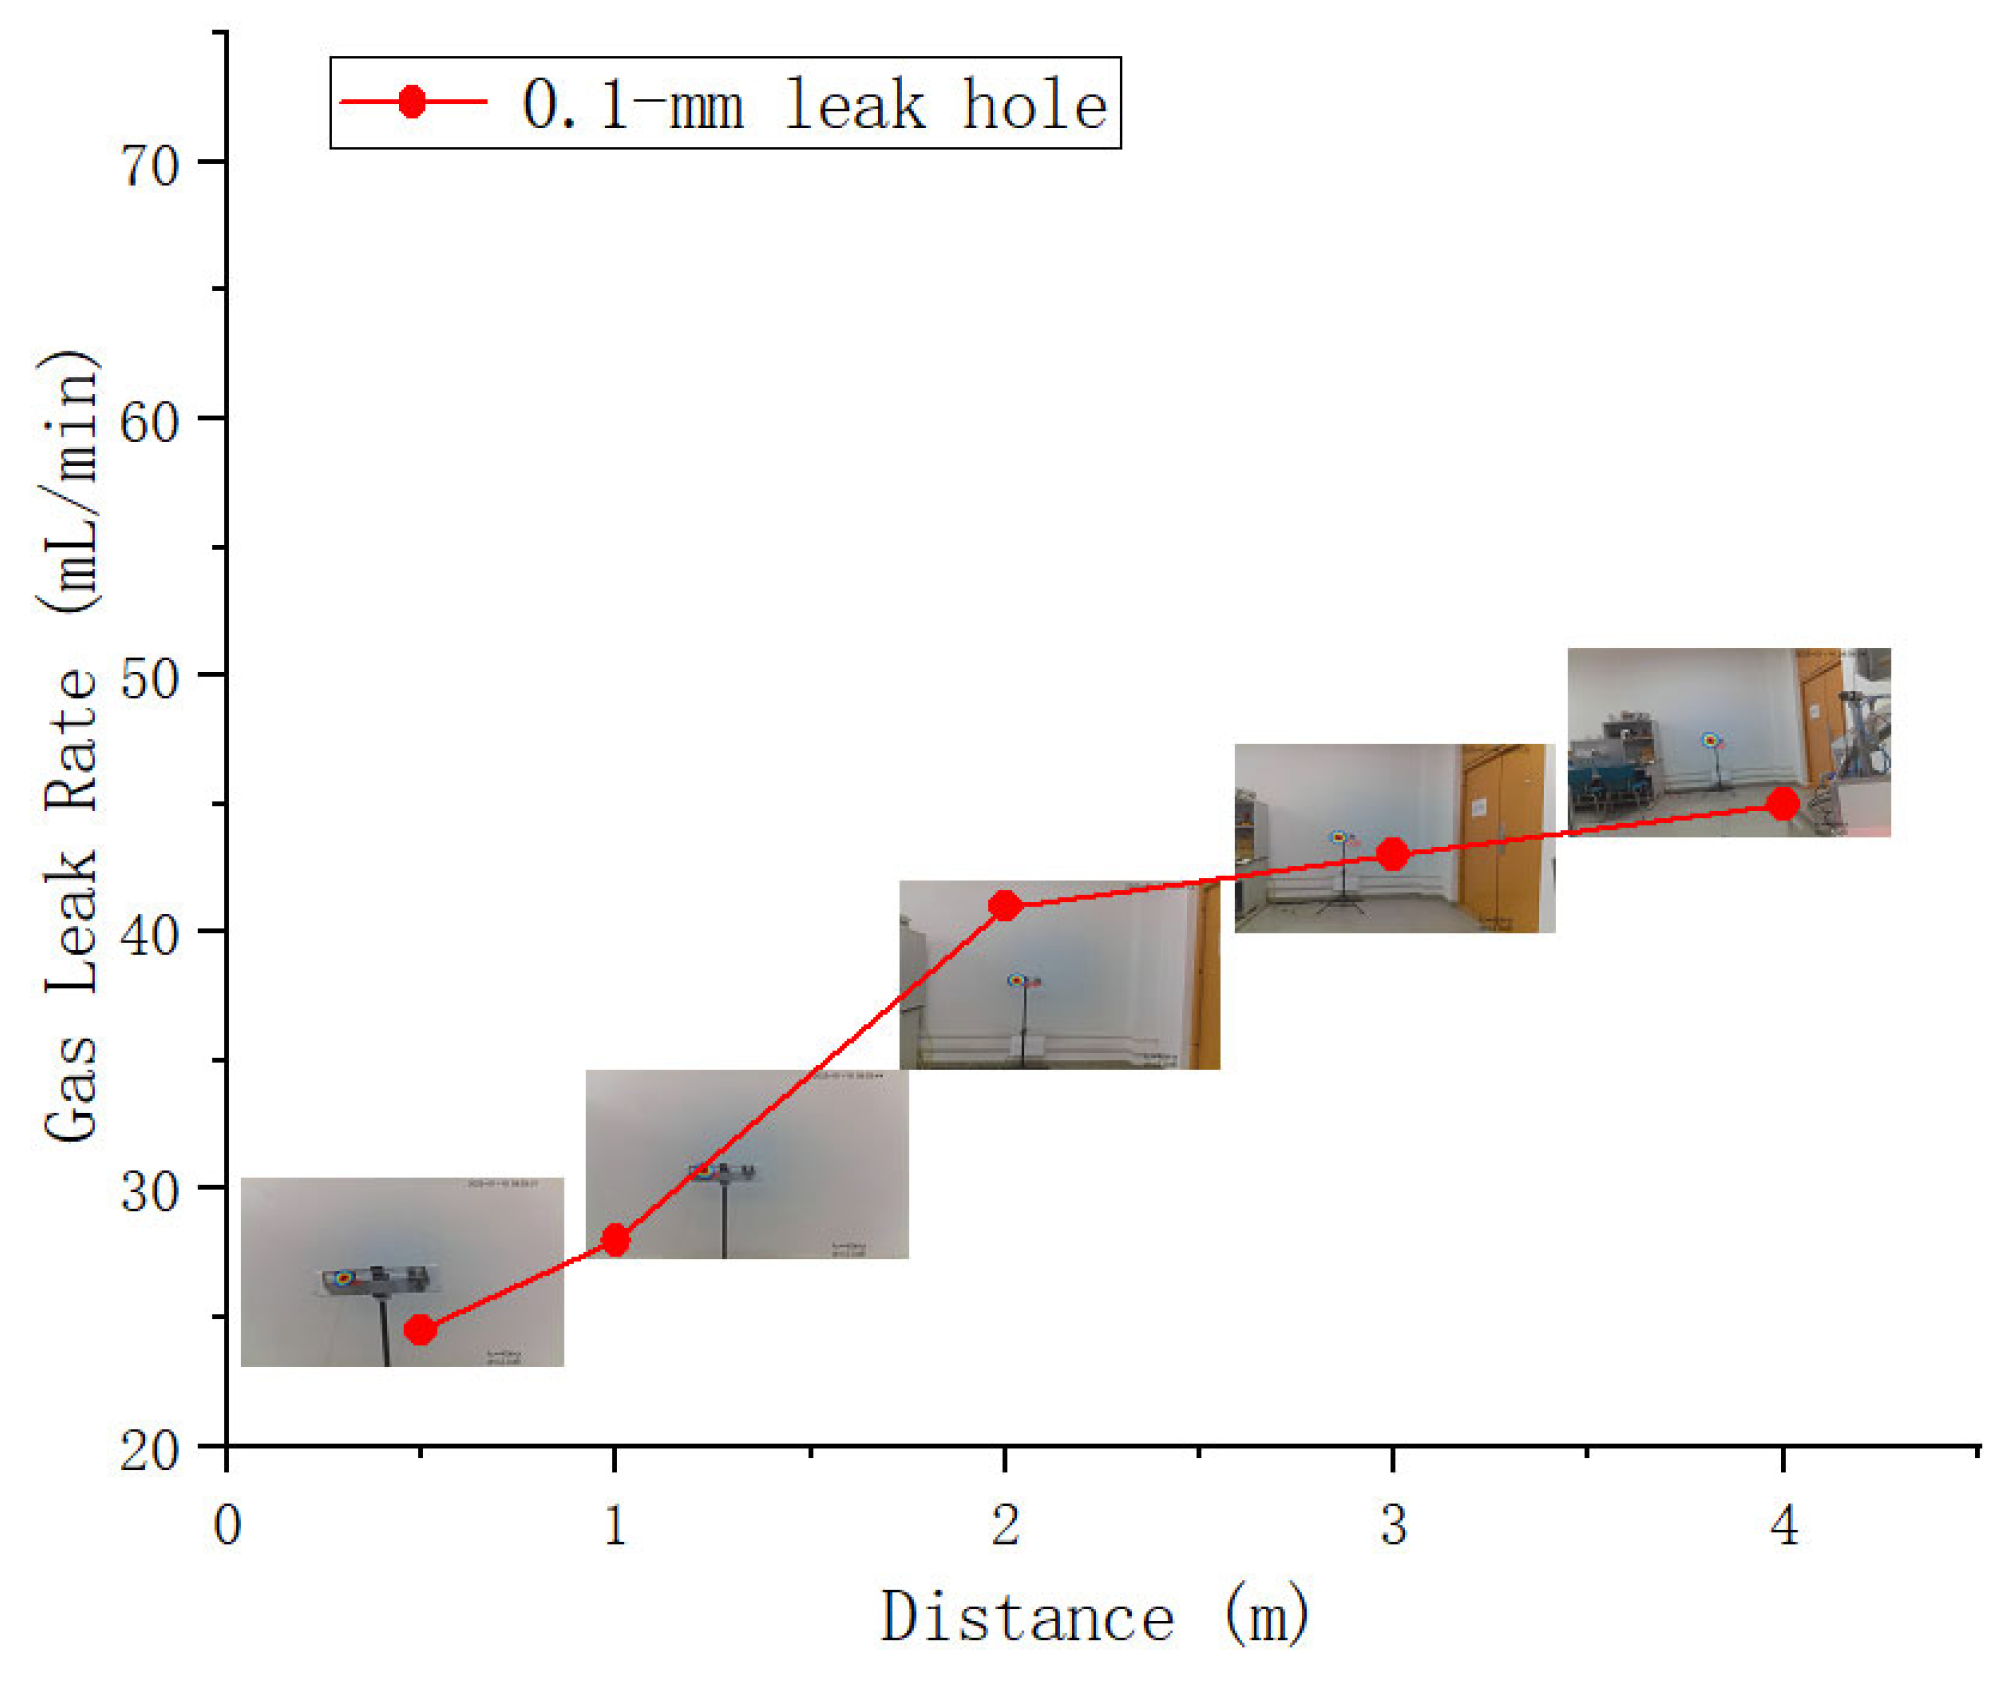
| Distance | 0.5 m | 1.0 m | 2.0 m | 3.0 m | 4.0 m |
|---|---|---|---|---|---|
| 0.1 mm Leak hole | 24 cm3/min | 28 mL/min | 41 mL/min | 43 mL/min | 45 mL/min |
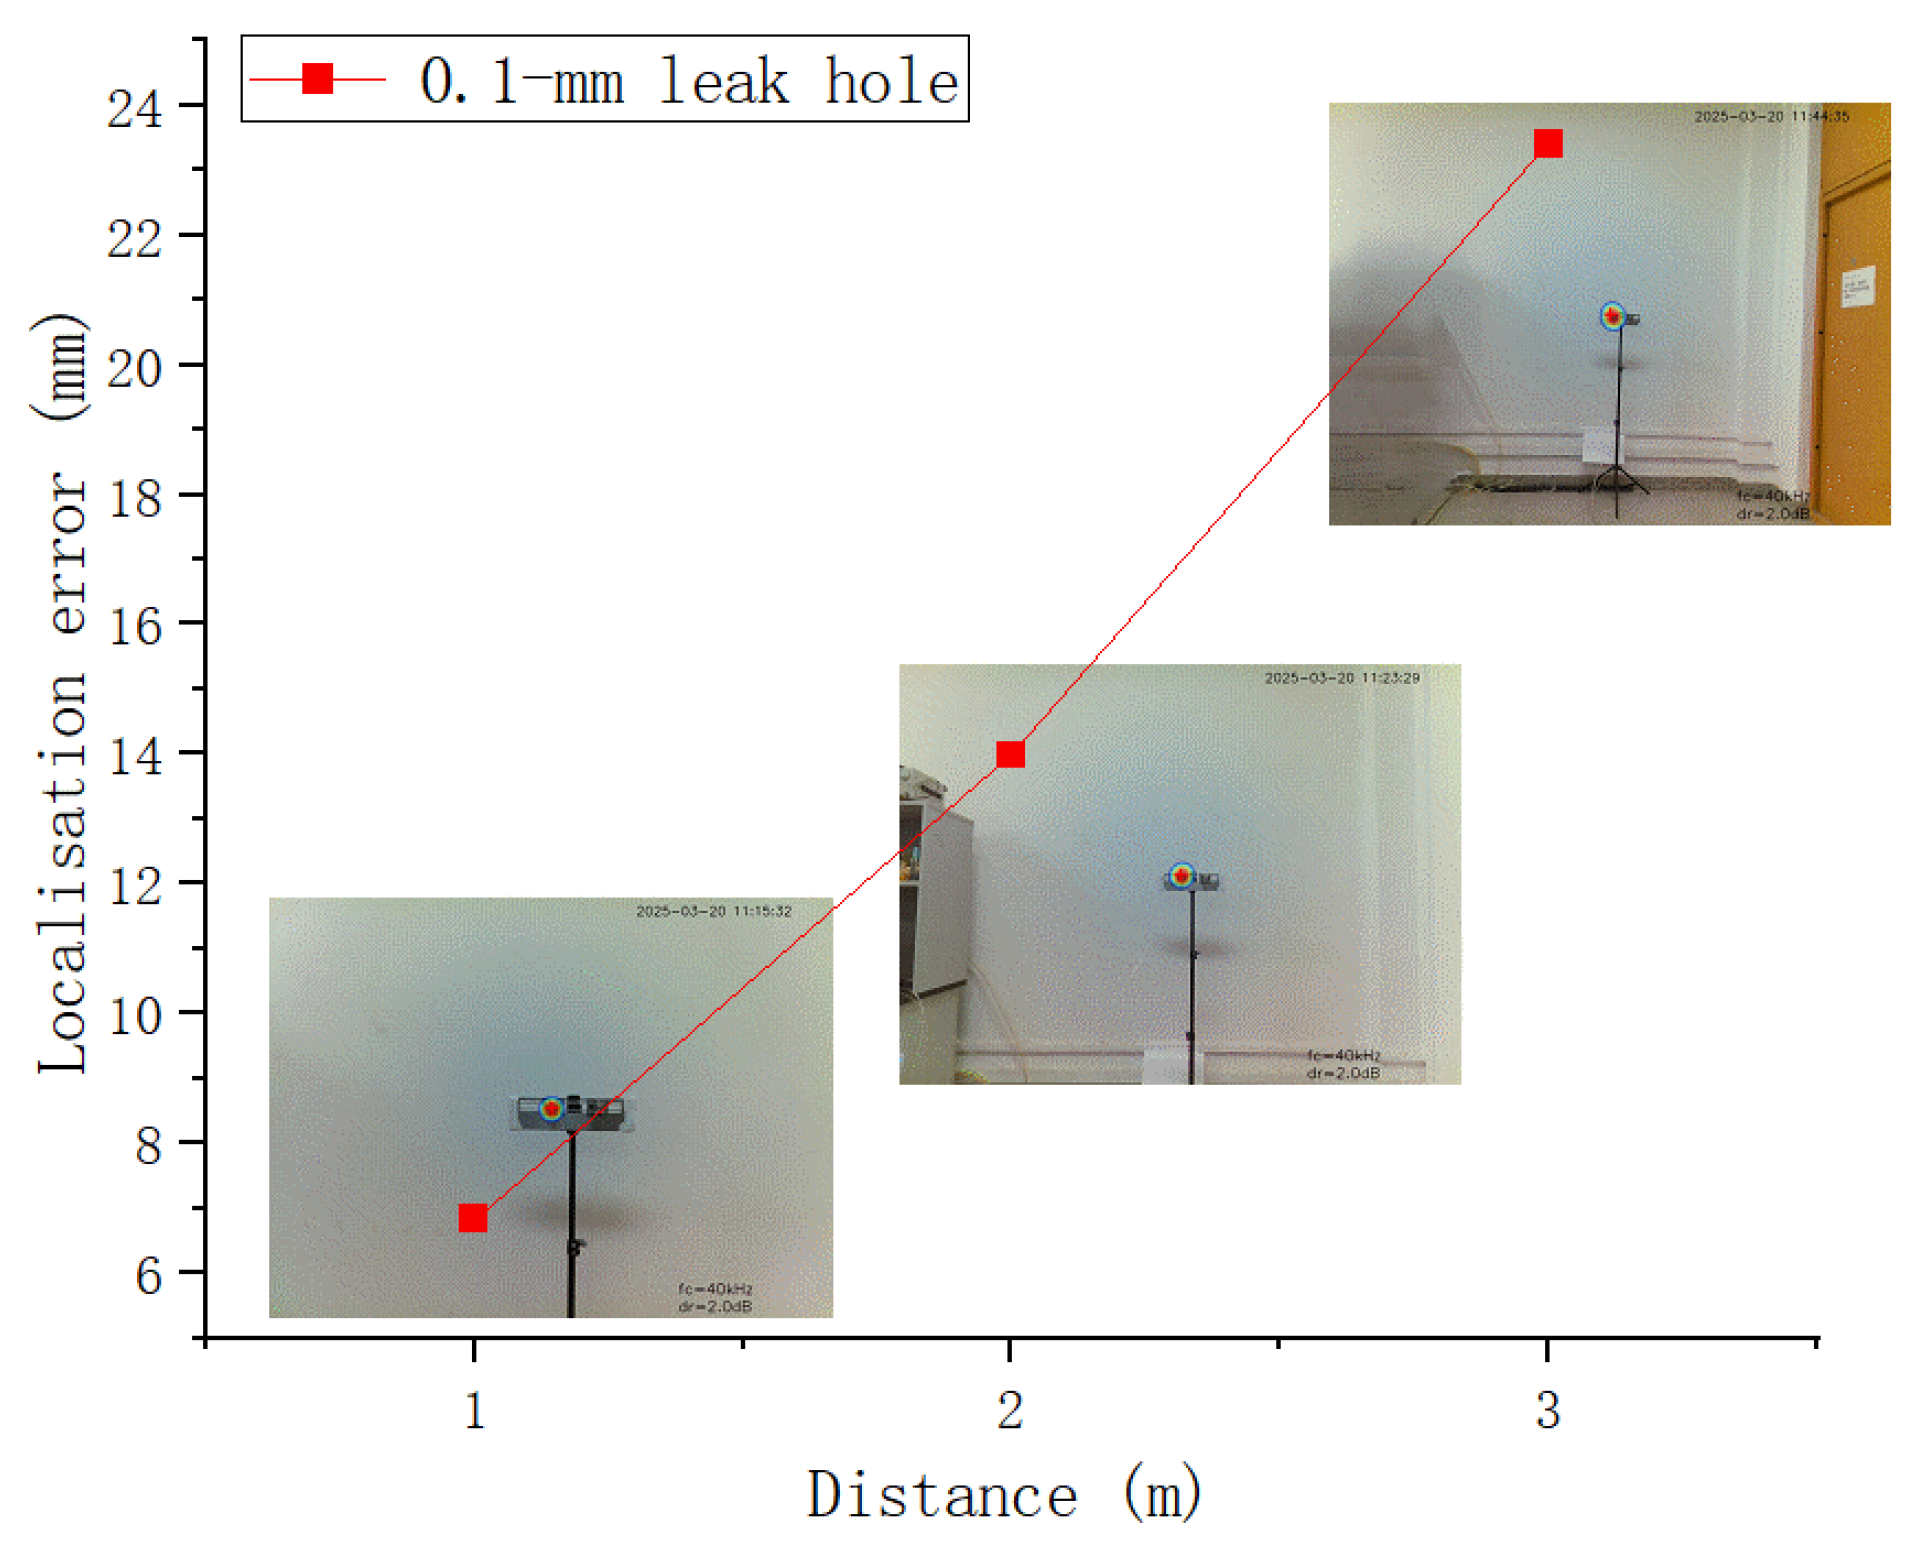
| Distance | 1.0 m | 2.0 m | 3.0 m |
|---|---|---|---|
| Image localisation error | 4.70 | 4.81 | 5.37 |
| Actual localisation error | 0.68 cm | 1.40 cm | 2.34 cm |
| Distance | 0.5 m | 1.0 m | 2.0 m | 3.0 m |
|---|---|---|---|---|
| Minimum Spacing | 5 cm | 8 cm | 18 cm | 22 cm |
Disclaimer/Publisher’s Note: The statements, opinions and data contained in all publications are solely those of the individual author(s) and contributor(s) and not of MDPI and/or the editor(s). MDPI and/or the editor(s) disclaim responsibility for any injury to people or property resulting from any ideas, methods, instructions or products referred to in the content. |
© 2025 by the authors. Licensee MDPI, Basel, Switzerland. This article is an open access article distributed under the terms and conditions of the Creative Commons Attribution (CC BY) license (https://creativecommons.org/licenses/by/4.0/).
Share and Cite
Wang, T.; Ji, J.; Lan, J.; Wang, B. Ultrasonic Beamforming-Based Visual Localisation of Minor and Multiple Gas Leaks Using a Microelectromechanical System (MEMS) Microphone Array. Sensors 2025, 25, 3190. https://doi.org/10.3390/s25103190
Wang T, Ji J, Lan J, Wang B. Ultrasonic Beamforming-Based Visual Localisation of Minor and Multiple Gas Leaks Using a Microelectromechanical System (MEMS) Microphone Array. Sensors. 2025; 25(10):3190. https://doi.org/10.3390/s25103190
Chicago/Turabian StyleWang, Tao, Jiawen Ji, Jianglong Lan, and Bo Wang. 2025. "Ultrasonic Beamforming-Based Visual Localisation of Minor and Multiple Gas Leaks Using a Microelectromechanical System (MEMS) Microphone Array" Sensors 25, no. 10: 3190. https://doi.org/10.3390/s25103190
APA StyleWang, T., Ji, J., Lan, J., & Wang, B. (2025). Ultrasonic Beamforming-Based Visual Localisation of Minor and Multiple Gas Leaks Using a Microelectromechanical System (MEMS) Microphone Array. Sensors, 25(10), 3190. https://doi.org/10.3390/s25103190