


Risk Assessment of Hydrogen-Powered Aircraft: An Integrated HAZOP and Fuzzy Dynamic Bayesian Network Framework

 , , ,
, , , 
Abstract
1. Introduction
- Identify risk factors;
- Complete insufficient data or replace uncertain data;
- Reflect the evolution of uncertainties of risk factors over time;
- Quantify the relationships of uncertainty among risk factors.
- The proposed method achieves the transition between qualitative and quantitative analyses while maintaining risk assessment boundaries by leveraging the characteristics of HAZOP and FDBN methodologies. It deconstructs HAZOP results and maps them into risk propagation paths based on causal relationships. By establishing conversion rules between risk propagation paths and risk diffusion networks, it realizes the network-based representation of risk dynamic evolution process.
- A method is introduced to convert expert evaluations into input probabilities for FDBN-based risk diffusion networks using fuzzy set theory. Dynamic risk expert evaluation rules are established, clarifying the specific approaches for obtaining expert assessments and probabilities at different nodes.
- Taking the onboard hydrogen system of low-altitude aircraft as a case study, the HAZOP-FDBN risk assessment framework is applied to complete risk evaluation. Examples of safety constraint derivation are demonstrated based on partial assessment results.
2. Methodology
2.1. HAZOP
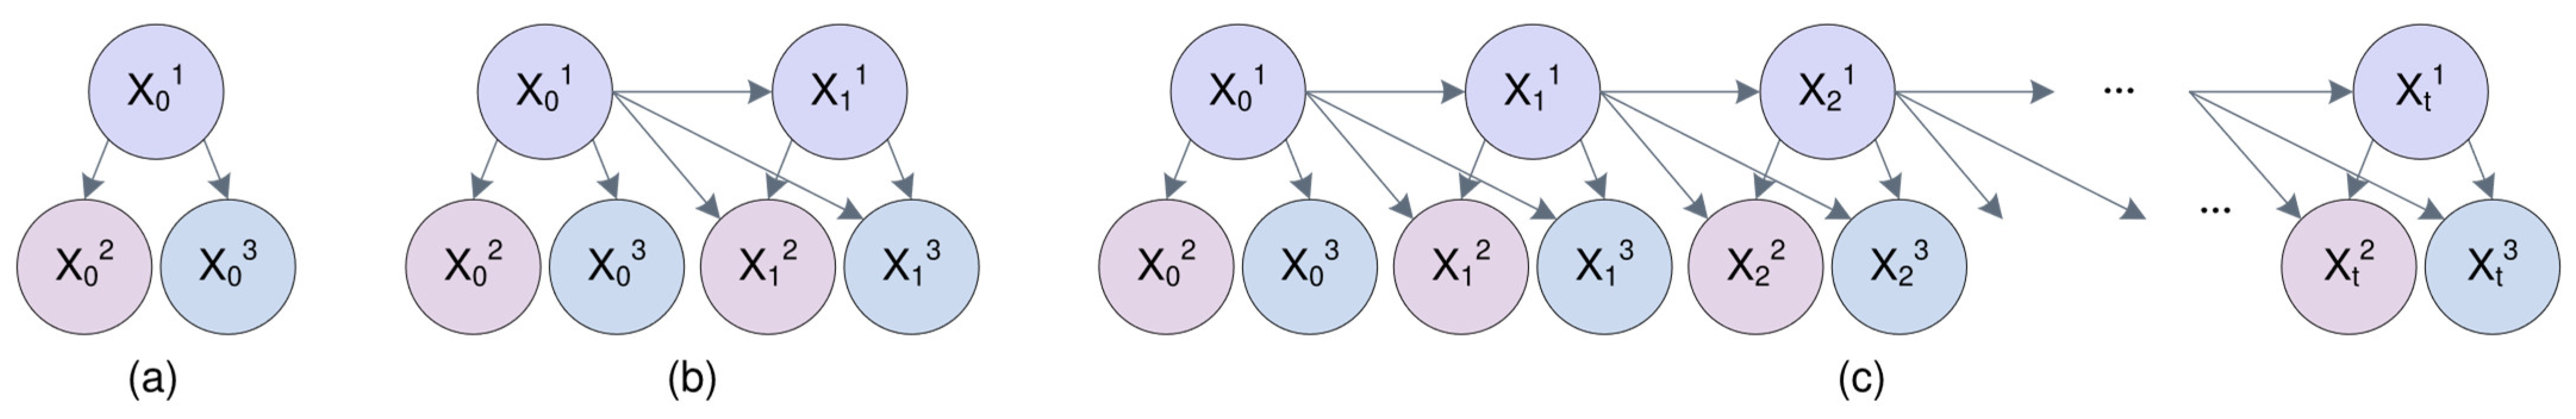
2.2. DBN
- The states of each node at a given time slice are influenced only by the states of the node in the previous time slice.
- The conditional probability remains stable across all time slices.
2.3. SAM
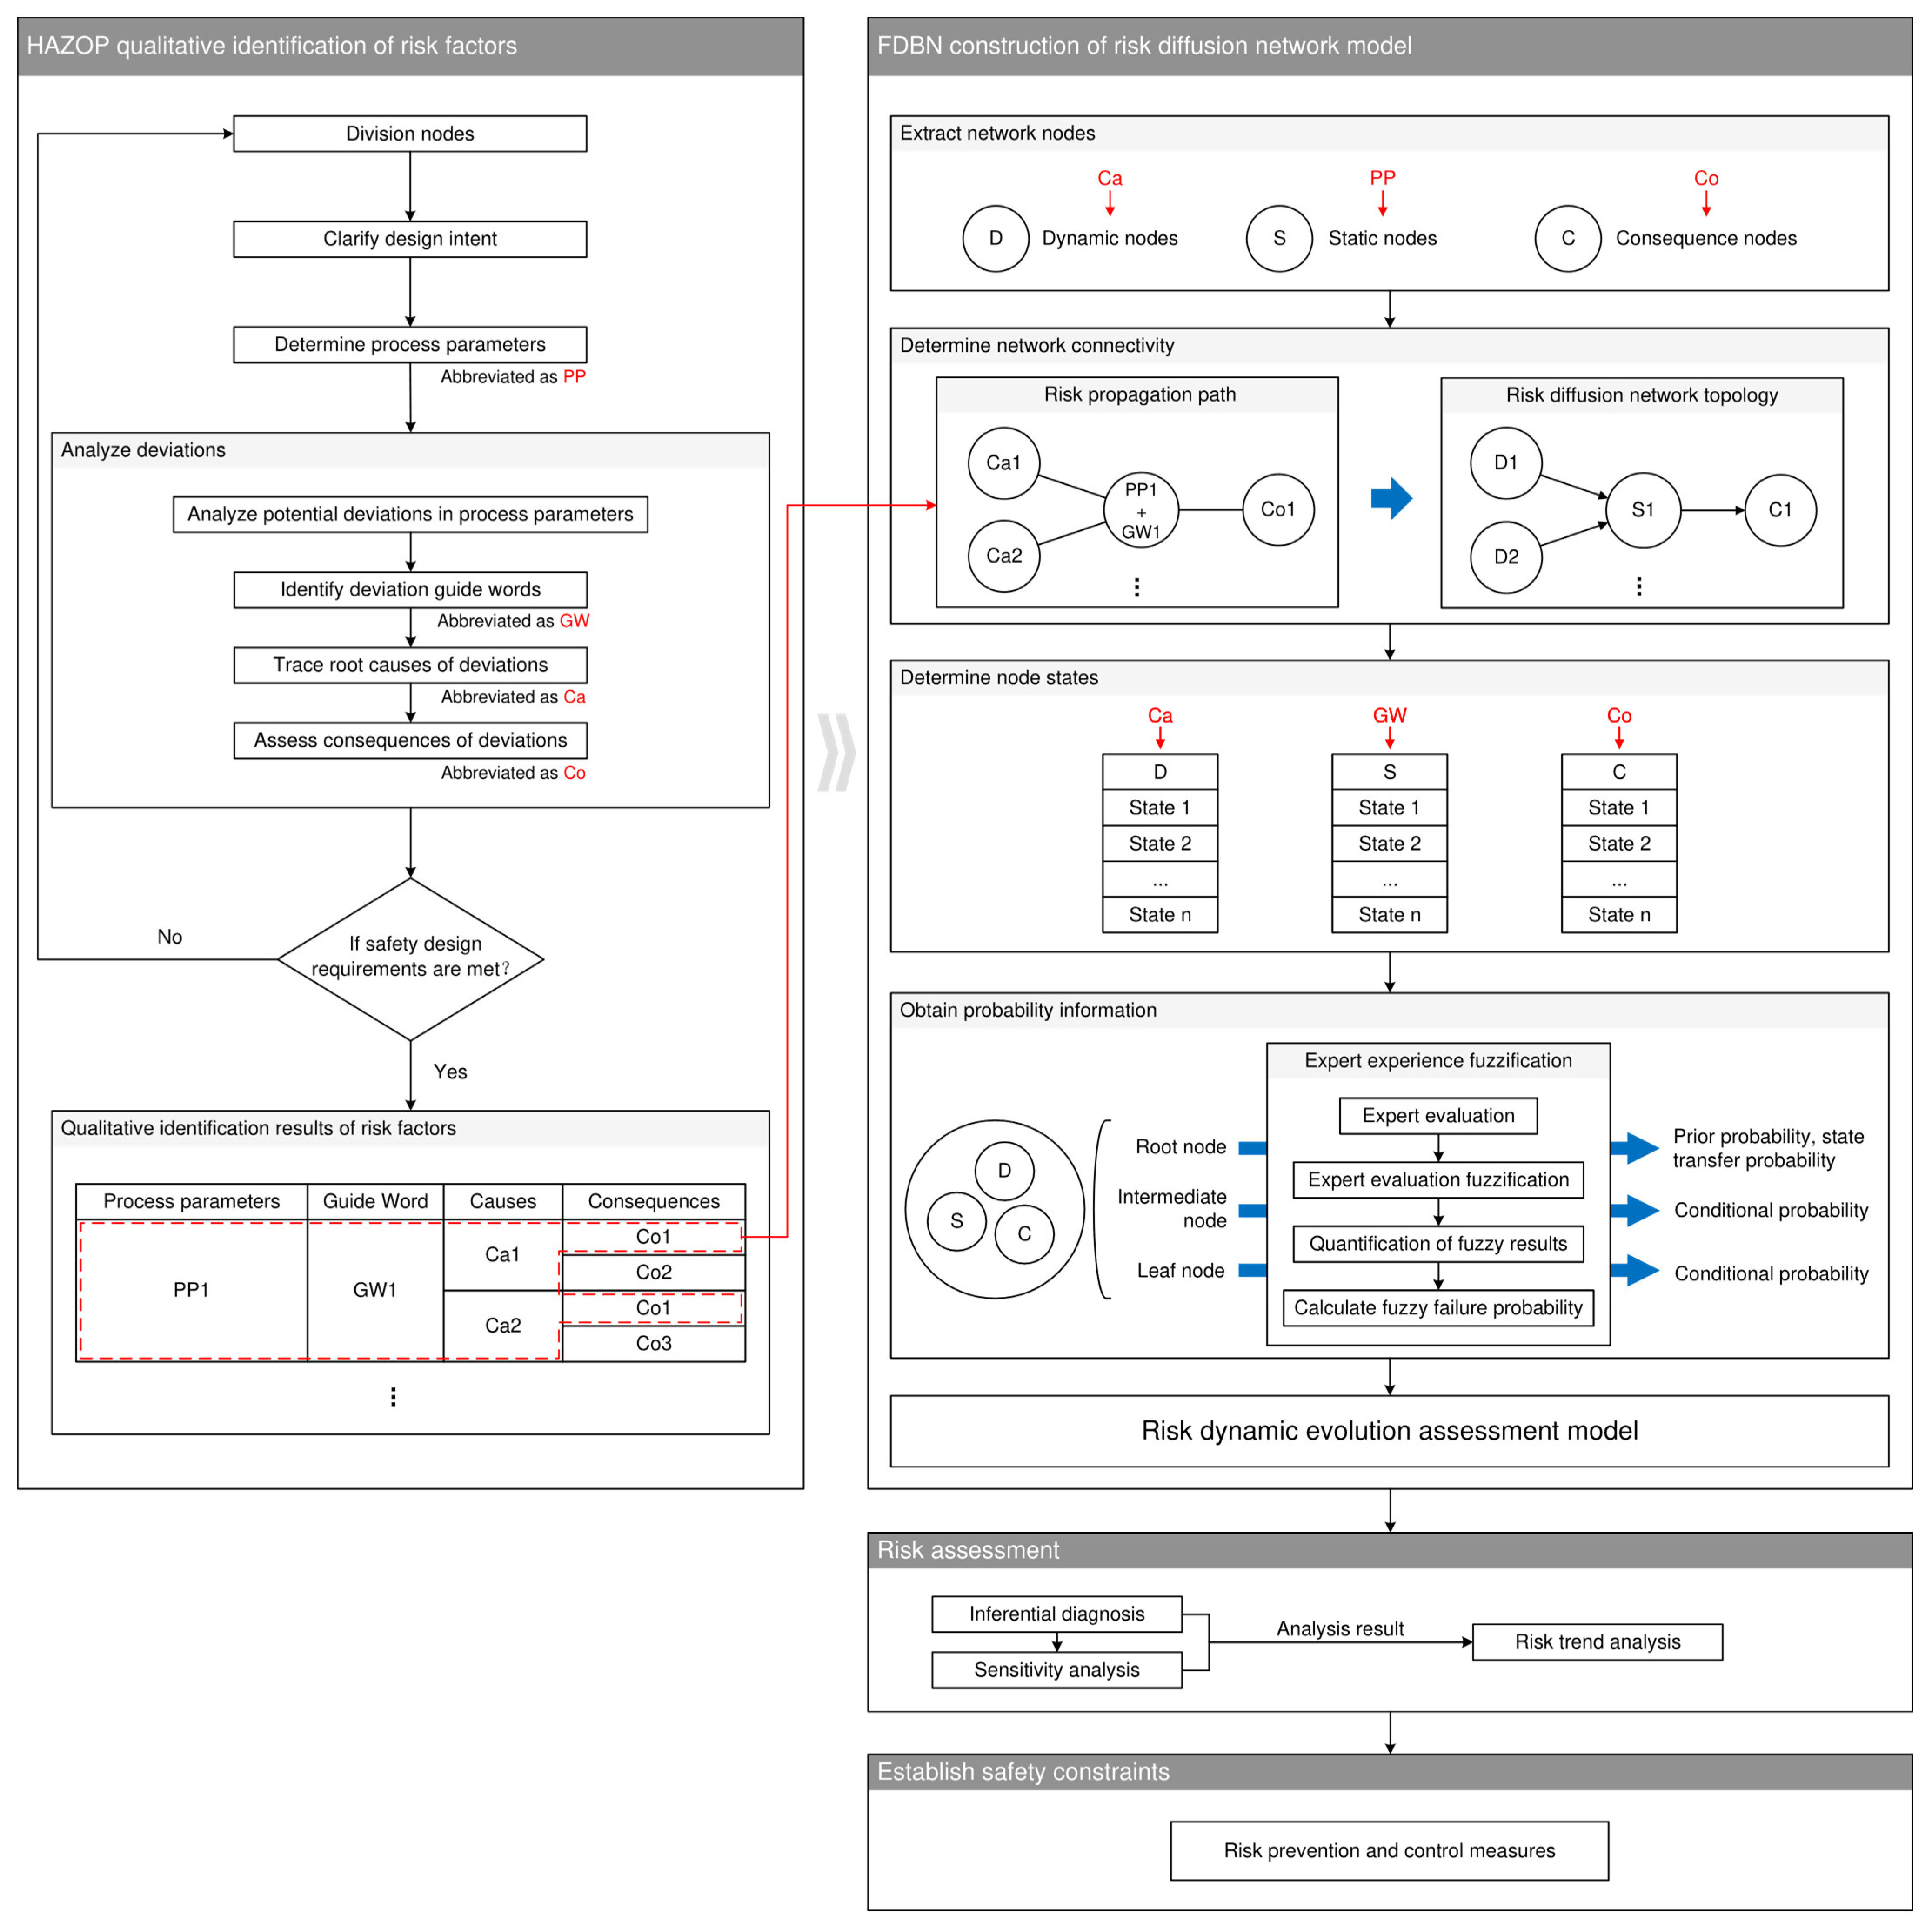
3. Methodological Framework
3.1. HAZOP Qualitative Identification of Risk Factors
3.2. FDBN Construction of Risk Diffusion Network Model
3.3. Risk Assessment
3.4. Establish Safety Constraints
4. Case Analysis
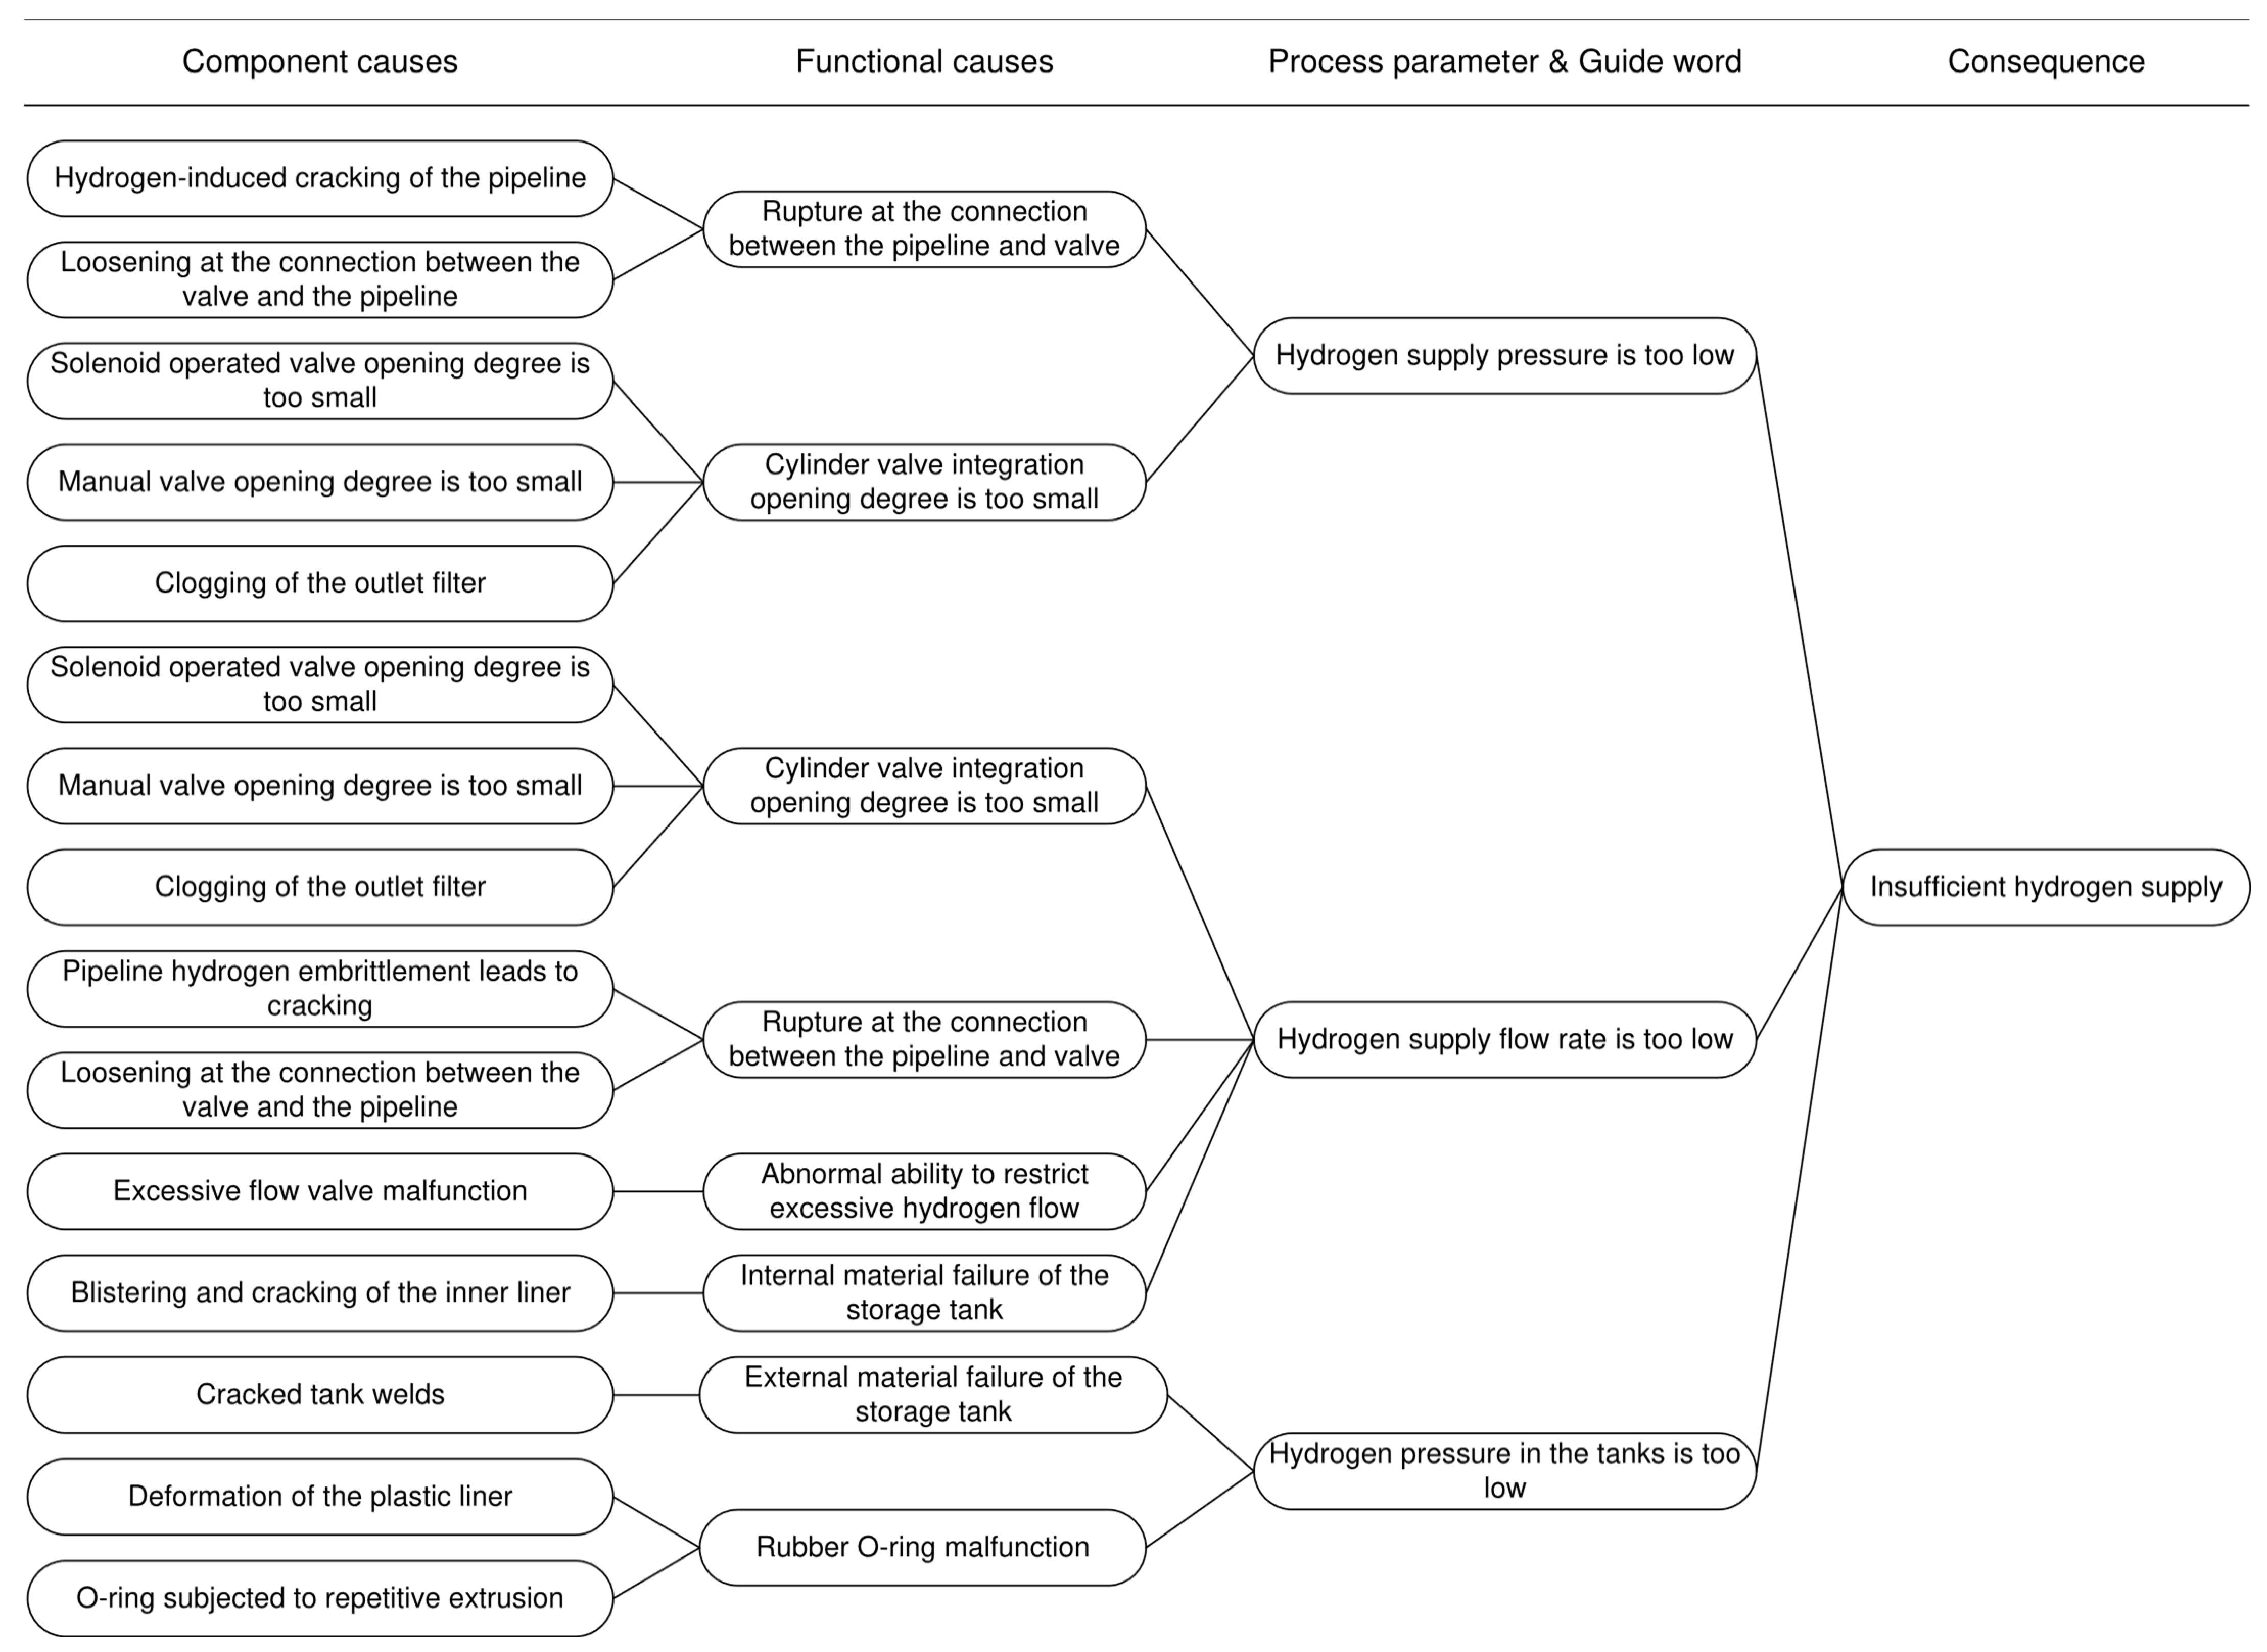
4.1. Identification of Risk Factors
4.1.1. Overview of Onboard Hydrogen Systems
4.1.2. Node Division
4.1.3. Clarify the Design Intent
4.1.4. Qualitative Identification Results of Risk Factors
4.2. Construction of Risk Diffusion Network
- It is assumed that the aircraft is in the same condition for each mission, with no consideration given to potential equipment failures due to human factors prior to takeoff.
- It is assumed that environmental conditions for each mission do not include sudden environmental factors like bird strikes and lightning. (According to airworthiness standards, the effect of bird strikes and lightning require dedicated testing, such as bird strike testing and HIRF testing).
- It is assumed that the aircraft performs the same task in each including identical takeoff and landing locations, routes, and task profiles.
4.2.1. Extract Network Nodes
4.2.2. Determine Network Connectivity
- 1.
- Risk propagation path
- 2.
- Risk diffusion network topology
4.2.3. Determine Node States
4.2.4. Obtain Probability Information
- Prior probabilities of root dynamic nodes
- 2.
- State transfer probabilities of root dynamic nodes
- 0→1 and 1→0 represent state changes, and their transition probabilities P0→1 and P1→0 are obtained through expert experience.
- 0→0 and 1→1 indicate the maintenance of the original state (no change). These probabilities are calculated based on the principle that probabilities sum to 1, i.e., P0→0 = 1 − P0→1, P1→1 = 1 − P1→0.
- 3.
- Conditional probabilities of intermediate dynamic nodes
- Combinations (0,0), (0,1), and (1,0), which involve at least one parent node in a risk state (State 0), thus determines the probability of State 1 (“False”) for node D1 through expert experience.
- Combination (1,1), where no parent node is in a risk state, thus determines the probability of State 0 (“True”) for node D1 though expert experience.
- 4.
- Conditional probabilities of static nodes and consequence nodes
4.3. Dynamic Assessment of Risk Evolution
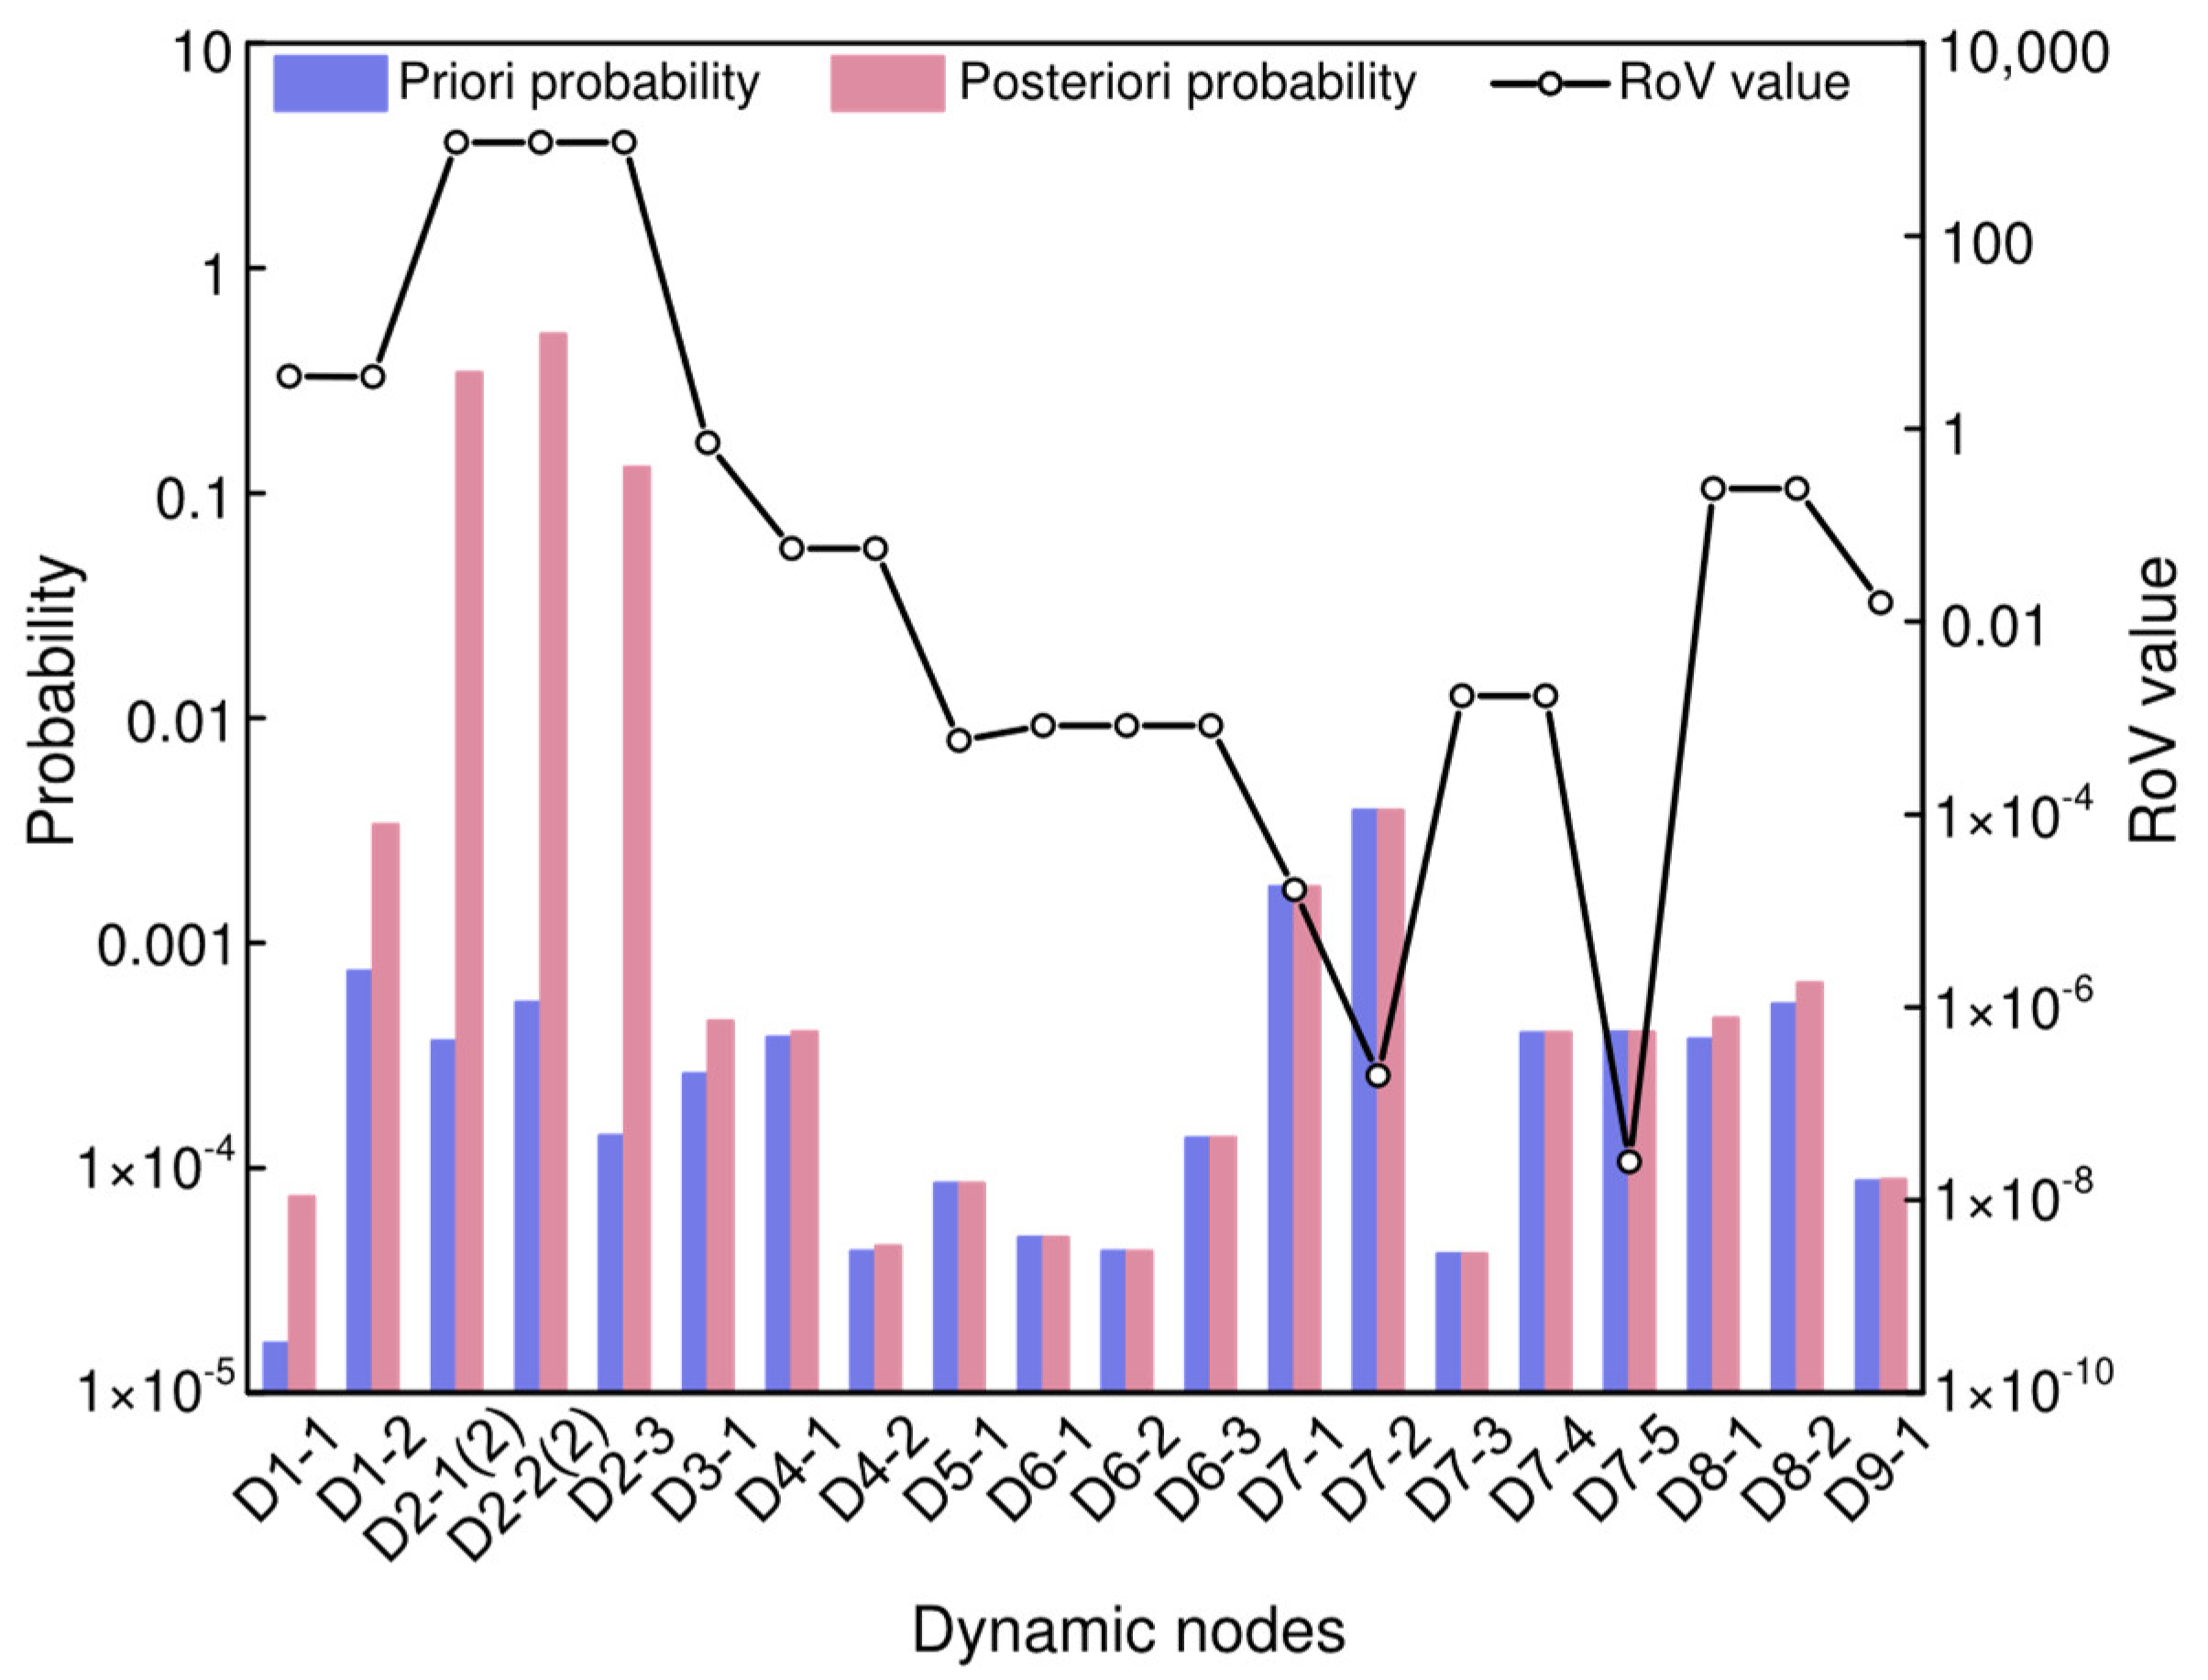
4.3.1. Inferential Diagnosis
4.3.2. Sensitivity Analysis
4.3.3. Risk Trend Analysis
4.4. Case Example of Establishing Safety Constraints
- Reducing the initial probability value of risk states
- During the design phase, adopting stricter design standards can define requirements that reduce the inherent failure probability. It is recommended to refer to the SAE ARP 4761A standard by adopting a dual solenoid coil redundancy design and providing independent power supply for the redundant system, while establishing a fault switching time tolerance range. Additionally, the valve materials can be upgraded to those with better adaptability in high-pressure hydrogen environments. The solenoid operated valve should also follow the RTCA DO-160G standard to design relevant environmental adaptability tests, evaluating its performance in airborne environments, and implement improvements to enhance its compatibility with onboard operational conditions.
- During the maintenance phase, enforcing rigorous inspection protocols maximizes fault reduction. For the vulnerable soft seals of the valve, implement a dual-control replacement strategy based on ‘operating hours + calendar lifespan’ (replacement is required if either upper limit is reached). Additionally, to mitigate failures due to improper installation, implementing measures such as enhanced worker training and improved installation guidelines is essential.
- Adjusting transition probabilities to minimize the likelihood of normal states evolving into risk states
- Solenoid operated valves installed in various aircraft locations must meet specific design requirements to ensure safety. Selecting valves that align better with the safety standards of their installation sites can help mitigate aging.
- In airborne environments, solenoid operated valves are subject to vibrations, which may significantly accelerate their aging. Consequently, modifying the installation position or incorporating protective devices can reduce vibrational impacts, thereby slowing the aging speed. The vibration response spectrum peaks can be reduced by installing shock-absorbing devices such as dampers. Additionally, the control logic can be optimized to lower the valve actuation frequency during non-critical phases (e.g., the cruise phase).
- Shortening the time window length
5. Discussion
6. Conclusions
- The transition probability of nodes in this study is set to a fixed value, which makes it difficult to characterize the fluctuation of state transition probability across time intervals. This is a practical approach for the early stages of lacking operational monitoring data, but when hydrogen-powered aircraft is put into operation and sufficient monitoring data are accumulated, the transition probability of nodes should be set to more realistic variable values, and the risk analysis results will be more refined.
- When practical application data are accumulated, the risk assessment model must be updated and adjusted in real-time to adapt to evolving system operating conditions. Specifically, the observed data from the real-world can be incorporated into the corresponding nodes of the FDBN model as evidence. These evidence values serve as the basis for aligning the model with actual operational scenarios, thereby enabling the iterative refinement of the quantitative risk assessment model.
Author Contributions
Funding
Institutional Review Board Statement
Informed Consent Statement
Data Availability Statement
Conflicts of Interest
References
- Platzer, M.F. The Prospects for Green Aviation by 2050. Prog. Aerosp. Sci. 2023, 141, 100926. [Google Scholar] [CrossRef]
- Platzer, M.F. A Perspective on the Urgency for Green Aviation. Prog. Aerosp. Sci. 2023, 141, 100932. [Google Scholar] [CrossRef]
- Khandelwal, B.; Karakurt, A.; Sekaran, P.R.; Sethi, V.; Singh, R. Hydrogen Powered Aircraft: The Future of Air Transport. Prog. Aerosp. Sci. 2013, 60, 45–59. [Google Scholar] [CrossRef]
- Wang, L.; Deng, X.; Gui, J.; Jiang, P.; Zeng, F.; Wan, S. A Review of Urban Air Mobility-Enabled Intelligent Transportation Systems: Mechanisms, Applications and Challenges. J. Syst. Archit. 2023, 141, 102902. [Google Scholar] [CrossRef]
- Huang, H.; Su, J.; Wang, F.-Y. The Potential of Low-Altitude Airspace: The Future of Urban Air Transportation. IEEE Trans. Intell. Veh. 2024, 9, 5250–5254. [Google Scholar] [CrossRef]
- Guo, D.; Zhang, Z.; Yang, B.; Zhang, J.; Yang, H.; Lin, Y. Integrating spoken instructions into flight trajectory prediction to optimize automation in air traffic control. Nat. Commun. 2024, 15, 9662. [Google Scholar] [CrossRef]
- Zhu, Z.; Li, X.; Chen, H.; Zhou, X.; Deng, W. An effective and robust genetic algorithm with hybrid multi-strategy and mechanism for airport gate allocation. Inf. Sci. 2024, 654, 119892. [Google Scholar] [CrossRef]
- Lin, Y.; Ruan, M.; Cai, K.; Li, D.; Zeng, Z.; Li, F.; Yang, B. Identifying and managing risks of AI-driven operations: A case study of auto-matic speech recognition for improving air traffic safety. Chin. J. Aeronaut. 2023, 36, 366–386. [Google Scholar] [CrossRef]
- Edwards, T.; Price, G. eVTOL Passenger Acceptance; Ames Research Center: Silicon Valley, CA, USA, 2020.
- Wang, Z.; Xing, Y.; Guo, J.; Zhao, W.; Chen, Y.; Guo, X. A Comprehensive Safety Risk Evaluation Method for Low-Altitude Flights. J. Eng. Sci. Technol. Rev. 2024, 17, 199–207. [Google Scholar] [CrossRef]
- Deng, W.; Feng, J.; Zhao, H. Autonomous path planning via sand cat swarm optimization with multi-strategy mechanism for un-manned aerial vehicles in dynamic environment. IEEE Internet Things J. 2025, in press. [Google Scholar] [CrossRef]
- Graydon, M.; Neogi, N.A.; Wasson, K. Guidance for Designing Safety into Urban Air Mobility: Hazard Analysis Techniques. In Proceedings of the AIAA Scitech 2020 Forum, Orlando, FL, USA, 6–10 January 2020; p. 2099. [Google Scholar]
- Nagashima, T.; Ding, M.; Fujii, K.; Takeda, K. Optimization of Aircraft Flight Paths Considering the Conflicting Parameters of Economy and Safety. In Proceedings of the 33rd Congress of the International Council of the Aeronautical Sciences, Stockholm, Sweden, 4–9 September 2022. [Google Scholar]
- Huang, C.; Ma, H.; Zhou, X.; Deng, W. Cooperative path planning of multiple unmanned aerial vehicles using cylinder vector particle swarm optimization with gene targeting. IEEE Sens. J. 2025, 25, 8470–8480. [Google Scholar] [CrossRef]
- Coelho, V.; Silva, P.; Sa, P.; Caetano, J.; Felix, L.; Afonso, F.; Marta, A. Design of a Tactical eVTOL UAV with a Hydrogen Fuel Cell. In Proceedings of the 2022 International Conference on Unmanned Aircraft Systems (ICUAS), Dubrovnik, Croatia, 21–24 June 2022; IEEE: New York, NY, USA, 2022; pp. 94–103. [Google Scholar]
- Huang, X.; Li, Y.; Ma, H.; Huang, P.; Zheng, J.; Song, K. Fuel Cells for Multirotor Unmanned Aerial Vehicles: A Comparative Study of Energy Storage and Performance Analysis. J. Power Sources 2024, 613, 234860. [Google Scholar] [CrossRef]
- Yao, R.; Zhao, H.; Zhao, Z.; Guo, C.; Deng, W. Parallel convolutional transfer network for bearing fault diagnosis under varying operation states. IEEE Trans. Instrum. Meas. 2024, 73, 3540713. [Google Scholar] [CrossRef]
- An, J.-H.; Kwon, D.-Y.; Jeon, K.-S.; Tyan, M.; Lee, J.-W. Advanced Sizing Methodology for a Multi-Mode eVTOL UAV Powered by a Hydrogen Fuel Cell and Battery. Aerospace 2022, 9, 71. [Google Scholar] [CrossRef]
- Li, J.; Deng, W.; Dang, X.J.; Zhao, H.M. Cross-domain adaptation fault diagnosis with maximum classifier discrepancy and deep feature alignment under variable working conditions. IEEE Trans. Reliab. 2025. [Google Scholar] [CrossRef]
- Alves, B.; Marta, A.; Felix, L. Multidisciplinary Optimisation of an eVTOL UAV with a Hydrogen Fuel Cell. In Proceedings of the 2022 International Conference on Unmanned Aircraft Systems (ICUAS), Dubrovnik, Croatia, 21–24 June 2022; IEEE: New York, NY, USA, 2022; pp. 134–143. [Google Scholar]
- Adler, E.J.; Martins, J.R.R.A. Hydrogen-Powered Aircraft: Fundamental Concepts, Key Technologies, and Environmental Impacts. Prog. Aerosp. Sci. 2023, 141, 100922. [Google Scholar] [CrossRef]
- Yan, S.; Zhong, X.; Shao, H.; Ming, Y.; Liu, C.; Liu, B. Digital twin-assisted imbalanced fault diagnosis framework using subdomain adaptive mechanism and margin-aware regularization. Reliab. Eng. Syst. Saf. 2023, 239, 109522. [Google Scholar] [CrossRef]
- Ma, C.; Zhang, T.; Jiang, Z.; Ren, Z. Dynamic analysis of lowering operations during floating offshore wind turbine assembly mating. Renew. Energy 2025, 243, 122528. [Google Scholar] [CrossRef]
- Jamshidi, A.; Ait-kadi, D.; Ruiz, A.; Rebaiaia, M.L. Dynamic Risk Assessment of Complex Systems Using FCM. Int. J. Prod. Res. 2018, 56, 1070–1088. [Google Scholar] [CrossRef]
- Hu, C.; Wang, P.; Youn, B.D. Advances in System Reliability Analysis Under Uncertainty. In Numerical Methods for Reliability and Safety Assessment: Multiscale and Multiphysics Systems; Kadry, S., El Hami, A., Eds.; Springer International Publishing: Cham, Switzerland, 2015; pp. 271–303. ISBN 978-3-319-07167-1. [Google Scholar]
- Song, Y.; Song, C. Adaptive evolutionary multitask optimization based on anomaly detection transfer of multiple similar sources. Expert Syst. Appl. 2025, 283, 127599. [Google Scholar]
- Xing, L.; Shrestha, A.; Dai, Y. Exact Combinatorial Reliability Analysis of Dynamic Systems with Sequence-Dependent Failures. Reliab. Eng. Syst. Saf. 2011, 96, 1375–1385. [Google Scholar] [CrossRef]
- Xiao, Y.; Shao, H.; Yan, S.; Wang, J.; Peng, Y.; Liu, B. Domain generalization for rotating machinery fault diagnosis: A survey. Adv. Eng. Inform. 2025, 64, 103063. [Google Scholar] [CrossRef]
- Kabir, S.; Papadopoulos, Y.; Walker, M.; Parker, D.; Aizpurua, J.I.; Lampe, J.; Rude, E. A Model-Based Extension to HiP-HOPS for Dynamic Fault Propagation Studies. In Model-Based Safety and Assessment; Bozzano, M., Papadopoulos, Y., Eds.; Springer International Publishing: Cham, Switzerland, 2017; pp. 163–178. [Google Scholar]
- Lilli, G.; Sanavia, M.; Oboe, R.; Vianello, C.; Manzolaro, M.; Ruvo, P.L.D.; Andrighetto, A. A Semi-Quantitative Risk Assessment of Remote Handling Operations on the SPES Front-End Based on HAZOP-LOPA. Reliab. Eng. Syst. Saf. 2024, 241, 109609. [Google Scholar] [CrossRef]
- Shen, Y.; Lv, H.; Hu, Y.; Li, J.; Lan, H.; Zhang, C. Preliminary Hazard Identification for Qualitative Risk Assessment on Onboard Hydrogen Storage and Supply Systems of Hydrogen Fuel Cell Vehicles. Renew. Energy 2023, 212, 834–854. [Google Scholar] [CrossRef]
- Joubert, F.; Steyn, E.; Pretorius, L. Using the HAZOP Method to Conduct a Risk Assessment on the Dismantling of Large Industrial Machines and Associated Structures: Case Study. J. Constr. Eng. Manag. 2021, 147. [Google Scholar] [CrossRef]
- Moradi, R.; Groth, K.M. Hydrogen Storage and Delivery: Review of the State of the Art Technologies and Risk and Reliability Analysis. Int. J. Hydrogen Energy 2019, 44, 12254–12269. [Google Scholar] [CrossRef]
- Jafari, M.J.; Pouyakian, M.; Khanteymoori, A.; Hanifi, S.M. Development of a Framework for Dynamic Risk Assessment of Environmental Impacts in Chemicals Warehouse Using CFD-BN. Int. J. Environ. Sci. Technol. 2021, 18, 3189–3204. [Google Scholar] [CrossRef]
- Rathnayaka, S.; Khan, F.; Amyotte, P. SHIPP Methodology: Predictive Accident Modeling Approach. Part II. Validation with Case Study. Process Saf. Environ. Prot. 2011, 89, 75–88. [Google Scholar] [CrossRef]
- Sun, L.; Li, Y.F.; Zio, E. Comparison of the HAZOP, FMEA, FRAM, and STPA Methods for the Hazard Analysis of Automatic Emergency Brake Systems. ASCE-ASME J. Risk Uncertain. Eng. Syst. Part B Mech. Eng. 2022, 8, 031104. [Google Scholar] [CrossRef]
- Giardina, M.; Morale, M. Safety Study of an LNG Regasification Plant Using an FMECA and HAZOP Integrated Methodology. J. Loss Prev. Process Ind. 2015, 35, 35–45. [Google Scholar] [CrossRef]
- Oh, K.-S.; Jeong, E.; Shim, W.S.; Baek, J.-B. The Effectiveness of Pressure Safety Valves in Chemical Supply Systems to Prevent Fire, Explosion, and Overpressure in the Korean Semiconductor Industry. Fire 2023, 6, 344. [Google Scholar] [CrossRef]
- Weber, P.; Medina-Oliva, G.; Simon, C.; Iung, B. Overview on Bayesian Networks Applications for Dependability, Risk Analysis and Maintenance Areas. Eng. Appl. Artif. Intell. 2012, 25, 671–682. [Google Scholar] [CrossRef]
- Liu, M.; Wu, L.; Hou, M. Dynamic Risk Assessment of a Coal Slurry Preparation System Based on the Structure-Variable Dynamic Bayesian Network. PLoS ONE 2024, 19, e0302044. [Google Scholar] [CrossRef] [PubMed]
- Kabir, S.; Papadopoulos, Y. Applications of Bayesian Networks and Petri Nets in Safety, Reliability, and Risk Assessments: A Review. Saf. Sci. 2019, 115, 154–175. [Google Scholar] [CrossRef]
- Liu, Z.; Liu, Y.; Zhang, D.; Cai, B.; Zheng, C. Fault Diagnosis for a Solar Assisted Heat Pump System under Incomplete Data and Expert Knowledge. Energy 2015, 87, 41–48. [Google Scholar] [CrossRef]
- Ahmadisourenabadi, B.; Marzband, M.; Hosseini-Hemati, S.; Sadati, S.M.B.; Rastgou, A. Quantifying and Enabling the Resiliency of a Microgrid Considering Electric Vehicles Using a Bayesian Network Risk Assessment. Energy 2024, 308, 133036. [Google Scholar] [CrossRef]
- Yazdi, M.; Kabir, S.; Walker, M. Uncertainty Handling in Fault Tree Based Risk Assessment: State of the Art and Future Perspectives. Process Saf. Environ. Prot. 2019, 131, 89–104. [Google Scholar] [CrossRef]
- Badr, A.; Yosri, A.; Hassini, S.; El-Dakhakhni, W. Coupled continuous-time Markov chain–Bayesian network model for dam failure risk prediction. J. Infrastruct. Syst. 2021, 27, 04021041. [Google Scholar] [CrossRef]
- Guo, C.; Wu, W. Risk Assessment of disconnect operations of MNPP using similarity aggregation method based fuzzy dynamic bayesian networks model. Ocean. Eng. 2023, 285, 115390. [Google Scholar] [CrossRef]
- Zadeh, L.A. Fuzzy Sets. Inf. Control. 1965, 8, 338–353. [Google Scholar] [CrossRef]
- Aydin, M.; Akyuz, E.; Turan, O.; Arslan, O. Validation of risk analysis for ship collision in narrow waters by using fuzzy bayesian networks approach. Ocean. Eng. 2021, 231, 108973. [Google Scholar] [CrossRef]
- Yin, H.; Liu, C.; Wu, W.; Song, K.; Liu, D.; Dan, Y. Safety assessment of natural gas storage tank using similarity aggregation method based fuzzy fault tree analysis (SAM-FFTA) approach. J. Loss Prev. Process Ind. 2020, 66, 104159. [Google Scholar] [CrossRef]
- Guo, X.; Ji, J.; Khan, F.; Ding, L.; Tong, Q. A novel fuzzy dynamic bayesian network for dynamic risk assessment and uncertainty propagation quantification in uncertainty environment. Saf. Sci. 2021, 141, 105285. [Google Scholar] [CrossRef]
- Deng, W.; Wang, J.; Guo, A.; Zhao, H. Quantum differential evolutionary algorithm with quantum-adaptive mutation strategy and population state evaluation framework for high-dimensional problems. Inf. Sci. 2024, 676, 120787. [Google Scholar] [CrossRef]
- Long, H.; Chen, T.; Chen, H.; Zhou, X.; Deng, W. Principal space approximation ensemble discriminative marginalized least-squares regression for hyperspectral image classification. Eng. Appl. Artif. Intell. 2024, 133, 108031. [Google Scholar] [CrossRef]
- Chen, H.; Sun, Y.; Li, X.; Zheng, B.; Chen, T. Dual-Scale Complementary spatial-spectral joint model for hyperspectral image classification. IEEE J. Sel. Top. Appl. Earth Obs. Remote Sens. 2025, 18, 6772–6789. [Google Scholar] [CrossRef]
- Li, M.; Chen, Y.; Lu, Z.; Ding, F.; Hu, B. ADED: Method and device for automatically detecting early depression using multimodal physiological signals evoked and perceived via various emotional scenes in virtual reality. IEEE Trans. Instrum. Meas. 2025, 74, 2524016. [Google Scholar] [CrossRef]
- Huang, C.; Song, Y.; Ma, H.; Zhou, X.; Deng, W. A multiple level competitive swarm optimizer based on dual evaluation criteria and global optimization for large-scale optimization problem. Inf. Sci. 2025, 708, 122068. [Google Scholar] [CrossRef]
- Li, M.; Li, J.; Chen, Y.; Hu, B. Stress severity detection in college students using emotional pulse signals and deep learning. IEEE Trans. Affect. Comput. 2025. [Google Scholar] [CrossRef]
- Deng, W.; Shen, J.; Ding, J.; Zhao, H. Robust dual-model collaborative broad learning system for classification under label noise environments. IEEE Internet Things J. 2025. [Google Scholar] [CrossRef]
- Zhao, H.; Wu, Y.; Deng, W. Fuzzy broad neuroevolution networks via multiobjective evolutionary algorithms: Balancing structural simplification and performance. IEEE Trans. Instrum. Meas. 2025, 74, 2505910. [Google Scholar] [CrossRef]
- Ma, F.; Ji, C.; Wang, J.; Sun, W. Early identification of process deviation based on convolutional neural network. Chin. J. Chem. Eng. 2023, 56, 104–118. [Google Scholar] [CrossRef]
- Pearl, J. Probabilistic Reasoning in Intelligent Systems: Networks of Plausible Inference; Elsevier: New York, NY, USA, 2014. [Google Scholar]
- Adedigba, S.A.; Khan, F.; Yang, M. Dynamic safety analysis of process systems using nonlinear and non-sequential accident model. Chem. Eng. Res. Des. 2016, 111, 169–183. [Google Scholar] [CrossRef]
- Neapolitan, R.E. Learning Bayesian Networks. In Proceedings of the 13th ACM SIGKDD International Conference on Knowledge Discovery and Data Mining, San Jose, CA, USA, 12–15 August 2007; ACM: New York, NY, USA, 2007; p. 1. [Google Scholar]
- Pan, Y.; Zhang, L.; Li, Z.; Ding, L. Improved fuzzy bayesian network-based risk analysis with interval-valued fuzzy sets and D–S evidence theory. IEEE Trans. Fuzzy Syst. 2020, 28, 2063–2077. [Google Scholar] [CrossRef]
- Taylan, O.; Bafail, A.O.; Abdulaal, R.M.S.; Kabli, M.R. Construction projects selection and risk assessment by fuzzy AHP and fuzzy TOPSIS methodologies. Appl. Soft Comput. 2014, 17, 105–116. [Google Scholar] [CrossRef]
- Chen, J.-F.; Hsieh, H.-N.; Do, Q.H. Evaluating teaching performance based on fuzzy AHP and comprehensive evaluation approach. Appl. Soft Comput. 2015, 28, 100–108. [Google Scholar] [CrossRef]
- Zheng, J.; Liang, P.; Zhao, H.; Deng, W. A broad sparse fine-grained image classification model based on dictionary selection strategy. IEEE Trans. Reliab. 2024, 73, 576–588. [Google Scholar] [CrossRef]
- Guo, X.; Ji, J.; Khan, F.; Ding, L.; Yang, Y. Fuzzy Bayesian network based on an improved similarity aggregation method for risk assessment of storage tank accident. Process Saf. Environ. Prot. 2021, 149, 817–830. [Google Scholar] [CrossRef]
- Ren, J.; Jenkinson, I.; Wang, J.; Xu, D.L.; Yang, J.B. An Offshore Risk Analysis Method Using Fuzzy Bayesian Network. J. Offshore Mech. Arct. Eng. 2009, 131, 041101. [Google Scholar] [CrossRef]
- Sugeno, M.; Kang, G.T. Fuzzy Modelling and Control of Multilayer Incinerator. Fuzzy Sets Syst. 1986, 18, 329–345. [Google Scholar] [CrossRef]
- Onisawa, T. An Approach to Human Reliability in Man-Machine Systems Using Error Possibility. Fuzzy Sets Syst. 1988, 27, 87–103. [Google Scholar] [CrossRef]
- Mirzaei Aliabadi, M.; Pourhasan, A.; Mohammadfam, I. Risk Modelling of a Hydrogen Gasholder Using Fuzzy Bayesian Network (FBN). Int. J. Hydrogen Energy 2020, 45, 1177–1186. [Google Scholar] [CrossRef]
- Dang, X.; Liu, H.; Wu, D.; Shao, Y.; Yang, Z. Uncontained Rotor Safety Analysis and Optimization Based on FTA-BN Model with LOPA. J Aeronaut Astronaut. 2024, 56, 703–713. [Google Scholar]
- Wu, X.; Liu, H.; Zhang, L.; Skibniewski, M.J.; Deng, Q.; Teng, J. A Dynamic Bayesian Network Based Approach to Safety Decision Support in Tunnel Construction. Reliab. Eng. Syst. Saf. 2015, 134, 157–168. [Google Scholar] [CrossRef]
- Zarei, E.; Azadeh, A.; Khakzad, N.; Aliabadi, M.M.; Mohammadfam, I. Dynamic Safety Assessment of Natural Gas Stations Using Bayesian Network. J. Hazard. Mater. 2017, 321, 830–840. [Google Scholar] [CrossRef]


| Linguistic Value | Fuzzy Set | |||
|---|---|---|---|---|
| a | b | c | d | |
| VL | 0 | 0 | 0.1 | 0.2 |
| L | 0.1 | 0.2 | 0.2 | 0.3 |
| ML | 0.2 | 0.3 | 0.4 | 0.5 |
| M | 0.4 | 0.5 | 0.5 | 0.6 |
| MH | 0.5 | 0.6 | 0.7 | 0.8 |
| H | 0.7 | 0.8 | 0.8 | 0.9 |
| VH | 0.8 | 0.9 | 1 | 1 |
| Constitution | Classification | Weight Score |
|---|---|---|
| Professional title | Technical director | 10 |
| Technical consultant | 8 | |
| Engineer | 6 | |
| Research duration (years) | ≥20 | 10 |
| 15~19 | 8 | |
| 10~14 | 6 | |
| 6~9 | 4 | |
| Age (years old) | ≥50 | 10 |
| 40~49 | 8 | |
| 30~39 | 6 |
| Step | Description |
|---|---|
| Division of nodes | According to the design intent of the onboard hydrogen system, the system is decomposed into subsystems with different functions, which are considered as nodes for HAZOP. |
| Clarify the design intent | Clearly define the design intent of the subsystems and all their components, including the hydrogen supply process, subsystem functions, and the functions of each component. |
| Determine process parameters | The operational integrity of the system requires that critical parameters be maintained within specified safety thresholds, and critical design parameters whose deviations may trigger hazardous system events need to be identified. |
| Analyze deviations | The core of HAZOP lies in analyzing deviations, which involves four main steps: (a) Analysis of potential deviations in process parameters System abnormal operating states manifest through deviations in state parameters, necessitating screening of potential deviations that may induce functional anomalies. (b) Identification of deviation guide words Process parameters may deviate in distinct directions. Guide words are employed to intuitively express deviation orientations, establishing standardized terminology to define analytical objectives. (c) Tracing root causes of deviations Process parameter deviations originate from abnormal operations of system components or functional units. By correlating with system architecture, this traces risk propagation paths from fault sources to measurable parameter deviations, analyzing causation mechanisms. (d) Assessment of deviation consequences Process deviations propagate to system-level manifestations, demonstrating hazardous events caused by abnormal operations. This clarifies cascading impact progression and identifies system-level hazardous consequences induced by deviations. |
| Iteration of the analysis process | Risk assessment shall be anchored in safety-driven design requirements allocation, with evaluation results requiring completeness validation of analysis nodes and demonstration of requirement traceability to fulfill verification objectives. |
| Qualitative identification results of risk factors | Organize process parameters, deviation guide words, root causes, and consequences in a table format to form the final risk factor identification results. |
| Step | Description |
|---|---|
| Extract network nodes | Extract the nodes of the DBN model from the results of the HAZOP, designating the causes of deviations as dynamic nodes, the process parameters as static nodes, and the accident consequences as consequence nodes. |
| Determine network connectivity | HAZOP is based on the risk propagation relationships involving root causes, process deviations, and consequences. According to the risk factors identification results table, it is possible to determine the connections between dynamic nodes, static nodes, and consequence nodes. Use risk propagation paths to represent these relationships and map them into the topological structure of the risk diffusion network. |
| Determine node states | Each node has normal and risk states. The risk states of dynamic nodes are determined by the causes of process parameter deviations. The risk states of static nodes are determined by deviation guide words. The risk states of consequence nodes are determined by the consequences of process deviations leading to accidents. |
| Obtain probability information | Probability information is obtained as probabilistic information through fuzzy processing expert experience, which is divided into five steps in total: (a) Expert evaluation The expert evaluates the probability of all risk factors according to the system architecture and collects the results of the expert evaluation. (b) Quantification of fuzzy results Based on steps 1 to 6 of SAM introduced in Section 2.3, the expert evaluation results are integrated into overall fuzzy numbers. (c) Calculate FFP Based on Steps 7 and 8 of the SAM introduced in Section 2.3, the overall fuzzy numbers are defuzzified to obtain the fuzzy failure probabilities. The node states that need to determine the risk probability through defuzzified expert opinions are more flexible and need to be judged based on the actual system architecture constructed by DBN. Usually, the root node needs to determine the a priori probability, and if the root node is a dynamic node, it also needs to determine the state transfer probability of the risk state; the intermediate node and the leaf node need to determine the conditional probability of the risk state. |
| Risk dynamic evolution assessment model | Integrate the topology network structure and risk probability information of DBN to develop an FDBN model as a risk dynamic evolution assessment model. |
| Step | Description |
|---|---|
| Inferential diagnosis | The probability of occurrence of the risk state in the BN for the initial time slice is set to 1. The posteriori probability of each root node is obtained by updating the model using DBN backward inference. Events represented by nodes with higher posterior probabilities are identified as the primary events that contribute to the occurrence of hazardous incidents. |
| Sensitivity analysis | Based on prior probabilities and posterior probabilities, the RoV values are calculated using Equation (12). Nodes with higher RoV values are identified as the main dependent nodes of consequence nodes, thereby establishing the events represented by these nodes as significant contributors to the occurrence of hazardous incidents. |
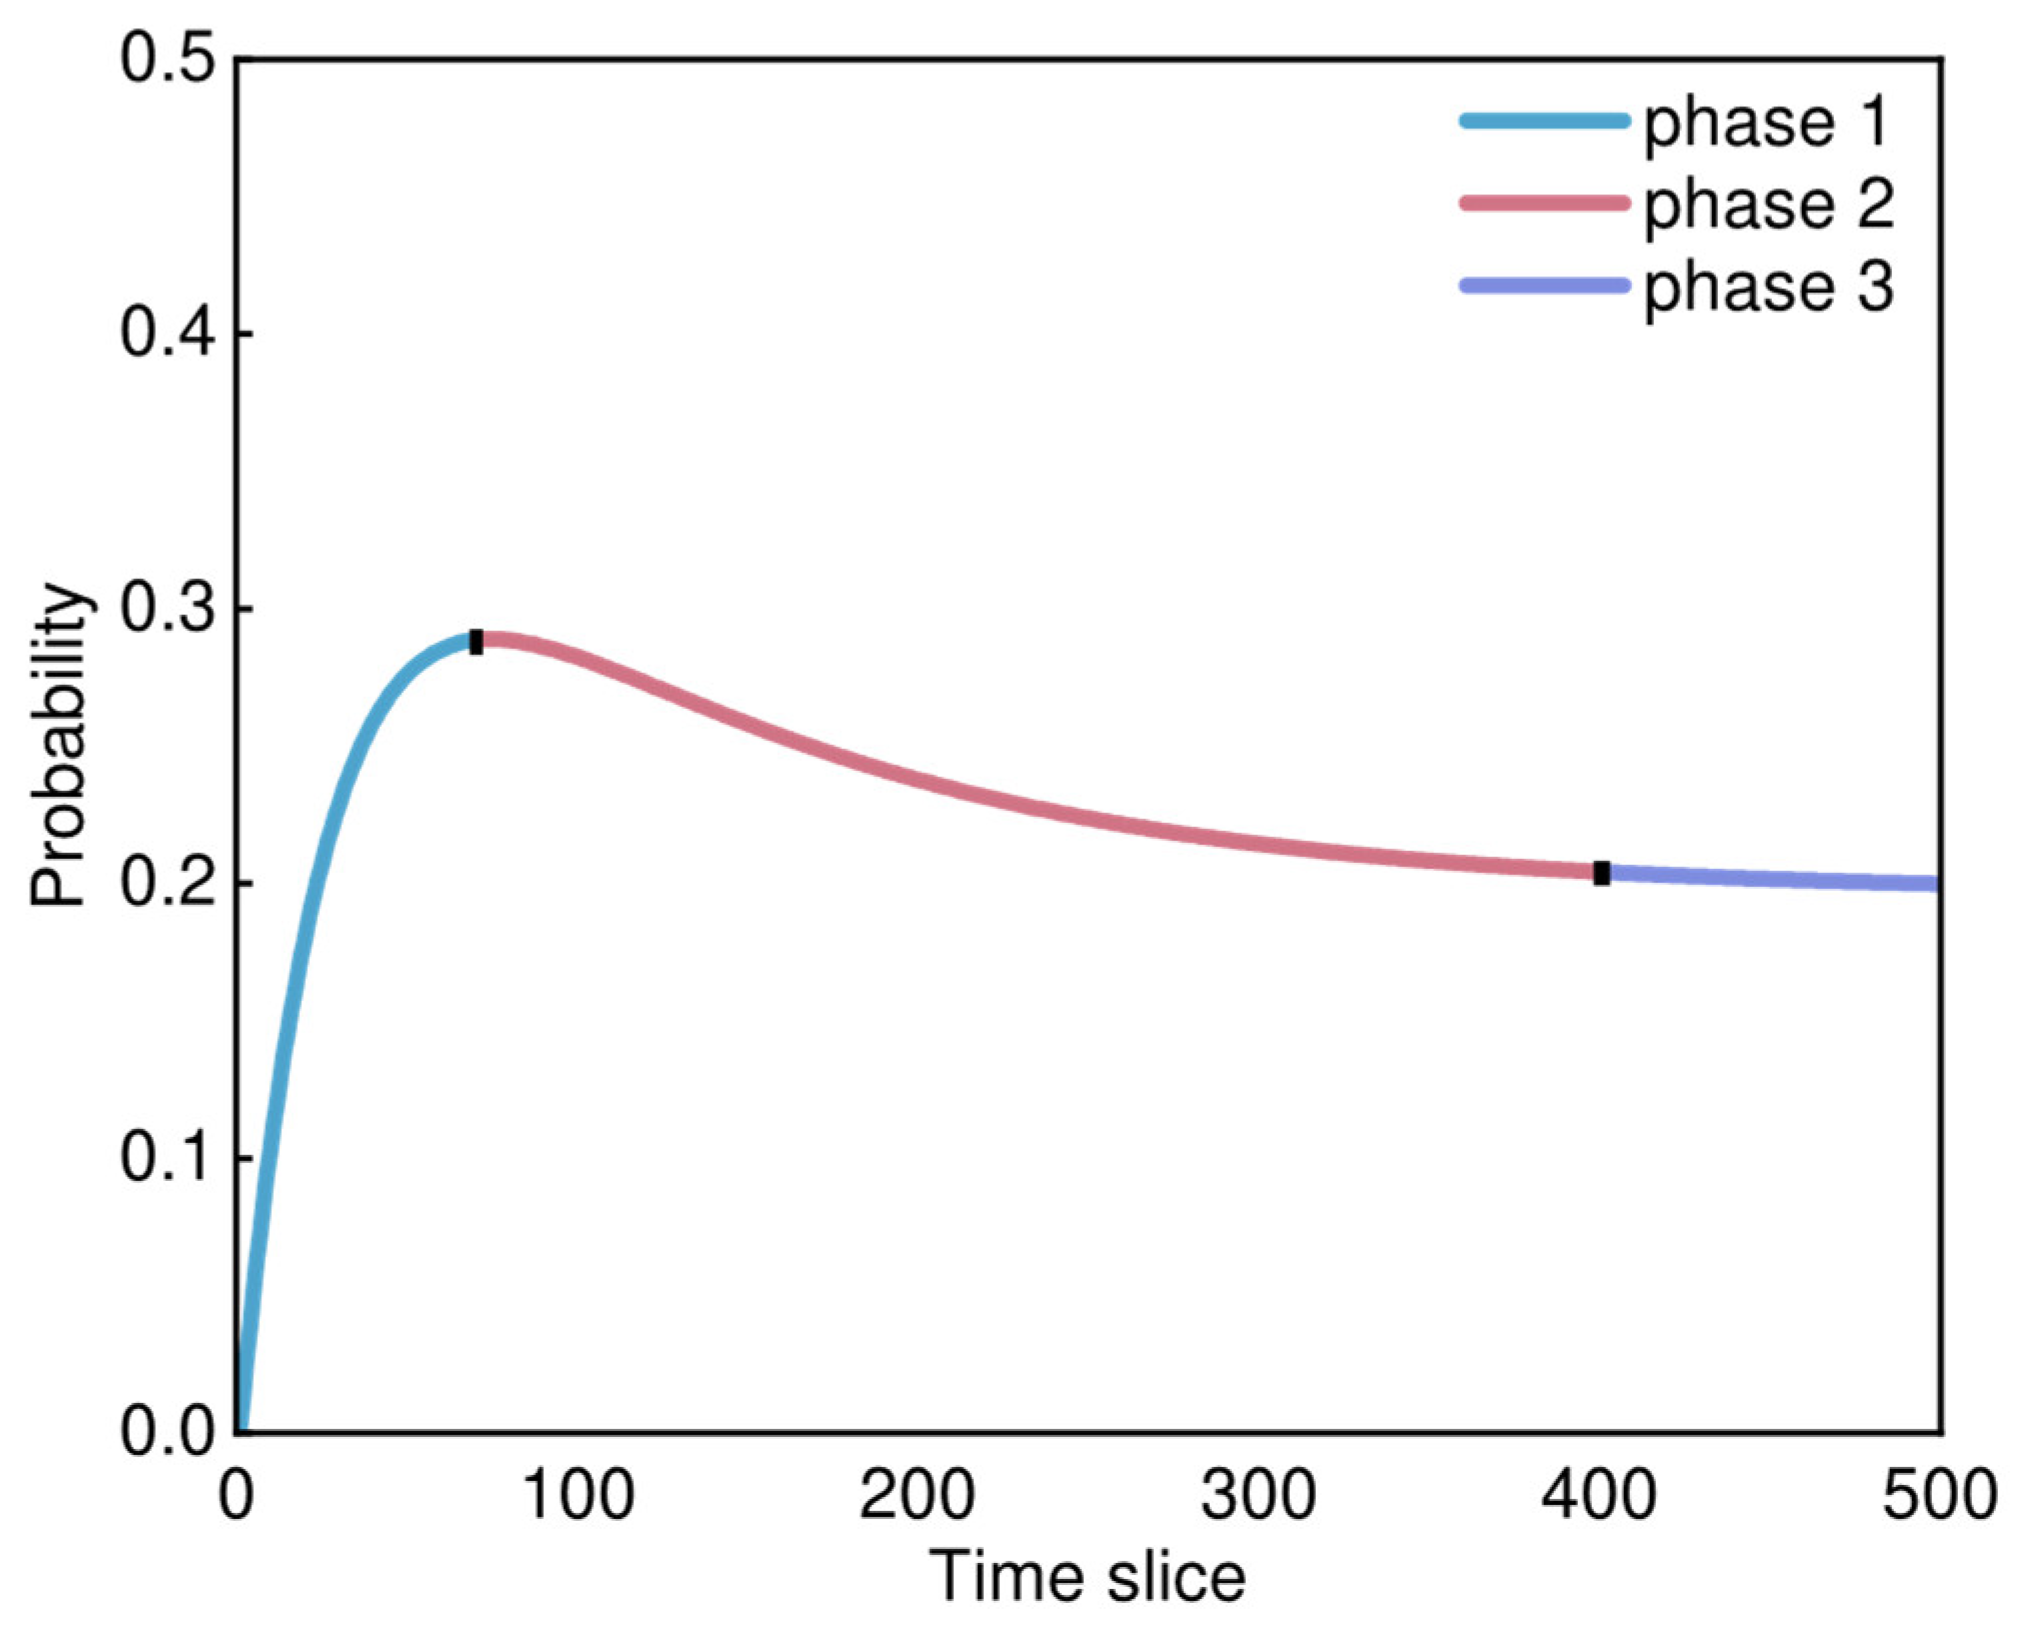
| Risk trend analysis | Select the primary components identified through inferential diagnosis and sensitivity analysis as contributing to the risks associated with the onboard hydrogen system. Based on the results of the FDBN calculations, analyzing the failure probability change curves to identify the different stages of components from normal to failure. |
| Subsystem | Supplying Process | System Functions |
|---|---|---|
| Hydrogen storage system | Storage of high-pressure hydrogen. | |
| Regulation of high-pressure hydrogen supply and hydrogen flow. | ||
| Management of hydrogen discharge from storage cylinders. | ||
| Hydrogen refueling system | Ensure rapid and stable hydrogen refilling. | |
| Hydrogen supply system | Reduce the pressure of high-pressure hydrogen gas and ensure a stable supply to the hydrogen internal combustion engine. | |
| Hydrogen venting system | Rapidly and safely vent hydrogen in specific situations. | |
| Node Number | Subsystem |
|---|---|
| Node 1 | Hydrogen storage system |
| Node 2 | Hydrogen refueling system |
| Node 3 | Hydrogen supply system |
| Node 4 | Hydrogen venting system |
| Unit | Component | Function |
|---|---|---|
| Hydrogen storage tank | Type IV hydrogen storage cylinders | Store high-pressure hydrogen gas. |
| Temperature sensor | Measure the hydrogen temperature in storage cylinders. | |
| High pressure sensor | Measure the hydrogen pressure in storage cylinders. | |
| Cylinder valve integration | Outlet filter | Filter impurities from the hydrogen gas. |
| Excessive flow valve | Automatic cut-off of the gas flow when the hydrogen flow rate seriously exceeds the usage limit. | |
| Solenoid operated valve | Adjust hydrogen flow based on signals. | |
| Control the start/stop of the hydrogen supply based on signals. | ||
| Manual valve | The operator manually controls the hydrogen supply. |
| Process Parameter | Guide Word | Cause | Consequence | Safety Measures | |
|---|---|---|---|---|---|
| Functional Causes | Component Causes | ||||
| Hydrogen supply pressure | Too low | Rupture at the connection between the pipeline and valve | Pipeline hydrogen embrittlement leads to cracking | Hydrogen leakage Insufficient hydrogen supply Unstable combustion in hydrogen internal combustion engines | Regular maintenance of the pipeline Install hydrogen leakage detection device Timely removal of leaked hydrogen gas |
| Loosening at the connection between the valve and the pipeline | Hydrogen leakage Insufficient hydrogen supply Unstable combustion in hydrogen internal combustion engines | Install hydrogen leakage detection device Timely removal of leaked hydrogen gas Regularly check the tightness of the pipeline -valve connection | |||
| Cylinder valve integration opening degree is too small | Solenoid operated valve opening degree is too small | Insufficient hydrogen supply Unstable combustion in hydrogen internal combustion engines | Regular maintenance of the solenoid operated valve | ||
| Manual valve opening degree is too small | Insufficient hydrogen supply Unstable combustion in hydrogen internal combustion engines | Regular maintenance of the manual valve | |||
| Clogging of the outlet filter | Insufficient hydrogen supply Unstable combustion in hydrogen internal combustion engines | Periodic replacement of the outlet filter | |||
| Hydrogen supply flow rate | Too high | Cylinder valve integration opening degree is too large | Solenoid operated valve opening degree is too large | Pre-ignition Backfire | Regular maintenance of the solenoid operated valve |
| Manual valve opening degree is too large | Pre-ignition Backfire | Regular maintenance of the manual valve | |||
| Abnormal ability to restrict excessive hydrogen flow | Excessive flow valve malfunction | Unstable combustion in hydrogen internal combustion engines Pre-ignition Backfire | Regular maintenance of the excessive hydrogen flow | ||
| Too low | Cylinder valve integration opening degree is too small | Solenoid operated valve opening degree is too small | Insufficient hydrogen supply Unstable combustion in hydrogen internal combustion engines | Regular maintenance of the solenoid operated valve | |
| Manual valve opening degree is too small | Insufficient hydrogen supply Unstable combustion in hydrogen internal combustion engines | Regular maintenance of the manual valve | |||
| Clogging of the outlet filter | Insufficient hydrogen supply Unstable combustion in hydrogen internal combustion engines | Periodic replacement of the outlet filter | |||
| Rupture at the connection between the pipeline and valve | Pipeline hydrogen embrittlement leads to cracking | Hydrogen leakage Insufficient hydrogen supply Unstable combustion in hydrogen internal combustion engines | Regular maintenance of the pipeline Install hydrogen leakage detection device Timely removal of leaked hydrogen gas | ||
| Loosening at the connection between the valve and the pipeline | Hydrogen leakage Insufficient hydrogen supply Unstable combustion in hydrogen internal combustion engines | Install hydrogen leakage detection device Timely removal of leaked hydrogen gas Regularly check the tightness of the pipeline -valve connection | |||
| Abnormal ability to restrict excessive hydrogen flow | Excessive flow valve malfunction | Unstable combustion in hydrogen internal combustion engines Pre-ignition Backfire | Regular maintenance of the excessive hydrogen flow | ||
| Hydrogen temperature in the tanks | Too high | Hydrogen emission delay | TPRD fails to fully open | Increased burden on the thermal management system | Regular maintenance of the TPRD |
| Excessive buildup of deposits in the emptying pipeline or hydrogen vent port | Increased burden on the thermal management system | Regular cleaning of the emptying pipeline and hydrogen vent port | |||
| Lack of accurate temperature feedback | Temperature sensor malfunction | Increased burden on the thermal management system | Regular replacement of the temperature sensor | ||
| Hydrogen pressure in the tanks | Too low | Internal material failure of the storage tank | Blistering and cracking of the inner liner | Hydrogen leakage Insufficient hydrogen supply Reduction in hydrogen storage efficiency | Regular replacement of the hydrogen storage tanks |
| Bulging and collapse of the inner liner | Reduction in hydrogen storage efficiency | Regular replacement of the hydrogen storage tanks | |||
| Fatigue damage to the inner liner | Reduction in hydrogen storage efficiency | Regular replacement of the hydrogen storage tanks | |||
| External material failure of the storage tank | Repeated cyclic stamping of the tank body | Reduction in hydrogen storage efficiency | Regular replacement of the hydrogen storage tanks | ||
| Scratches on the tank surface | Promote the formation of surface cracks on the tank body | Regular replacement of the hydrogen storage tanks | |||
| Hydrogen embrittlement cracking of the tank body | Hydrogen leakage Insufficient hydrogen supply | Regular replacement of the hydrogen storage tanks | |||
| Cracked tank welds | Hydrogen leakage Insufficient hydrogen supply | Regular replacement of the hydrogen storage tanks | |||
| Residual stress exists in the tank | Reduction in hydrogen storage efficiency Promote the formation of surface cracks on the tank body | Regular replacement of the hydrogen storage tanks | |||
| Rubber O-ring malfunction | Deformation of the plastic liner | Hydrogen leakage Insufficient hydrogen supply | Regular replacement of O-rings | ||
| O-ring subjected to repetitive extrusion | Hydrogen leakage Insufficient hydrogen supply | Regular replacement of O-rings | |||
| Lack of accurate pressure feedback | High pressure sensor malfunction | Unstable combustion in hydrogen internal combustion engines | Regular replacement of the high-pressure sensor | ||
| Node Symbol | Static Node Name | State |
|---|---|---|
| S1 | Hydrogen supply pressure | 0: Too low 1: Normal |
| S2 | Hydrogen supply flow rate | 0: Too high 1: Normal 2: Too low |
| S3 | Hydrogen temperature in tank | 0: Too high 1: Normal |
| S4 | Hydrogen pressure in tank | 0: Too low 1: Normal |
| Root Dynamic Nodes | Intermediate Dynamic Nodes | ||||
|---|---|---|---|---|---|
| Node Symbol | Node Name | State | Node Symbol | Node Name | State |
| D1 | Rupture at the connection between the pipeline and valve | 0: True 1: False | D1-1 | Pipeline hydrogen embrittlement leads to cracking | 0: True 1: False |
| D1-2 | Loosening at the connection between the valve and the pipeline | 0: True 1: False | |||
| D2 | Cylinder valve integration opening degree | 0: Too large 1 Normal 2: Too small | D2-1 | Solenoid operated valve opening degree | 0: Too large 1: Normal 2: Too small |
| D2-2 | Manual valve opening degree | 0: Too large 1: Normal 2: Too small | |||
| D2-3 | Clogging of the outlet filter | 0: True 1: False | |||
| D3 | Abnormal ability to restrict excessive hydrogen flow | 0: True 1: False | D3-1 | Excessive flow valve malfunction | 0: True 1: False |
| D4 | Hydrogen emission delay | 0: True 1: False | D4-1 | TPRD fails to fully open | 0: True 1: False |
| D4-2 | Excessive buildup of deposits in the emptying pipeline or hydrogen vent port | 0: True 1: False | |||
| D5 | Lack of accurate temperature feedback | 0: True 1: False | D5-1 | Temperature sensor malfunction | 0: True 1: False |
| D6 | Internal material failure of the storage tank | 0: True 1: False | D6-1 | Blistering and cracking of the inner liner | 0: True 1: False |
| D6-2 | Bulging and collapse of the inner liner | 0: True 1: False | |||
| D6-3 | Fatigue damage to the inner liner | 0: True 1: False | |||
| D7 | External material failure of the storage tank | 0: True 1: False | D7-1 | Repeated cyclic stamping of the tank body | 0: True 1: False |
| D7-2 | Scratches on the tank surface | 0: True 1: False | |||
| D7-3 | Hydrogen embrittlement cracking the tank body | 0: True 1: False | |||
| D7-4 | Cracked tank welds | 0: True 1: False | |||
| D7-5 | Residual stress exists in the tank | 0: True 1: False | |||
| D8 | Rubber O-ring malfunction | 0: True 1: False | D8-1 | Deformation of the plastic liner | 0: True 1: False |
| D8-2 | O-ring subjected to repetitive extrusion | 0: True 1: False | |||
| D9 | Lack of accurate pressure feedback | 0: True 1: False | D9-1 | High pressure sensor malfunction | 0: True 1: False |
| Node Symbol | Node Name | State |
|---|---|---|
| C1 | Hydrogen leakage | 0: True 1: False |
| C2 | Insufficient hydrogen supply | 0: True 1: False |
| C3 | Unstable combustion in hydrogen internal combustion engines | 0: True |
| C4 | Pre-ignition | 1: False |
| C5 | Backfire | 0: True 1: False |
| C6 | Increased burden on the thermal management system | 0: True 1: False |
| C7 | Reduction in hydrogen storage efficiency | 0: True 1: False |
| C8 | Promote the formation of surface cracks on the tank body | 0: True 1: False |
| Expert | Professional Title | Research Duration (Years) | Age (Years Old) | Weight Score | Weight Value |
|---|---|---|---|---|---|
| 1 | Technical consultant | 15–19 | ≥50 | 24 | 0.218 |
| 2 | Technical director | ≥20 | 40–49 | 26 | 0.236 |
| 3 | Technical consultant | 10–14 | 30–39 | 18 | 0.164 |
| 4 | Engineer | 10–14 | 30–39 | 16 | 0.145 |
| 5 | Technical consultant | ≥20 | ≥50 | 26 | 0.236 |
| Aggregate | - | - | - | 110 | 1 |
| Node Symbol | State | Expert 1 | Expert 2 | Expert 3 | Expert 4 | Expert 5 | FPS | Prior Probability (FPR) | Posterior Probability | RoV |
|---|---|---|---|---|---|---|---|---|---|---|
| D1-1 | 0 | VL | VL | L | VL | VL | 0.100454 | 1.67 × 10⁻⁵ | 7.47 × 10⁻⁵ | 3.480962 |
| D1-2 | 0 | L | ML | ML | ML | L | 0.285764 | 7.54 × 10⁻⁴ | 3.37 × 10⁻³ | 3.476295 |
| D2-1 | 0 | L | L | ML | L | L | 0.227114 | 3.46 × 10⁻⁴ | - | - |
| D2-1 | 2 | ML | L | L | L | L | 0.231270 | 3.68 × 10⁻⁴ | 3.44 × 10⁻¹ | 933.8836 |
| D2-2 | 0 | L | ML | L | ML | L | 0.258650 | 5.39 × 10⁻⁴ | - | - |
| D2-2 | 2 | L | ML | ML | L | L | 0.259672 | 5.46 × 10⁻⁴ | 5.11 × 10⁻¹ | 934.0998 |
| D2-3 | 0 | VL | L | L | L | L | 0.175351 | 1.40 × 10⁻⁴ | 1.31 × 10⁻¹ | 934.3830 |
| D3-1 | 0 | ML | L | VL | L | L | 0.209731 | 2.63 × 10⁻⁴ | 4.51 × 10⁻⁴ | 0.718002 |
| D4-1 | 0 | L | VL | ML | L | ML | 0.234015 | 3.83 × 10⁻⁴ | 4.05 × 10⁻⁴ | 0.057215 |
| D4-2 | 0 | VL | L | L | VL | VL | 0.127423 | 4.27 × 10⁻⁵ | 4.51 × 10⁻⁵ | 0.057216 |
| D5-1 | 0 | L | VL | L | VL | L | 0.153317 | 8.57 × 10⁻⁵ | 8.57 × 10⁻⁵ | 0.000584 |
| D6-1 | 0 | VL | L | VL | VL | L | 0.132234 | 4.92 × 10⁻⁵ | 4.93 × 10⁻⁵ | 0.000836 |
| D6-2 | 0 | VL | L | L | VL | VL | 0.127423 | 4.27 × 10⁻⁵ | 4.27 × 10⁻⁵ | 0.000835 |
| D6-3 | 0 | L | VL | L | L | L | 0.174322 | 1.37 × 10⁻⁴ | 1.37 × 10⁻⁴ | 0.000832 |
| D7-1 | 0 | M | L | MH | ML | L | 0.369974 | 1.79 × 10⁻³ | 1.79 × 10⁻³ | 0.000017 |
| D7-2 | 0 | MH | ML | M | M | ML | 0.465746 | 3.90 × 10⁻³ | 3.90 × 10⁻³ | 0.000005 |
| D7-3 | 0 | VL | L | VL | L | VL | 0.126581 | 4.16 × 10⁻⁵ | 4.17 × 10⁻⁵ | 0.001692 |
| D7-4 | 0 | L | ML | VL | ML | L | 0.236981 | 4.00 × 10⁻⁴ | 4.01 × 10⁻⁴ | 0.001697 |
| D7-5 | 0 | ML | L | ML | VL | L | 0.237538 | 4.03 × 10⁻⁴ | 4.03 × 10⁻⁴ | 0.000001 |
| D8-1 | 0 | L | ML | L | L | L | 0.232559 | 3.75 × 10⁻⁴ | 4.65× 10⁻⁴ | 0.239061 |
| D8-2 | 0 | L | ML | L | ML | L | 0.258650 | 5.39 × 10⁻⁴ | 6.68 × 10⁻⁴ | 0.239336 |
| D9-1 | 0 | VL | L | L | VL | L | 0.154362 | 8.78 × 10⁻⁵ | 8.92 × 10⁻⁵ | 0.015756 |
| Time (t) | Time (t − 1) | |||
|---|---|---|---|---|
| State 0 | State 1 | |||
| Expert Evaluation | Probability | Expert Evaluation | Probability | |
| 0 | - | 0.999994 | L, ML, ML, L, M | 1.17 × 10⁻³ |
| 1 | VL, VL, VL, VL, VL | 5.66 × 10⁻⁶ | - | 0.998833 |
| D1-1 | D1-2 | D1 | |||
|---|---|---|---|---|---|
| Expert Evaluation | State 0 | Expert Evaluation | State 1 | ||
| 0 | 0 | - | 0.999994 | VL, VL, VL, VL, VL | 5.66 × 10⁻⁶ |
| 1 | - | 0.999994 | VL, VL, VL, VL, VL | 5.66 × 10⁻⁶ | |
| 1 | 0 | - | 0.998993 | ML, L, M, ML, L | 1.01 × 10⁻³ |
| 1 | VL, VL, VL, VL, VL | 5.66 × 10⁻⁶ | - | 0.999994 | |
Disclaimer/Publisher’s Note: The statements, opinions and data contained in all publications are solely those of the individual author(s) and contributor(s) and not of MDPI and/or the editor(s). MDPI and/or the editor(s) disclaim responsibility for any injury to people or property resulting from any ideas, methods, instructions or products referred to in the content. |
© 2025 by the authors. Licensee MDPI, Basel, Switzerland. This article is an open access article distributed under the terms and conditions of the Creative Commons Attribution (CC BY) license (https://creativecommons.org/licenses/by/4.0/).
Share and Cite
Dang, X.; Shao, Y.; Liu, H.; Yang, Z.; Zhong, M.; Zhao, H.; Deng, W. Risk Assessment of Hydrogen-Powered Aircraft: An Integrated HAZOP and Fuzzy Dynamic Bayesian Network Framework. Sensors 2025, 25, 3075. https://doi.org/10.3390/s25103075
Dang X, Shao Y, Liu H, Yang Z, Zhong M, Zhao H, Deng W. Risk Assessment of Hydrogen-Powered Aircraft: An Integrated HAZOP and Fuzzy Dynamic Bayesian Network Framework. Sensors. 2025; 25(10):3075. https://doi.org/10.3390/s25103075
Chicago/Turabian StyleDang, Xiangjun, Yongxuan Shao, Haoming Liu, Zhe Yang, Mingwen Zhong, Huimin Zhao, and Wu Deng. 2025. "Risk Assessment of Hydrogen-Powered Aircraft: An Integrated HAZOP and Fuzzy Dynamic Bayesian Network Framework" Sensors 25, no. 10: 3075. https://doi.org/10.3390/s25103075
APA StyleDang, X., Shao, Y., Liu, H., Yang, Z., Zhong, M., Zhao, H., & Deng, W. (2025). Risk Assessment of Hydrogen-Powered Aircraft: An Integrated HAZOP and Fuzzy Dynamic Bayesian Network Framework. Sensors, 25(10), 3075. https://doi.org/10.3390/s25103075