
Fault Diagnosis of Lithium Battery Modules via Symmetrized Dot Pattern and Convolutional Neural Networks


Abstract
1. Introduction
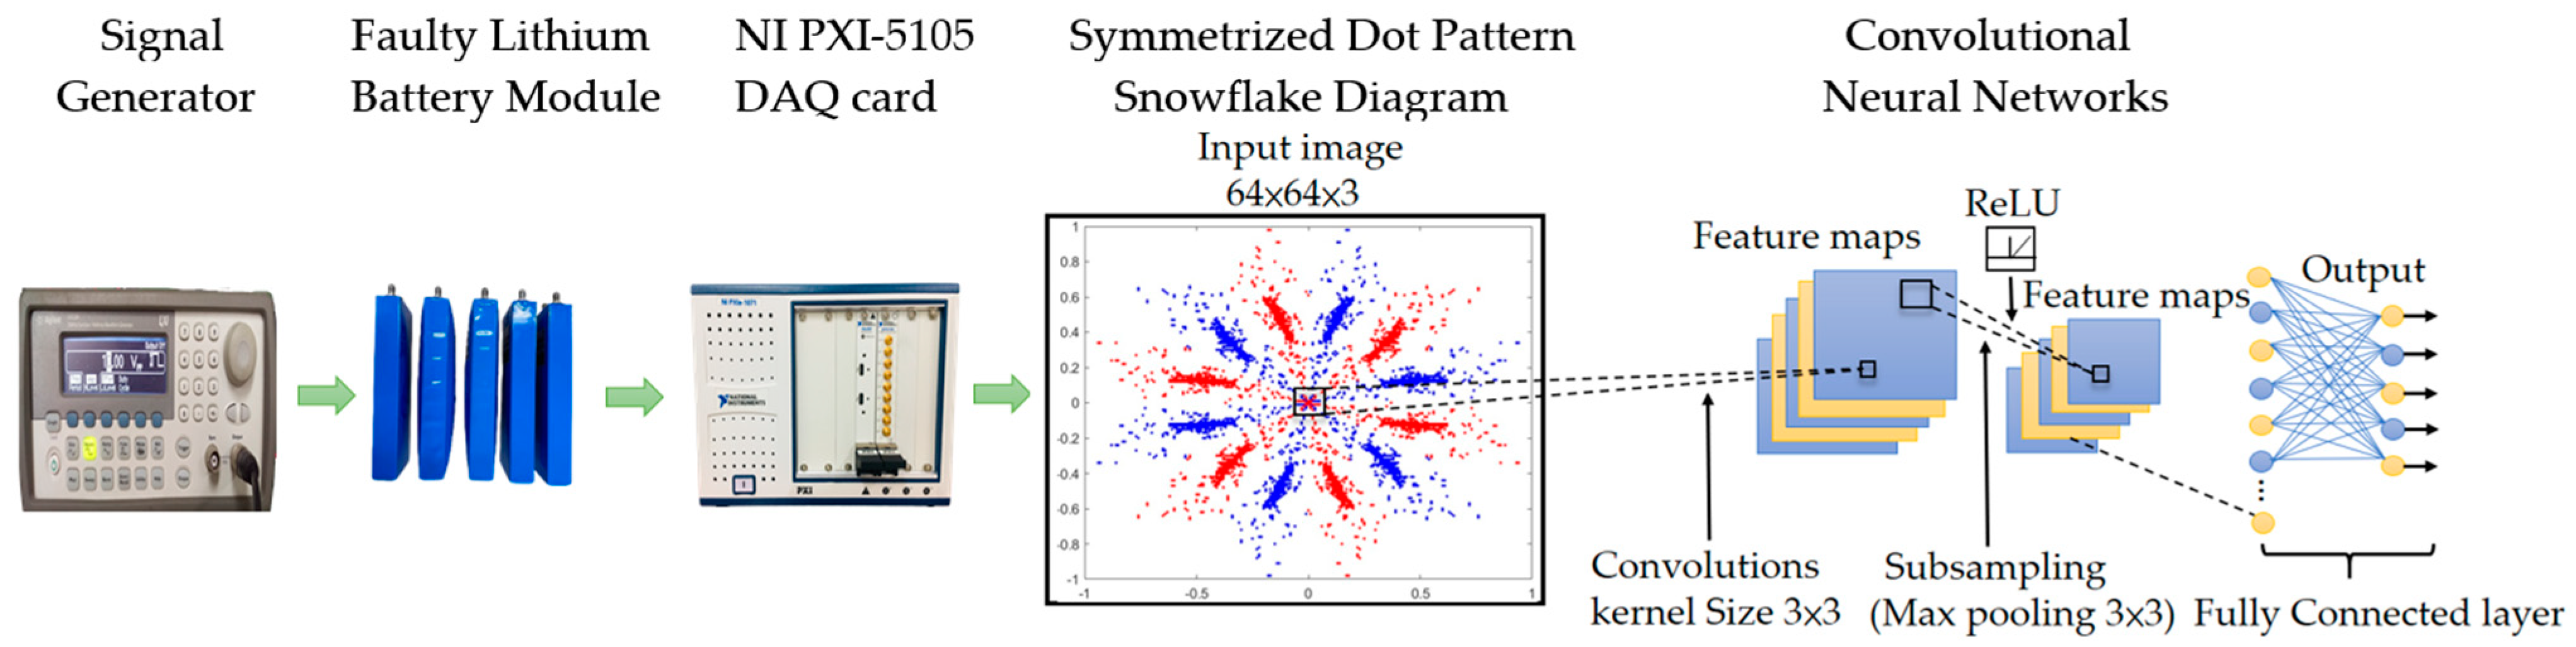
2. Methodology
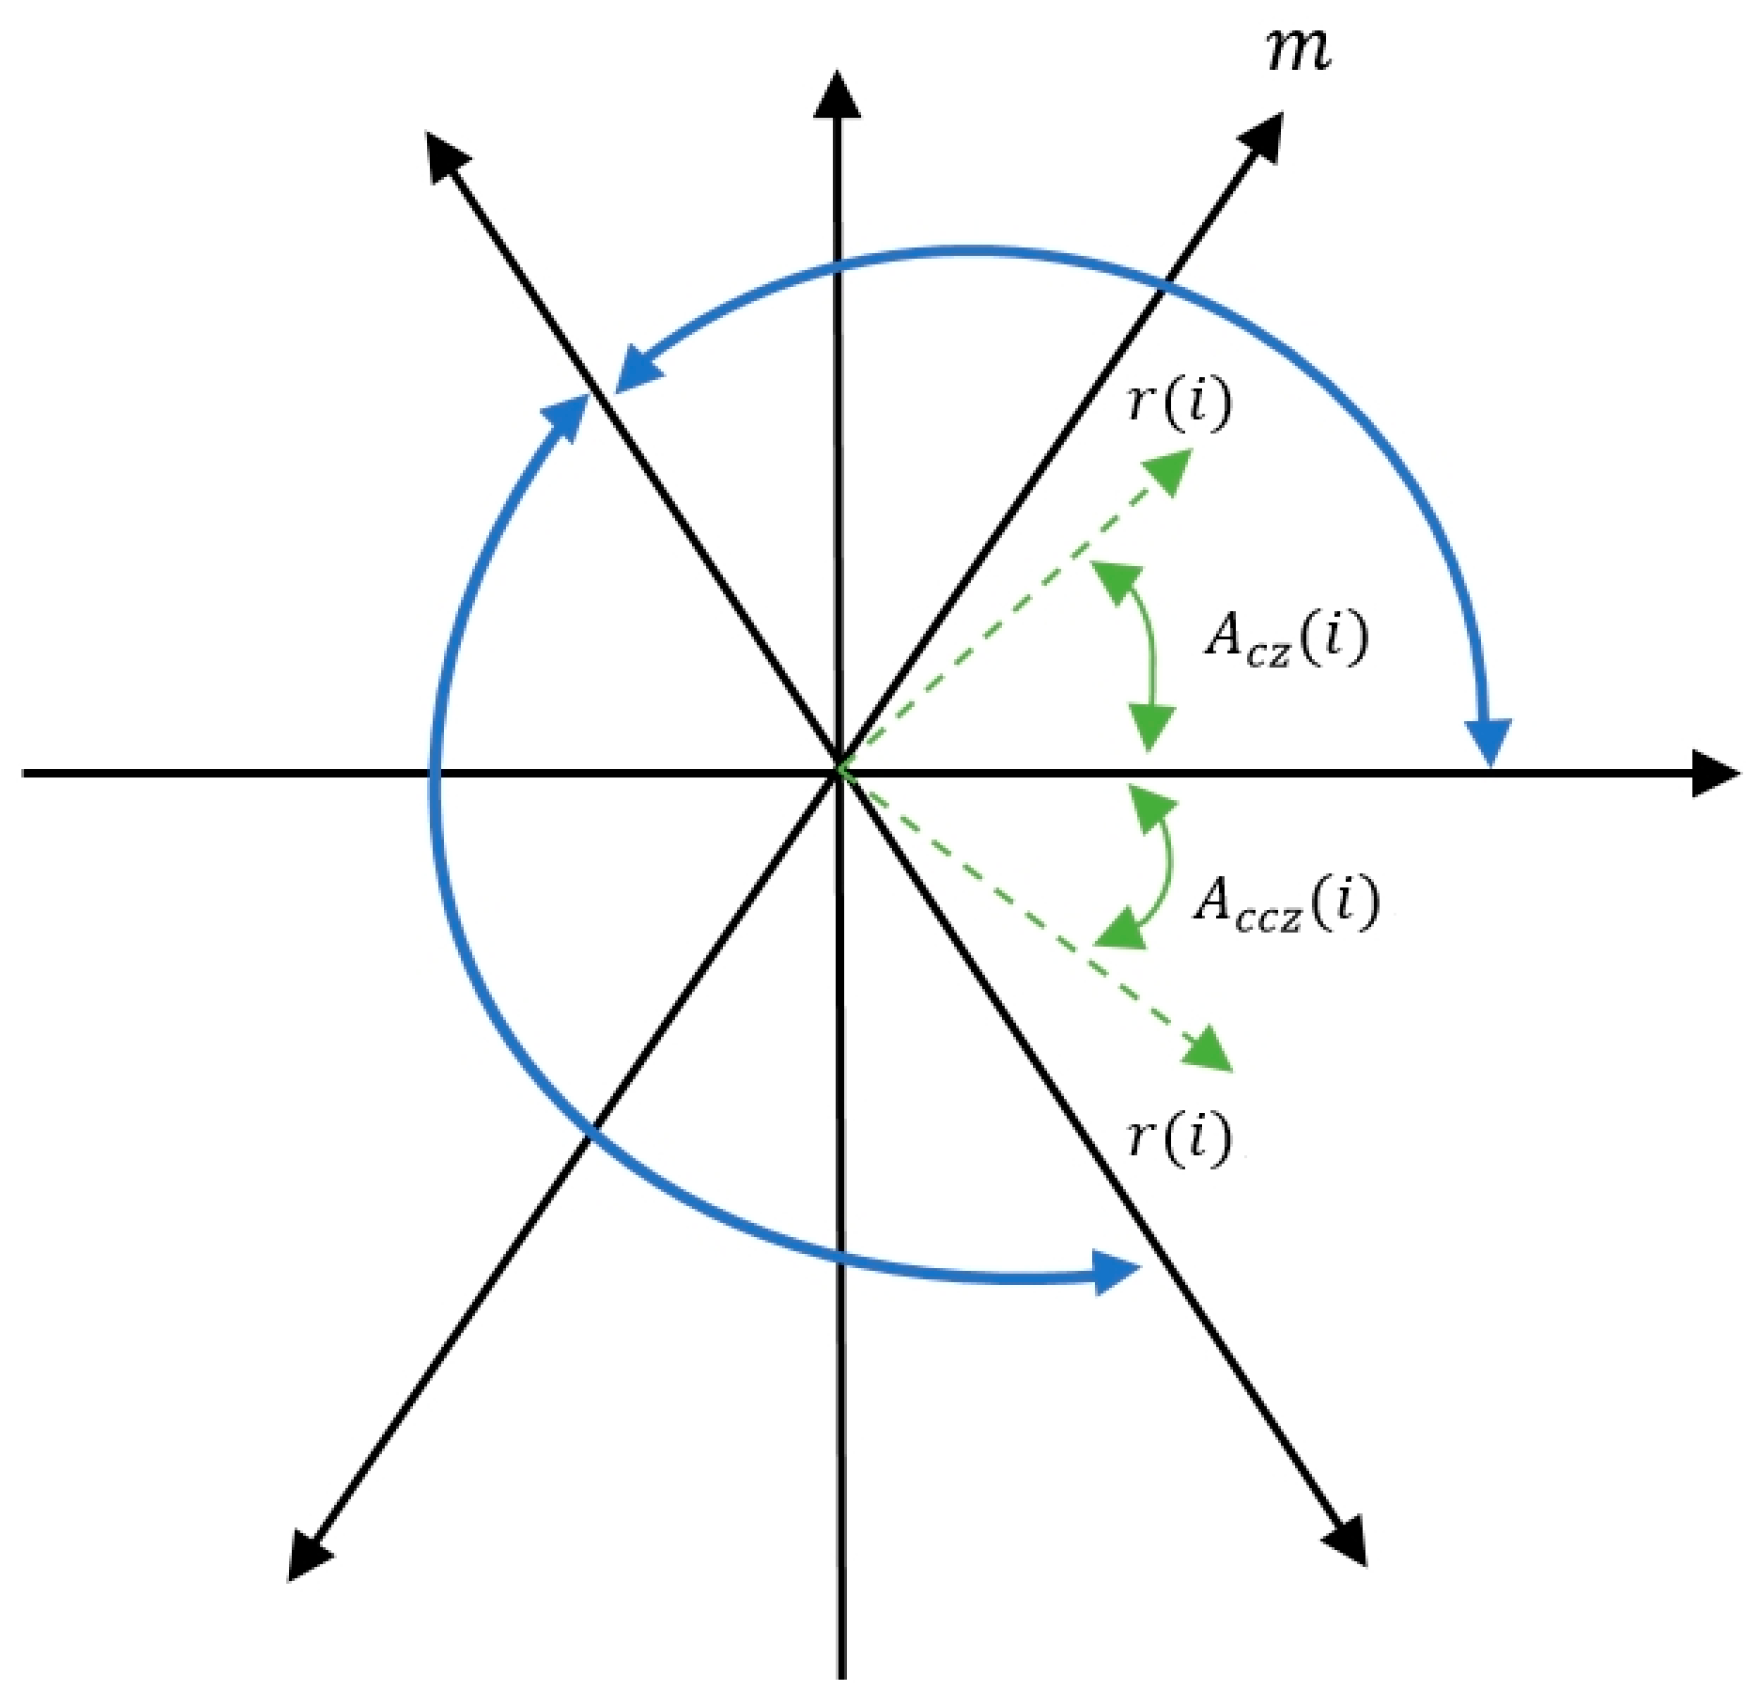
2.1. Symmetric Data Point Coordinate Method
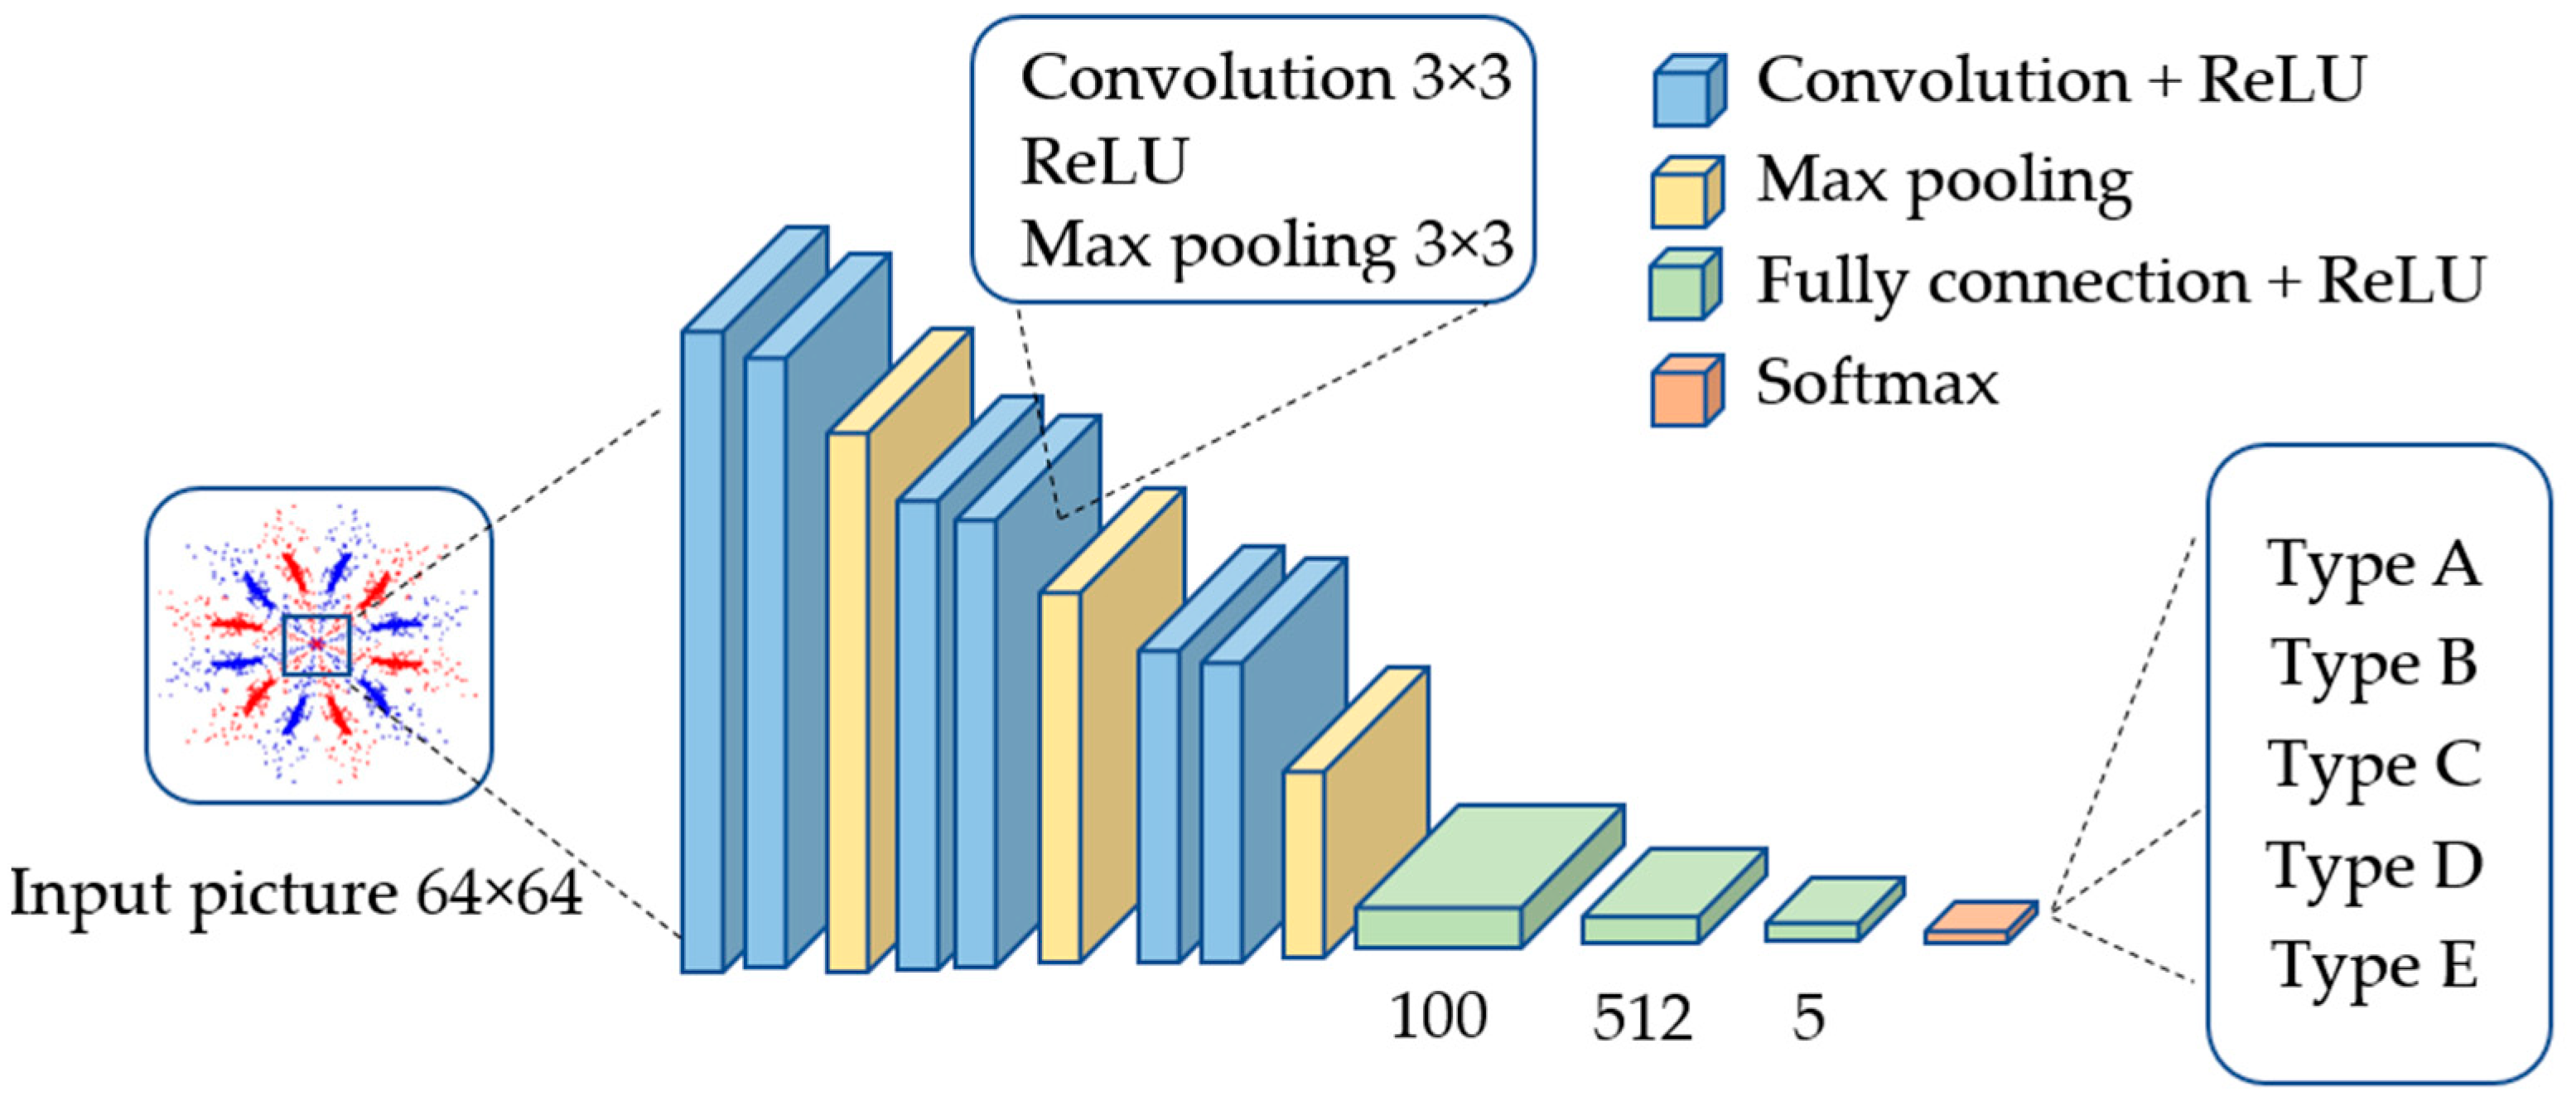
2.2. Convolutional Neural Network
2.2.1. Convolutional Kernel and Convolution Layer
2.2.2. Pooling Layer
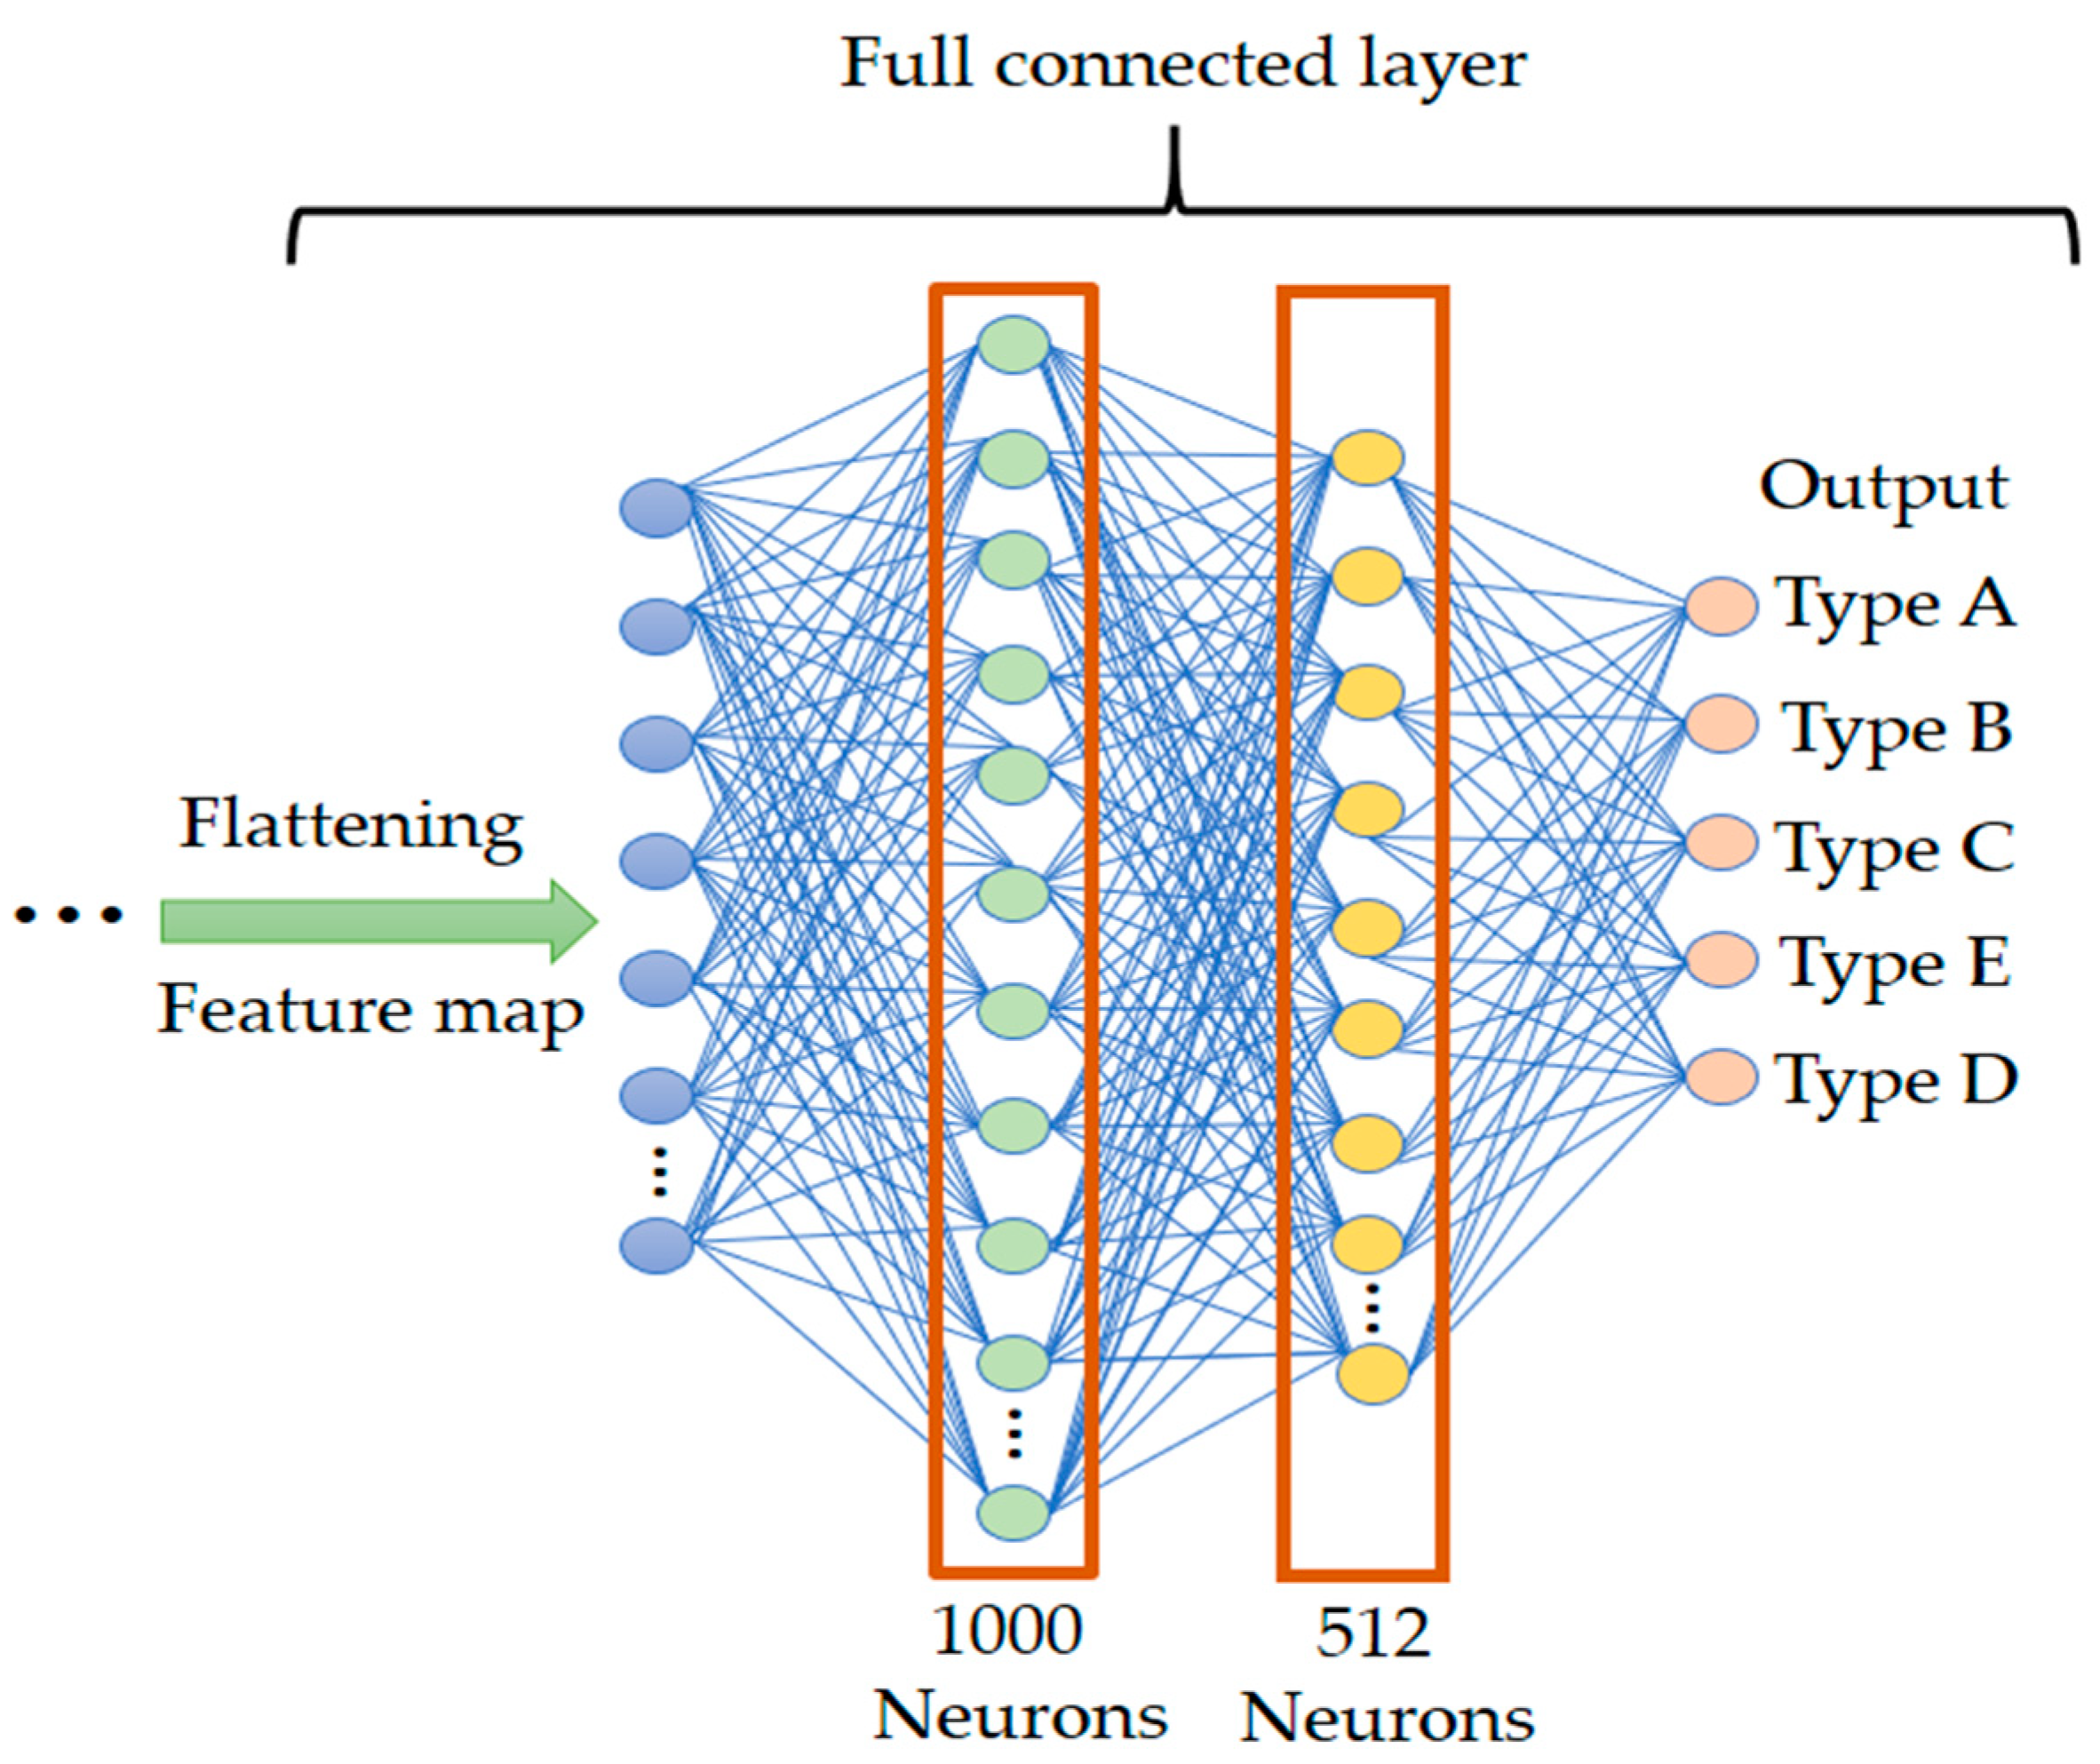
2.2.3. Fully Connected Layer
3. Research System Architecture and Fault Design
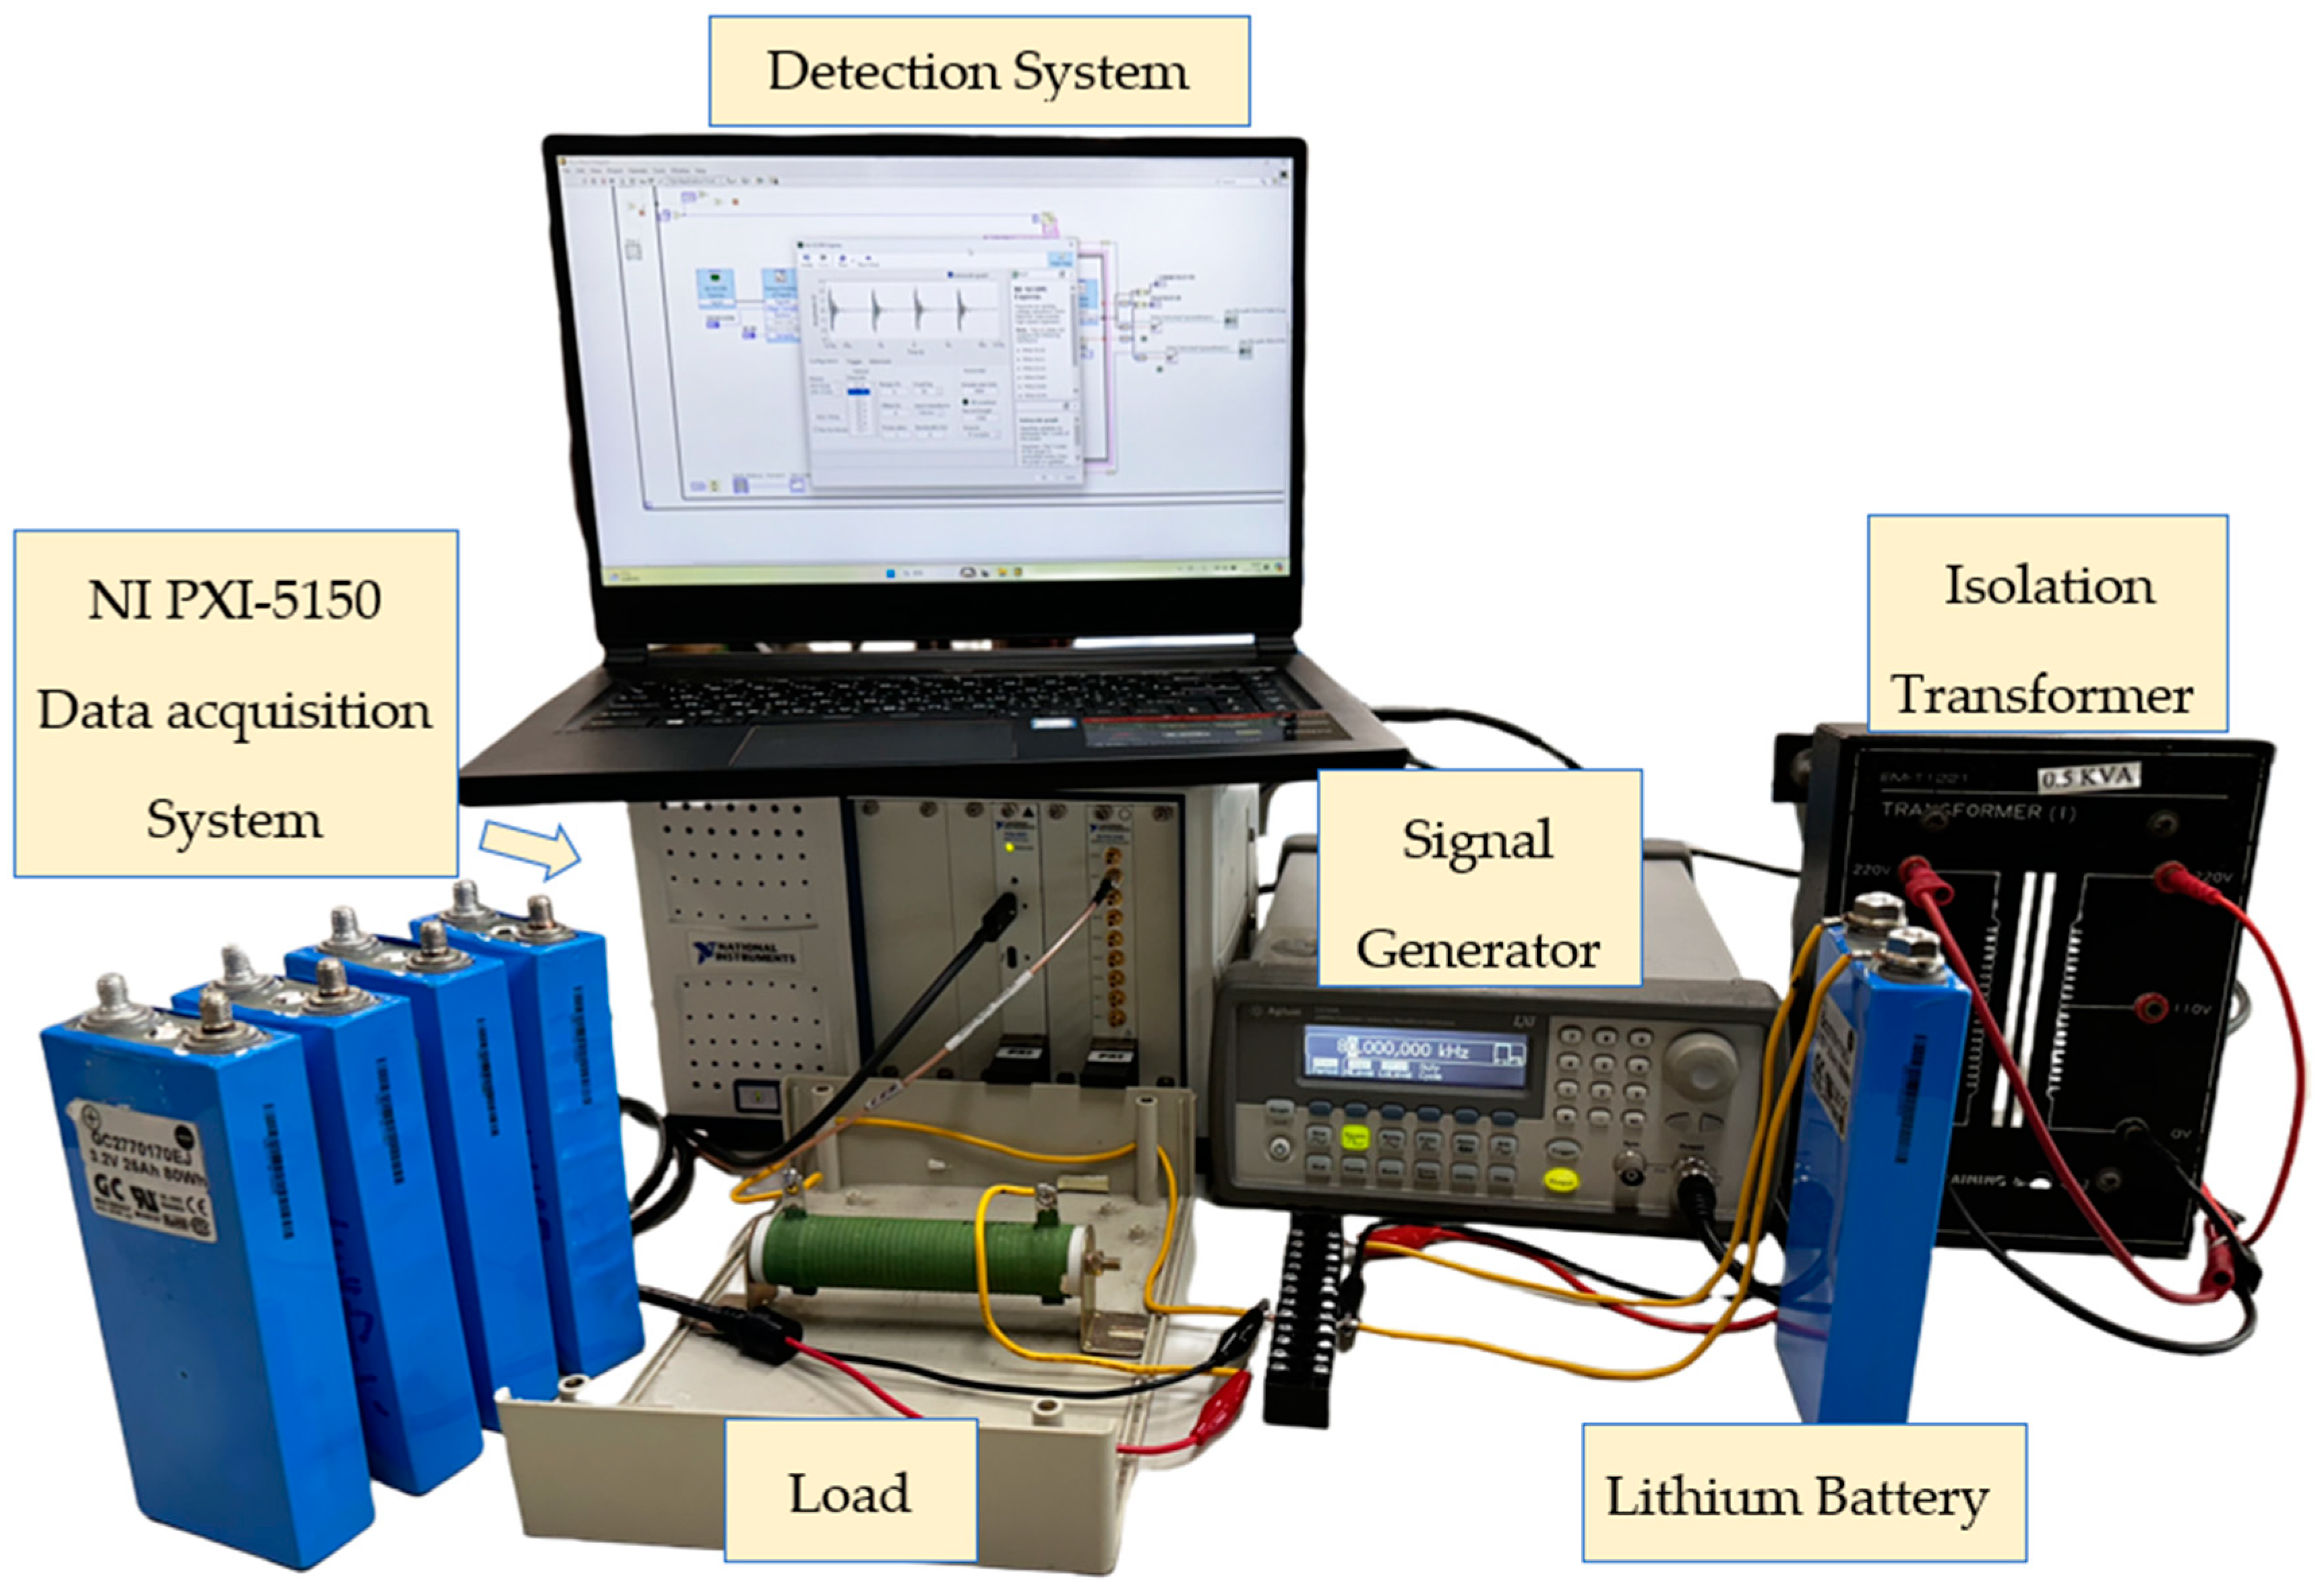
3.1. Experimental System Process Architecture
3.2. Design of Experimental Fault Models for Lithium
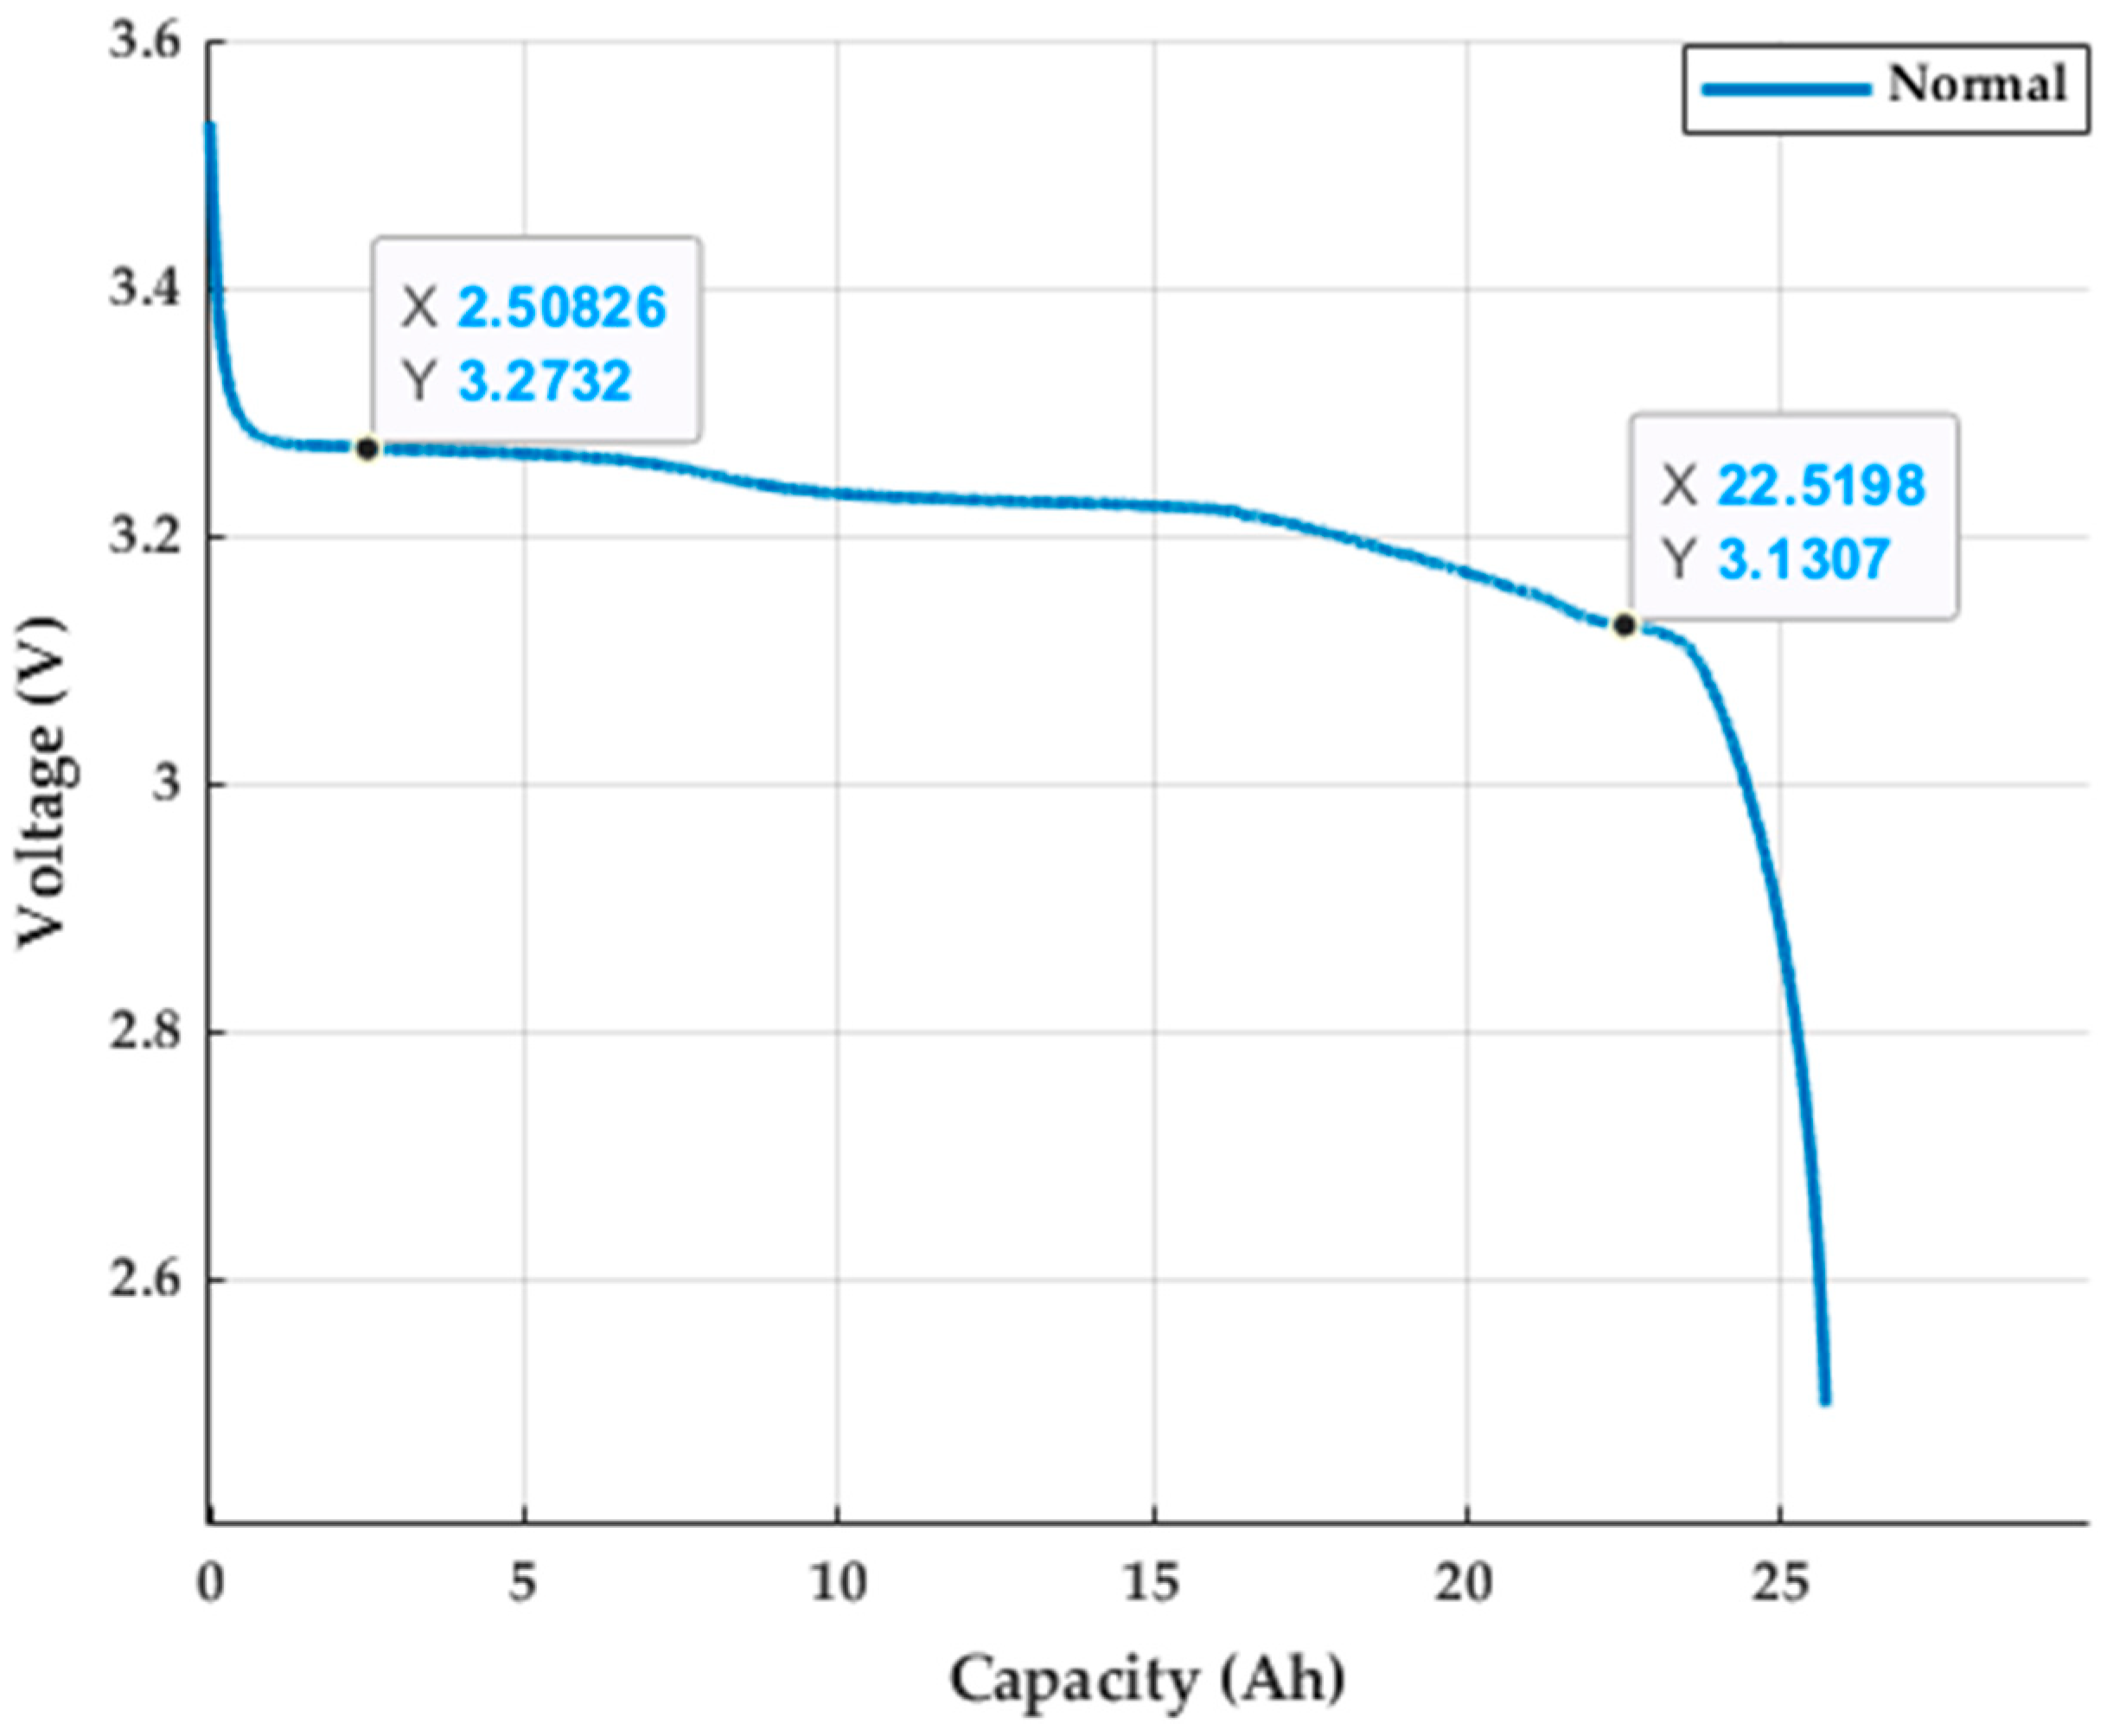
3.2.1. Normal (Type 1)
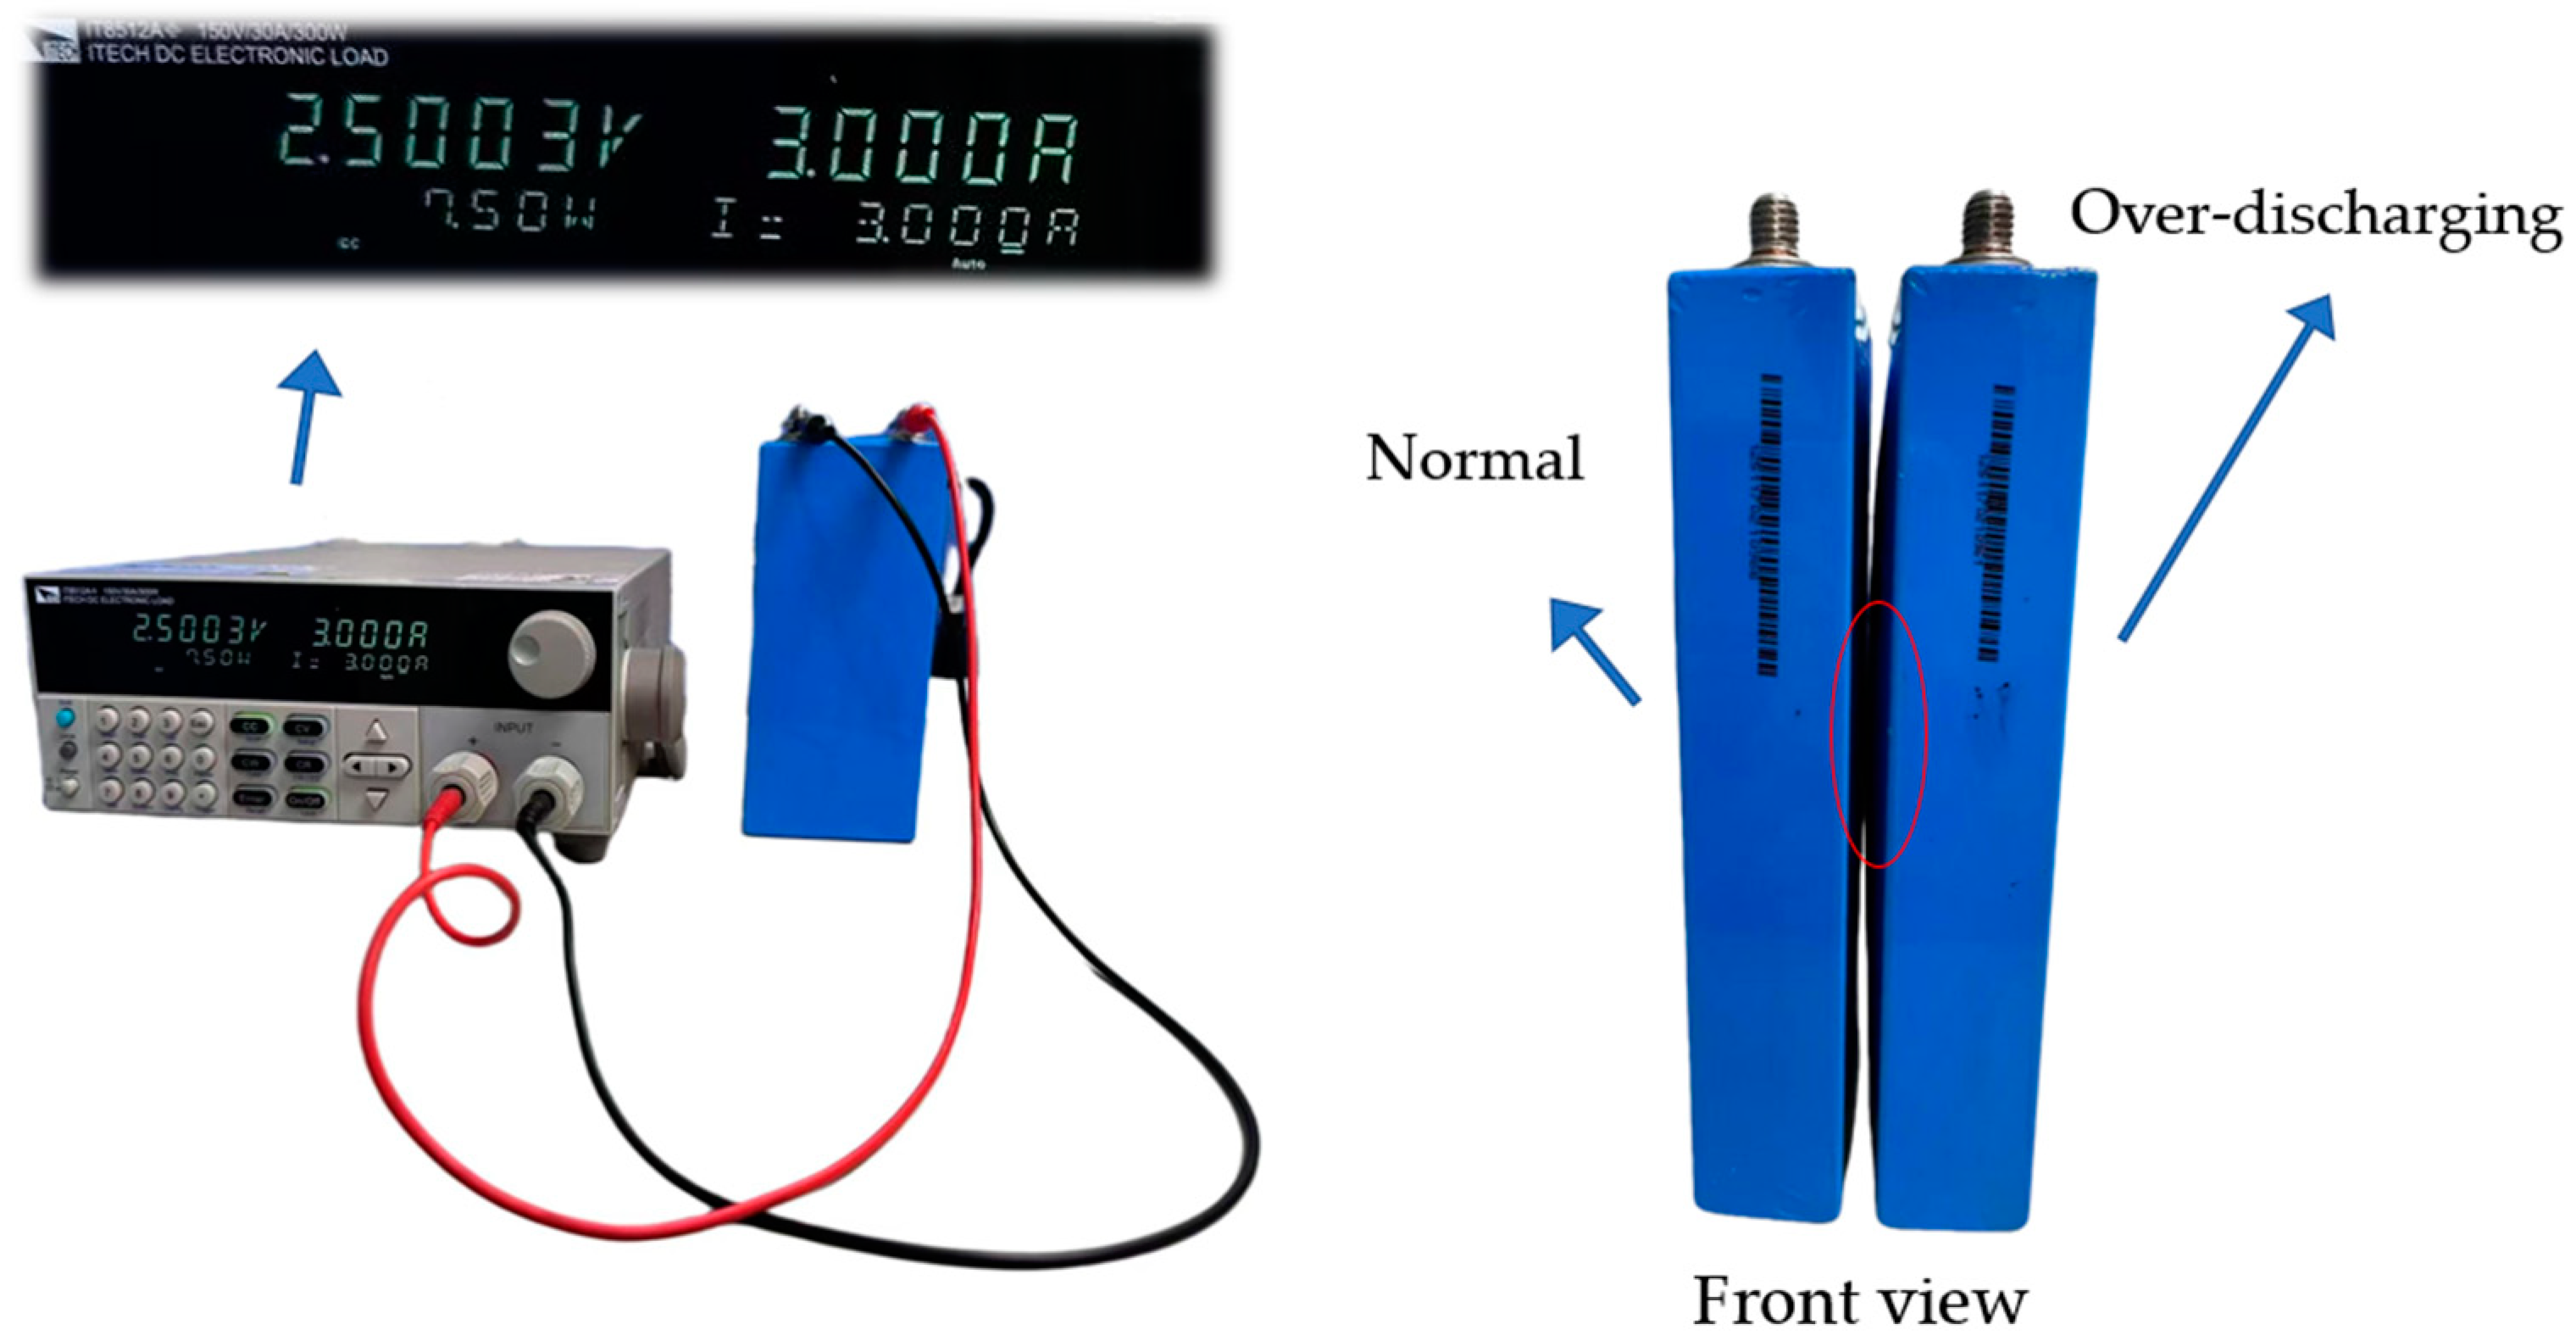
3.2.2. Over-Discharging (Type 2)
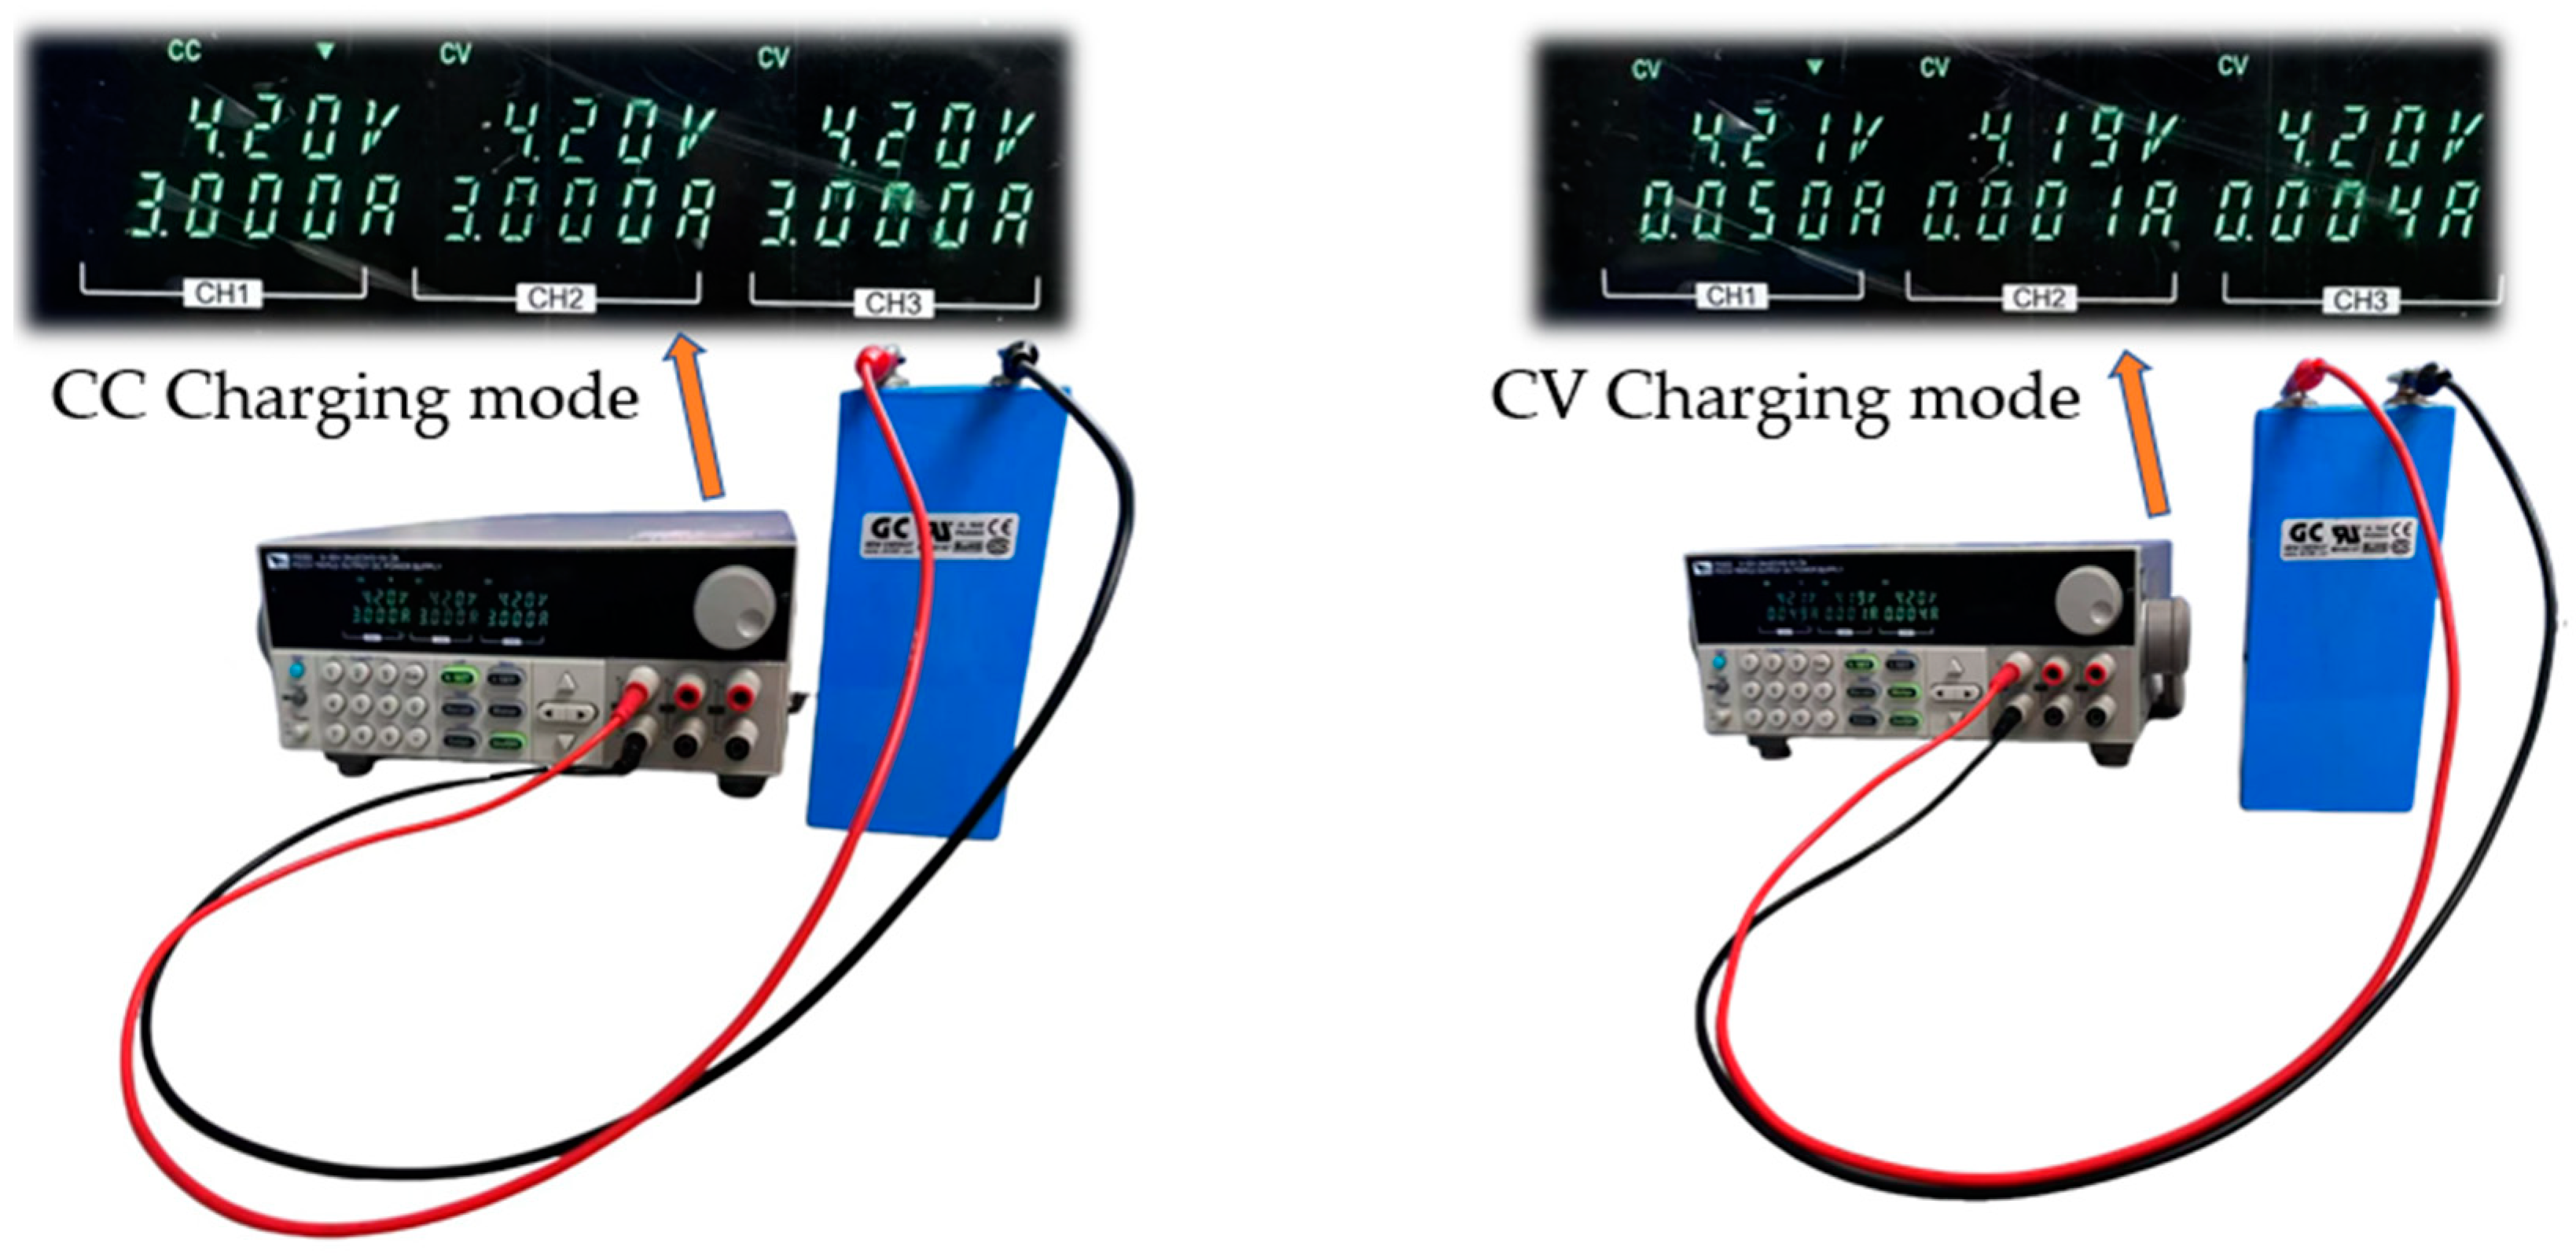
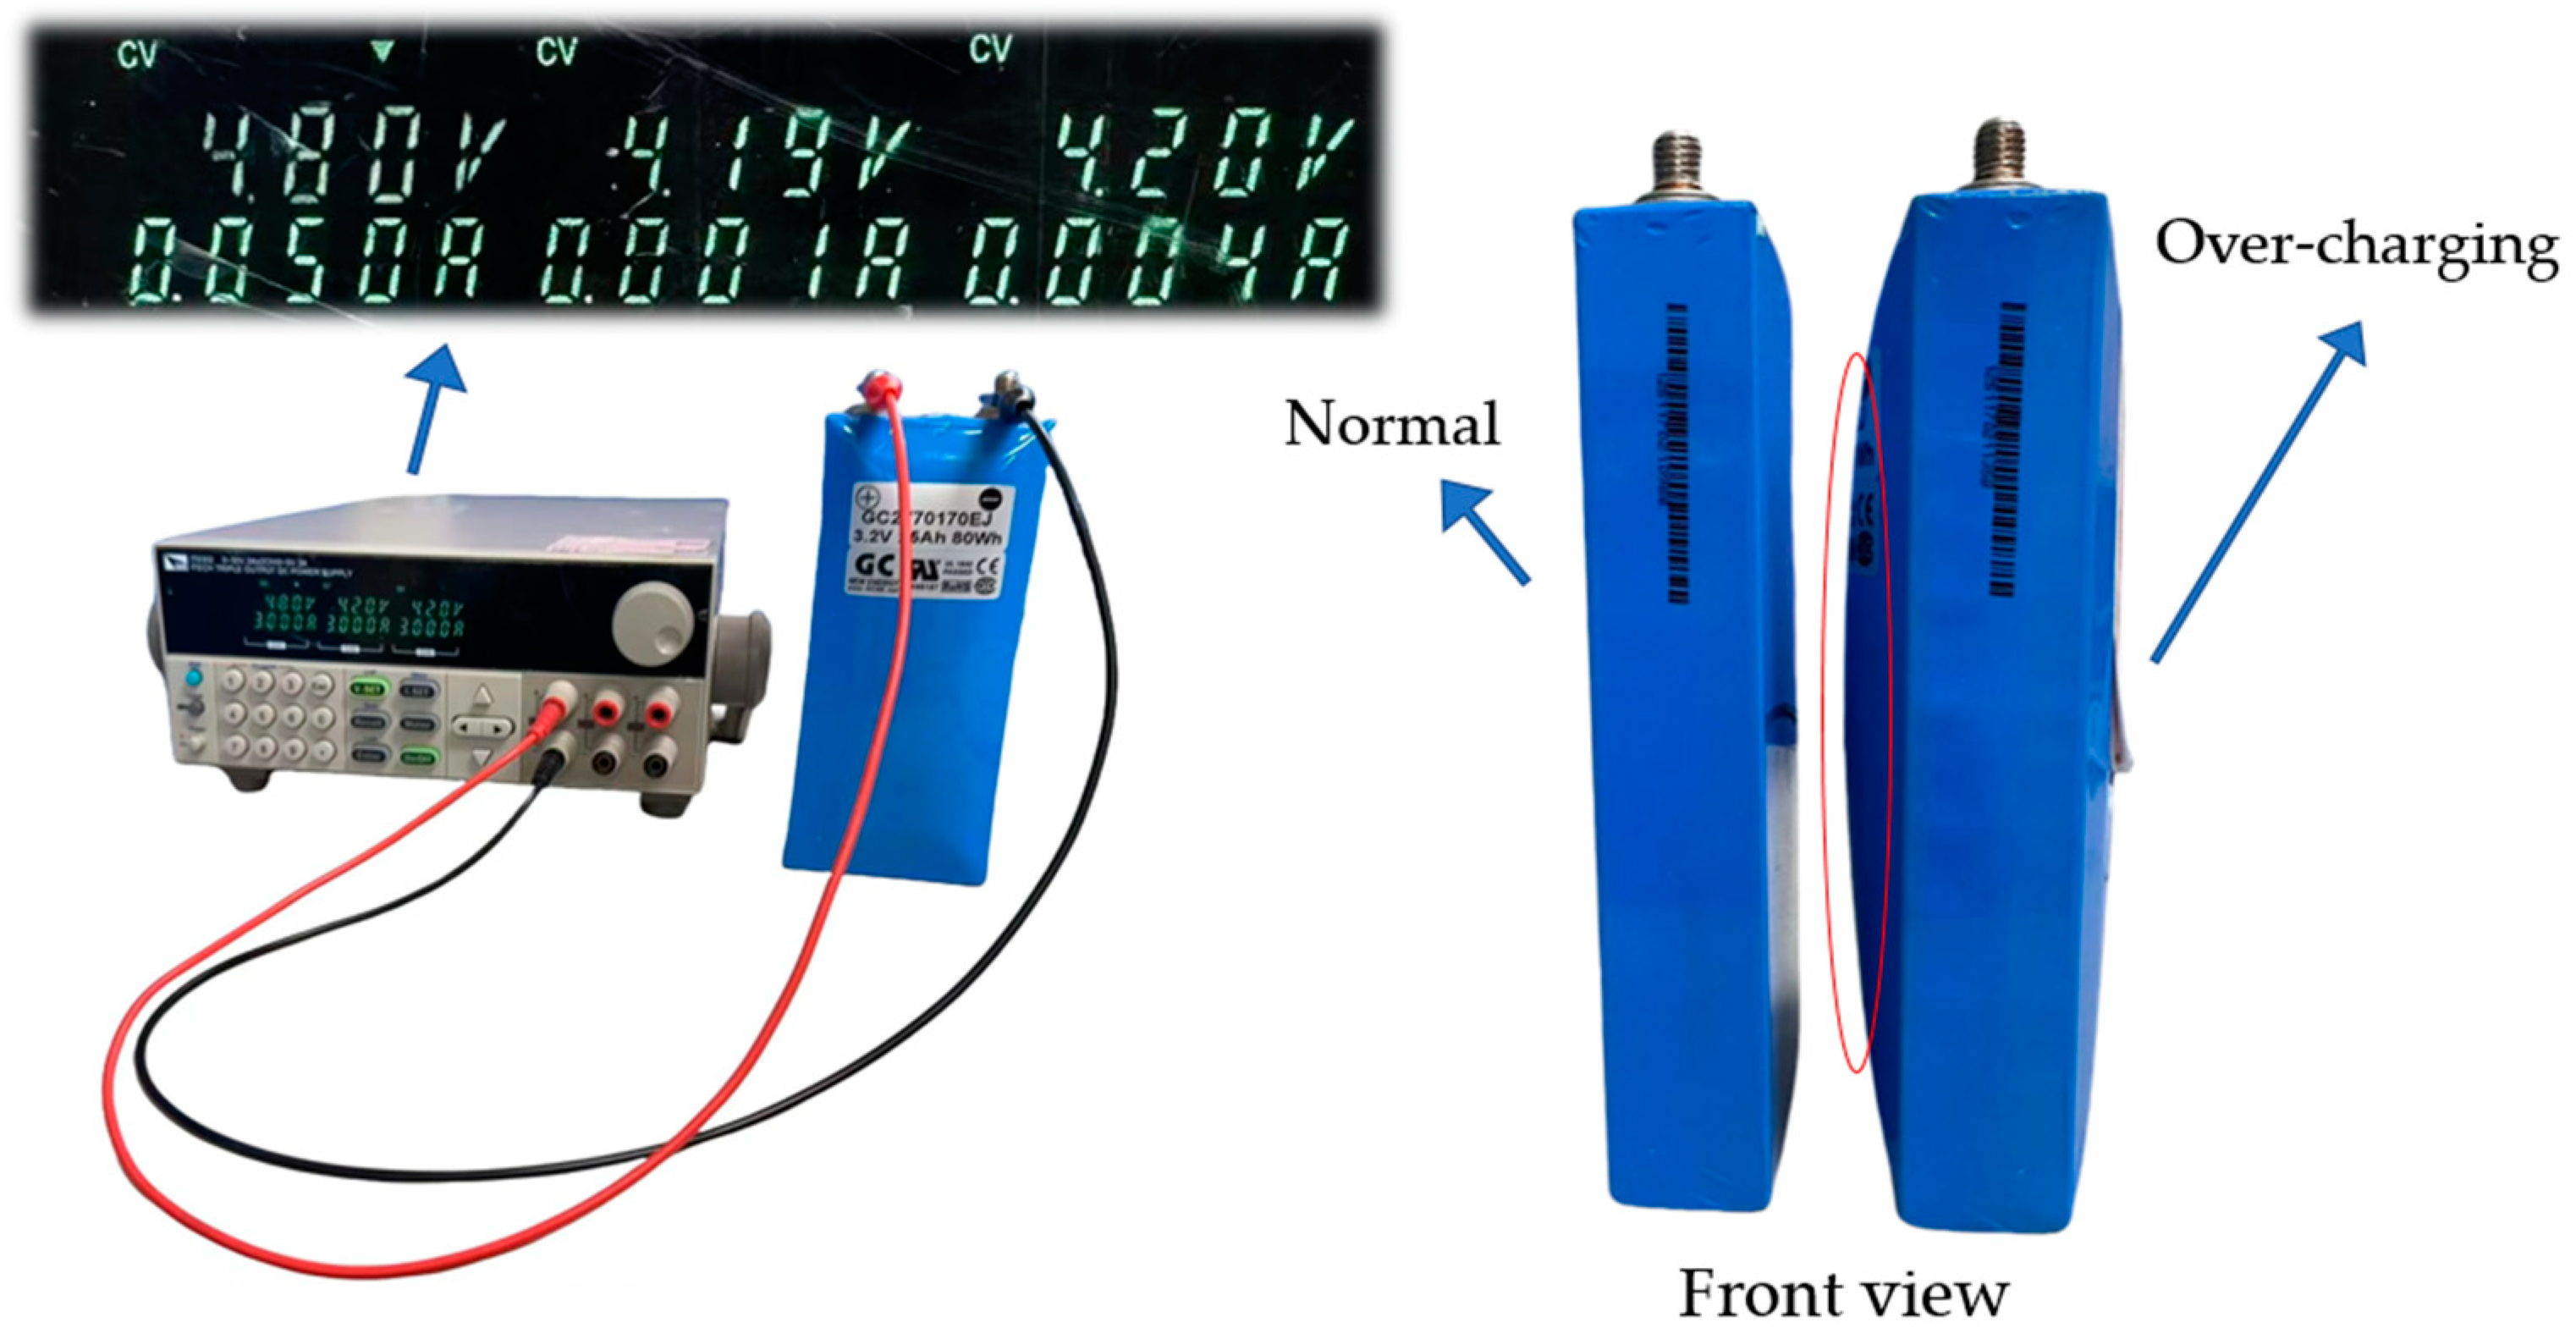
3.2.3. Overcharging (Type 3)
3.2.4. Leakage (Type 4)
3.2.5. Aging (Type 5)
3.3. Fault Model Capacity Experiment
4. Experimental Results
4.1. Original Waveform Measurement
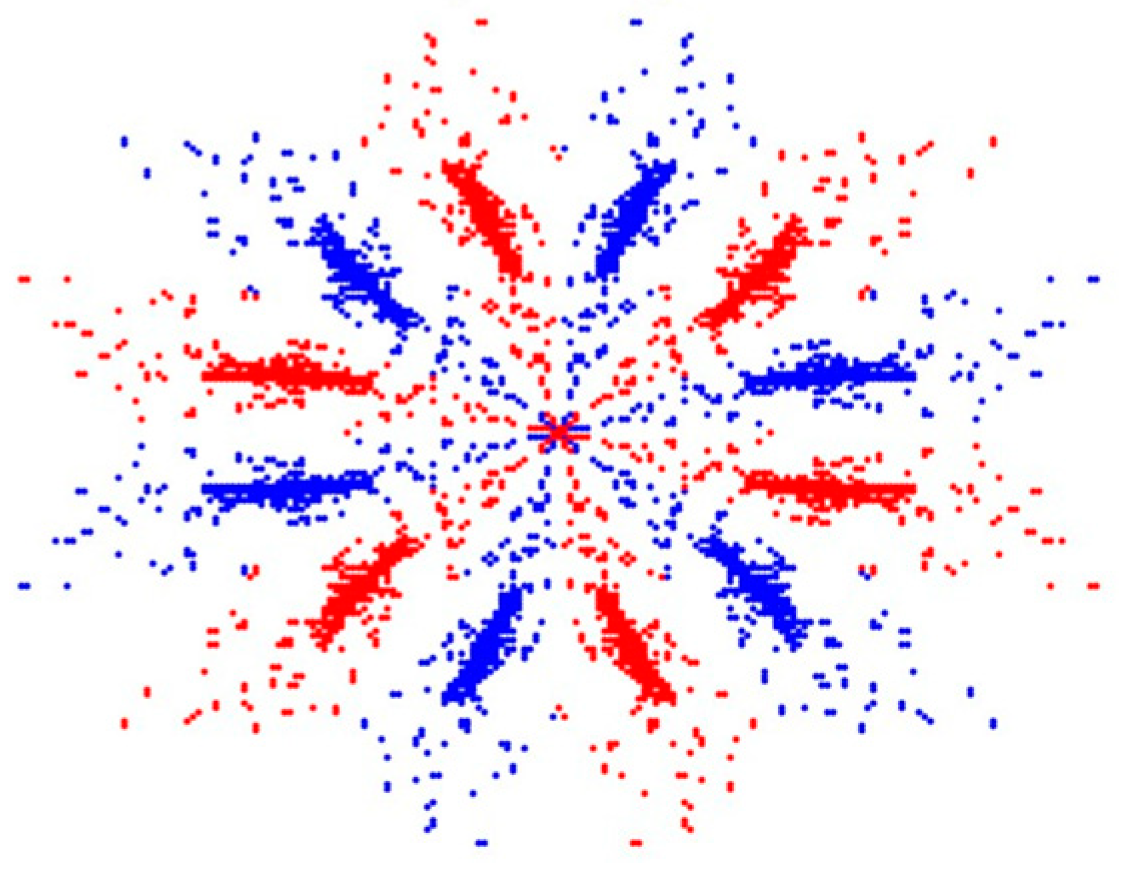
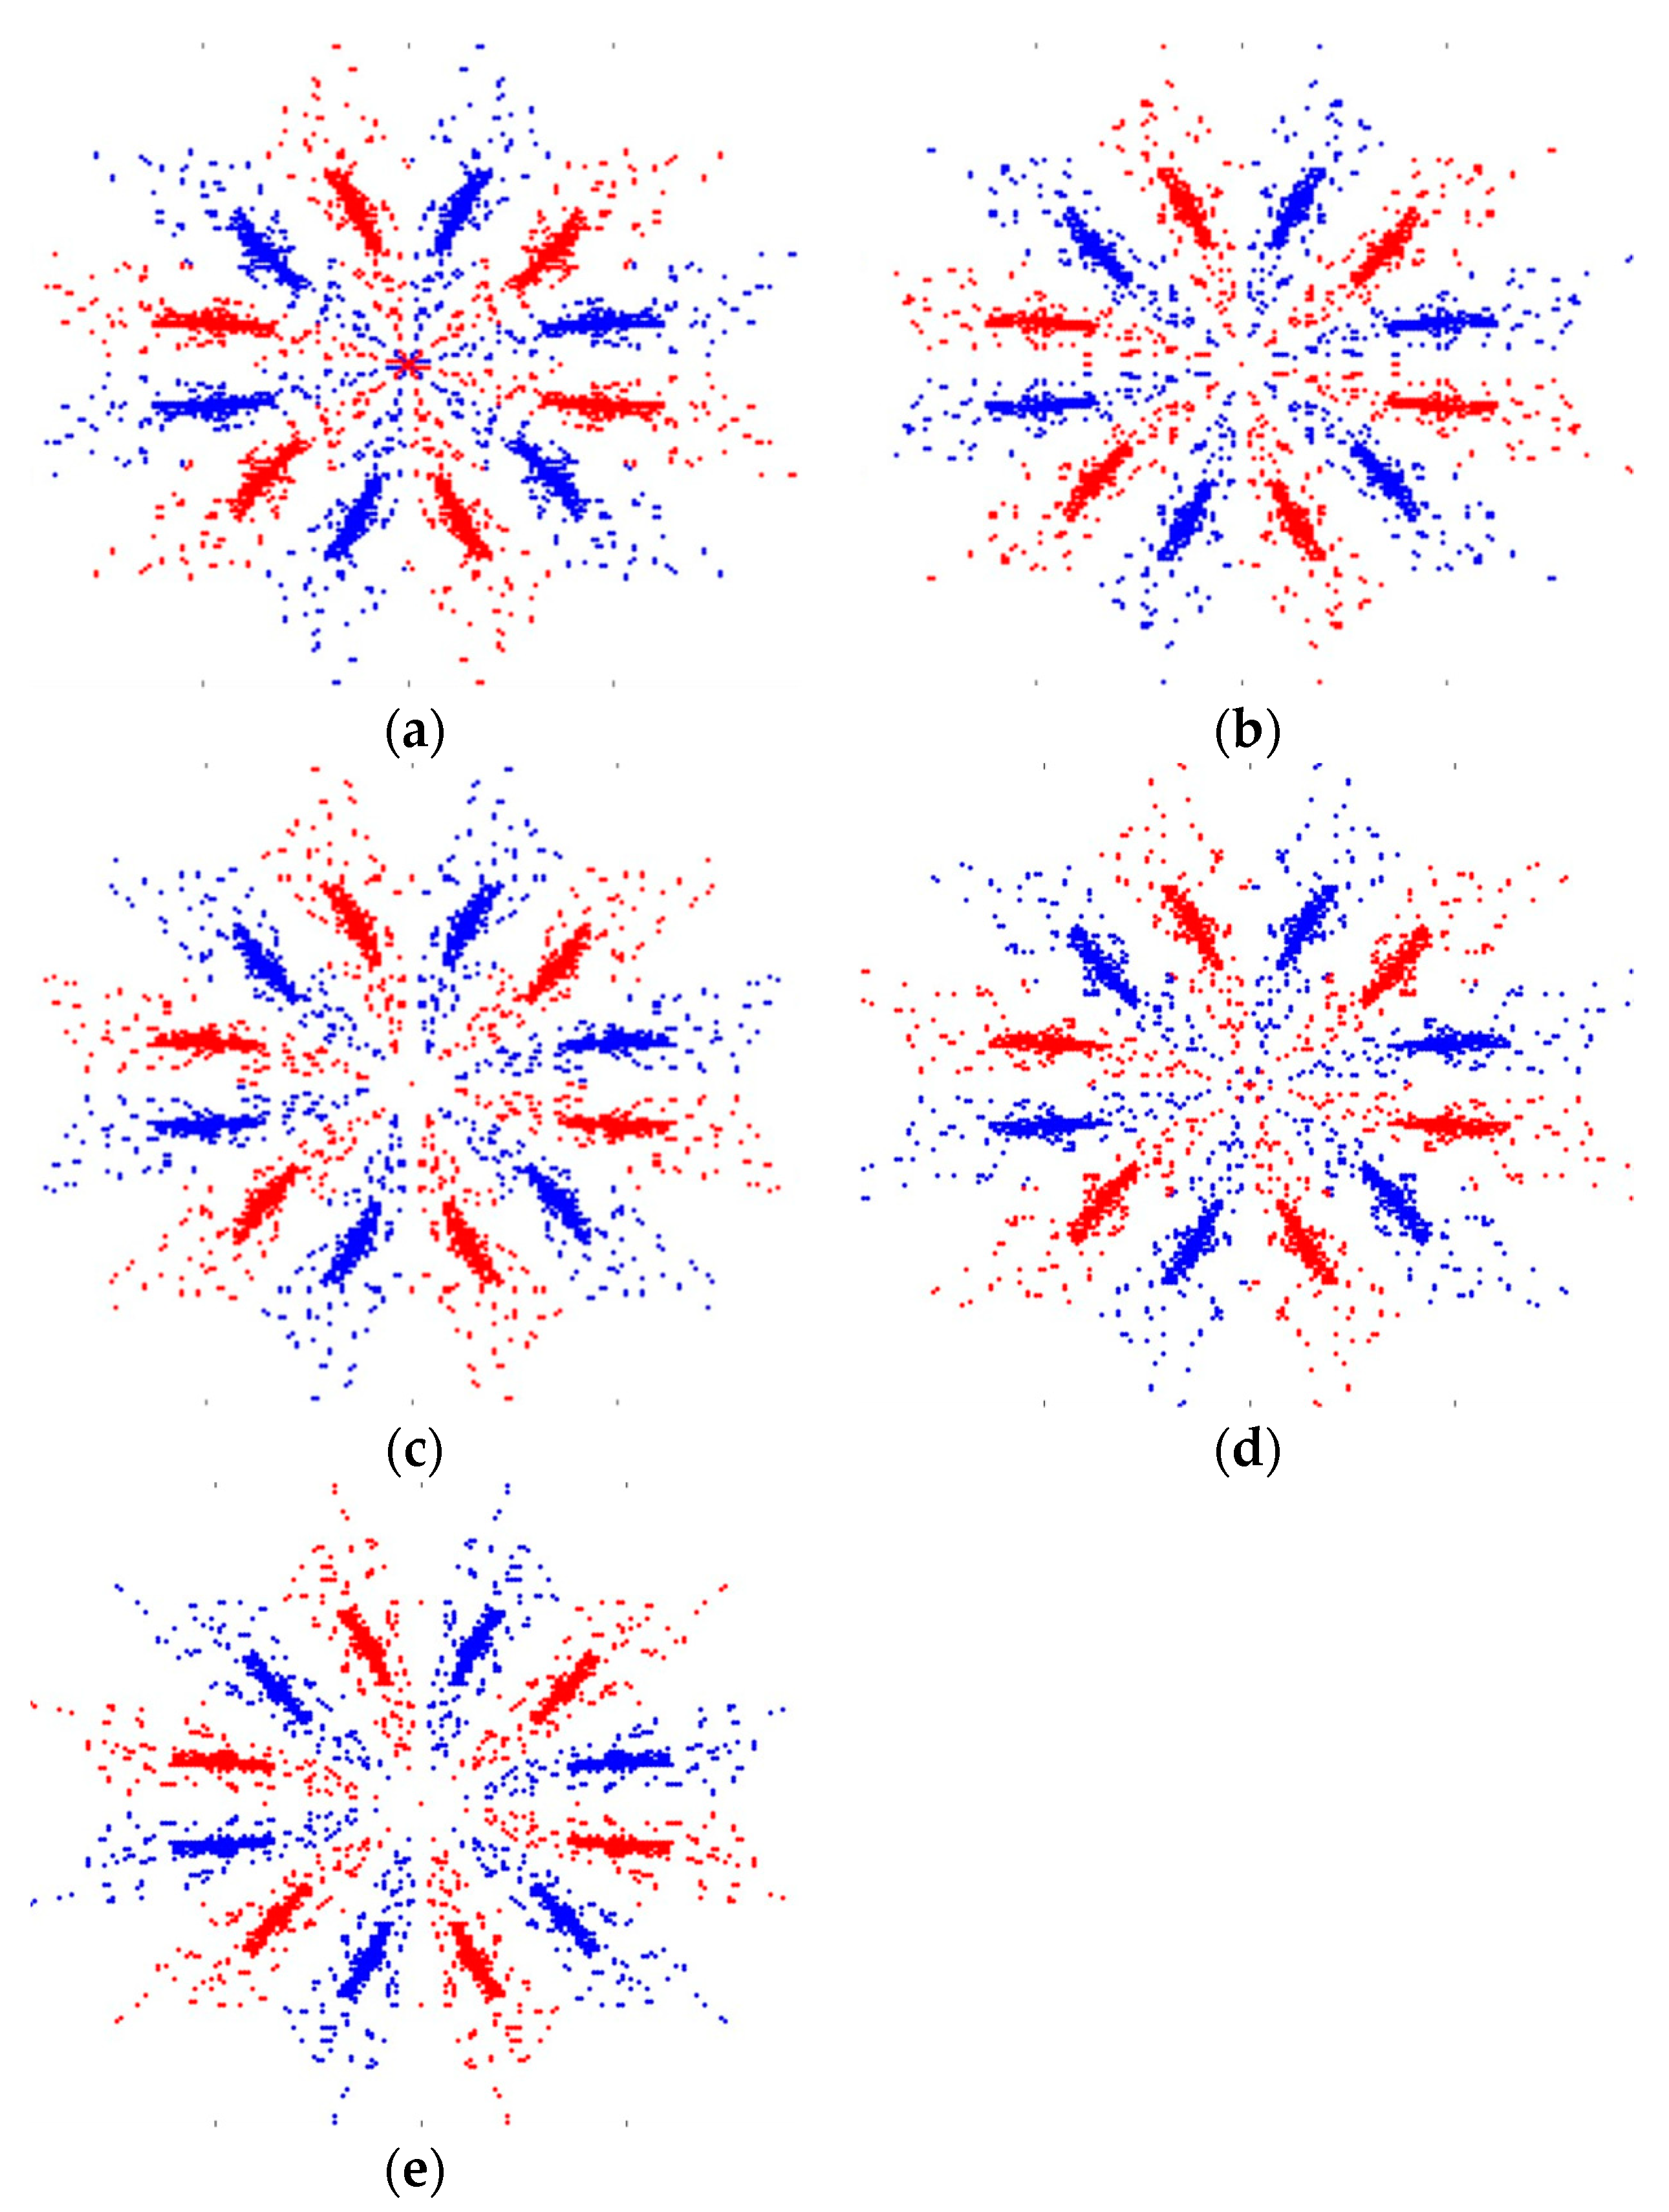
4.2. Application of the Symmetric Point Coordinate Method in Lithium Battery Modules
4.3. Recognition Results of the CNN
5. Discussion
6. Conclusions
Author Contributions
Funding
Institutional Review Board Statement
Informed Consent Statement
Data Availability Statement
Conflicts of Interest
References
- Gan, N.; Sun, Z.; Zhang, Z.; Xu, S.; Liu, P.; Qin, Z. Data-Driven Fault Diagnosis of Lithium-Ion Battery Over-discharge in Electric Vehicles. IEEE Trans. Power Electron. 2022, 37, 4575–4588. [Google Scholar] [CrossRef]
- Han, S.; Choi, C.; Kwon, S.; Lee, S.; Kim, J. Electrical Analysis about internal short circuit using additional resistance in high energy lithium-ion battery. In Proceedings of the 2020 20th International Conference on Control, Automation and Systems (ICCAS), Busan, Republic of Korea, 13–16 October 2020. [Google Scholar]
- Sepasihooyi, S.; Abdollahi, F. Fault detection of Lithium-lon Battery in Electric Vehicles Considering Ageing Effects. In Proceedings of the 2022 8th International Conference on Control, Instrumentation and Automation (ICCIA), Tehran, Islamic Republic of Iran, 2–3 March 2022. [Google Scholar]
- Yu, Y.; Yao, Z.; Tian, F. Multi-task Deep Learning Based Defect Detection for Lithium Battery Tabs. In Proceedings of the 2022 China Automation Congress (CAC), Xiamen, China, 25–27 November 2022. [Google Scholar]
- Sahraei, E.; Gilaki, M.; Lynch, W.; Kirtley, J.; Soudbakhsh, D. Cycling Results of Mechanically Damaged Li-Ion Batteries. In Proceedings of the 2019 IEEE Electric Ship Technologies Symposium (ESTS), Washington, DC, USA, 14–16 August 2019. [Google Scholar]
- Li, D.; Zhang, Z.; Liu, P.; Wang, Z.; Zhang, L. Battery Fault Diagnosis for Electric Vehicles Based on Voltage Abnormality by Combining the Long Short-Term Memory Neural Network and the Equivalent Circuit Model. IEEE Trans. Power Electron. 2021, 36, 1303–1315. [Google Scholar] [CrossRef]
- Zhang, Y.; Zhang, P.; Hu, J.; Zhang, C.; Zhang, L.; Wang, Y.; Zhang, W. Fault Diagnosis Method of Lithium-Ion Battery Leakage Based on Electrochemical Impedance Spectroscopy. IEEE Trans. Ind. Appl. 2024, 60, 1879–1889. [Google Scholar] [CrossRef]
- Wang, N.; Yang, Q.; Xing, J.; Jia, H.; Chen, W. Thermal Fault Diagnosis Method of Lithium Battery Based on LSTM and Battery Physical Model. In Proceedings of the 2022 41st Chinese Control Conference (CCC), Hefei, China, 25–27 July 2022. [Google Scholar]
- Sharma, R.; Bala, A.; Singh, a.; Singh, M. State of Health Estimation for Li-Ion Battery Using Machine Learning. In Proceedings of the 2023 IEEE International Conference on Metrology for eXtended Reality, Artificial Intelligence and Neural Engineering (Metro XRAINE), Milano, Italy, 25–27 October 2023. [Google Scholar]
- Zhao, X.; He, H.; Huang, R.; Dou, J.; Wang, Y.; Jia, C. A deep learning-based power battery capacity estimation model assisted with feature vector construction. In Proceedings of the 2022 International Conference on Electrical, Computer and Energy Technologies (ICECET), Prague, Czech Republic, 20–22 July 2022. [Google Scholar]
- Gao, D.; Hou, J.; Liang, K.; Yang, Q. Fault Diagnosis System for Electric Vehicle Charging Devices Based on Fault Tree Analysis. In Proceedings of the 2018 37th Chinese Control Conference (CCC), Wuhan, China, 25–27 July 2018. [Google Scholar]
- Sainath, T.; Weiss, R.; Wilson, K.; Li, B.; Narayanan, A.; Variani, E. Multichannel Signal Processing with Deep Neural Networks for Automatic Speech Recognition. IEEE/ACM Trans. 2017, 25, 965–979. [Google Scholar] [CrossRef]
- Fan, J.; Zhao, T.; Kuang, Z.; Zheng, Y.; Zhang, J.; Yu, J. HD-MTL: Hierarchical Deep Multi-Task Learning for Large-Scale Visual Recognition. IEEE Trans. Image Process. 2017, 26, 1923–1938. [Google Scholar] [CrossRef] [PubMed]
- Ardeshiri, R.; Ma, C. State of Charge Estimation of Lithium-ion Battery Using Deep Convolutional Stacked Bidirectional LSTM. In Proceedings of the 2021 IEEE 30th International Symposium on Industrial Electronics (ISIE) Kyoto, Japan, 20–23 June 2021. [Google Scholar]
- You, M.; Liu, Y.; Chen, Z.; Zhou, X. Capacity Estimation of lithium battery based on charging data and Long Short-term Memory Recurrent Neural Network. In Proceedings of the 2022 IEEE Intelligent Vehicles Symposium (IV), Aachen, Germany, 4–9 June 2022. [Google Scholar]
- Dong, Z.; Zhou, X.; Liu, Y. Comparison of Neural Network Models in Lithium-Ion Batteries’ State of Charge Estimation. In Proceedings of the 2023 4th International Conference on Smart Grid and Energy Engineering (SGEE), Zhengzhou, China, 24–26 November 2023. [Google Scholar]
- Yuan, H.; Chen, J.; You, X.; Wu, H.; Dong, Y.; Shi, Q. Fault Diagnosis of Bearing in PMSM Based on Calibrated Stator Current Residual Signal and Improved Symmetrized Dot Pattern. IEEE Sens. J. 2024, 24, 3232–3246. [Google Scholar] [CrossRef]
- Lu, H.; Zhao, X.; Tao, B.; Yin, Z. Online Process Monitoring Based on Vibration-Surface Quality Map for Robotic Grinding. IEEE/ASME Trans. Mechatron. 2020, 25, 2882–2892. [Google Scholar] [CrossRef]
- Rastegarpanah, A.; Contreras, C.; Stolkin, R. Hyperparameter-optimized CNN and CNN-LSTM for Predicting the Remaining Useful Life of Lithium-Ion Batteries. In Proceedings of the 2023 Eleventh International Conference on Intelligent Computing and Information Systems (ICICIS), Cairo, Egypt, 21–23 November 2023. [Google Scholar]
- Zhang, K.; Sun, M.; Han, T.; Yuan, X.; Guo, L.; Liu, T. Residual Networks of Residual Networks: Multilevel Residual Networks. IEEE Trans. Circuits Syst. Video Technol. 2018, 28, 1303–1314. [Google Scholar] [CrossRef]
- Jothika, G.; Khilar, R. Improving Disease Detection in Tomato Leaves Using Visual Geometry Group 19 Compared to the Artificial Neural Network Algorithm. In Proceedings of the 2024 International Conference on Intelligent and Innovative Technologies in Computing, Electrical and Electronics (IITCEE), Bangalore, India, 24–25 January 2024. [Google Scholar]
- Yang, T.; Ma, J.; Yuan, J.; Wang, S. Reactor Coolant System Fault Diagnosis Method Using Symmetrized Dot Pattern Images and DSCNN. In Proceedings of the 2023 CAA Symposium on Fault Detection, Supervision and Safety for Technical Processes (SAFEPROCESS), Yibin, China, 22–24 September 2023. [Google Scholar]
- Lecun, Y.; Bottou, L.; Bengio, Y.; Haffner, P. Gradient-based learning applied to document recognition. Proc. IEEE 1998, 86, 2278–2324. [Google Scholar] [CrossRef]
- Yanagisawa, H.; Yamashita, T.; Watanabe, H. A study on object detection method from manga images using CNN. In Proceedings of the 2018 International Workshop on Advanced Image Technology (IWAIT), Chiang Mai, Thailand, 7–9 January 2018. [Google Scholar]
- Kido, S.; Hirano, Y.; Hashimoto, N. Detection and classification of lung abnormalities by use of convolutional neural network (CNN) and regions with CNN features (R-CNN). In Proceedings of the 2018 International Workshop on Advanced Image Technology (IWAIT), Chiang Mai, Thailand, 7–9 January 2018. [Google Scholar]
- Li, L.; Yuan, X.; Yang, C. Fault Diagnosis for Rolling Bearings Using Time-Frequency Energy Matrix Difference and CNN. In Proceedings of the 2023 9th International Conference on Mechanical and Electronics Engineering (ICMEE), Xi’an, China, 17–19 November 2023. [Google Scholar]
- Wang, M.; Hung, C.; Lu, S.; Chen, F.; Su, Y.; Kuo, C. Fault Diagnosis of Wind Turbine Gearbox Using Vibration Scatter Plot and Visual Geometric Group Network. Processes 2024, 12, 985. [Google Scholar] [CrossRef]
- Xiong, J.; Banvait, H.; Li, L.; Chen, Y.; Xie, J.; Liu, Y.; Wu, M.; Chen, J. Failure detection for over-discharged Li-ion batteries. In Proceedings of the 2012 IEEE International Electric Vehicle Conference (IEVC), Greenville, SC, USA, 4–8 March 2012. [Google Scholar]
- Wu, X.; Chen, Y.; Han, X.; Du, J.; Wen, T.; Sun, Y. Analysis of performance degradation of lithium iron phosphate power battery under slightly overcharging cycles. In Proceedings of the 2020 4th CAA International Conference on Vehicular Control and Intelligence (CVCI), Hangzhou, China, 18–20 December 2020. [Google Scholar]
- Zhang, C.; Zhang, P.; Wang, Y.; Zhang, L.; Hu, J.; Zhang, W. Support Vector Machine Based Lithium-ion Battery Electrolyte Leakage Fault Diagnosis Method. In Proceedings of the 2022 4th International Conference on Smart Power & Internet Energy Systems (SPIES), Beijing, China, 9–12 December 2022. [Google Scholar]
- You, H.; Zhu, J.; Wang, X.; Jiang, B.; Wei, X.; Dai, H. Lithium-Ion Battery Online Capacity Diving Multilevel Evaluation and Early Warning Method Based on State of Nonlinear Aging. In Proceedings of the 2022 4th International Conference on Smart Power & Internet Energy Systems (SPIES), Beijing, China, 9–12 December 2022. [Google Scholar]


| Lithium Battery—Four Common Faults | |
|---|---|
| Type A | Normal (Type 1) |
| Type B | Over-discharging (Type 2) |
| Type C | Overcharging (Type 3) |
| Type D | Leakage (Type 4) |
| Type E | Aging (Type 5) |
| Equipment | Model | Specification |
|---|---|---|
| Programmable DC Power Supply | ITECH-IT6302 | Output voltage: 0–30 V, Output current: 0–3 A, max power: 90 W |
| Programmable Electronic Load | ITECH-IT8512A | Max input voltage: 120 V, Max input current: 30 A, Max input power: 300 W |
| NI PXIe Chassis | NI PXI-5105 | 60 MHz sampling rate, 8 synchronized channels, and 12-bit resolution |
| Signal Generator | Agilent 33220A | Frequency range: 1 µHz to 20 MHz Modulation: AM, FM, PM, FSK Waveforms: sine, square, ramp, and pulse |
| Fault Types | Training Pattern | Testing Pattern | Accuracy (%) |
|---|---|---|---|
| Type A | 400 | 200 | 99.9 |
| Type B | 400 | 199 | |
| Type C | 400 | 200 | |
| Type D | 400 | 200 | |
| Type E | 400 | 200 |
| Algorithm | Training Time (s) | Testing Time (s) | Epoch | Accuracy (%) |
|---|---|---|---|---|
| SDP + CNN | 121.9 | 0.3970 | 50 | 95.7 |
| SDP + Res-Net18 | 232.0 | 0.7095 | 50 | 89.8 |
| SDP + VGG-19 | 369.6 | 0.0107 | 50 | 94.4 |
| SDP + CNN | 218.5 | 0.4457 | 100 | 99.9 |
| SDP + Res-Net18 | 458.6 | 0.7602 | 100 | 91.5 |
| SDP + VGG-19 | 723.5 | 0.0067 | 100 | 96.0 |
Disclaimer/Publisher’s Note: The statements, opinions and data contained in all publications are solely those of the individual author(s) and contributor(s) and not of MDPI and/or the editor(s). MDPI and/or the editor(s) disclaim responsibility for any injury to people or property resulting from any ideas, methods, instructions or products referred to in the content. |
© 2024 by the authors. Licensee MDPI, Basel, Switzerland. This article is an open access article distributed under the terms and conditions of the Creative Commons Attribution (CC BY) license (https://creativecommons.org/licenses/by/4.0/).
Share and Cite
Wang, M.-H.; Hong, J.-X.; Lu, S.-D. Fault Diagnosis of Lithium Battery Modules via Symmetrized Dot Pattern and Convolutional Neural Networks. Sensors 2025, 25, 94. https://doi.org/10.3390/s25010094
Wang M-H, Hong J-X, Lu S-D. Fault Diagnosis of Lithium Battery Modules via Symmetrized Dot Pattern and Convolutional Neural Networks. Sensors. 2025; 25(1):94. https://doi.org/10.3390/s25010094
Chicago/Turabian StyleWang, Meng-Hui, Jing-Xuan Hong, and Shiue-Der Lu. 2025. "Fault Diagnosis of Lithium Battery Modules via Symmetrized Dot Pattern and Convolutional Neural Networks" Sensors 25, no. 1: 94. https://doi.org/10.3390/s25010094
APA StyleWang, M.-H., Hong, J.-X., & Lu, S.-D. (2025). Fault Diagnosis of Lithium Battery Modules via Symmetrized Dot Pattern and Convolutional Neural Networks. Sensors, 25(1), 94. https://doi.org/10.3390/s25010094