
Enhanced Vernier Effect in Cascaded Fiber Loop Interferometers for Improving Temperature Sensitivity

 ,
, 
Abstract
1. Introduction
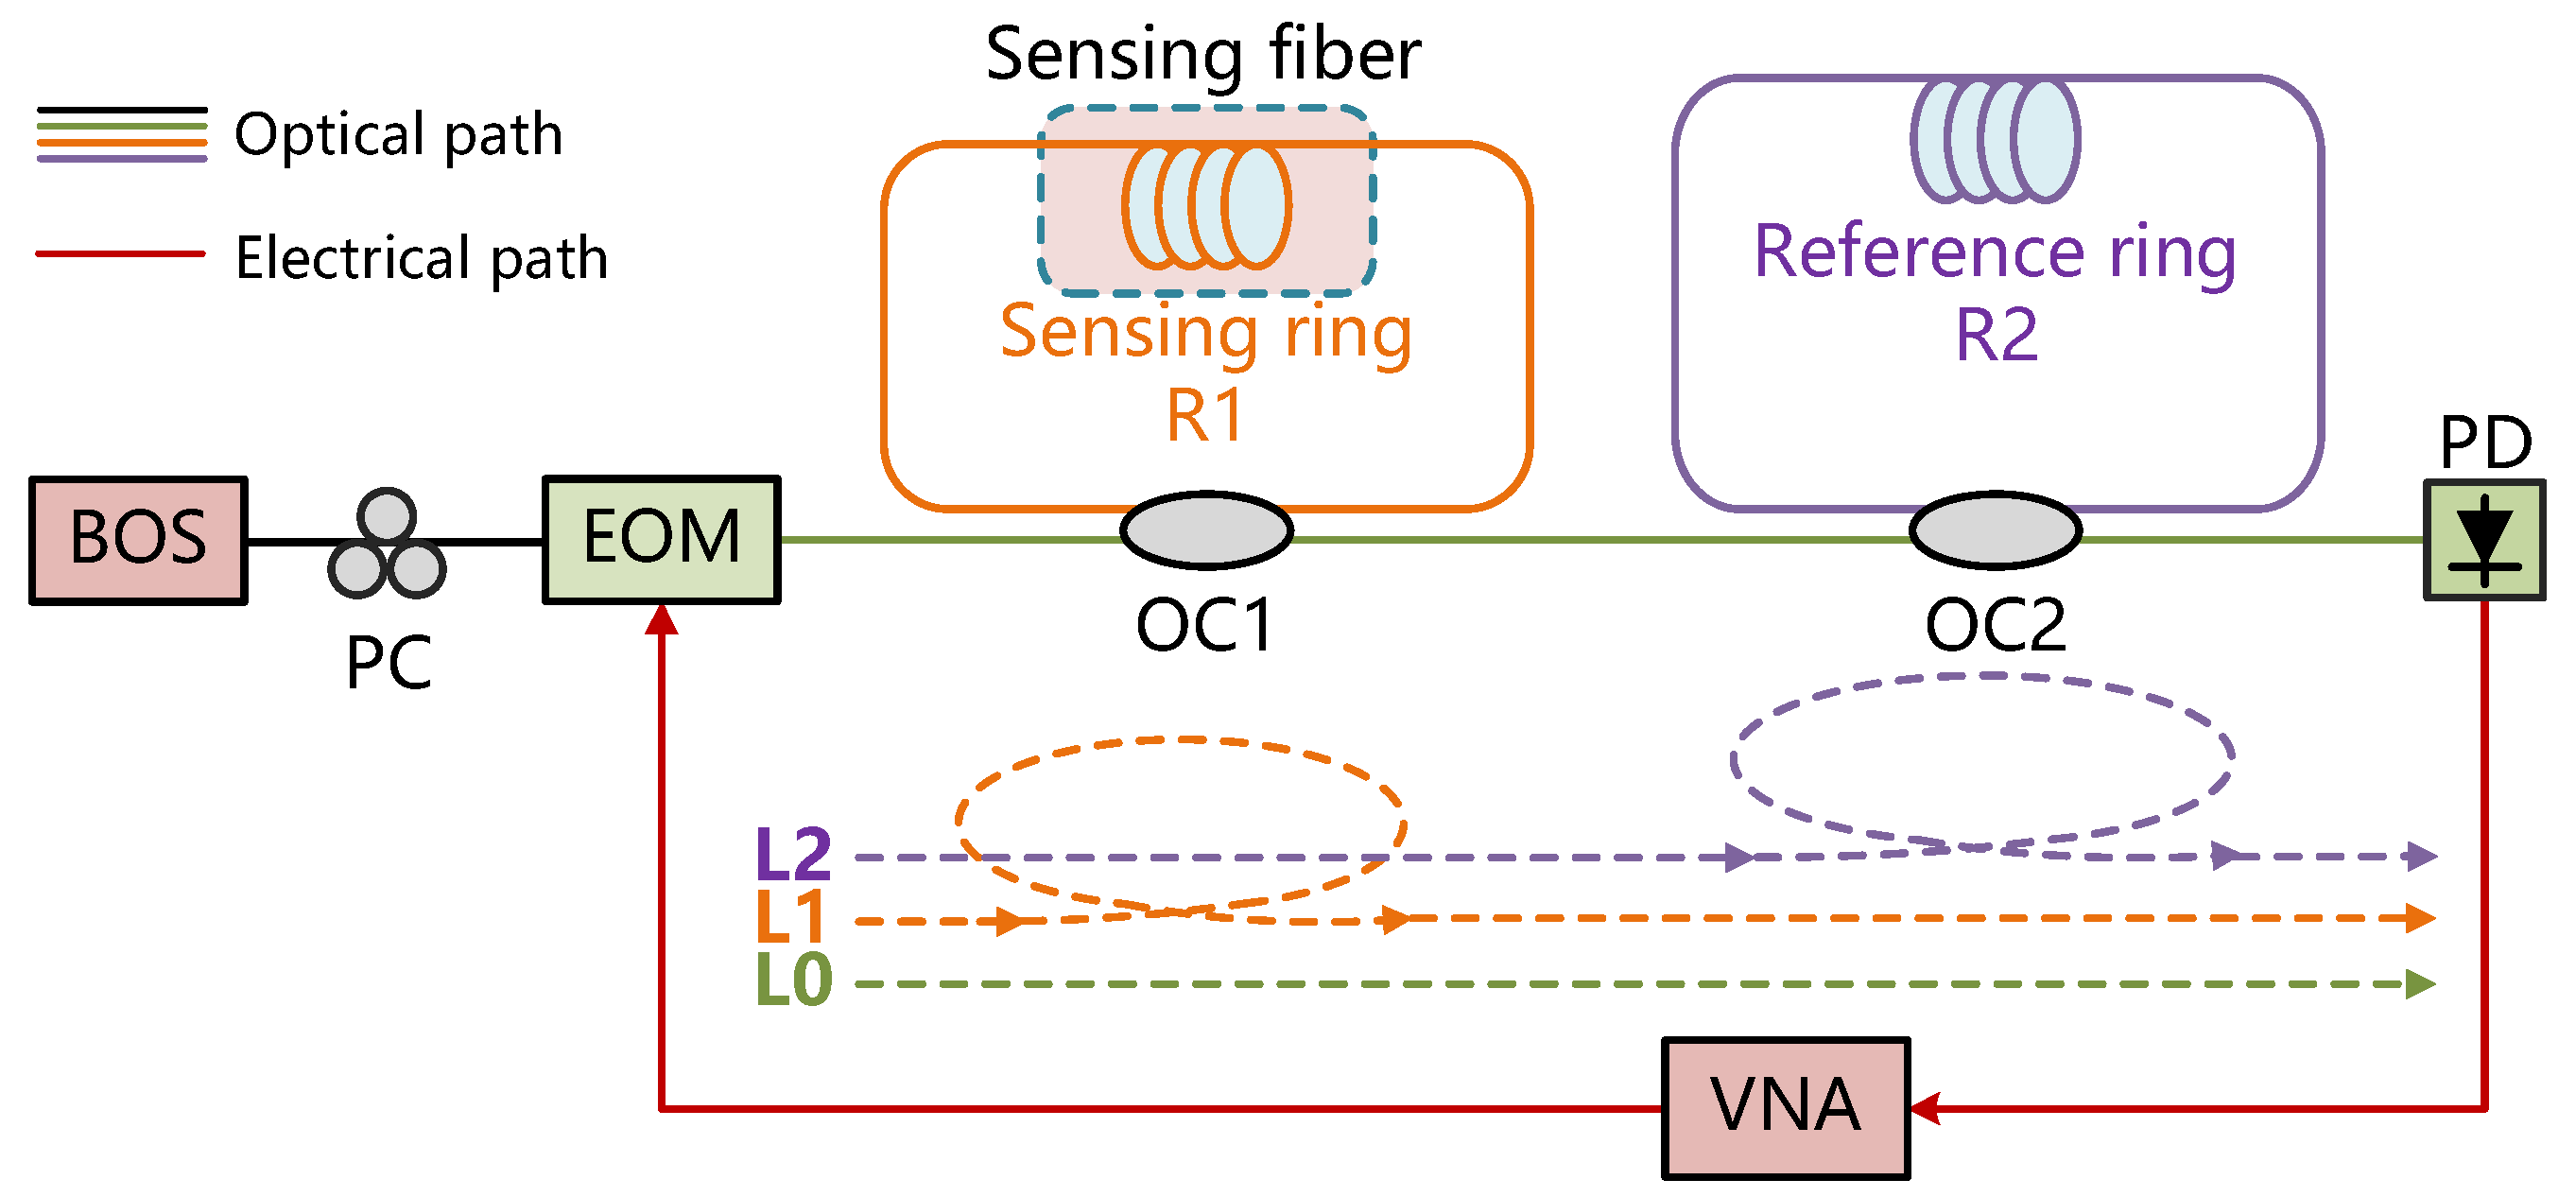
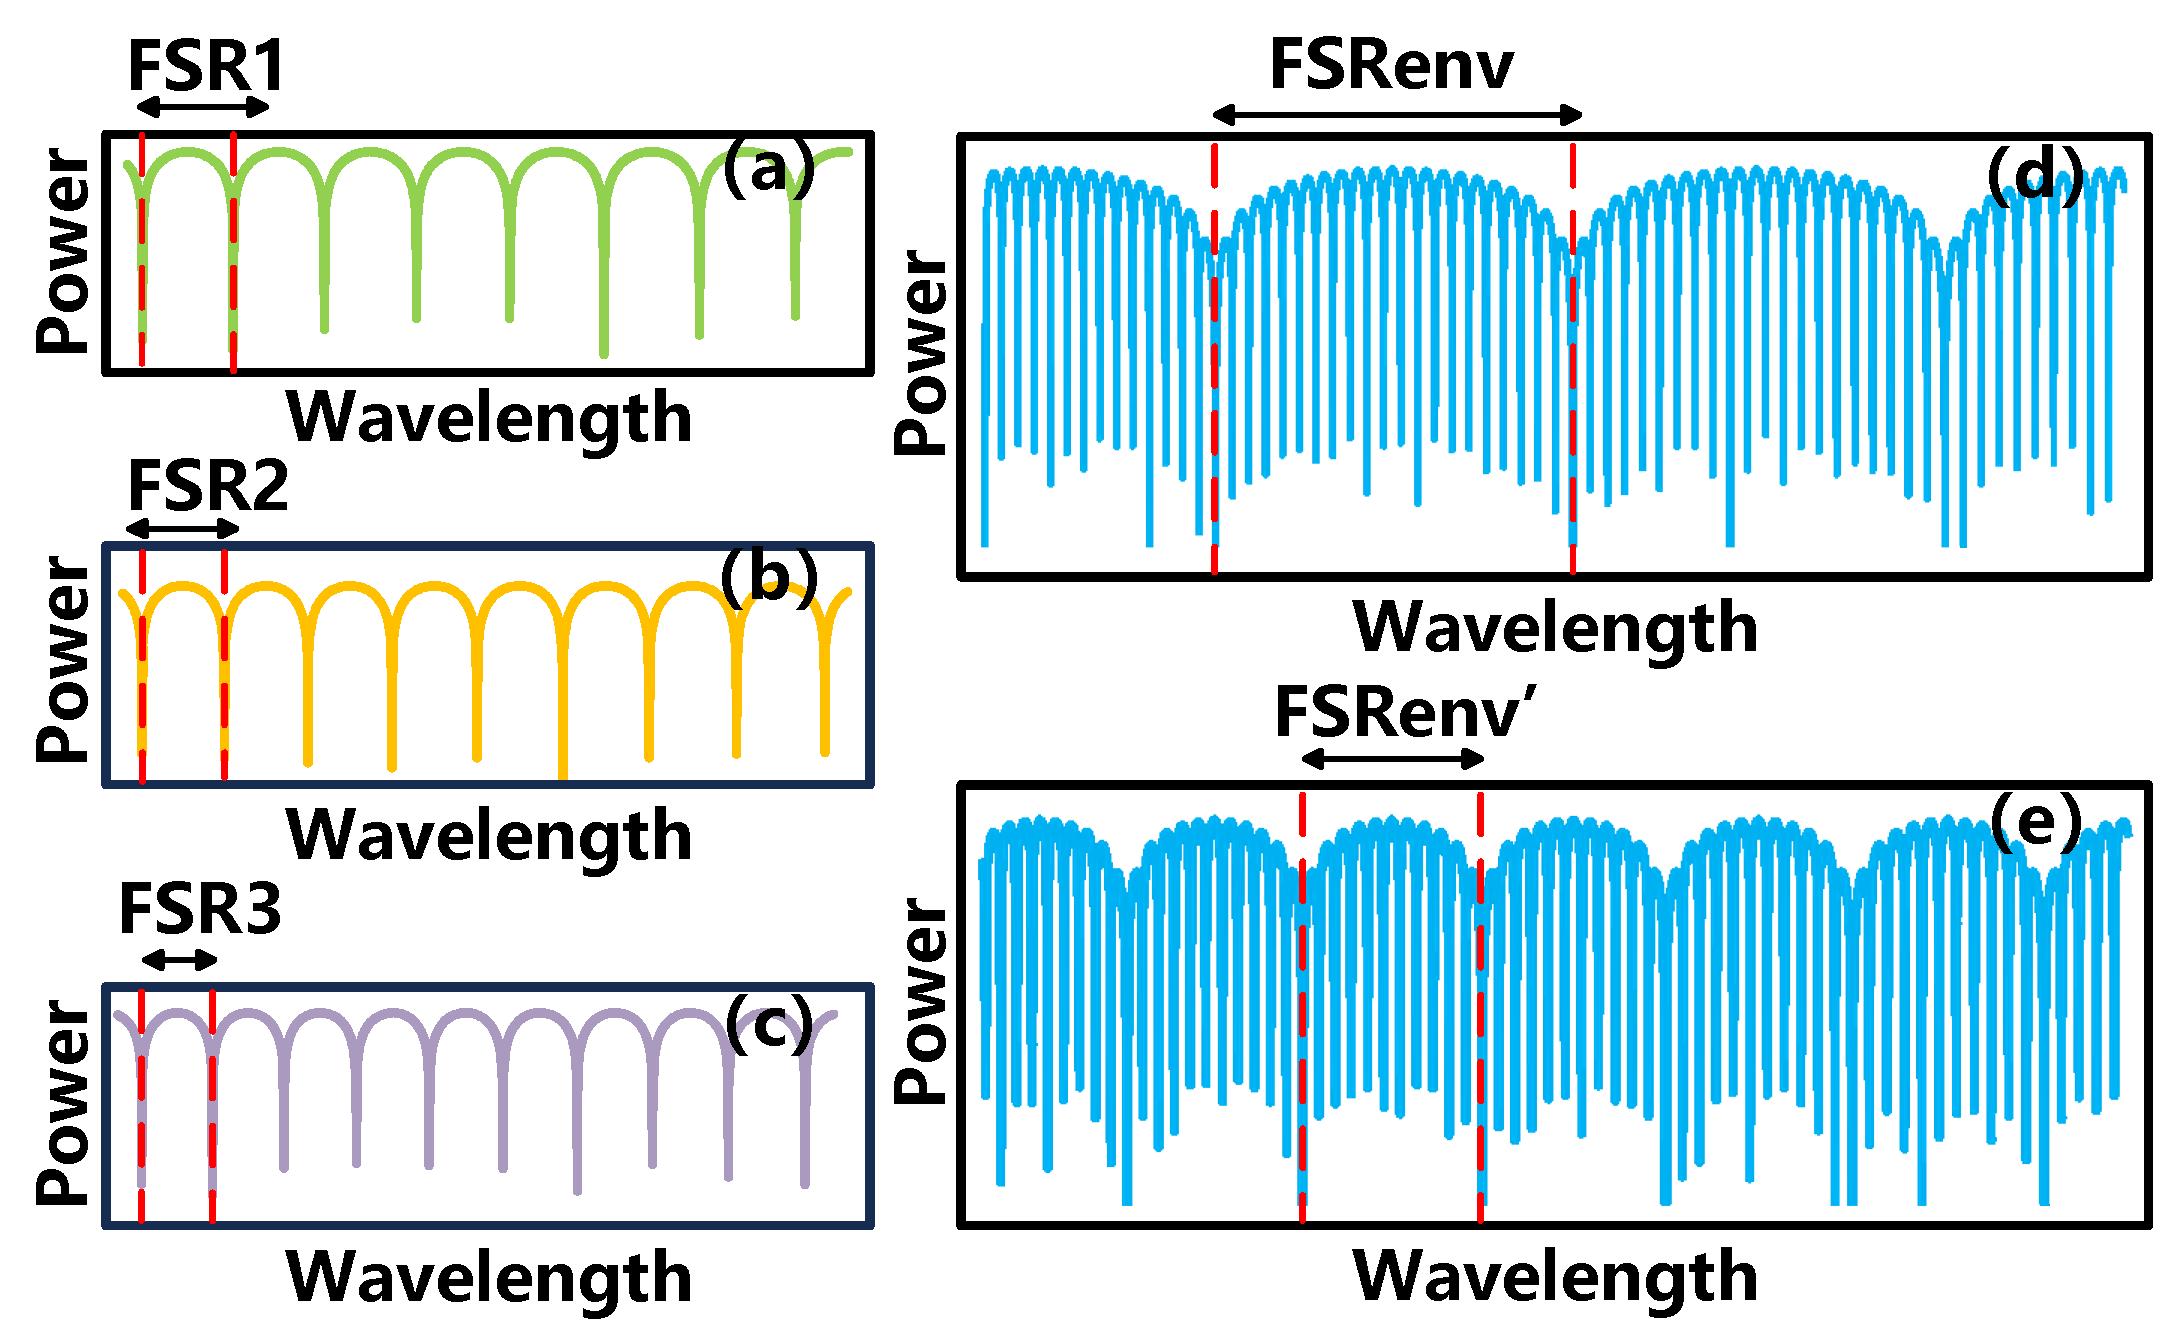
2. Principle
Principle of OCMI Sensing System
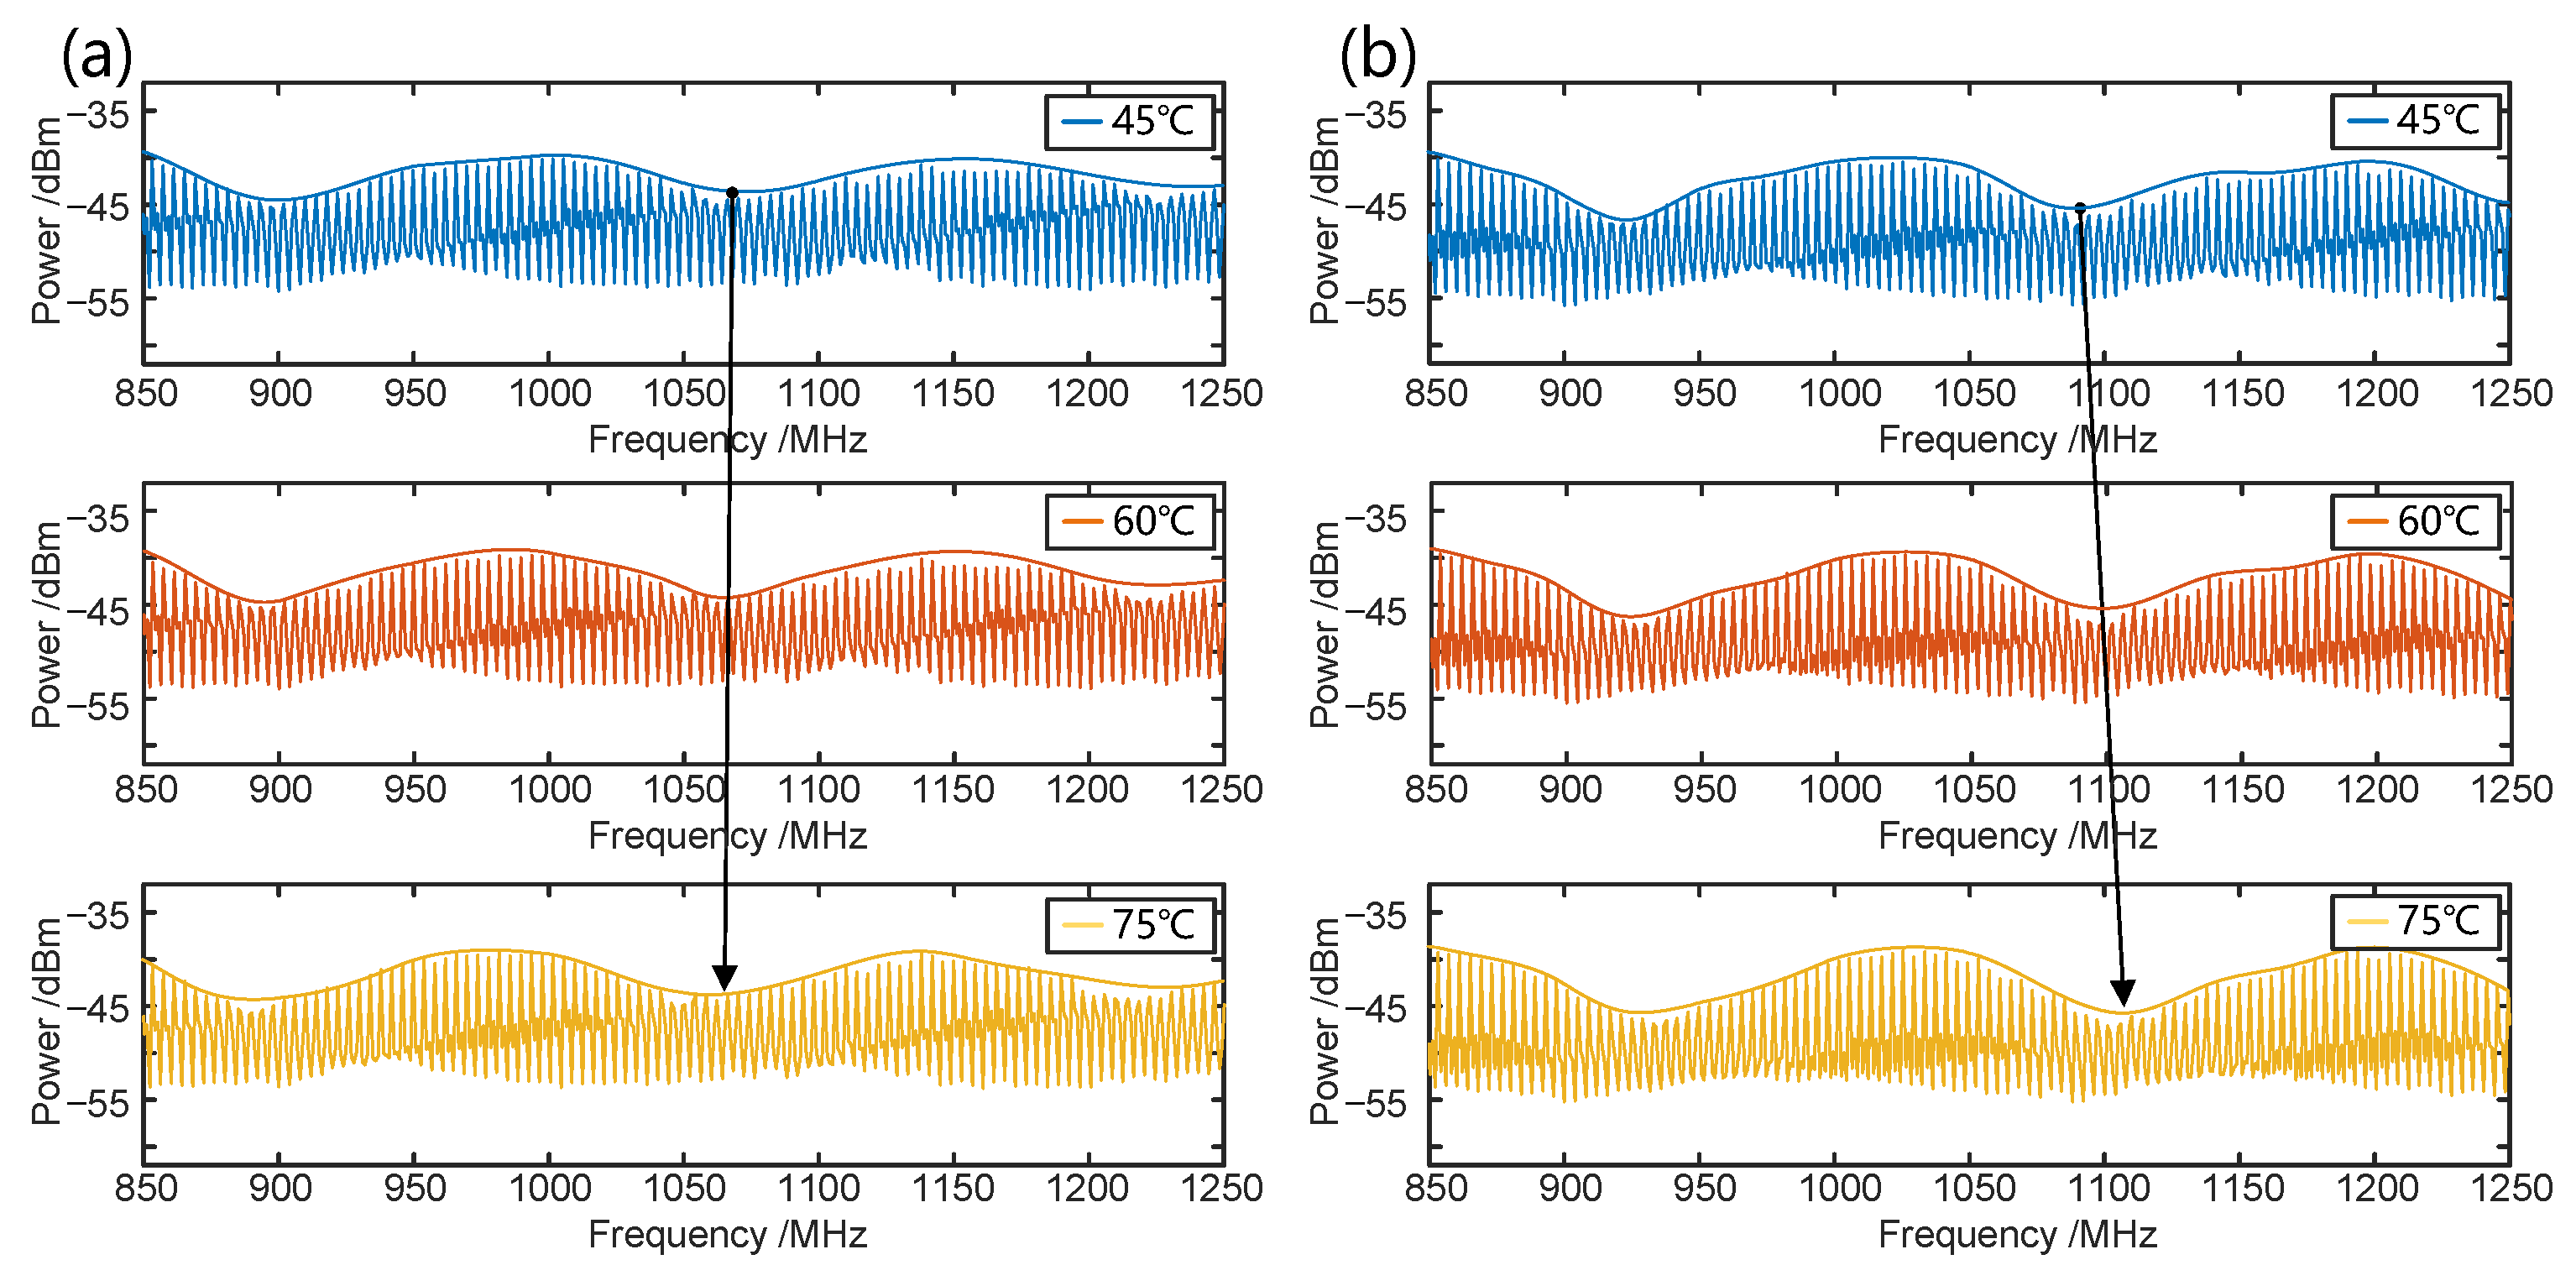
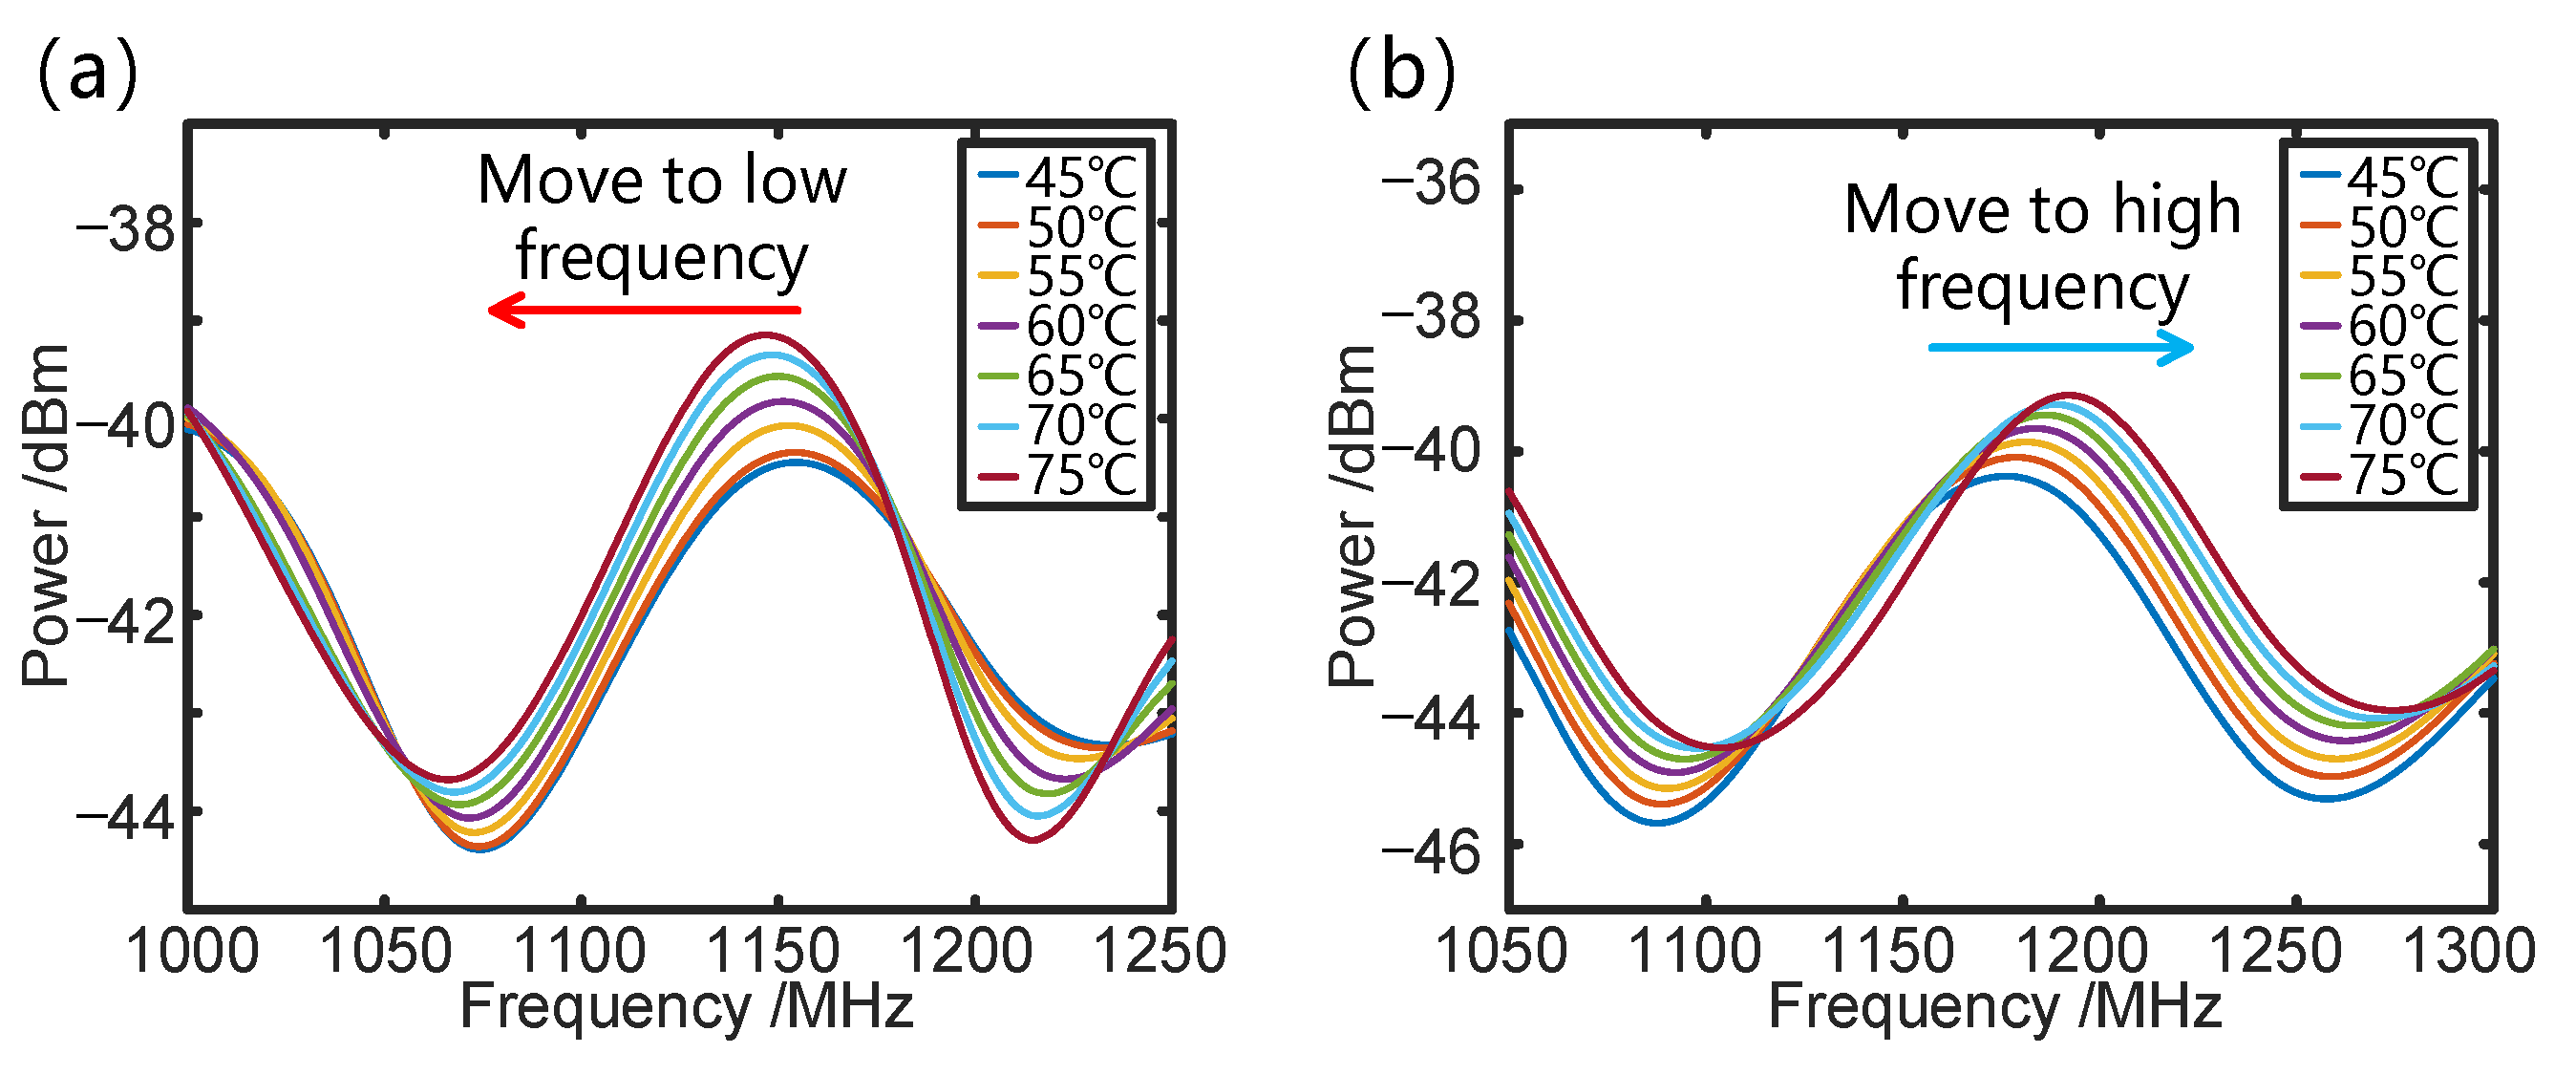
3. Experiment
4. Conclusions
Author Contributions
Funding
Institutional Review Board Statement
Informed Consent Statement
Data Availability Statement
Conflicts of Interest
References
- Novais, S.; Nascimento, M.; Grande, L.; Domingues, M.F.; Antunes, P.; Alberto, N.; Leitão, C.; Oliveira, R.; Koch, S.; Kim, G.T. Internal and external temperature monitoring of a Li-Ion battery with fiber Bragg grating sensors. Sensors 2016, 16, 1394. [Google Scholar] [CrossRef]
- Roriz, P.; Silva, S.; Frazão, O.; Novais, S. Optical fiber temperature sensors and their biomedical applications. Sensors 2020, 20, 2113. [Google Scholar] [CrossRef] [PubMed]
- Zhao, Y.; Rong, M.; Liao, Y. Fiber-optic temperature sensor used for oil well based on semiconductor optical absorption. IEEE Sens. J. 2003, 3, 400–403. [Google Scholar] [CrossRef]
- Ma, S.; Xu, Y.; Pang, Y.; Zhao, X.; Li, Y.; Qin, Z.; Liu, Z.; Lu, P.; Bao, X. Optical fiber sensors for high-temperature monitoring: A review. Sensors 2022, 22, 5722. [Google Scholar] [CrossRef]
- Malka, D.; Berke, B.A.; Tischler, Y.; Zalevsky, Z. Improving Raman spectra of pure silicon using super-resolved method. J. Opt. 2019, 21, 075801. [Google Scholar] [CrossRef]
- Kuang, R.; Ye, Y.; Chen, Z.; He, R.; Savović, I.; Djordjevich, A.; Savović, S.; Ortega, B.; Marques, C.; Li, X. Low-cost plastic optical fiber integrated with smartphone for human physiological monitoring. Opt. Fiber Technol. 2022, 71, 102947. [Google Scholar] [CrossRef]
- Savović, S.; Djordjevich, A.; Savović, I. Theoretical investigation of bending loss in step-index plastic optical fibers. Opt. Commun. 2020, 475, 126200. [Google Scholar] [CrossRef]
- Lanziano, L.; Sherf, I.; Malka, D. A 1 × 8 Optical Splitter Based on Polycarbonate Multicore Polymer Optical Fibers. Sensors 2024, 24, 5063. [Google Scholar] [CrossRef]
- Guo, K.; Yang, R.; Wang, H.; Zhou, F.; Chu, R.; Wang, H.; Shao, L.; Liu, Y. Ultra-short Fiber Optic Temperature Sensor for the Small-scale Heat Sources. IEEE Sens. J. 2024, 24, 2682–2688. [Google Scholar] [CrossRef]
- Yao, J. Microwave photonic sensors. J. Light. Technol. 2020, 39, 3626–3637. [Google Scholar] [CrossRef]
- Olvera, A.D.J.F.; Krause, B.L.; Preu, S. A true optoelectronic spectrum analyzer for millimeter waves with Hz resolution. IEEE Access 2021, 9, 114339–114347. [Google Scholar] [CrossRef]
- Xiao, Y.; Wang, Y.; Zhu, D.; Liu, Q.; Shi, J. Low cross-sensitivity and sensitivity-enhanced FBG sensor interrogated by an OCMI-based three-arm interferometer. Opt. Express 2023, 31, 14119–14127. [Google Scholar] [CrossRef]
- Tian, X.; Wang, Y.; Shi, J.; Gao, L.; Zhu, D. Improving the Sensitivity of Temperature Measurement Based on a Dual-Passband Microwave Photonic Filter. IEEE Sens. J. 2022, 22, 20531–20537. [Google Scholar] [CrossRef]
- Wang, L.; Hao, T.; Li, G.; Li, M.; Zhu, N.; Li, W. Microwave photonic temperature sensing based on Fourier domain mode-locked OEO and temperature-to-time mapping. J. Light. Technol. 2022, 40, 5322–5327. [Google Scholar] [CrossRef]
- Tian, X.; Li, L.; Chew, S.X.; Gunawan, G.; Nguyen, L.; Yi, X. Cascaded optical microring resonator based auto-correction assisted high resolution microwave photonic sensor. J. Light. Technol. 2021, 39, 7646–7655. [Google Scholar] [CrossRef]
- Huang, J.; Lan, X.; Luo, M.; Xiao, H. Spatially continuous distributed fiber optic sensing using optical carrier based microwave interferometry. Opt. Express 2014, 22, 18757–18769. [Google Scholar] [CrossRef] [PubMed]
- Liu, Y.; Yu, Y.; Wang, L.; Yu, Y.; Zhang, X. Reconfigurable microwave photonic bandpass filter based on CROW. J. Light. Technol. 2023, 42, 1597–1604. [Google Scholar] [CrossRef]
- Zeng, Z.; Peng, D.; Zhang, Z.; Zhang, S.; Ni, G.; Liu, Y. An SBS-based optoelectronic oscillator for high-speed and high-sensitivity temperature sensing. IEEE Photonics Technol. Lett. 2020, 32, 995–998. [Google Scholar] [CrossRef]
- Biswas, U.; Rakshit, J.K.; Das, J.; Bharti, G.K.; Suthar, B.; Amphawan, A.; Najjar, M. Design of an ultra-compact and highly-sensitive temperature sensor using photonic crystal based single micro-ring resonator and cascaded micro-ring resonator. Silicon 2021, 13, 885–892. [Google Scholar] [CrossRef]
- Gomes, A.D.; Ferreira, M.S.; Bierlich, J.; Kobelke, J.; Rothhardt, M.; Bartelt, H.; Frazão, O. Optical harmonic Vernier effect: A new tool for high performance interferometric fiber sensors. Sensors 2019, 19, 5431. [Google Scholar] [CrossRef] [PubMed]
- Gomes, A.D.; Kobelke, J.; Bierlich, J.; Dellith, J.; Rothhardt, M.; Bartelt, H.; Frazão, O. Giant refractometric sensitivity by combining extreme optical Vernier effect and modal interference. Sci. Rep. 2020, 10, 19313. [Google Scholar] [CrossRef]
- Gomes, A.D.; Becker, M.; Dellith, J.; Zibaii, M.I.; Latifi, H.; Rothhardt, M.; Bartelt, H.; Frazão, O. Multimode Fabry–Perot interferometer probe based on Vernier effect for enhanced temperature sensing. Sensors 2019, 19, 453. [Google Scholar] [CrossRef] [PubMed]
- Gomes, A.D.; Bartelt, H.; Frazão, O. Optical Vernier effect: Recent advances and developments. Laser Photonics Rev. 2021, 15, 2000588. [Google Scholar] [CrossRef]
- Liu, J.; Nan, P.; Tian, Q.; Sun, X.; Yang, H.; Yang, H. Sensitivity enhanced strain sensor based on two-arm Vernier effect. IEEE Photonics Technol. Lett. 2021, 33, 375–378. [Google Scholar] [CrossRef]
- Wang, Z.; Huang, L.; Liu, C.; Wang, H.; Sun, S.; Yang, D. Sensitivity-enhanced fiber temperature sensor based on Vernier effect and dual in-line Mach–Zehnder interferometers. IEEE Sens. J. 2019, 19, 7983–7987. [Google Scholar] [CrossRef]
- Yang, X.; Wu, S.; Cheng, H.; Ma, J.; Wang, S.; Liu, S.; Lu, P. Simplified highly-sensitive gas pressure sensor based on harmonic Vernier effect. Opt. Laser Technol. 2021, 140, 107007. [Google Scholar] [CrossRef]
- Li, J.; Zhang, M.; Wan, M.; Lin, C.; Huang, S.; Liu, C.; He, Q.; Qiu, X.; Fang, X. Ultrasensitive refractive index sensor based on enhanced Vernier effect through cascaded fiber core-offset pairs. Opt. Express 2020, 28, 4145–4155. [Google Scholar] [CrossRef]
- Xu, Z.; Shu, X.; Fu, H. Sensitivity enhanced fiber sensor based on a fiber ring microwave photonic filter with the Vernier effect. Opt. Express 2017, 25, 21559–21566. [Google Scholar] [CrossRef] [PubMed]
- Cheng, Y.; Wang, Y.; Song, Z.; Lei, J. High-sensitivity optical fiber temperature sensor based on a dual-loop optoelectronic oscillator with the Vernier effect. Opt. Express 2020, 28, 35264–35271. [Google Scholar] [CrossRef]
- Xu, Z.; Shu, X. Fiber optic sensor based on Vernier microwave frequency comb. J. Light. Technol. 2019, 37, 3503–3509. [Google Scholar] [CrossRef]
- Chen, S.; Pan, P.; Xie, T.; Fu, H. Sensitivity enhanced fiber optic temperature sensor based on optical carrier microwave photonic interferometry with harmonic Vernier effect. Opt. Laser Technol. 2023, 160, 109029. [Google Scholar] [CrossRef]
- Wang, S.; Yang, Y.; Mohanty, L.; Jin, R.-B.; Lu, P. Ultrasensitive fiber optic inclinometer based on dynamic Vernier effect using push–pull configuration. IEEE Trans. Instrum. Meas. 2022, 71, 7006408. [Google Scholar] [CrossRef]
- Zhang, S.; Wang, S.; Niu, P.; Cao, J. A novel slight-tilt measure method based on dynamic Vernier effect using dual Fabry-Perot interferometers on vertical cantilever beam. Sens. Actuators A Phys. 2022, 347, 113982. [Google Scholar] [CrossRef]
- Xie, T.; Xu, Z.; Cai, X.; Zhang, D.; Fu, H. Highly sensitive fiber Bragg grating sensing system based on a dual-loop optoelectronic oscillator with the enhanced Vernier effect. J. Light. Technol. 2022, 40, 4871–4877. [Google Scholar] [CrossRef]
- Wang, M.; Zhang, A.; Pan, H.; Liu, F.; Chang, P.; Wang, J.; Lin, R.; Wang, B. Highly sensitive optical fiber temperature sensor based on microwave photonic filter with enhanced Vernier effect. IEEE Sens. J. 2024, 24, 6213–6218. [Google Scholar] [CrossRef]
- Zhu, C.; Huang, J. Sensitivity-enhanced microwave-photonic optical fiber interferometry based on the Vernier effect. Opt. Express 2021, 29, 16820–16832. [Google Scholar] [CrossRef]


| Sensing Structure | Vernier Effect | Sensing System | Sensitivity@ 1 GHz (kHz/°C) | Ref. |
|---|---|---|---|---|
| Cascaded fiber loop | Traditional | MPF | −230.25 | [28] |
| Positive and negative dispersion fiber | Enhanced | OEO | −68.18 | [34] |
| Polarization multiplexing | Traditional | OEO | −402.5 | [29] |
| Frequency comb and fiber ring | Traditional | MPF | −140.178 | [30] |
| Parallel MZIs | Enhanced | MPF | 395.84 | [35] |
| Cascaded MZIs | Traditional | MPF | 290.225 | [31] |
| Cascaded FPIs | Traditional | MPF | 185.3 | [36] |
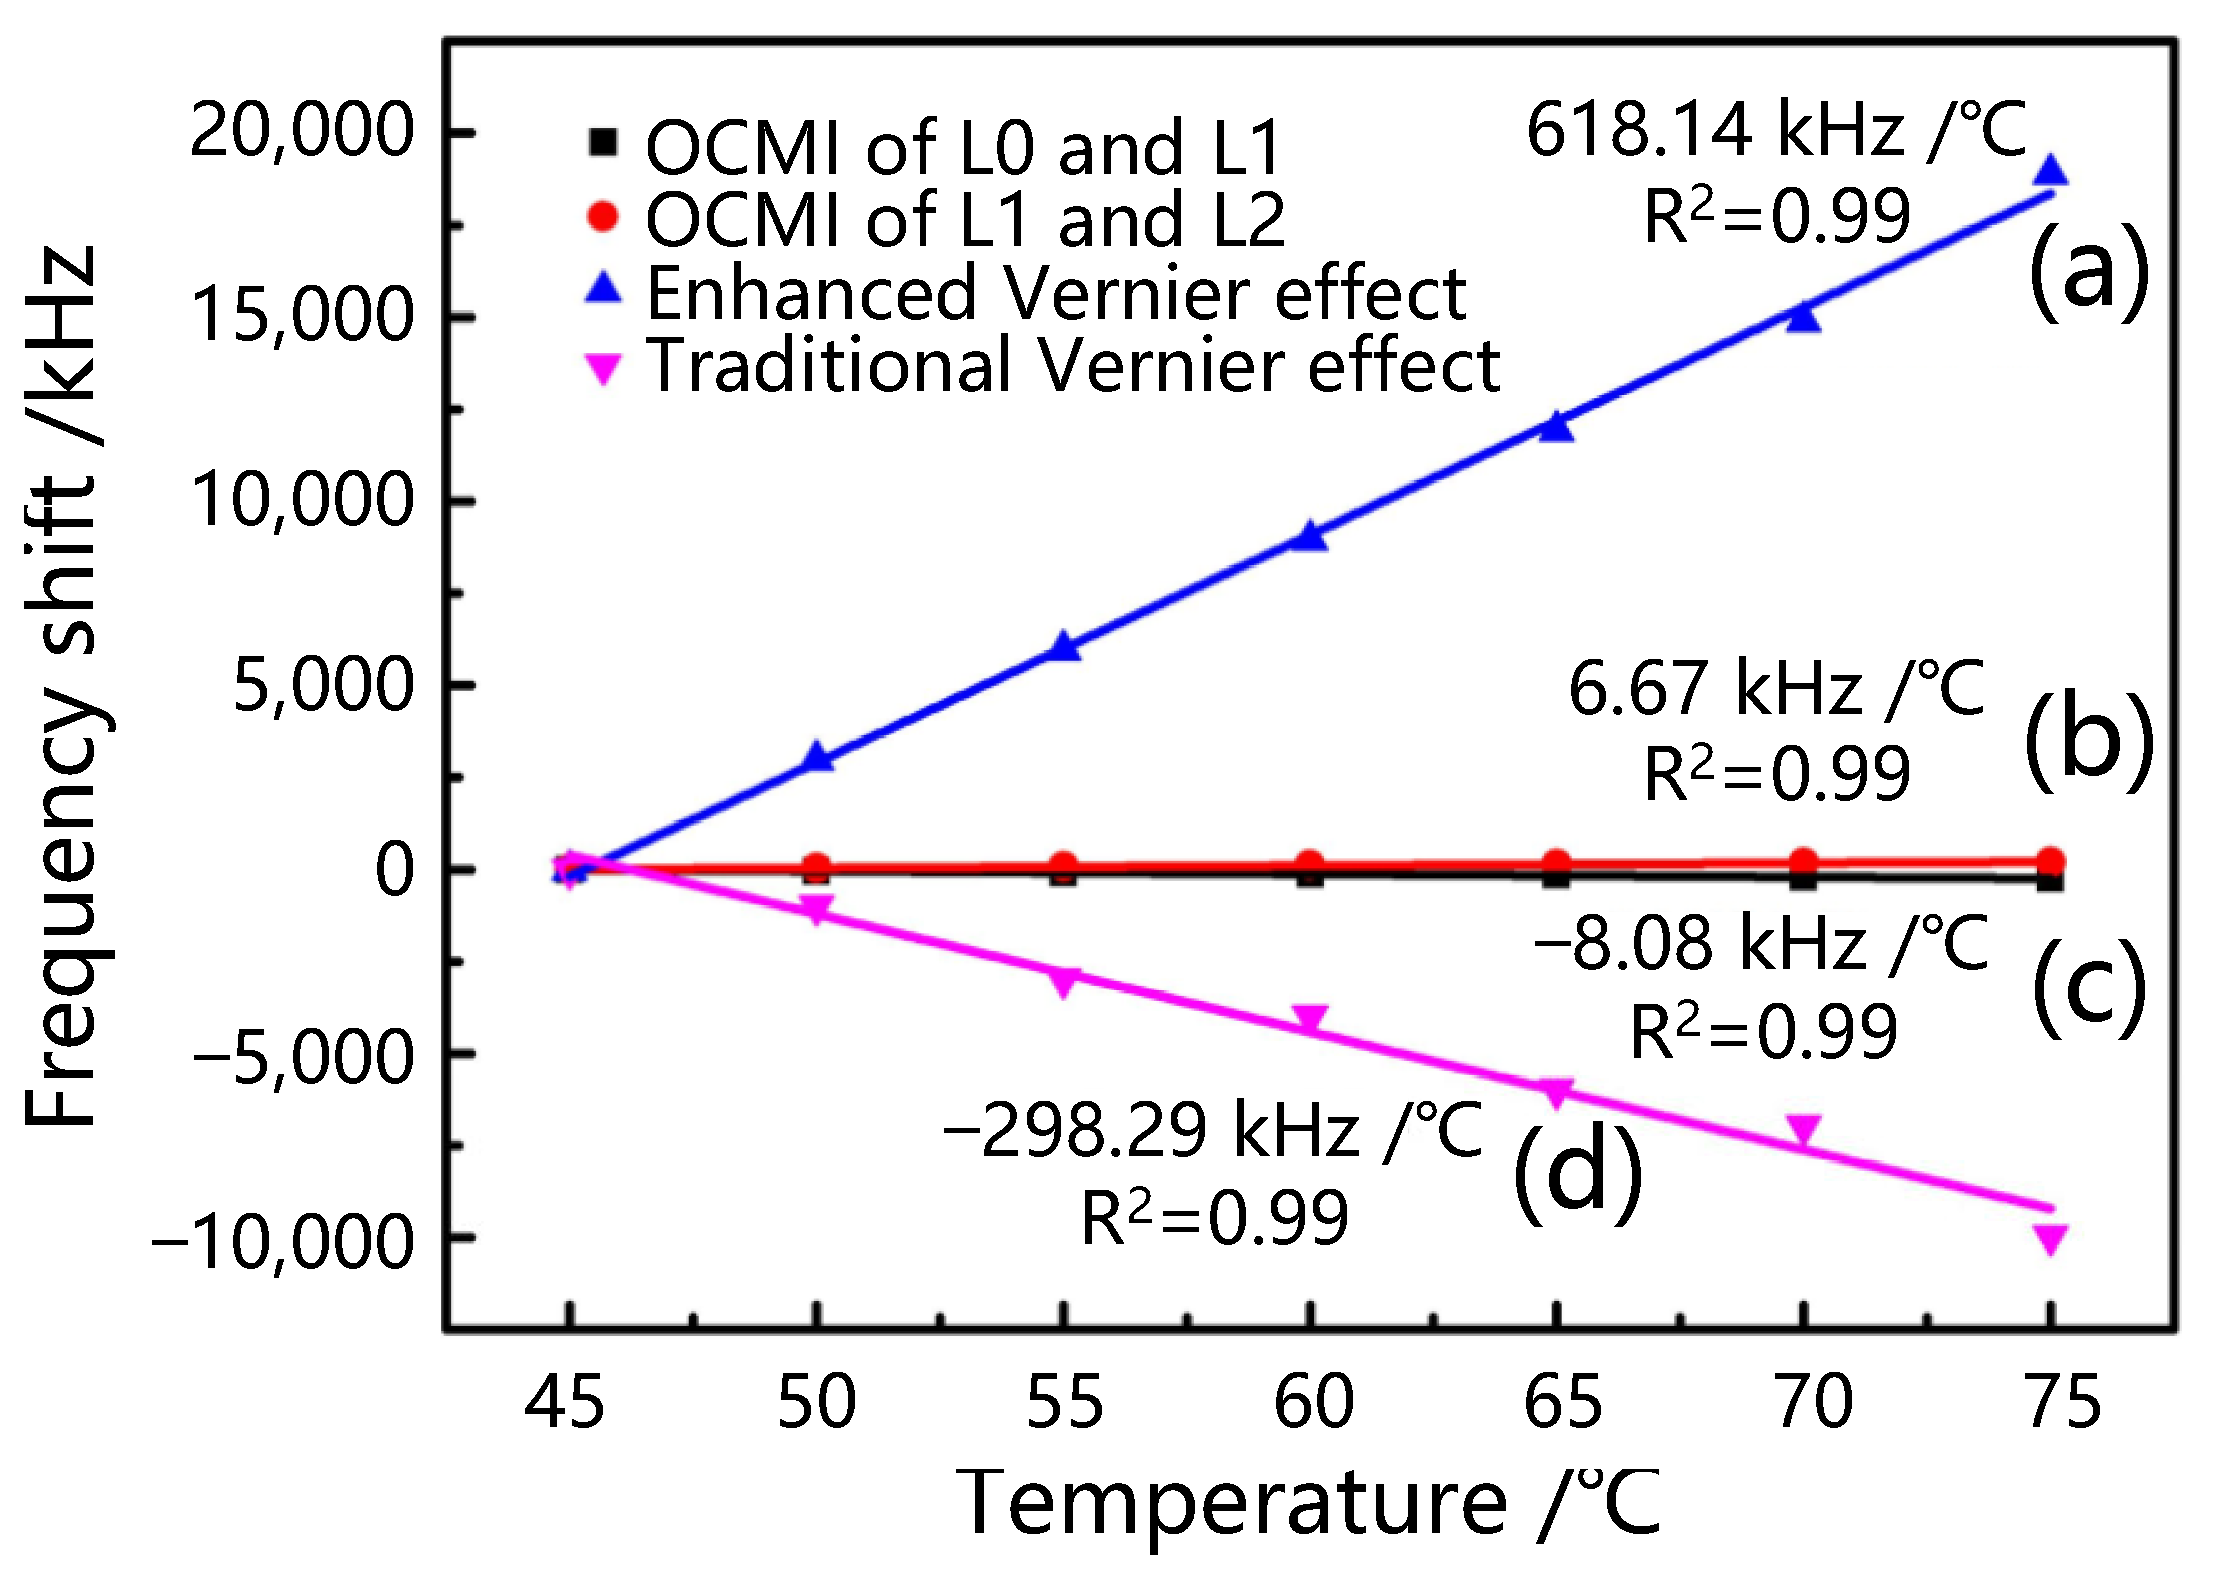
| Cascaded fiber loop | Enhanced | MPF | 618.14 | This work |
Disclaimer/Publisher’s Note: The statements, opinions and data contained in all publications are solely those of the individual author(s) and contributor(s) and not of MDPI and/or the editor(s). MDPI and/or the editor(s) disclaim responsibility for any injury to people or property resulting from any ideas, methods, instructions or products referred to in the content. |
© 2024 by the authors. Licensee MDPI, Basel, Switzerland. This article is an open access article distributed under the terms and conditions of the Creative Commons Attribution (CC BY) license (https://creativecommons.org/licenses/by/4.0/).
Share and Cite
Zhou, J.; Zhi, Y.; Zhang, J.; Yao, J.; Zhang, J.; Zhang, J. Enhanced Vernier Effect in Cascaded Fiber Loop Interferometers for Improving Temperature Sensitivity. Sensors 2025, 25, 38. https://doi.org/10.3390/s25010038
Zhou J, Zhi Y, Zhang J, Yao J, Zhang J, Zhang J. Enhanced Vernier Effect in Cascaded Fiber Loop Interferometers for Improving Temperature Sensitivity. Sensors. 2025; 25(1):38. https://doi.org/10.3390/s25010038
Chicago/Turabian StyleZhou, Jianming, Yanyan Zhi, Junyi Zhang, Jianping Yao, Junkai Zhang, and Jiejun Zhang. 2025. "Enhanced Vernier Effect in Cascaded Fiber Loop Interferometers for Improving Temperature Sensitivity" Sensors 25, no. 1: 38. https://doi.org/10.3390/s25010038
APA StyleZhou, J., Zhi, Y., Zhang, J., Yao, J., Zhang, J., & Zhang, J. (2025). Enhanced Vernier Effect in Cascaded Fiber Loop Interferometers for Improving Temperature Sensitivity. Sensors, 25(1), 38. https://doi.org/10.3390/s25010038