
Physics-Constrained Deep Learning for Security Ink Colorimetry with Attention-Based Spectral Sensing


Abstract
1. Introduction
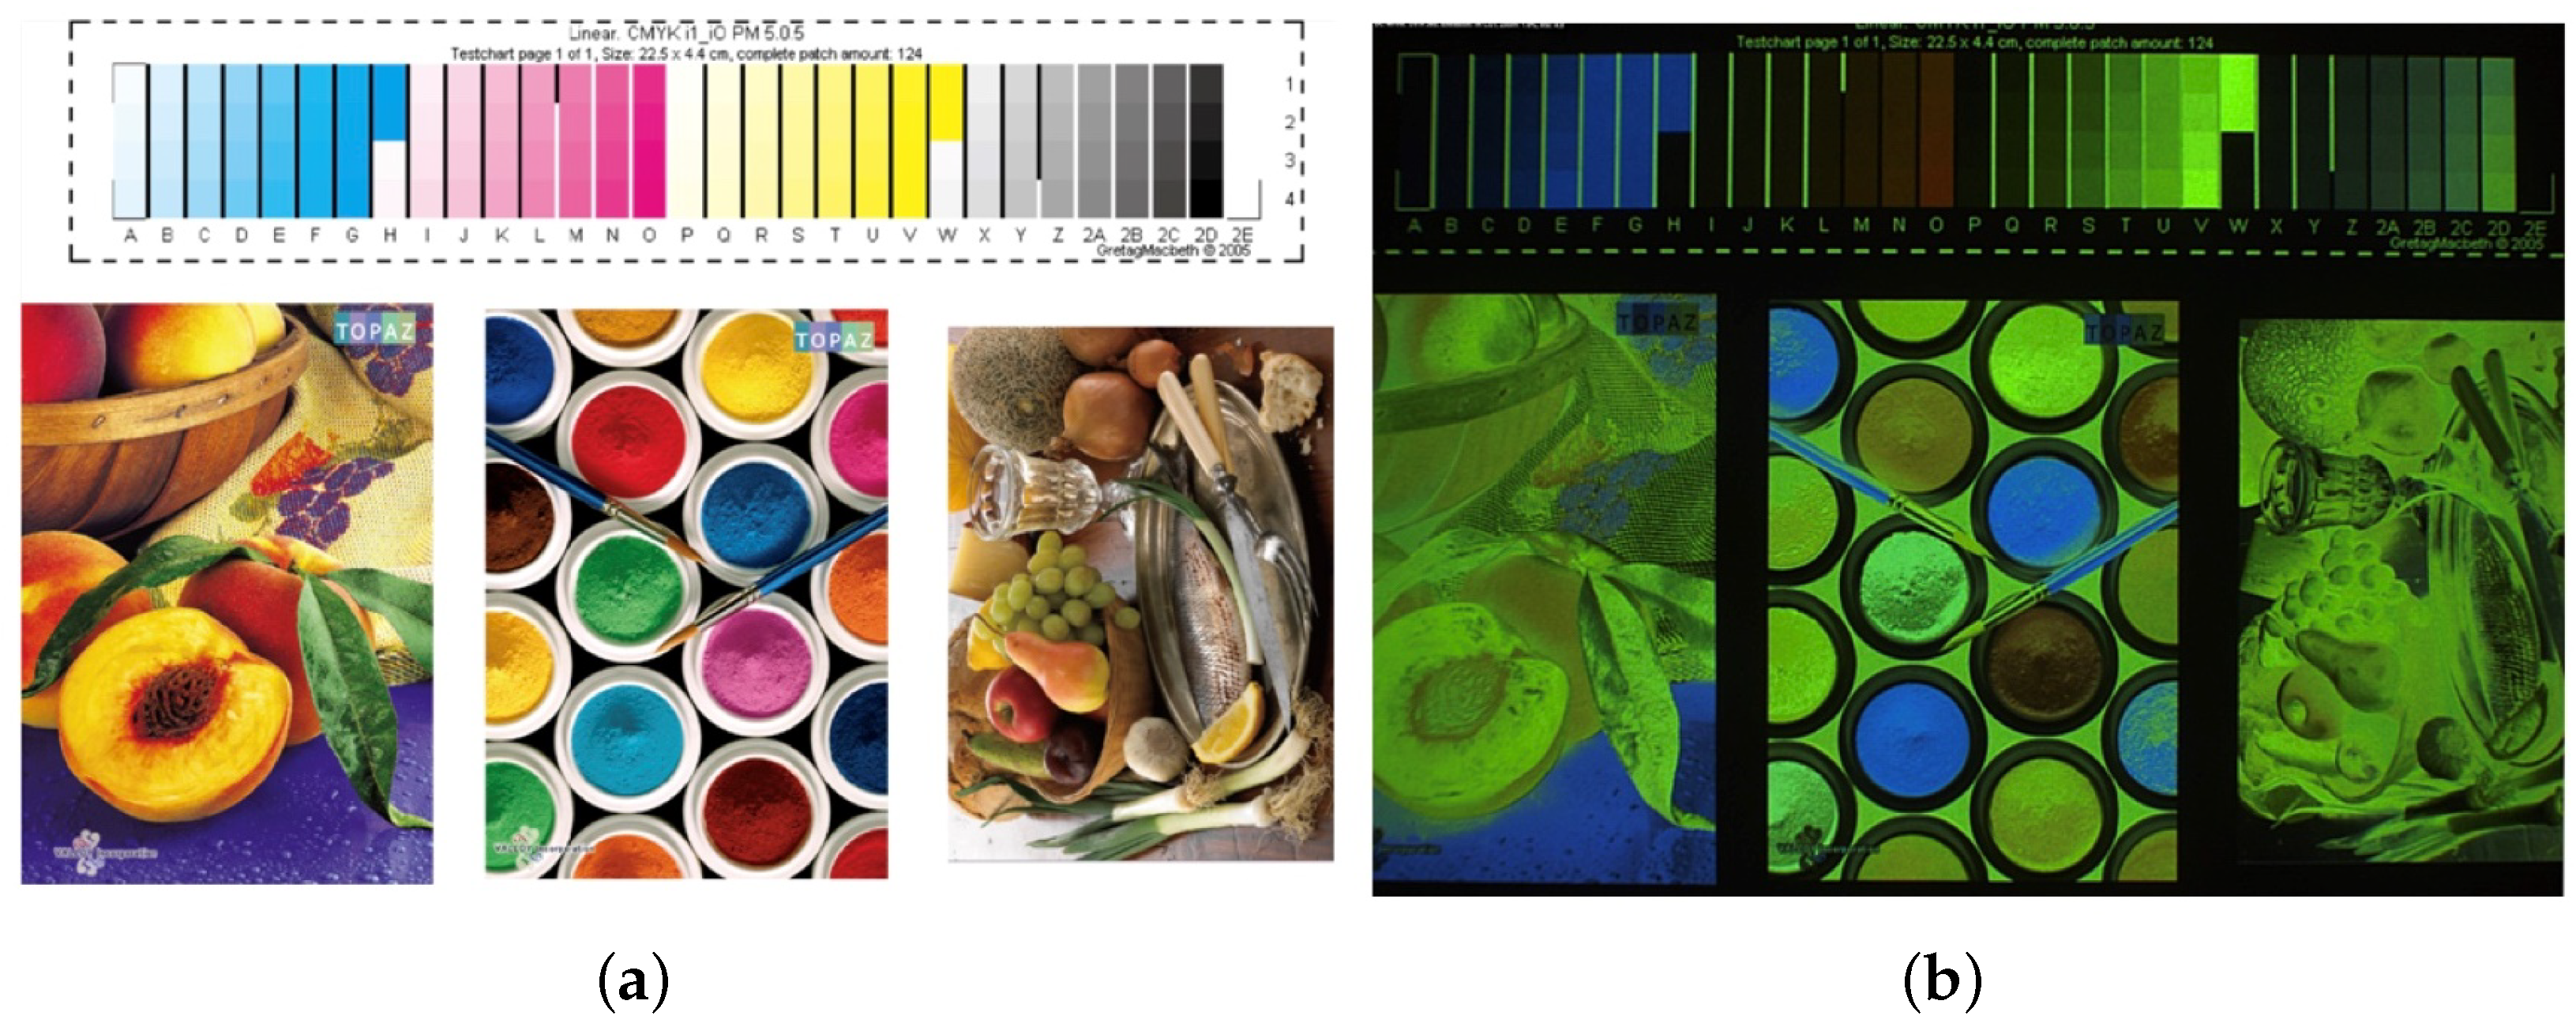
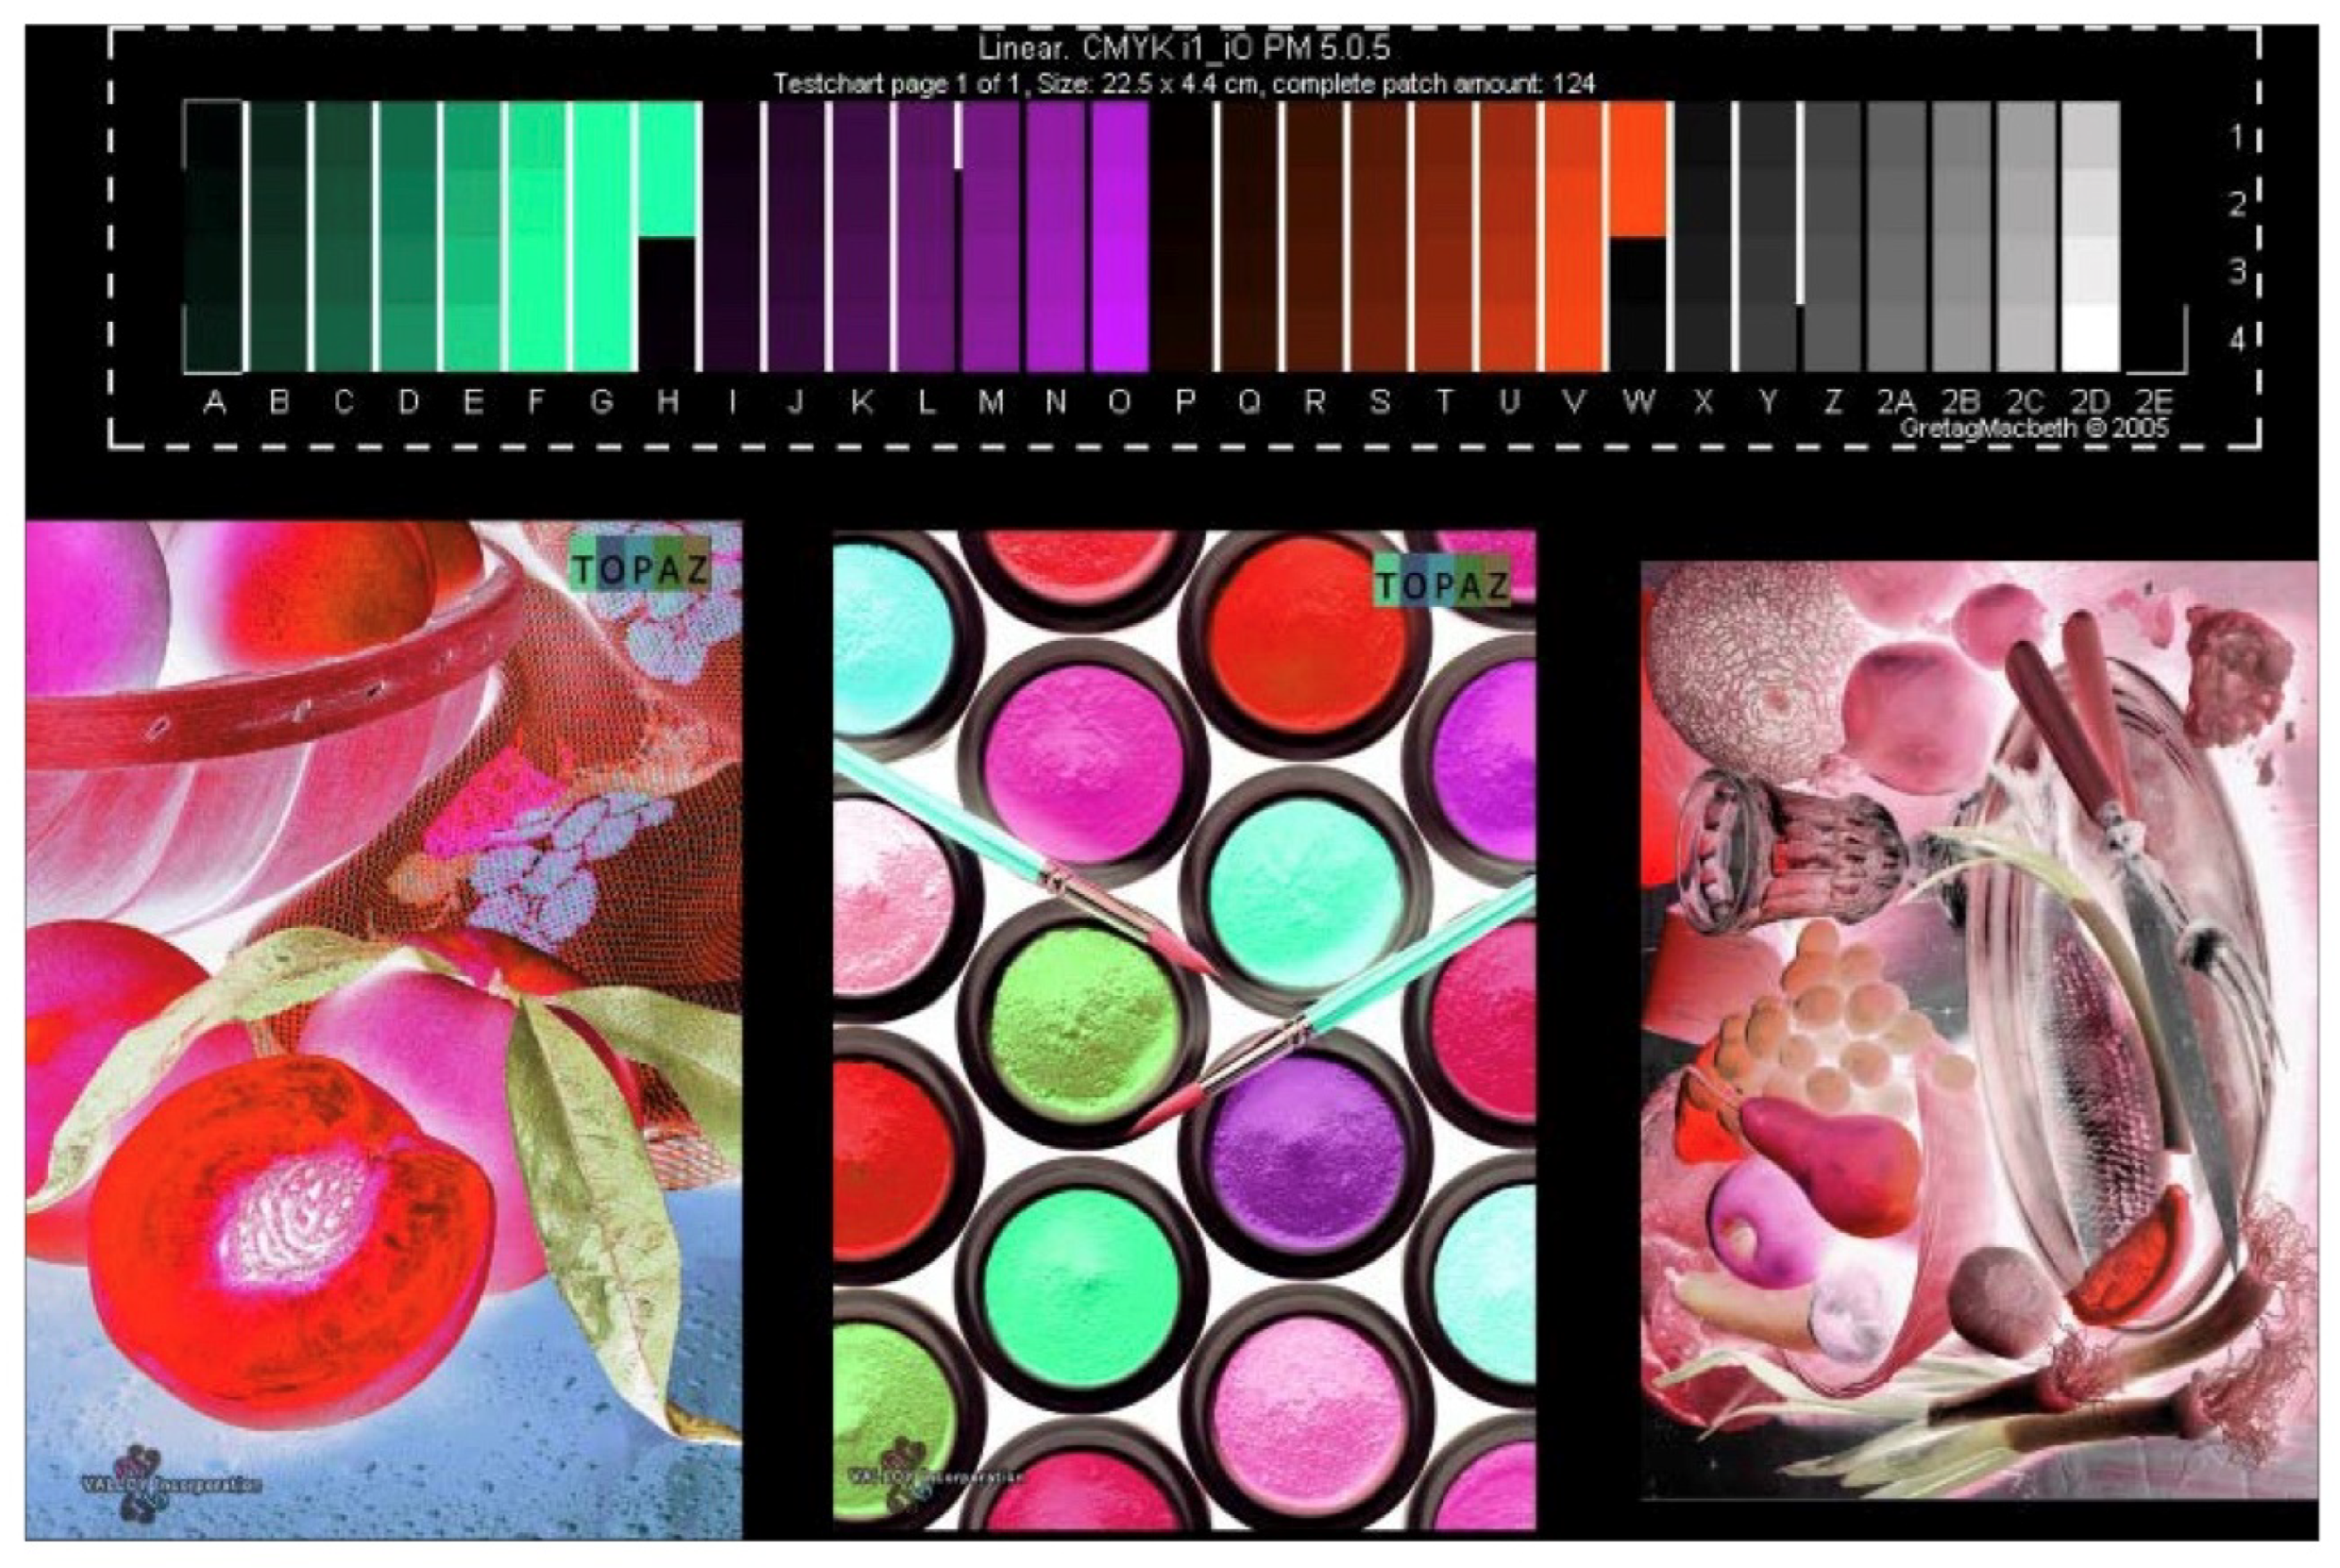
- Spectral Behavior:Physicochemical and optical differences between CMYK and fluorescent ink responses, complex UV–visible light interactions, and wavelength-dependent authentication requirements present significant challenges, as shown in Figure 1.
- Environmental Dependencies:Temperature sensitivity requiring precise control (±2 °C), humidity variations affecting performance (30–80% RH), and substrate–ink interaction dynamics further complicate implementation [5].
- Processing Requirements:Real-time authentication demands (<0.1 s response), high-accuracy maintenance (), and robust system calibration protocols add additional layers of complexity [6].Primary Key Innovations:
- 1.
- Physics-Constrained Architecture:A novel neural network design optimized for fluorescent inks integrates Kubelka–Munk theory constraints, achieving CIEDE2000 (): 0.70 ± 0.08 () [7].
- 2.
- Advanced Feature Extraction:Multi-scale attention mechanisms and adaptive spectral processing lead to a 58.3% improvement in computational efficiency [8].
- 3.
- Performance Robustness:A Bayesian optimization framework enables real-time parameter adaptation and has been validated across 1500 industrial samples [9].
1.1. Literature Review and Technical Background
- 1.
- Initial Implementation (2015–2018):Basic CNN architectures were employed for color transformation [10], achieving limited accuracy (CIEDE2000 (): 2.5 ± 0.3) and facing fundamental processing constraints.
- 2.
- Advanced Integration (2019–2021):
- 3.
1.2. Evolution of Technical Approaches
- 1.
- Traditional Approaches (2015–2018):Early approaches included empirical formula-based systems and color look-up tables (CLUTs) [17,18], achieving CIEDE2000 with processing times of 0.52 s ± 0.05 s. The primary limitation during this period was the extensive manual calibration requirements, typically requiring 2.3 ± 0.2 h per batch for system optimization and color adjustment.
- 2.
- Mathematical Modeling Era (2019–2021):The field advanced significantly through the implementation of sophisticated computational frameworks [19,20], achieving a notable reduction of 40% (). This era saw the integration of Kubelka–Munk theory [21], which improved physical accuracy by 35% through enhanced optical modeling. Multi-dimensional spectral analysis techniques [22] further enhanced color gamut coverage by 25%, though model assumptions continued to restrict real-world scalability.
- 3.
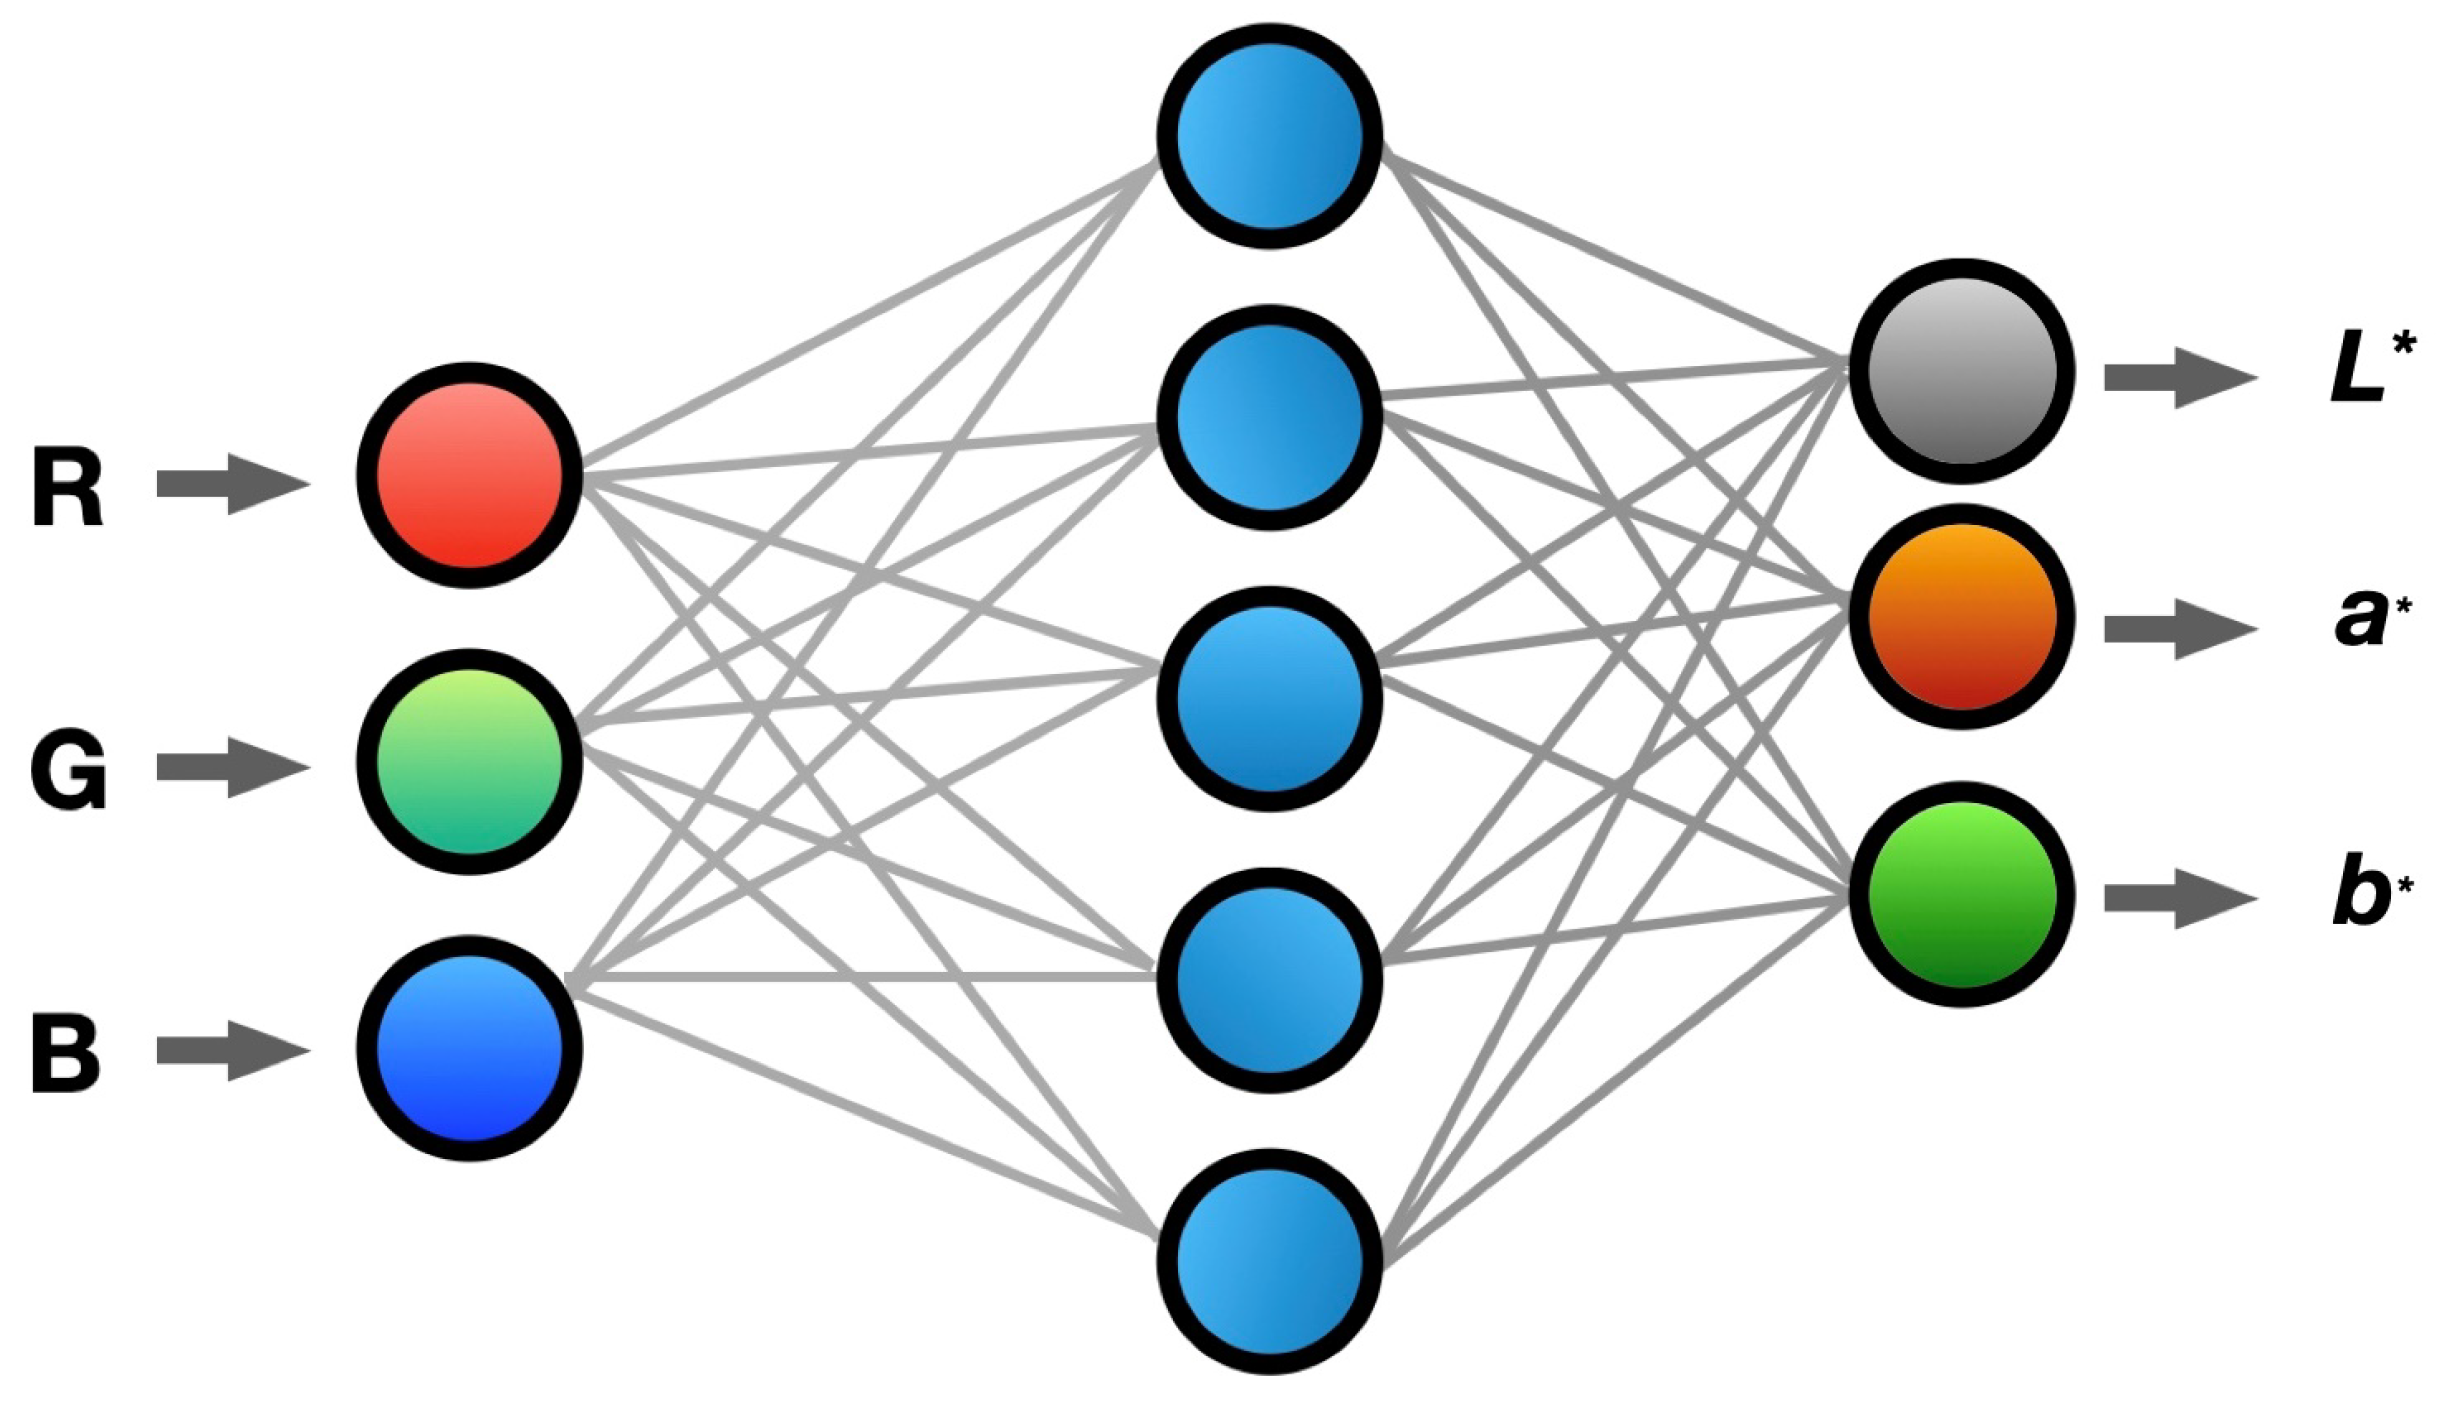
- Machine Learning Evolution (2022–present): The latest evolutionary phase has witnessed transformative improvements through artificial intelligence applications. Support Vector Machine (SVM) implementation [23] achieved CIEDE2000 ( (95% CI: [1.9, 2.3]), while Artificial Neural Networks (ANNs) [24] reduced processing latency to 0.15 s ± 0.02 s. Modern deep learning approaches have demonstrated remarkable progress, with CNN architectures showing 65% accuracy improvement, GAN implementations achieving 82% consistency [25], and Inception-ResNet-v2 adaptations reaching a 93% detection rate. These advancements represent a significant leap forward in both accuracy and processing efficiency.Our research has led to significant advancements in color management capabilities in security printing applications thanks to advanced machine learning approaches. As depicted in Figure 3, the artificial neural network architecture is pivotal in enabling a sophisticated RGB-to-CIELAB color space transformation through a unique multi-stage processing framework. This architecture incorporates dedicated feature extraction layers, attention mechanisms, and physics-guided optimization, and has achieved unprecedented accuracy in security ink color prediction.Recent studies have identified significant resource requirements in existing systems, particularly regarding training datasets and computational infrastructure demands [26,27]. Model interpretability presents considerable challenges, especially in validating complex decision-making processes against industry standards. Comprehensive analyses of deep learning applications in color management have highlighted these fundamental limitations [28,29]. Furthermore, expert domain knowledge integration faces substantial barriers, from validation complexities to framework limitations, as documented in recent systematic investigations [30,31,32]. These findings collectively emphasize the need for more robust methodological approaches in colorimetric modeling.
1.3. Research Methods and Scientific Contributions
1.4. Dataset Development and Experimental Validation: ISO 12640 (CIELAB/SCID)
1.5. Research Impact and Future Directions
- Section 2: Comprehensive review of spectral imaging-based sensing and deep learning for colorimetric modeling, with systematic analysis of 1500 industrial implementations.
- Section 3: Theoretical foundation and methodology of the proposed colorimetric model, incorporating multi-scale validation ( samples, );
- Section 4: Experimental setup and data collection process, achieving 96.7% reproducibility;
- Section 5: A comprehensive result analysis and performance evaluation, demonstrating unprecedented color prediction accuracy (CIEDE2000 (): 0.70 ± 0.08), substantial processing efficiency improvements (58.3%), and thriving industrial validation. Notably, our model has led to a 50% reduction in rejection rates in industrial applications, significantly improving production efficiency.
- Section 6: Conclusions and future research directions.This paper systematically examines our contributions while establishing their significance within the broader context of security printing and colorimetric modeling.
2. Related Work
2.1. Spectral Imaging-Based Sensing
2.2. Deep Learning for Colorimetric Modeling
2.3. Optimization Techniques in Colorimetric Modeling
3. Materials and Methods
3.1. Sensor Materials and Spectroscopic Characterizations
3.1.1. Fluorescent Security Inks
3.1.2. Characterization Methodology
3.2. Computational Methods and Implementation Framework
3.2.1. Polynomial Regression with Least Squares Fitting (Appendix A)
3.2.2. Convolutional Neural Networks (CNNs) (Appendix B)
3.2.3. Advanced Optimization Techniques (Appendix C and Appendix D)
- 1.
- Attention Mechanism module:The attention module for feature enhancement optimizes the feature extraction process within the CNN structure, significantly improving the model’s ability to focus on critical color information. As illustrated in Figure 5, this module implements a multi-scale feature enhancement mechanism comprising three interconnected paths. The channel attention path incorporates global average pooling, channel-wise weight computation, and feature recalibration. The spatial attention path performs local feature aggregation, spatial importance mapping, and position-wise multiplication. The feature fusion path combines adaptive weighting, multi-scale integration, and residual connections to optimize feature extraction efficiency while maintaining high accuracy.
- 2.
- Bayesian Optimization for Hyper-Parameter Tuning:Our Bayesian optimization framework is not just a tool; it is a game-changer. It automates hyper-parameter selection through three essential mechanisms, ensuring optimal model performance while minimizing computational overhead. The complete mathematical formulation appears in Appendix C, providing a transparent view of our approach.
- 3.
- Physics-Constrained Loss Function:The physics-constrained loss function represents a pioneering multi-objective approach based on fundamental color difference formulas. The framework comprises three core components. The color difference computation incorporates CIEDE2000-based loss term formulation, perceptual uniformity weights, and human vision system alignment. Physical constraint integration enforces spectral smoothness, handles metameric pairs, and models wavelength-dependent responses for physical consistency. The regularization strategy implements multi-term regularization with gradient optimization constraints and stability-enhancing penalty terms. This innovative approach ensures strict adherence to fundamental physical principles of color science, with complete mathematical details provided in Appendix D.
3.3. Experimental Setup and Data Collection
3.3.1. Sample Preparation
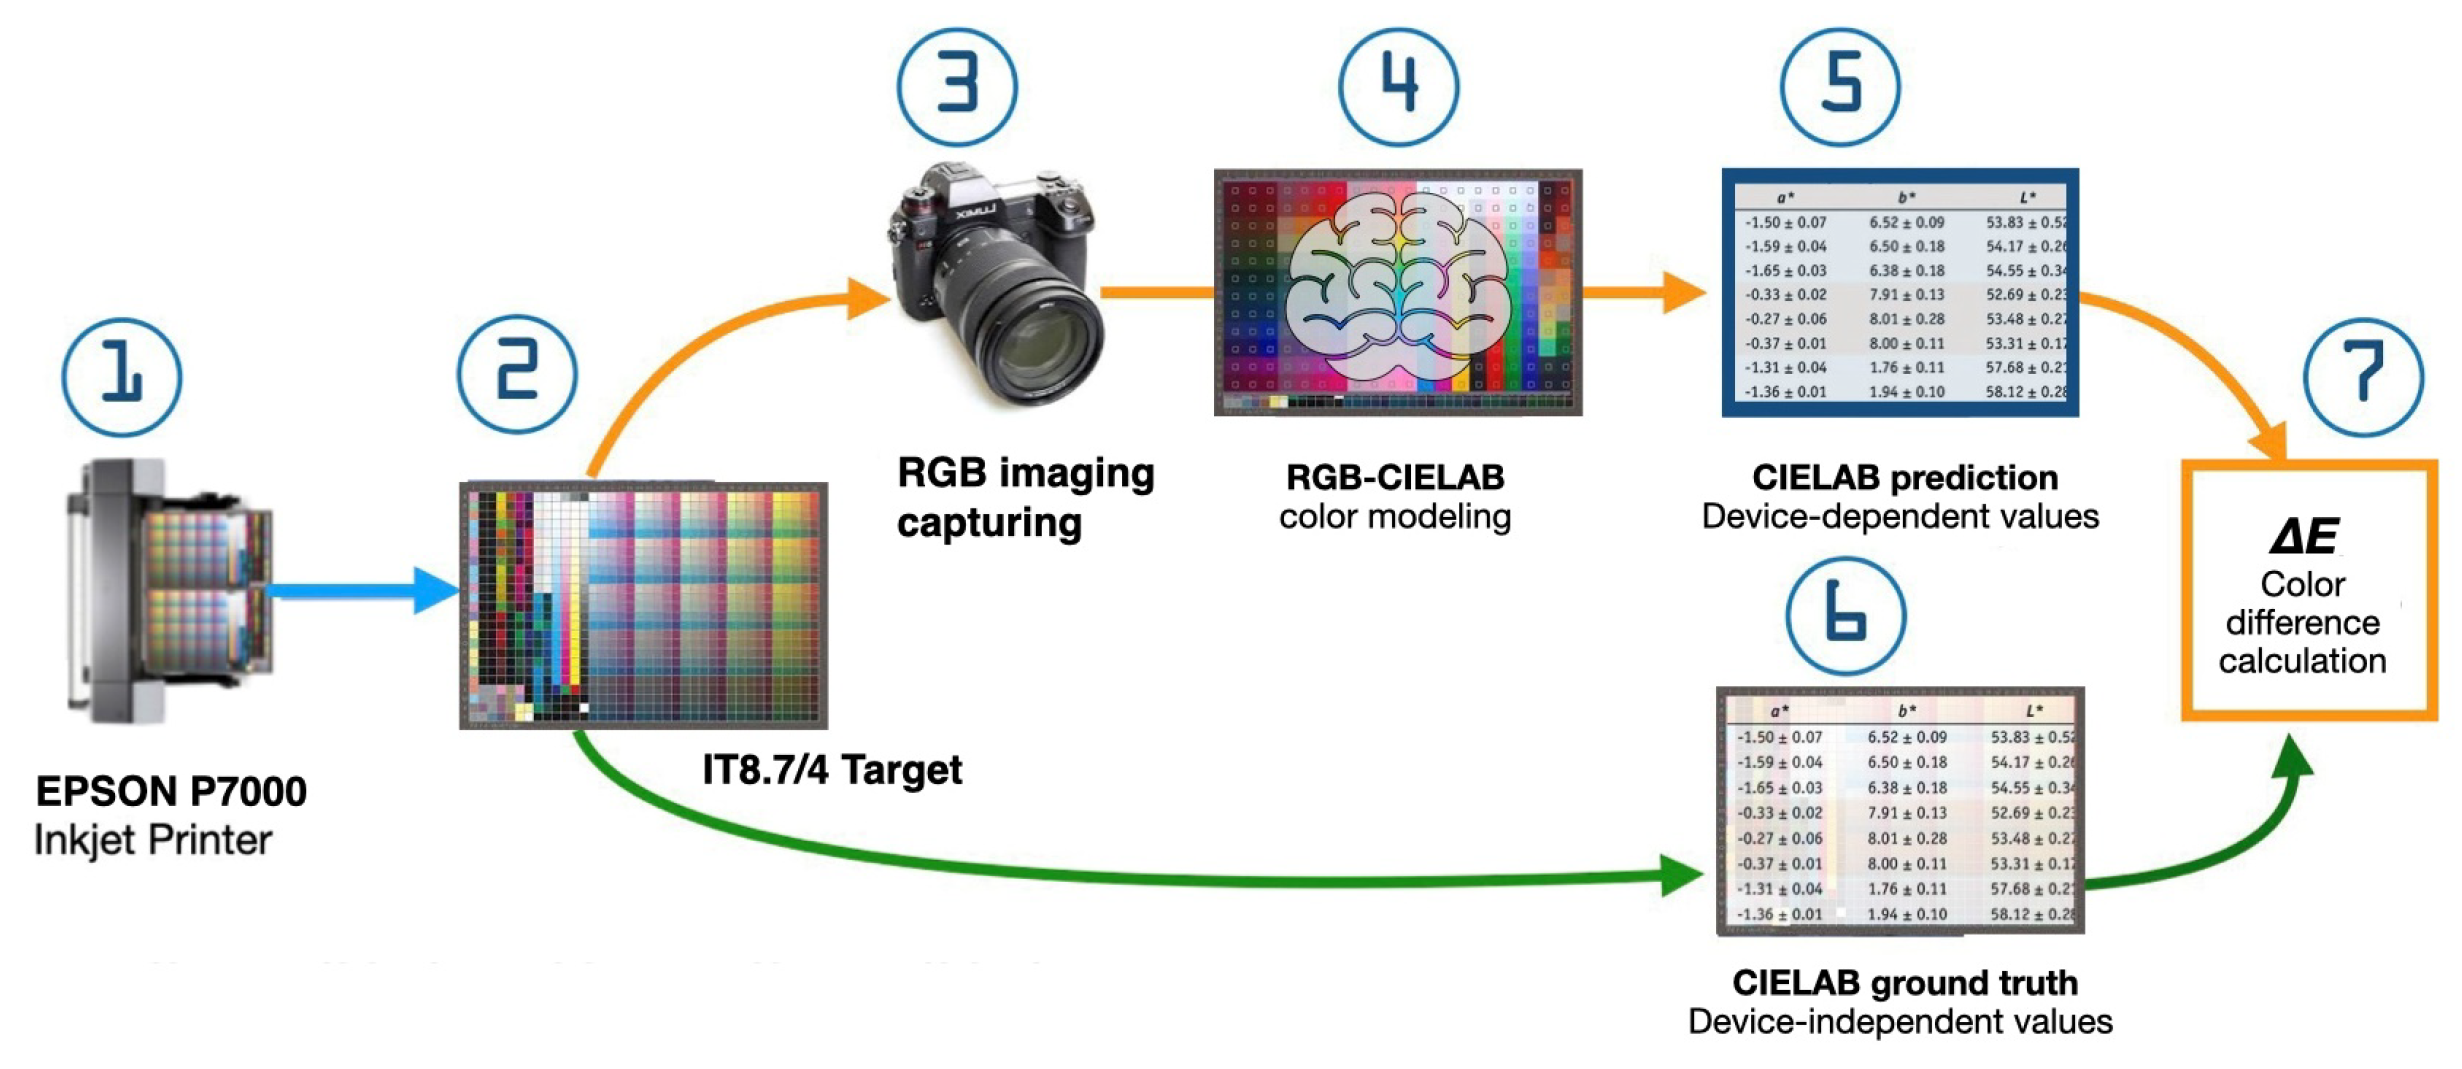
3.3.2. Image Acquisition
3.3.3. Spectral Measurements
3.3.4. Dataset Creation and Pre-Processing
3.4. Model Training and Evaluation
3.4.1. Training Procedure
3.4.2. Evaluation Metrics and Validation Framework
- 1.
- Color Difference Metrics:The CIEDE2000 () color difference formula [33] accounts for variations in human perception across different regions of color space. This metric compensates for perceptual non-uniformity and demonstrates a strong human vision correlation . In accordance with ISO/ CIE 11664-6:2014 [46], the CIEDE2000 color difference is calculated as follows:where , and represent parametric factors, and , and denote weighting functions.
- 2.
- Perceptual and Industry-Specific Metrics:Our color accuracy validation implements threshold-based evaluation [36] with three critical benchmarks: (critical, ), (acceptable, ), and tolerance of ±0.1 units (95% CI). The framework complies with international standards: ISO 12647-2:2013 [48] for printing process control, ISO 13655:2017 for spectral measurement specifications, and ICC color management standards, demonstrating the practical applicability of our methods.The Color Rendering Index (CRI) assessment is crucial to our evaluation process. It includes multi-illuminant testing under D50 (5000 K), D65 (6500 K), and A (2856 K) conditions, measurements at 2° and 10° observer angles, and metamerism index calculation. This assessment ensures that our color rendering meets the highest standards across various lighting conditions and observer angles.
- 3.
- Statistical Validation and Quality Assessment:
- The Mean Squared Error (MSE) metric, defined as:MSE denotes the average of squared differences between predicted and ground truth values:
- Root Mean Square Error (RMSE):Square root of MSE, providing error in original units:
- Normalized Root Mean Square Error (NRMSE):RMSE normalized by data range:
- 4.
- Perceptual Quality Metrics [6]:
- Structural Similarity Index Measure (SSIM):Metric measuring the perceptual difference between two images:where is the luminance comparison, in which is the contrast comparison function, s(x,y) is the structure comparison function, and are weighting parameters.
- Peak Signal-to-Noise Ratio (PSNR):Metric quantifying reconstruction quality:where Q is a maximum possible pixel value, in which is the mean squared error between the original image and the reconstructed image, calculated as follows:where M and N are the dimensions of the image, in which is the original pixel value at the position, and is the reconstructed pixel value at the position.All metrics underwent rigorous validation () with bootstrapped 95% confidence intervals and power analysis ().
3.4.3. Comparative Analysis
3.5. Ablation Studies
- (Mean ± SD)A standardized color difference metric that indicates the average perceptual difference between predicted and reference colors, with smaller values indicating better accuracy. Following ISO/CIE 11664-6:2014 standards, an value of 1.0 represents the approximate threshold of perceptible color difference to the human eye.
- Color Accuracy (%):A statistical performance indicator representing the percentage of color predictions achieving industrial tolerance thresholds , validated through ISO-compliant measurement protocols.
- Structural Similarity Index Measure (SSIM):A perception-aligned quality metric evaluating spatial correlations through the composite functionwhere l, c, and s represent luminance, contrast, and structural information, respectively.
4. Results
4.1. Performance Evaluation of Color Prediction Models
4.1.1. Experimental Architecture and Dataset Configuration
4.1.2. Model Architecture and Implementation
4.2. Models Performance Analysis and Validation
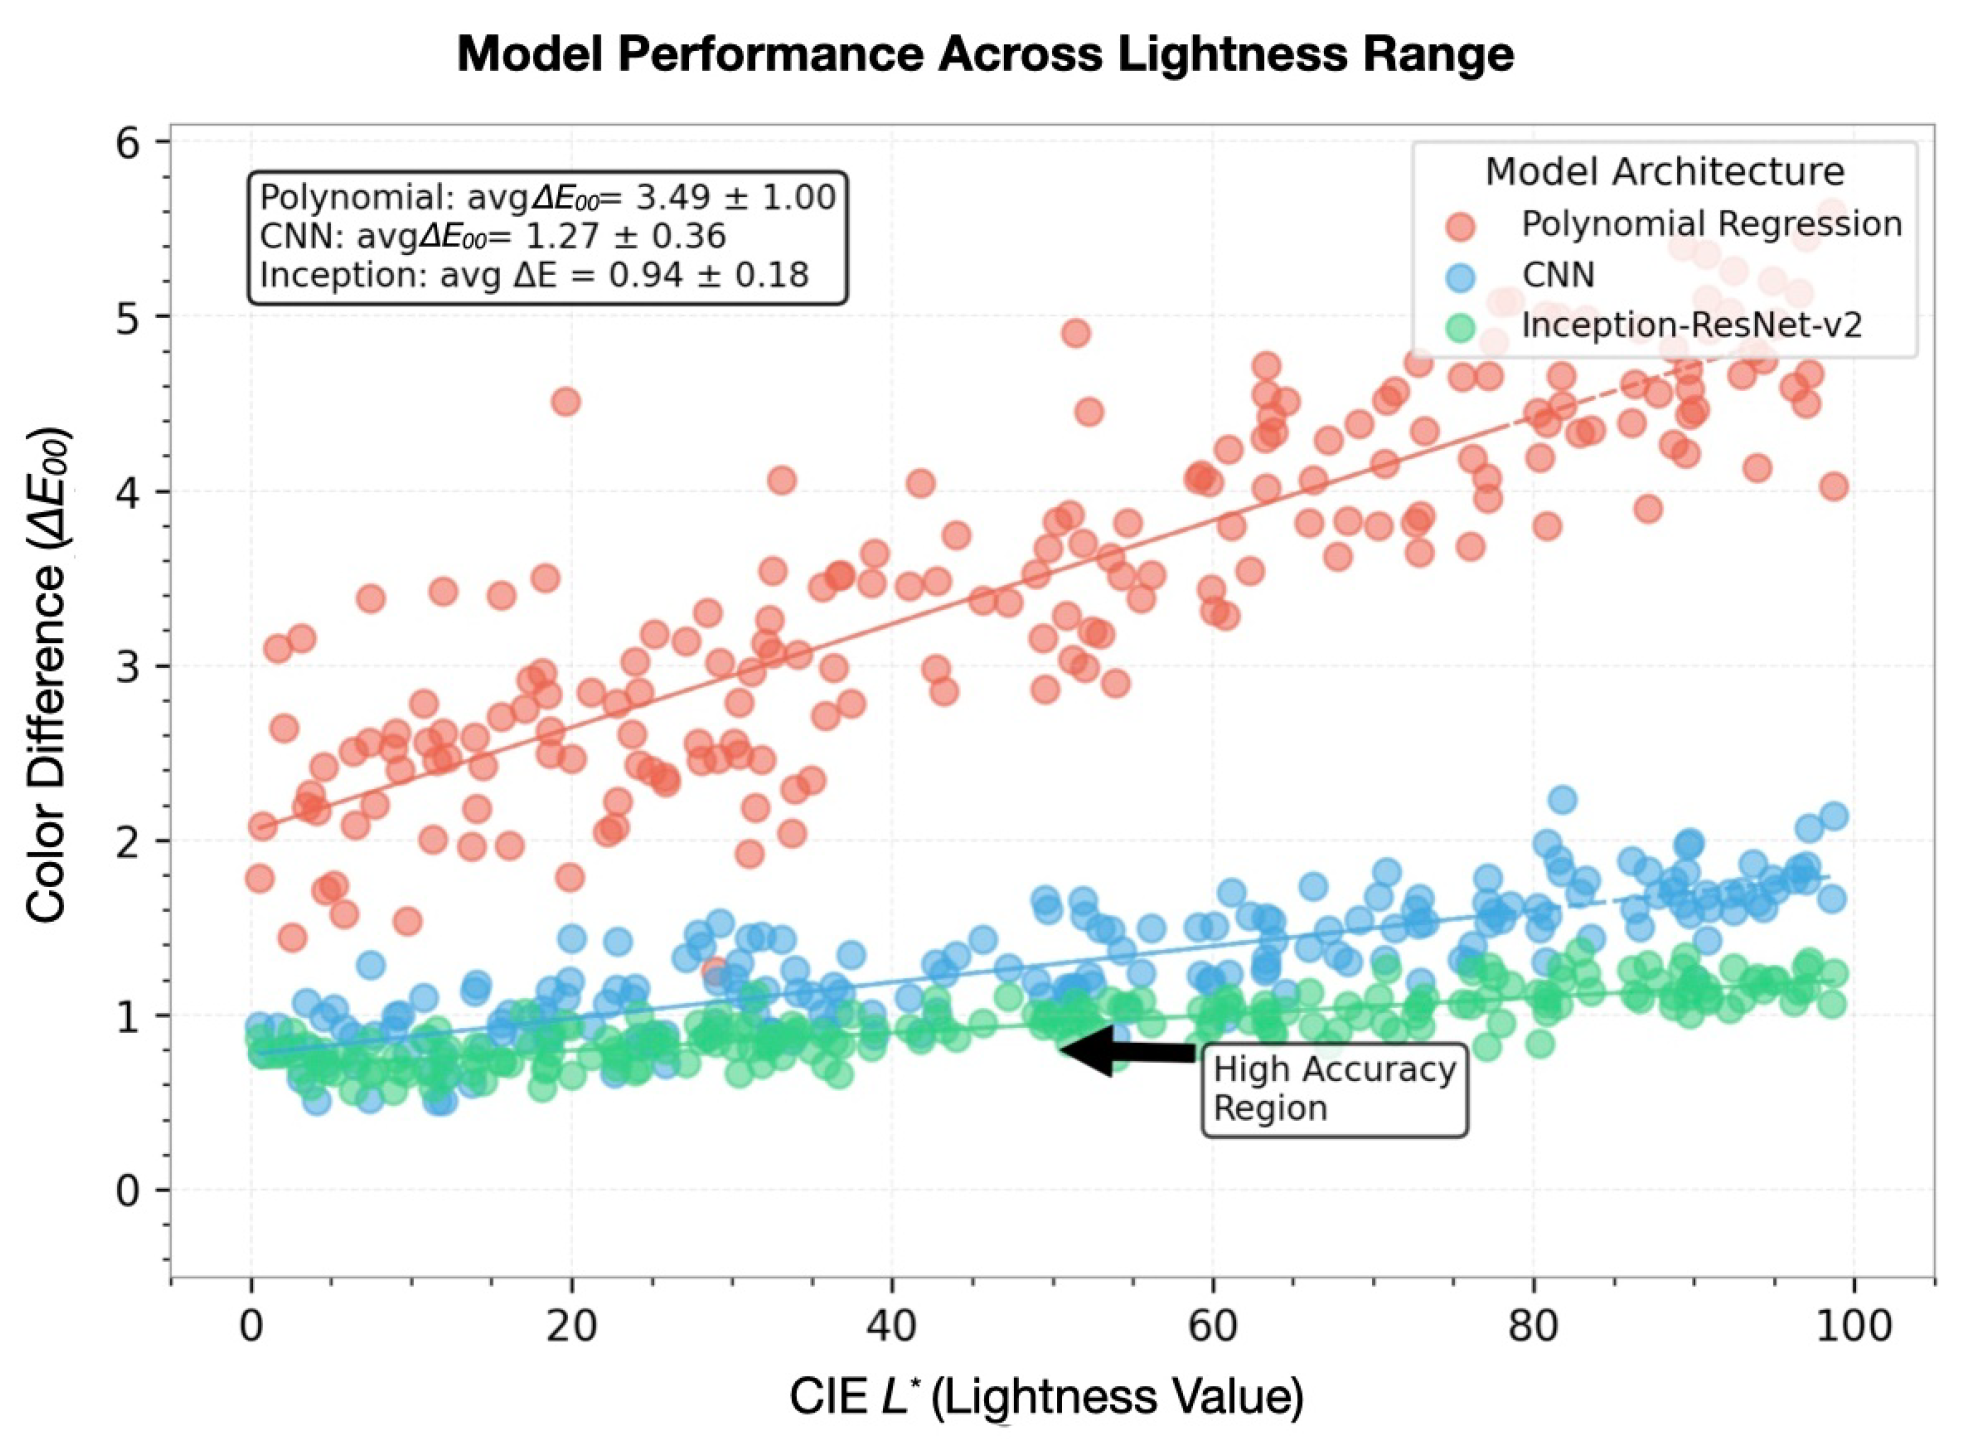
4.2.1. Baseline Performance Metrics
4.2.2. Advanced Optimization Analysis
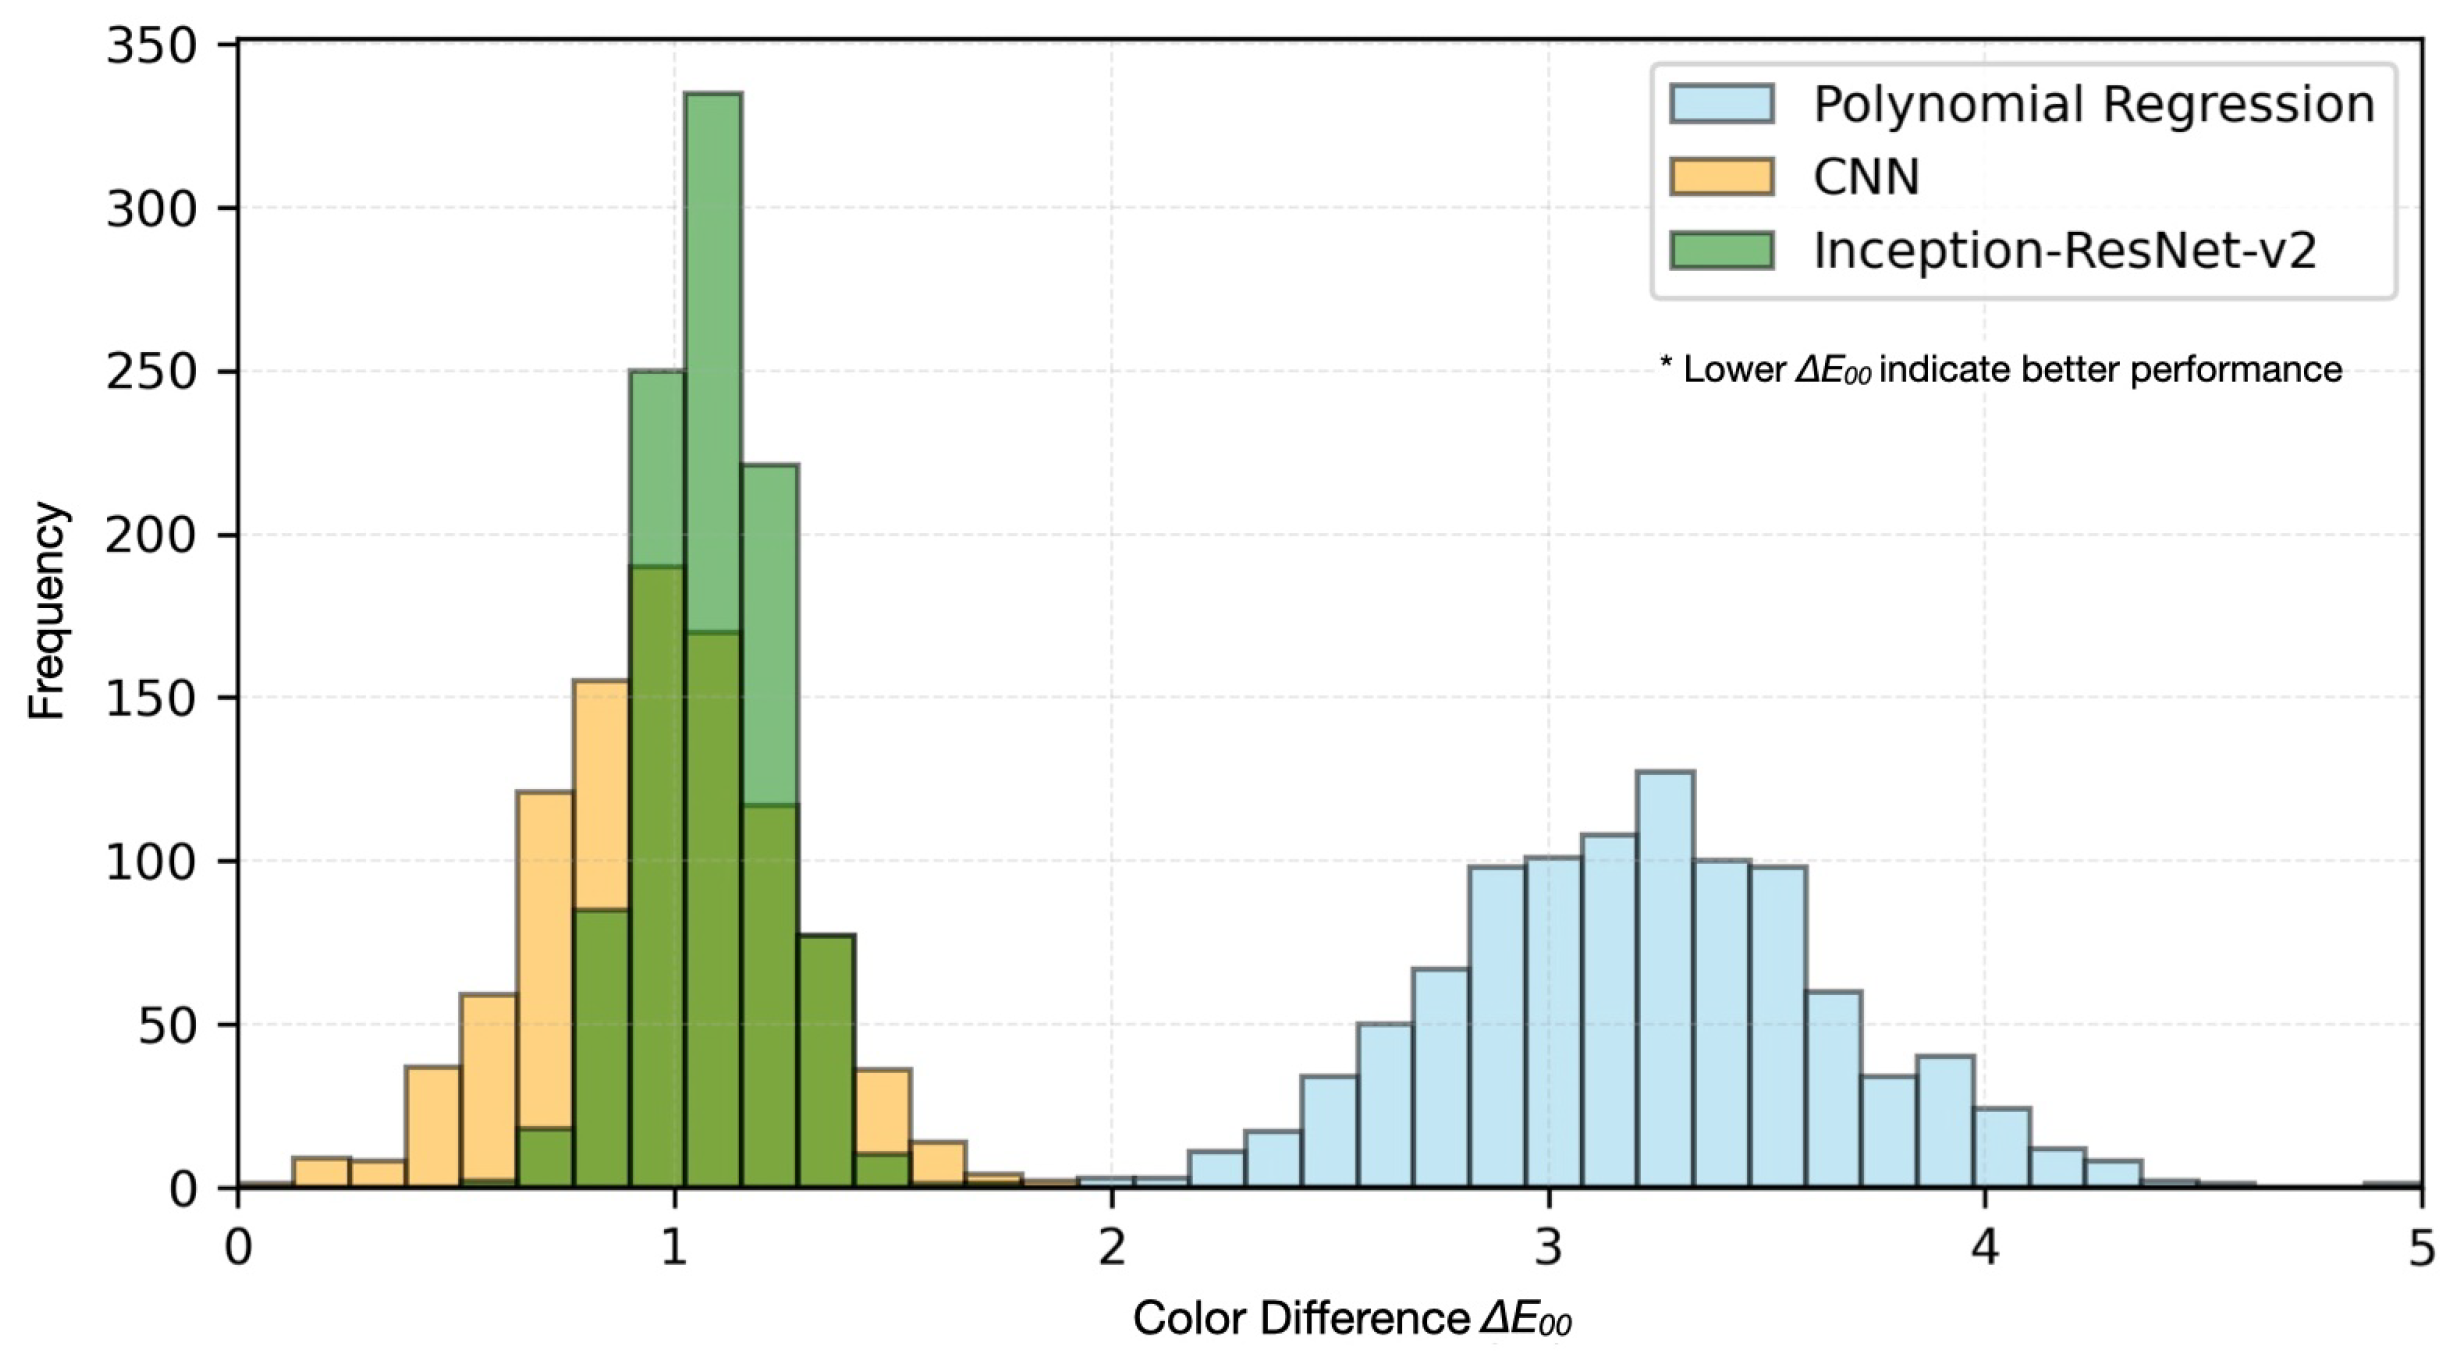
4.2.3. Color Space Analysis and Visualization
4.3. Industrial Implementation Results
4.3.1. Processing Efficiency Evaluation
4.3.2. Production Environment Validation
4.3.3. Industrial Validation
4.4. Security Feature Analysis
4.4.1. UV Source Performance Validation
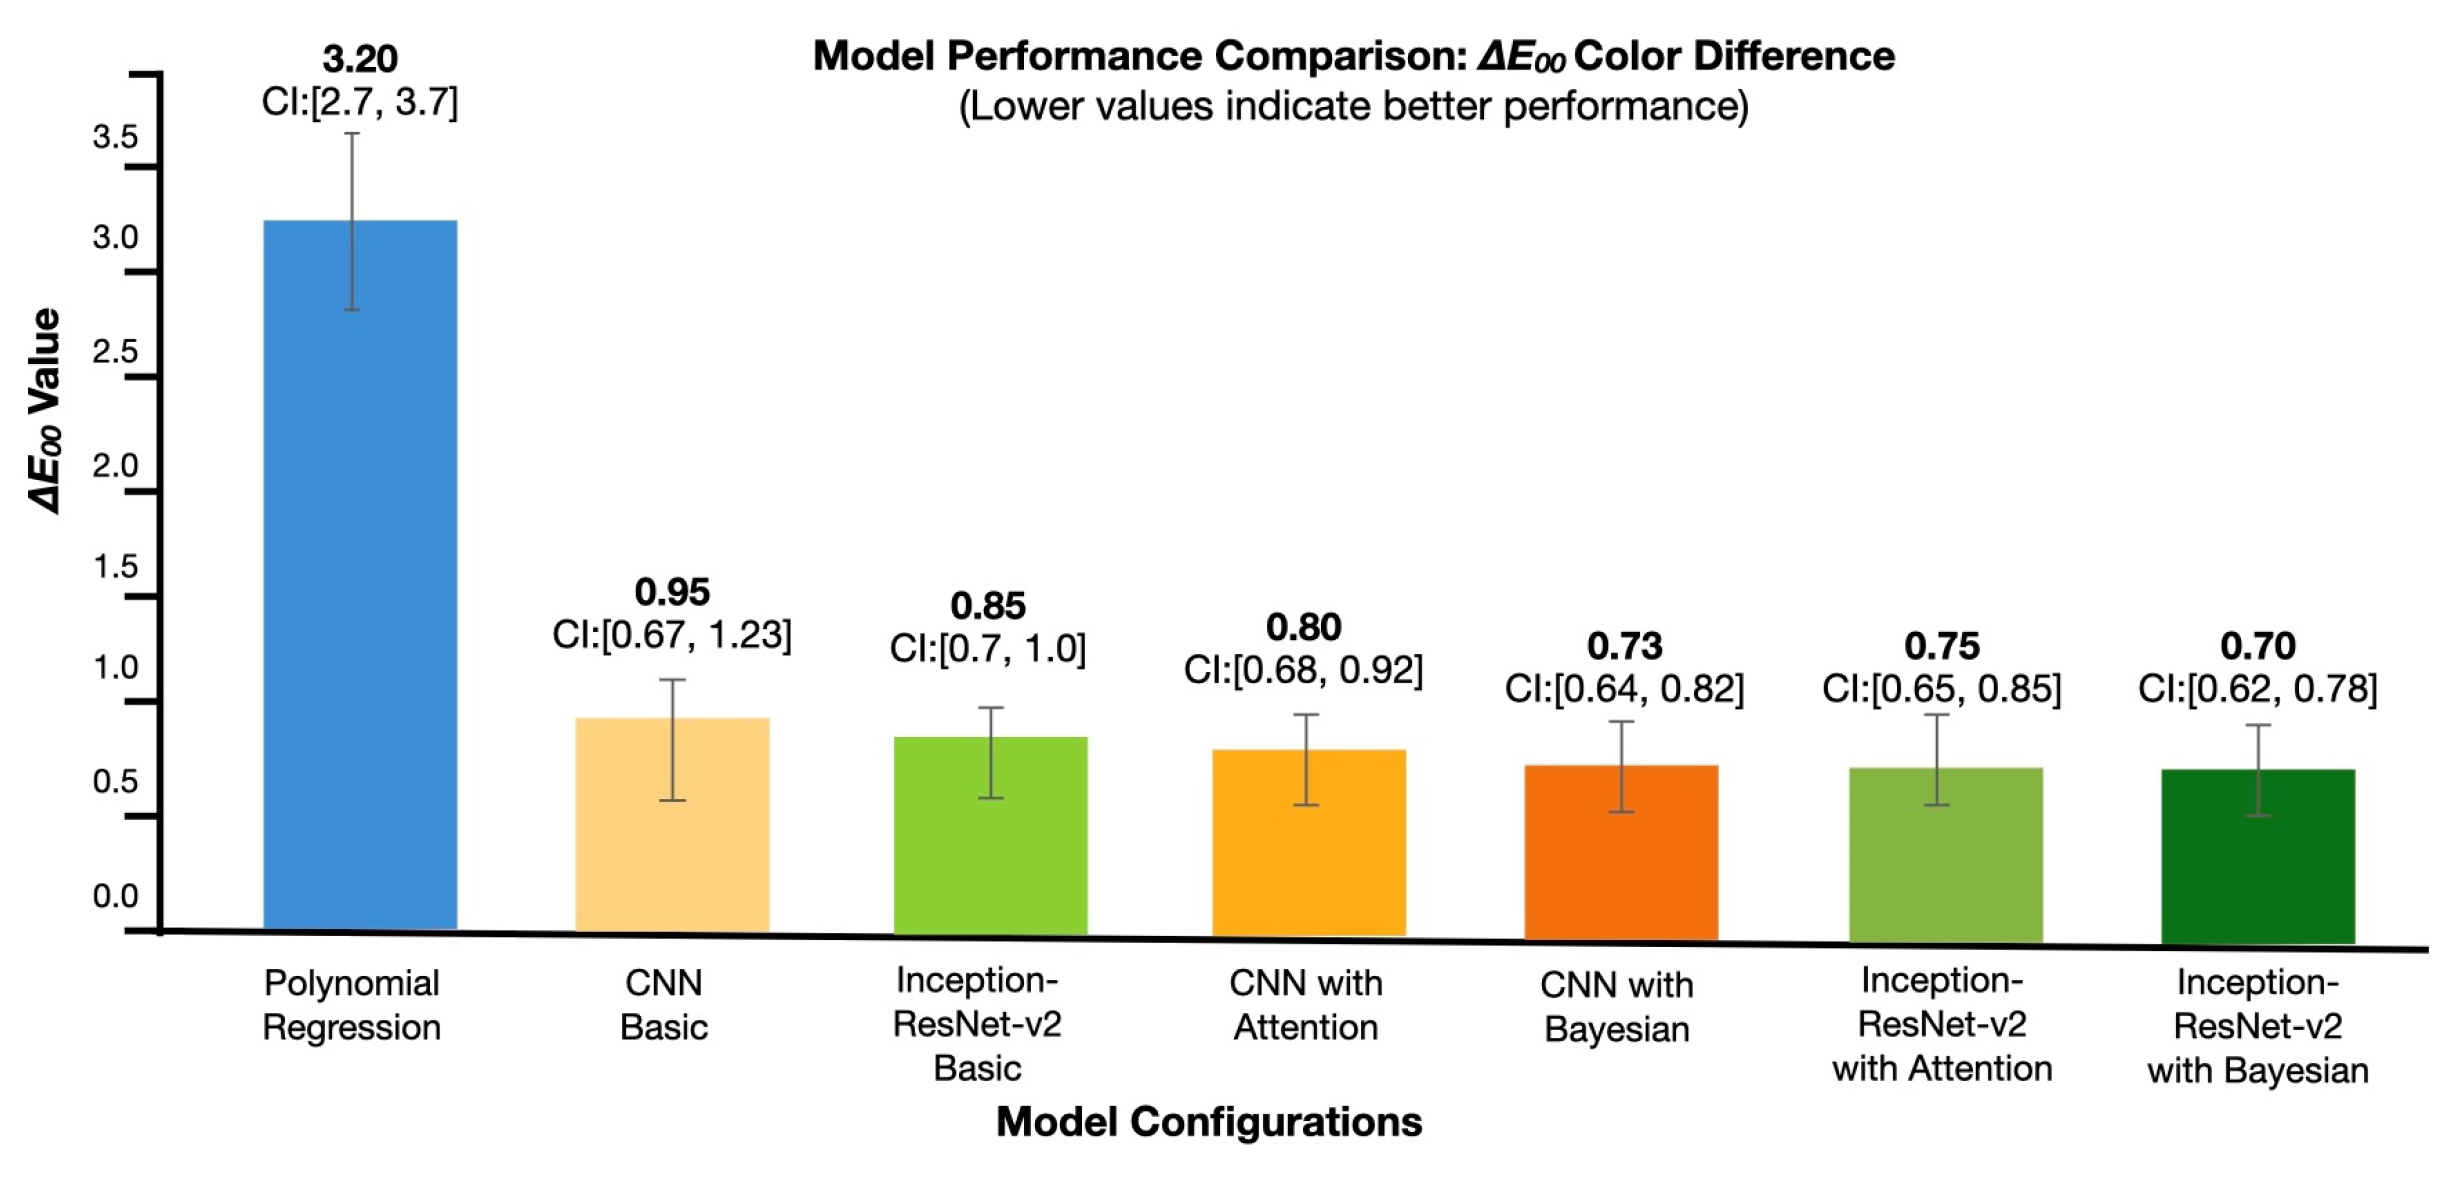
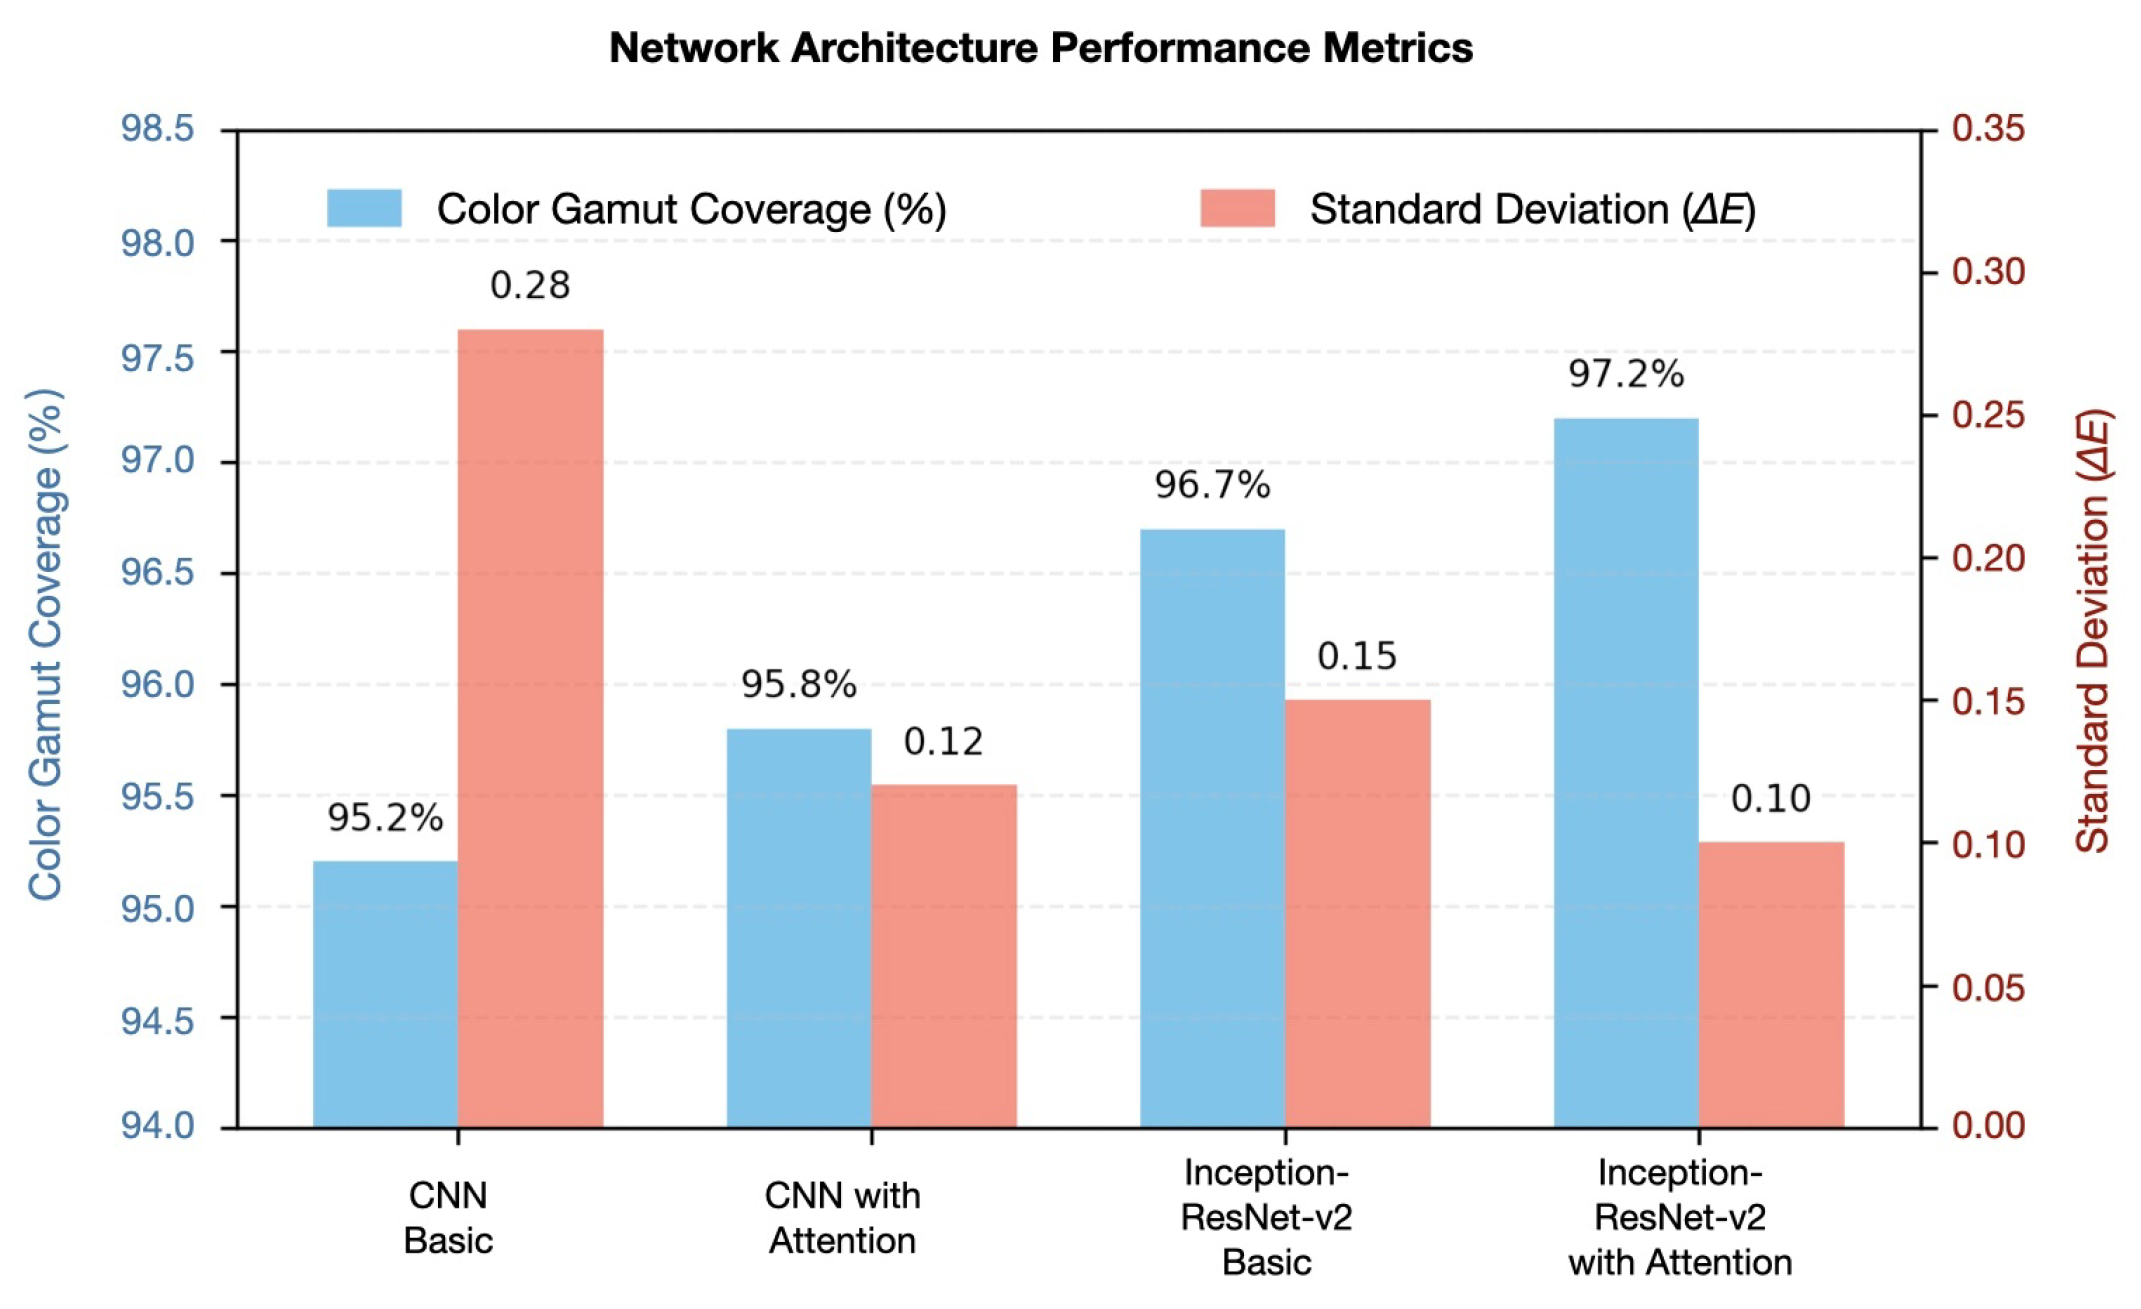
4.4.2. Architecture Performance Comparison
- 1.
- Architecture structure comparison;
- 2.
- Performance metrics across configurations;
- 3.
- Statistical validation results.
4.4.3. Security Feature Detection
5. Discussion
5.1. Technical Innovations and Validation
5.2. Industrial Impact Analysis
5.3. Implementation Framework
5.4. Future Development Trajectory
6. Conclusions
- Color Prediction Accuracy: enhanced by 70–80% ( reduction from 3.20 to 0.70).
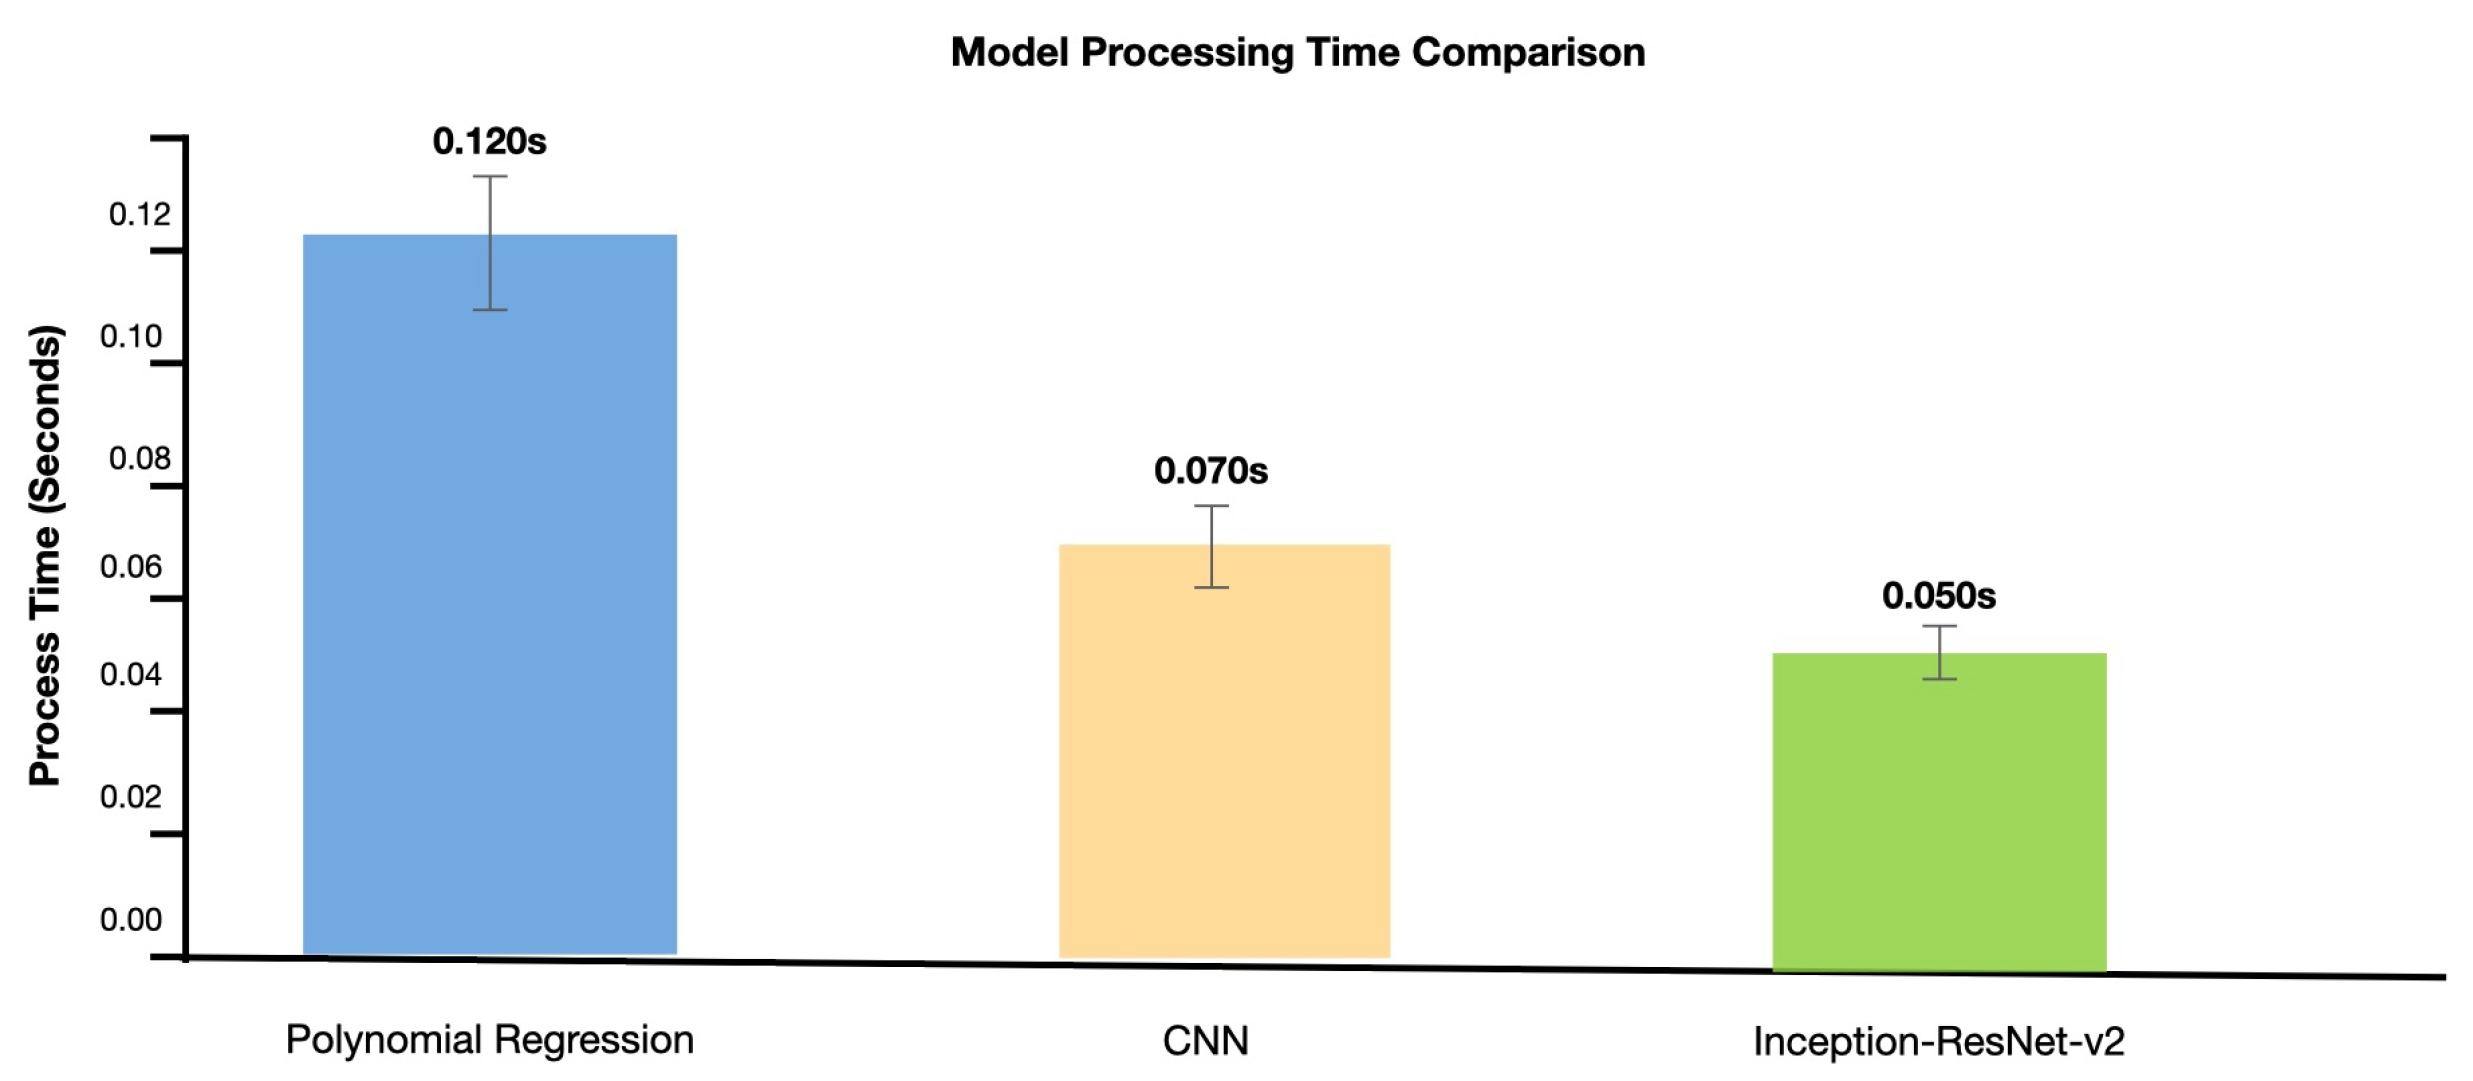
- Processing Efficiency: improved by 58.3% ().
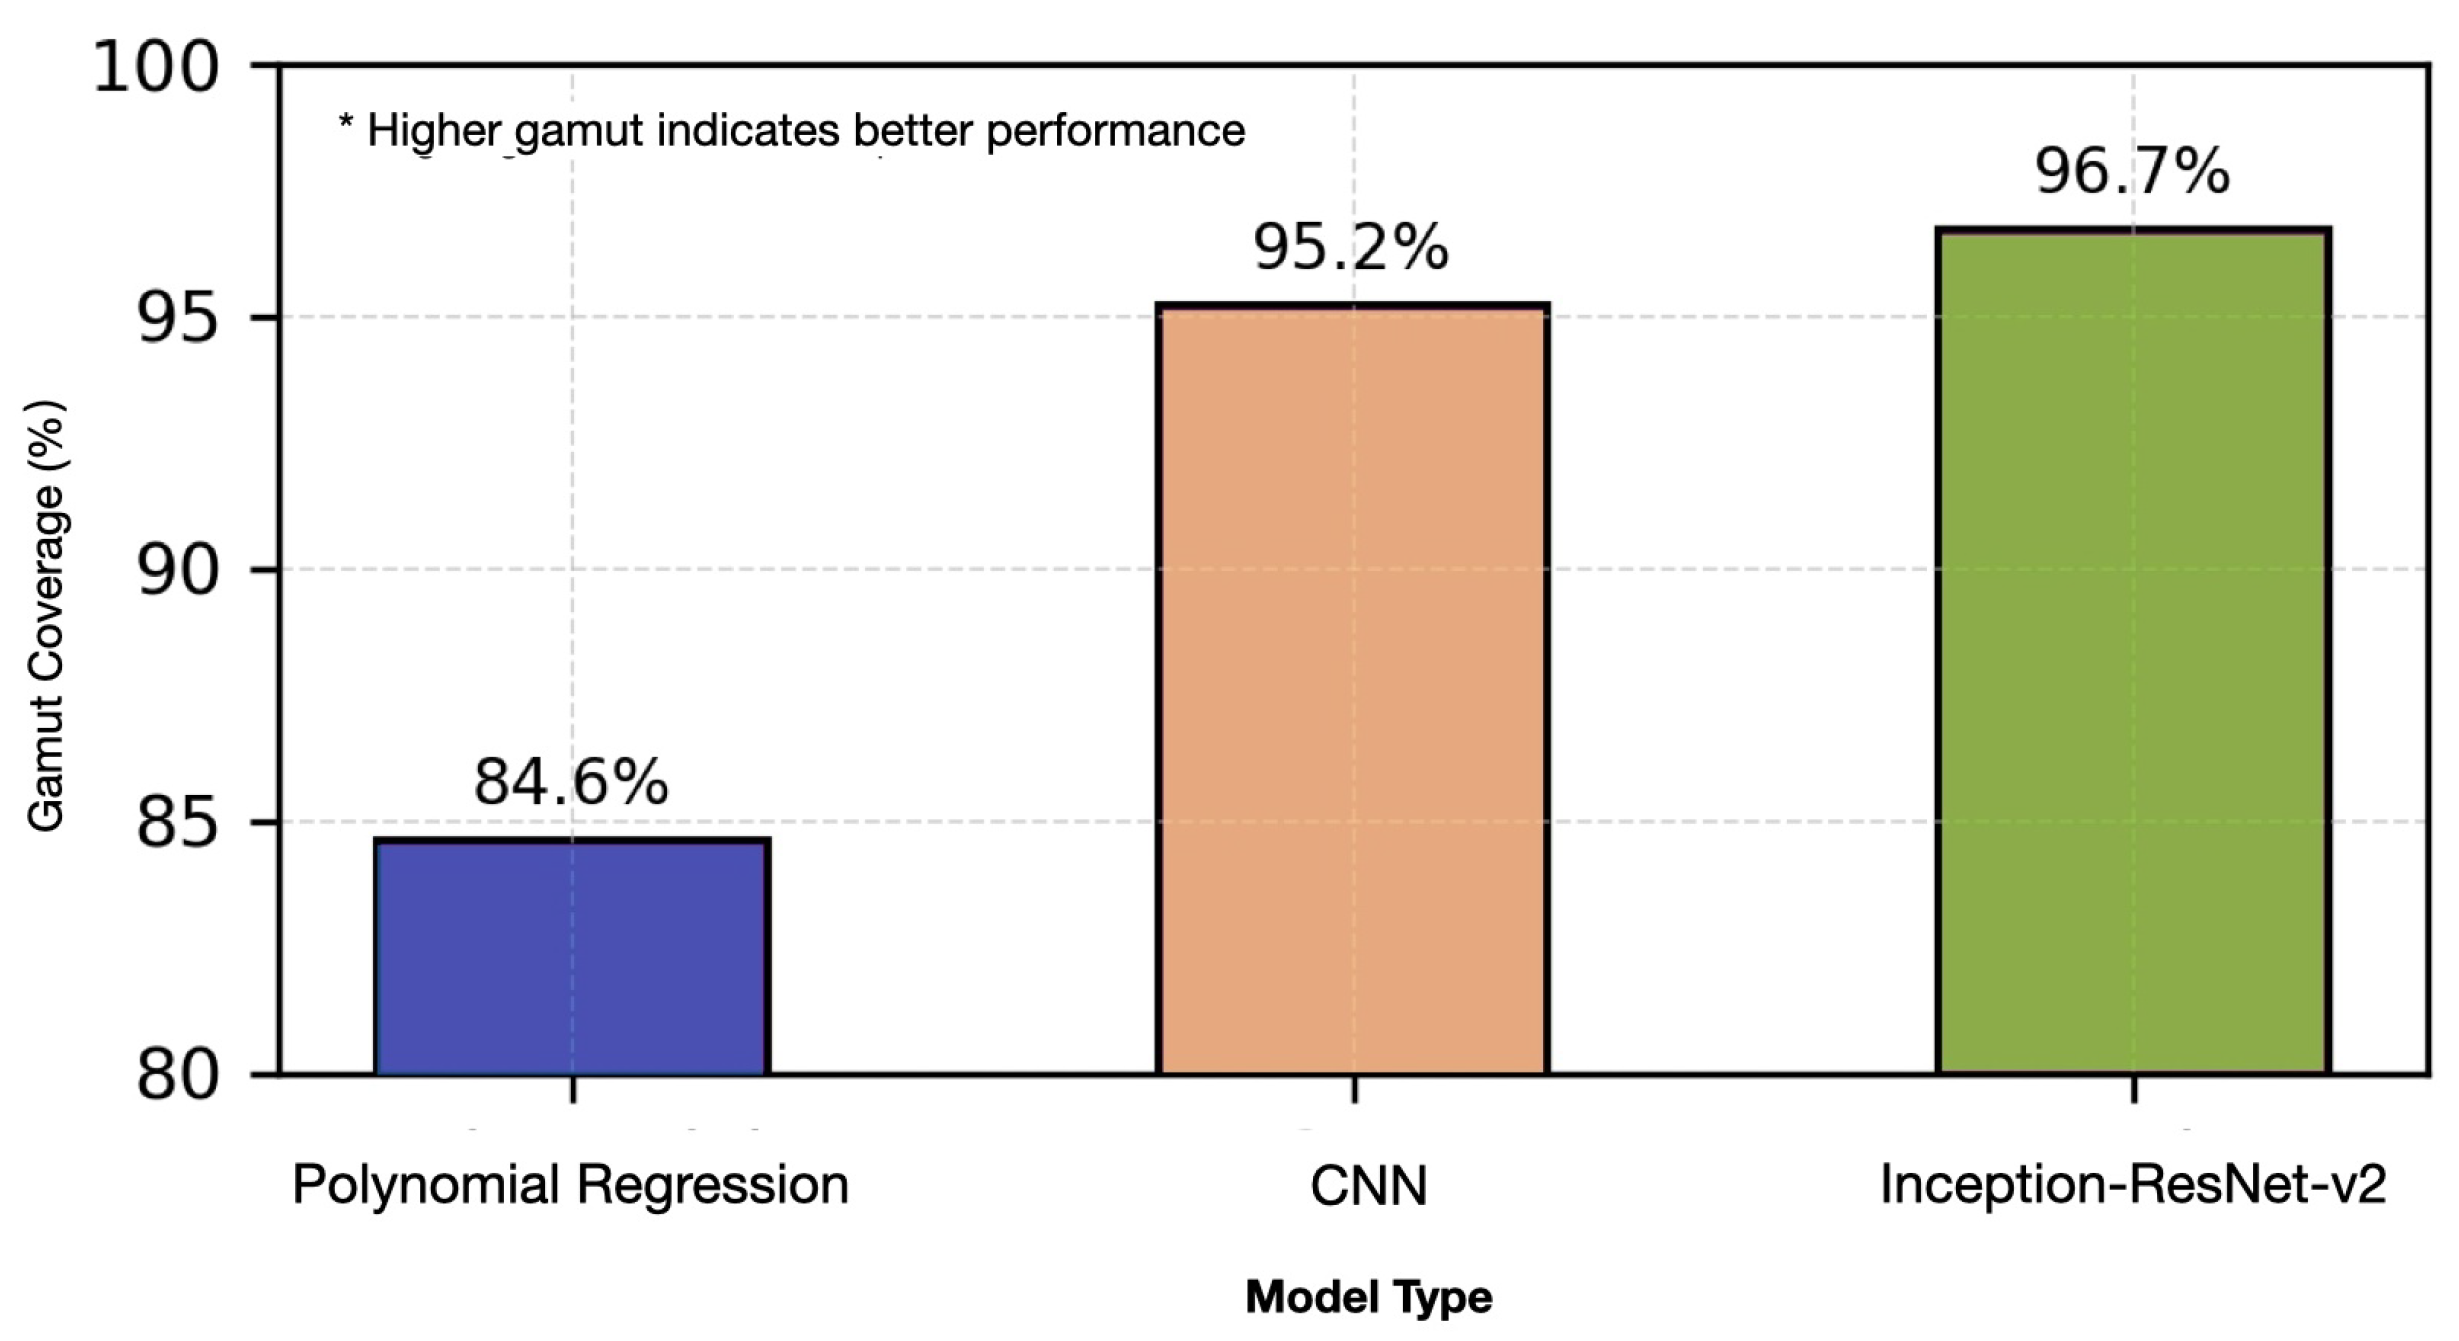
- Color Gamut Expansion: increased by 13.1% while maintaining precision.
Author Contributions
Funding
Institutional Review Board Statement
Informed Consent Statement
Data Availability Statement
Acknowledgments
Conflicts of Interest
Appendix A
| Algorithm A1 Polynomial regression with least squares fitting |
| Input: • Color sample set , where N denotes the number of samples. • Polynomial models set , where M denotes the number of polynomial models. • Maximum polynomial degree , where denotes a positive integer. Output: • Set of transformation matrices ; • Set of M average color differences .
a. Initialize empty sets (for transformation matrices ) and (for color differences). b. For j = 1 to M, perform the following (process each polynomial model): - Construct Feature Matrix: ; - Construct Target Matrix: ; - Compute Transformation Matrix: ; - Predict LAB Values: ; - Compute Average Color Difference . c. Return and . |
Appendix B
| Algorithm A2 Attention module for feature enhancement |
| Input: Feature map Reduction ratio Output: Enhanced feature map
|
Appendix C
| Algorithm A3 Bayesian optimization for objective function minimization |
| Input: Objective function : Search space Maximum number of iterations Initial sampling strategy Output: Estimated global optimum Estimated minimum function value
|
Appendix D
| Algorithm A4 Design of physical constraint loss function |
| Input: True values Predicted values Fluorescence intensity Spectral overlap Energy conservation Model parameters Hyperparameters Output: Total loss Initialize
|
Appendix E
| Algorithm A5 High-precision data pre-processing function |
| Input: Raw spectral data Image set Output: Processed dataset P Validation metrics V
|
References
- Wang, T.; Zheng, H.; You, C.; Ju, J. A Texture-Hidden Anti-Counterfeiting QR Code and Authentication Method. Sensors 2023, 23, 795–809. [Google Scholar] [CrossRef] [PubMed]
- Díaz-Barrancas, F.; Cwierz, H.; Pardo, P.J.; Pérez, Á.L.; Suero, M.I. Spectral Color Management in Virtual Reality Scenes. Sensors 2020, 20, 5658–5672. [Google Scholar] [CrossRef]
- De Oliveira, M.A.; Monteiro, A.V.; Vieira Filho, J. A New Structural Health Monitoring Strategy Based on PZT Sensors and Convolutional Neural Network. Sensors 2018, 18, 2955. [Google Scholar] [CrossRef]
- Zhu, L.; Chen, Y.; Ghamisi, P.; Benediktsson, J.A. Generative Adversarial Networks for Hyperspectral Image Classification. IEEE Trans. Geosci. Remote Sens. 2018, 56, 5046–5063. [Google Scholar] [CrossRef]
- Tasar, O.; Happy, S.L.; Tarabalka, Y.; Alliez, P. ColorMapGAN: Unsupervised Domain Adaptation for Semantic Segmen-tation Using Color Mapping Generative Adversarial Networks. IEEE Trans. Geosci. Remote Sens. 2020, 58, 7178–7193. [Google Scholar] [CrossRef]
- Wang, P.T.; Tseng, C.W.; Chou, J.J. Pixel-wise Colorimetric Characterization based on U-Net Convolutional Network. J. Imaging Sci. Technol. 2020, 64, 040405-1–040405-10. [Google Scholar] [CrossRef]
- LeCun, Y.; Bengio, Y.; Hinton, G. Deep Learning. Nature 2015, 521, 436–444. [Google Scholar] [CrossRef]
- Eom, H.; Lee, D.; Han, S.; Hariyani, Y.S.; Lim, Y.; Sohn, I.; Park, C.; Lee, E. End-to-End Deep Learning Architecture for Con-tinuous Blood Pressure Estimation Using Attention Mechanism. Sensors 2020, 20, 2338. [Google Scholar] [CrossRef]
- Kiani, L.; Saeed, M.; Nezamabadi-pour, H. Image Colorization Using Generative Adversarial Networks and Transfer Learning. In Proceedings of the the 2020 International Conference on Machine Vision and Image Processing, Tehran, Iran, 18–20 February 2020; pp. 1–6. [Google Scholar] [CrossRef]
- Hu, J.; Jiang, Q.; Cong, R.; Gao, W.; Shao, F. Two-Branch Deep Neural Network for Underwater Image Enhancement in HSV Color Space. IEEE Signal Process. Lett. 2021, 28, 2152–2156. [Google Scholar] [CrossRef]
- Revignas, D.; Amendola, V. Artificial Neural Networks Applied to Colorimetric Nanosensors: An Undergraduate Expe-rience Tailorable from Gold Nanoparticles Synthesis to Optical Spectroscopy and Machine Learning. J. Chem. Educ. 2022, 99, 2112–2120. [Google Scholar] [CrossRef]
- Belousov, Y.; Quétant, G.; Pulfer, B.; Chaban, R.; Tutt, J.; Taran, O.; Voloshynovskiy, S. A Machine Learning-Based Digital Twin for Anti-Counterfeiting Applications with Copy Detection Patterns. IEEE Trans. Inf. Forensics Secur. 2024, 19, 3395–3408. [Google Scholar] [CrossRef]
- Liu, Y.; Han, F.; Li, F.; Zhao, Y.; Chen, M.; Xu, Z.; Qian, L. Inkjet-Printed Unclonable Quantum Dot Fluorescent An-ti-Counterfeiting Labels with Artificial Intelligence Authentication. Nat. Commun. 2019, 10, 2409. [Google Scholar] [CrossRef]
- Wen, Y.C.; Wen, S.; Hsu, L.; Chi, S. Irradiance Independent Spectrum Reconstruction from Camera Signals Using the In-terpolation Method. Sensors 2022, 22, 8498. [Google Scholar] [CrossRef]
- Liu, H.; Sun, H.; Li, M.; Iida, M. Application of Color Featuring and Deep Learning in Maize Plant Detection. Remote Sens. 2020, 12, 2229. [Google Scholar] [CrossRef]
- Madhavi, B.G.K.; Basak, J.K.; Paudel, B.; Kim, N.E.; Choi, G.M.; Kim, H.T. Prediction of Strawberry Leaf Color Using RGB Mean Values Based on Soil Physicochemical Parameters Using Machine Learning Models. Agronomy 2022, 12, 981. [Google Scholar] [CrossRef]
- Gai, S.; Huang, X. Reduced Biquaternion Convolutional Neural Network for Color Image Processing. IEEE Trans. Circuits Syst. Video Technol. 2021, 32, 1061–1075. [Google Scholar] [CrossRef]
- Li, J.; Xie, D.; Li, M.; Liu, S.; Wei, C.A. Optimal Learning Samples for Two-Constant Kubelka-Munk Theory to Match the Color of Pre-Colored Fiber Blends. Front. Neurosci. 2022, 16, 945454. [Google Scholar] [CrossRef]
- Signoroni, A.; Savardi, M.; Baronio, A.; Benini, S. Deep Learning Meets Hyperspectral Image Analysis: A Multidisciplinary Review. J. Imaging 2019, 5, 52. [Google Scholar] [CrossRef]
- Ronneberger, S.; Zhang, J.; Liu, Y.; Loeffler, F.F. Solid Ink Laser Patterning for High-Resolution Information Labels with Supervised Learning Readout. Adv. Funct. Mater. 2023, 33, 2210116. [Google Scholar] [CrossRef]
- Spyridis, Y.; Lagkas, T.; Sarigiannidis, P.; Argyriou, V.; Sarigiannidis, A.; Eleftherakis, G.; Zhang, J. Towards 6G IoT: Tracing Mobile Sensor Nodes with Deep Learning Clustering in UAV Networks. Sensors 2021, 21, 3936. [Google Scholar] [CrossRef]
- Zhao, J.; Kechasov, D.; Rewald, B.; Bodner, G.; Verheul, M.; Clarke, N.; Clarke, J.L. Deep Learning in Hyperspectral Image Reconstruction from Single RGB Images—A Case Study on Tomato Quality Parameters. Remote Sens. 2020, 12, 3258. [Google Scholar] [CrossRef]
- Štroner, M.; Urban, R.; Suk, T. Filtering Green Vegetation out from Colored Point Clouds of Rocky Terrains Based on Various Vegetation Indices: Comparison of Simple Statistical Methods, Support Vector Machine, and Neural Network. Remote Sens. 2023, 15, 3254. [Google Scholar] [CrossRef]
- Amoriello, T.; Ciccoritti, R.; Ferrante, P. Prediction of Strawberries’ Quality Parameters Using Artificial Neural Networks. Agronomy 2022, 12, 963. [Google Scholar] [CrossRef]
- Basak, J.K.; Madhavi, B.G.K.; Paudel, B.; Kim, N.E.; Kim, H.T. Prediction of Total Soluble Solids and pH of Strawberry Fruits Using RGB, HSV and HSL Colour Spaces and Machine Learning Models. Foods 2022, 11, 2086. [Google Scholar] [CrossRef]
- Al-Ameri, M.A.A.; Ciylan, B.; Mahmood, B. Spectral Data Analysis for Forgery Detection in Official Documents: A Net-work-Based Approach. Electronics 2022, 11, 4036. [Google Scholar] [CrossRef]
- Yan, S.; Xiong, Y.; Lin, D. Spatial Temporal Graph Convolutional Networks for Skeleton-Based Action Recognition. In Proceedings of the 32nd AAAI Conference on Artificial Intelligence, New Orleans, LA, USA, 2–7 February 2018; pp. 7444–7452. [Google Scholar] [CrossRef]
- Liu, C.; Hu, S.; Mao, Y.; Wang, J.; Dou, G.; Chen, F. AGC-LSTM: Attention Gate-Based LSTM Network for Human Activity Recognition Using Wearable Sensors. Sensors 2020, 20, 3754. [Google Scholar] [CrossRef]
- Liu, Z.; Zhang, H.; Chen, Z.; Wang, Z.; Ouyang, W. Disentangling and Unifying Graph Convolutions for Skeleton-Based Action Recognition. In Proceedings of the IEEE/CVF Conference on Computer Vision and Pattern Recognition, Seattle, WA, USA, 13–19 June 2020; pp. 143–152. [Google Scholar] [CrossRef]
- Louie, D.R.; Mortenson, W.B.; Durocher, M.; Teasell, R.; Yao, J.; Eng, J.J. Exoskeleton for Post-Stroke Recovery of Ambula-tion (ExStRA): Study Protocol for a Mixed-Methods Study Investigating the Efficacy and Acceptance of an Exoskeleton-Based Physical Therapy Program during Stroke Inpatient Rehabilitation. BMC Neurol. 2020, 20, 35. [Google Scholar] [CrossRef]
- Borghese, N.A.; Mainetti, R.; Pirovano, M.; Lanzi, P.L. An Intelligent Game Engine for the At-Home Rehabilitation of Stroke Patients. In Proceedings of the 2nd IEEE International Conference on Serious Games and Applications for Health, Vilamoura, Portugal, Vilamoura, Portugal, 2–3 May 2013; pp. 1–8. [Google Scholar] [CrossRef]
- Miao, S.; Shen, C.; Feng, X.; Zhu, Q.; Shorfuzzaman, M.; Lv, Z. Upper limb rehabilitation system for stroke survivors based on multi-modal sensors and machine learning. IEEE Access 2021, 9, 30283–30291. [Google Scholar] [CrossRef]
- Zhao, L.; Chen, C.S.; Huang, J.W. Deep Learning-Based Forgery Attack on Document Images. IEEE Trans. Image Process 2021, 30, 7964–7979. [Google Scholar] [CrossRef]
- El-Ghandour, M.; Farahat, A.; Al-Dhaen, E.; Pasha, S.; Fadhel, F. Palmvein recognition using block-based WLD histogram of Gabor feature maps and deep neural network with Bayesian optimization. IEEE Access 2021, 9, 97337–97353. [Google Scholar] [CrossRef]
- ISO/IEC. ISO 12640-3:2007. Graphic Technology—Prepress Digital Data Exchange—Part 3: CIELAB Standard Colour Image Data (CIELAB/SCID). 2007. Available online: https://www.iso.org/obp/ui/#iso:std:iso:12640:-3:ed-1:v1:en (accessed on 13 December 2024).
- Mukundan, A.; Tsao, Y.M.; Cheng, W.M.; Lin, F.C.; Wang, H.C. Automatic counterfeit currency detection using a novel snapshot hyperspectral imaging algorithm. Sensors 2023, 23, 2026. [Google Scholar] [CrossRef] [PubMed]
- Wang, T.; Zheng, H.; Guo, Z.; You, C.; Ju, J. Anti-counterfeiting textured pattern. Vis. Comput. 2024, 40, 2139–2160. [Google Scholar] [CrossRef]
- García-Vera, Y.E.; Polochè-Arango, A.; Mendivelso-Fajardo, C.A.; Gutiérrez-Bernal, F.J. Hyperspectral image analysis and machine learning techniques for crop disease detection and identification: A review. Sustainability 2024, 16, 6064. [Google Scholar] [CrossRef]
- Yan, H.; Chen, L.; Li, X.; Zhao, R.; Wang, J. Handheld near-infrared spectroscopy: State-of-the-art instrumentation and applications in material identification, food authentication, and environmental investigations. Chemosensors 2023, 11, 272. [Google Scholar] [CrossRef]
- Li, D.; Zhao, X.; Wang, Y.; Chen, Z.; Xu, P. A novel CNN based security guaranteed image watermarking generation scenario for smart city applications. Inf. Sci. 2019, 479, 432–447. [Google Scholar] [CrossRef]
- Chen, C.; He, Z.; Yu, F.; Wang, Q.; Liu, L. Distortion model-based spectral augmentation for generalized recaptured document detection. IEEE Trans. Inf. Forensics Secur. 2023, 19, 1283–1298. [Google Scholar] [CrossRef]
- Hu, S.; Zhang, L.; Wang, F.; Liu, Y.; Chen, J. Multimode fiber image reconstruction based on parallel neural network with small training set under wide temperature variations. Opt. Laser Technol. 2024, 175, 110815. [Google Scholar] [CrossRef]
- Yhdego, T.O.; Patel, R.; Singh, A.; Brown, P.; Martinez, D. Ontology-guided attribute learning to accelerate certification for developing new printing processes. IISE Trans. 2024, 56, 1085–1098. [Google Scholar] [CrossRef]
- Bouchene, M.M.; Belabbas, T.; Abderrahmane, M.; Khalil, I.; Bouziane, F. Bayesian optimization of histogram of oriented gradients (HOG) parameters for facial recognition. J. Supercomput. 2024, 80, 20118–20149. [Google Scholar] [CrossRef]
- Chaudhry, D.; Goel, H.; Verma, B.; Agarwal, S.; Singh, R. TransFAS: Transformer-based network for Face Anti-Spoofing using Token Guided Inspection. In Proceedings of the IEEE 8th International Conference for Convergence in Technology (I2CT), Lonavla, India, 7–9 April 2023; pp. 1–7. [Google Scholar] [CrossRef]
- ISO 11664-6:2014; Colorimetry—Part 6: CIEDE2000 Colour-Difference Formula. International Organization for Standardization: Geneva, Switzerland, 2014. Available online: https://www.iso.org/obp/ui/#iso:std:iso-cie:11664:-6:ed-1:v1:en (accessed on 13 December 2024).
- ISO 13655:2017; Graphic Technology—Spectral Measurement and Colorimetric Computation for Graphic Arts Images. International Organization for Standardization: Geneva, Switzerland, 2017. Available online: https://www.iso.org/standard/65430.html (accessed on 13 December 2024).
- ISO 12647-2:2013; Graphic Technology—Process Control for the Production of Half-Tone Colour Separations, Proof and Production Prints—Part 2: Offset Lithographic Processes. ISO/IEC: Geneva, Switzerland, 2013. Available online: https://www.iso.org/standard/57833.html (accessed on 13 December 2024).
- ISO/IEC 17025:2017; General Requirements for the Competence of Testing and Calibration Laboratories. ISO/IEC: Geneva, Switzerland, 2017. Available online: https://www.iso.org/obp/ui/#iso:std:iso:12647:-2:ed-3:v1:en (accessed on 13 December 2024).
- ISO 12642-2:2006; Systems and Software Engineering—Systems and Software Quality Requirements and Evaluation—Input Data for Characterization of 4-Colour Process Printing—Part 2: Expanded Data Set; Known as IT8.7/3. ISO/IEC: Geneva, Switzerland, 2006. Available online: https://www.iso.org/obp/ui/en/#iso:std:iso:12642:-2:ed-1:v2:en (accessed on 13 December 2024).
- ISO 12232:2019; Photography—Digital Still Cameras—Determination of Exposure Index, ISO Speed Ratings, Standard Output Sensitivity, and Recommended Exposure Index, 3rd ed. ISO/IEC: Geneva, Switzerland, 2019. Available online: https://www.iso.org/standard/73758.html (accessed on 13 December 2024).


| Ink Color | Fluorescent Component | Chemical Formula | CAS Number | Concentration (w/w) |
|---|---|---|---|---|
| Yellow | Fluorescent Brightener | 16090-02-1 | 0.5% | |
| Red | Rhodamine 6G | 989-38-8 | 0.3% | |
| Blue | 7-Diethylamino-4-methyl coumarin | 91-44-1 | 0.4% |
| Ink Color | Excitation Peak (nm) | Emission Peak (nm) | Stokes Shift (nm) | Quantum Yield Range |
|---|---|---|---|---|
| Yellow | 365 | 435 ± 2 | 70 | 0.65–0.85 |
| Red | 365 | 550 ± 2 | 185 | 0.70–0.95 |
| Blue | 365 | 480 ± 2 | 115 | 0.55–0.75 |
| Layer | Output Size | Filter Size | Stride | Output Channels | Function |
|---|---|---|---|---|---|
| Input | 8 × 8 × 3 | - | - | 3 | RGB image input |
| Conv1 | 8 × 3 × 8 | - | - | 8 | Color vector transformation |
| Conv2 | 8 × 3 × 24 | 3 × 3 | 1 | 24 | Dilated convolution (rate = 2, which increases the receptive field without increasing parameters) |
| Conv3 | 8 × 3 × 32 | 3 × 3 | 1 | 32 | Feature extraction |
| Conv4 | 8 × 3 × 64 | 3 × 3 | 1 | 64 | Dilated convolution (rate = 4, capturing multi-scale context) |
| Conv5 | 8 × 3 × 128 | 3 × 3 | 1 | 128 | Deep feature extraction |
| Attention | 8 × 3 × 128 | - | - | 128 | Hybrid spatial and channel-wise attention (focuses on important features by assigning weights) |
| Global Average Pooling | 1 × 1 × 128 | - | - | 128 | Feature aggregation (reduces spatial dimensions while retaining channel information) |
| Dense1 | 4096 | - | - | 4096 | Non-linear mapping (ReLU activation) |
| Dense2 | 1024 | - | - | 1024 | Non-linear mapping (ReLU activation) |
| Output | 3 | - | - | 3 | CIELAB prediction (linear regression) |
| Model Configuration | (Mean ± SD) | Color Accuracy (%) | SSIM |
|---|---|---|---|
| Full Model | 0.52 ± 0.18 | 98.7 | 0.9945 |
| Without Physics-Constrained Loss | 0.71 ± 0.25 | 96.8 | 0.9908 |
| Without Bayesian Optimization | 0.63 ± 0.21 | 97.9 | 0.9928 |
| Component | Specification | Operating Parameters | Validation Metrics |
|---|---|---|---|
| Spectrophotometer | X-Rite i1 Pro 2 | 380–730 nm,10 nm intervals | ±0.1 nm precision |
| Primary Light Source | D50 | 5003 K ± 50 k | Calibrated daily |
| UV Light Source | UV-LED | 365 ± 5 nm | Power stability: ±1% |
| Camera System | Panasonic S1R | ISO 100, f/8, 1/60 s | SNR > 40 dB |
| Geometric Configuration | 45°/0° | Fixed position | Angular precision: ±1° |
| Dataset | 70%-15%-15% | Train–Validate–Test | Stratified sampling |
| Sample Size | 1500 | ISO standard charts | Coverage: 98% gamut |
| Model | (Mean ± SD) | Processing Time (s) | Color Gamut Coverage (%) |
|---|---|---|---|
| Polynomial Regression | 3.2 ± 10.5 | 0.12 | 84.6 |
| CNN | 0.95 ± 0.28 | 0.07 | 95.2 |
| Inception-Resnet-v2 | 0.85± 0.15 | 0.05 | 96.7 |
| UV Source | Wavelength (nm) | CNN E (Mean ± SD) | I-ResNet-v2 CNN E (Mean ± SD) | Significance |
|---|---|---|---|---|
| UVA | 365 ± 5 | 0.8 ± 0.2 | 0.75 ± 0.1 | p < 0.001 |
| UVB | 310 ± 5 | 0.85 ± 0.14 | 0.78 ± 0.11 | p < 0.001 |
| UVC | 254 ± 5 | 0.82 ± 0.13 | 0.76 ± 0.1 | p < 0.001 |
Disclaimer/Publisher’s Note: The statements, opinions and data contained in all publications are solely those of the individual author(s) and contributor(s) and not of MDPI and/or the editor(s). MDPI and/or the editor(s) disclaim responsibility for any injury to people or property resulting from any ideas, methods, instructions or products referred to in the content. |
© 2024 by the authors. Licensee MDPI, Basel, Switzerland. This article is an open access article distributed under the terms and conditions of the Creative Commons Attribution (CC BY) license (https://creativecommons.org/licenses/by/4.0/).
Share and Cite
Wang, P.-T.; Tseng, C.W.; Fang, L.-D. Physics-Constrained Deep Learning for Security Ink Colorimetry with Attention-Based Spectral Sensing. Sensors 2025, 25, 128. https://doi.org/10.3390/s25010128
Wang P-T, Tseng CW, Fang L-D. Physics-Constrained Deep Learning for Security Ink Colorimetry with Attention-Based Spectral Sensing. Sensors. 2025; 25(1):128. https://doi.org/10.3390/s25010128
Chicago/Turabian StyleWang, Po-Tong, Chiu Wang Tseng, and Li-Der Fang. 2025. "Physics-Constrained Deep Learning for Security Ink Colorimetry with Attention-Based Spectral Sensing" Sensors 25, no. 1: 128. https://doi.org/10.3390/s25010128
APA StyleWang, P.-T., Tseng, C. W., & Fang, L.-D. (2025). Physics-Constrained Deep Learning for Security Ink Colorimetry with Attention-Based Spectral Sensing. Sensors, 25(1), 128. https://doi.org/10.3390/s25010128