
Vibration Serviceability Assessment of Floor Structures: Simulation of Human–Structure–Environment Interactions Using Agent-Based Modeling


Abstract
1. Introduction
- -
- Human-structure dynamic interactions (HSI)
- ○
- ○
- ○
- Effects of structural vibrations on task parameters such as walking speed, pacing frequency, step length and width, and lock-in effects for a walking person [16].
- -
- -
- Human-human interactions (HHI)
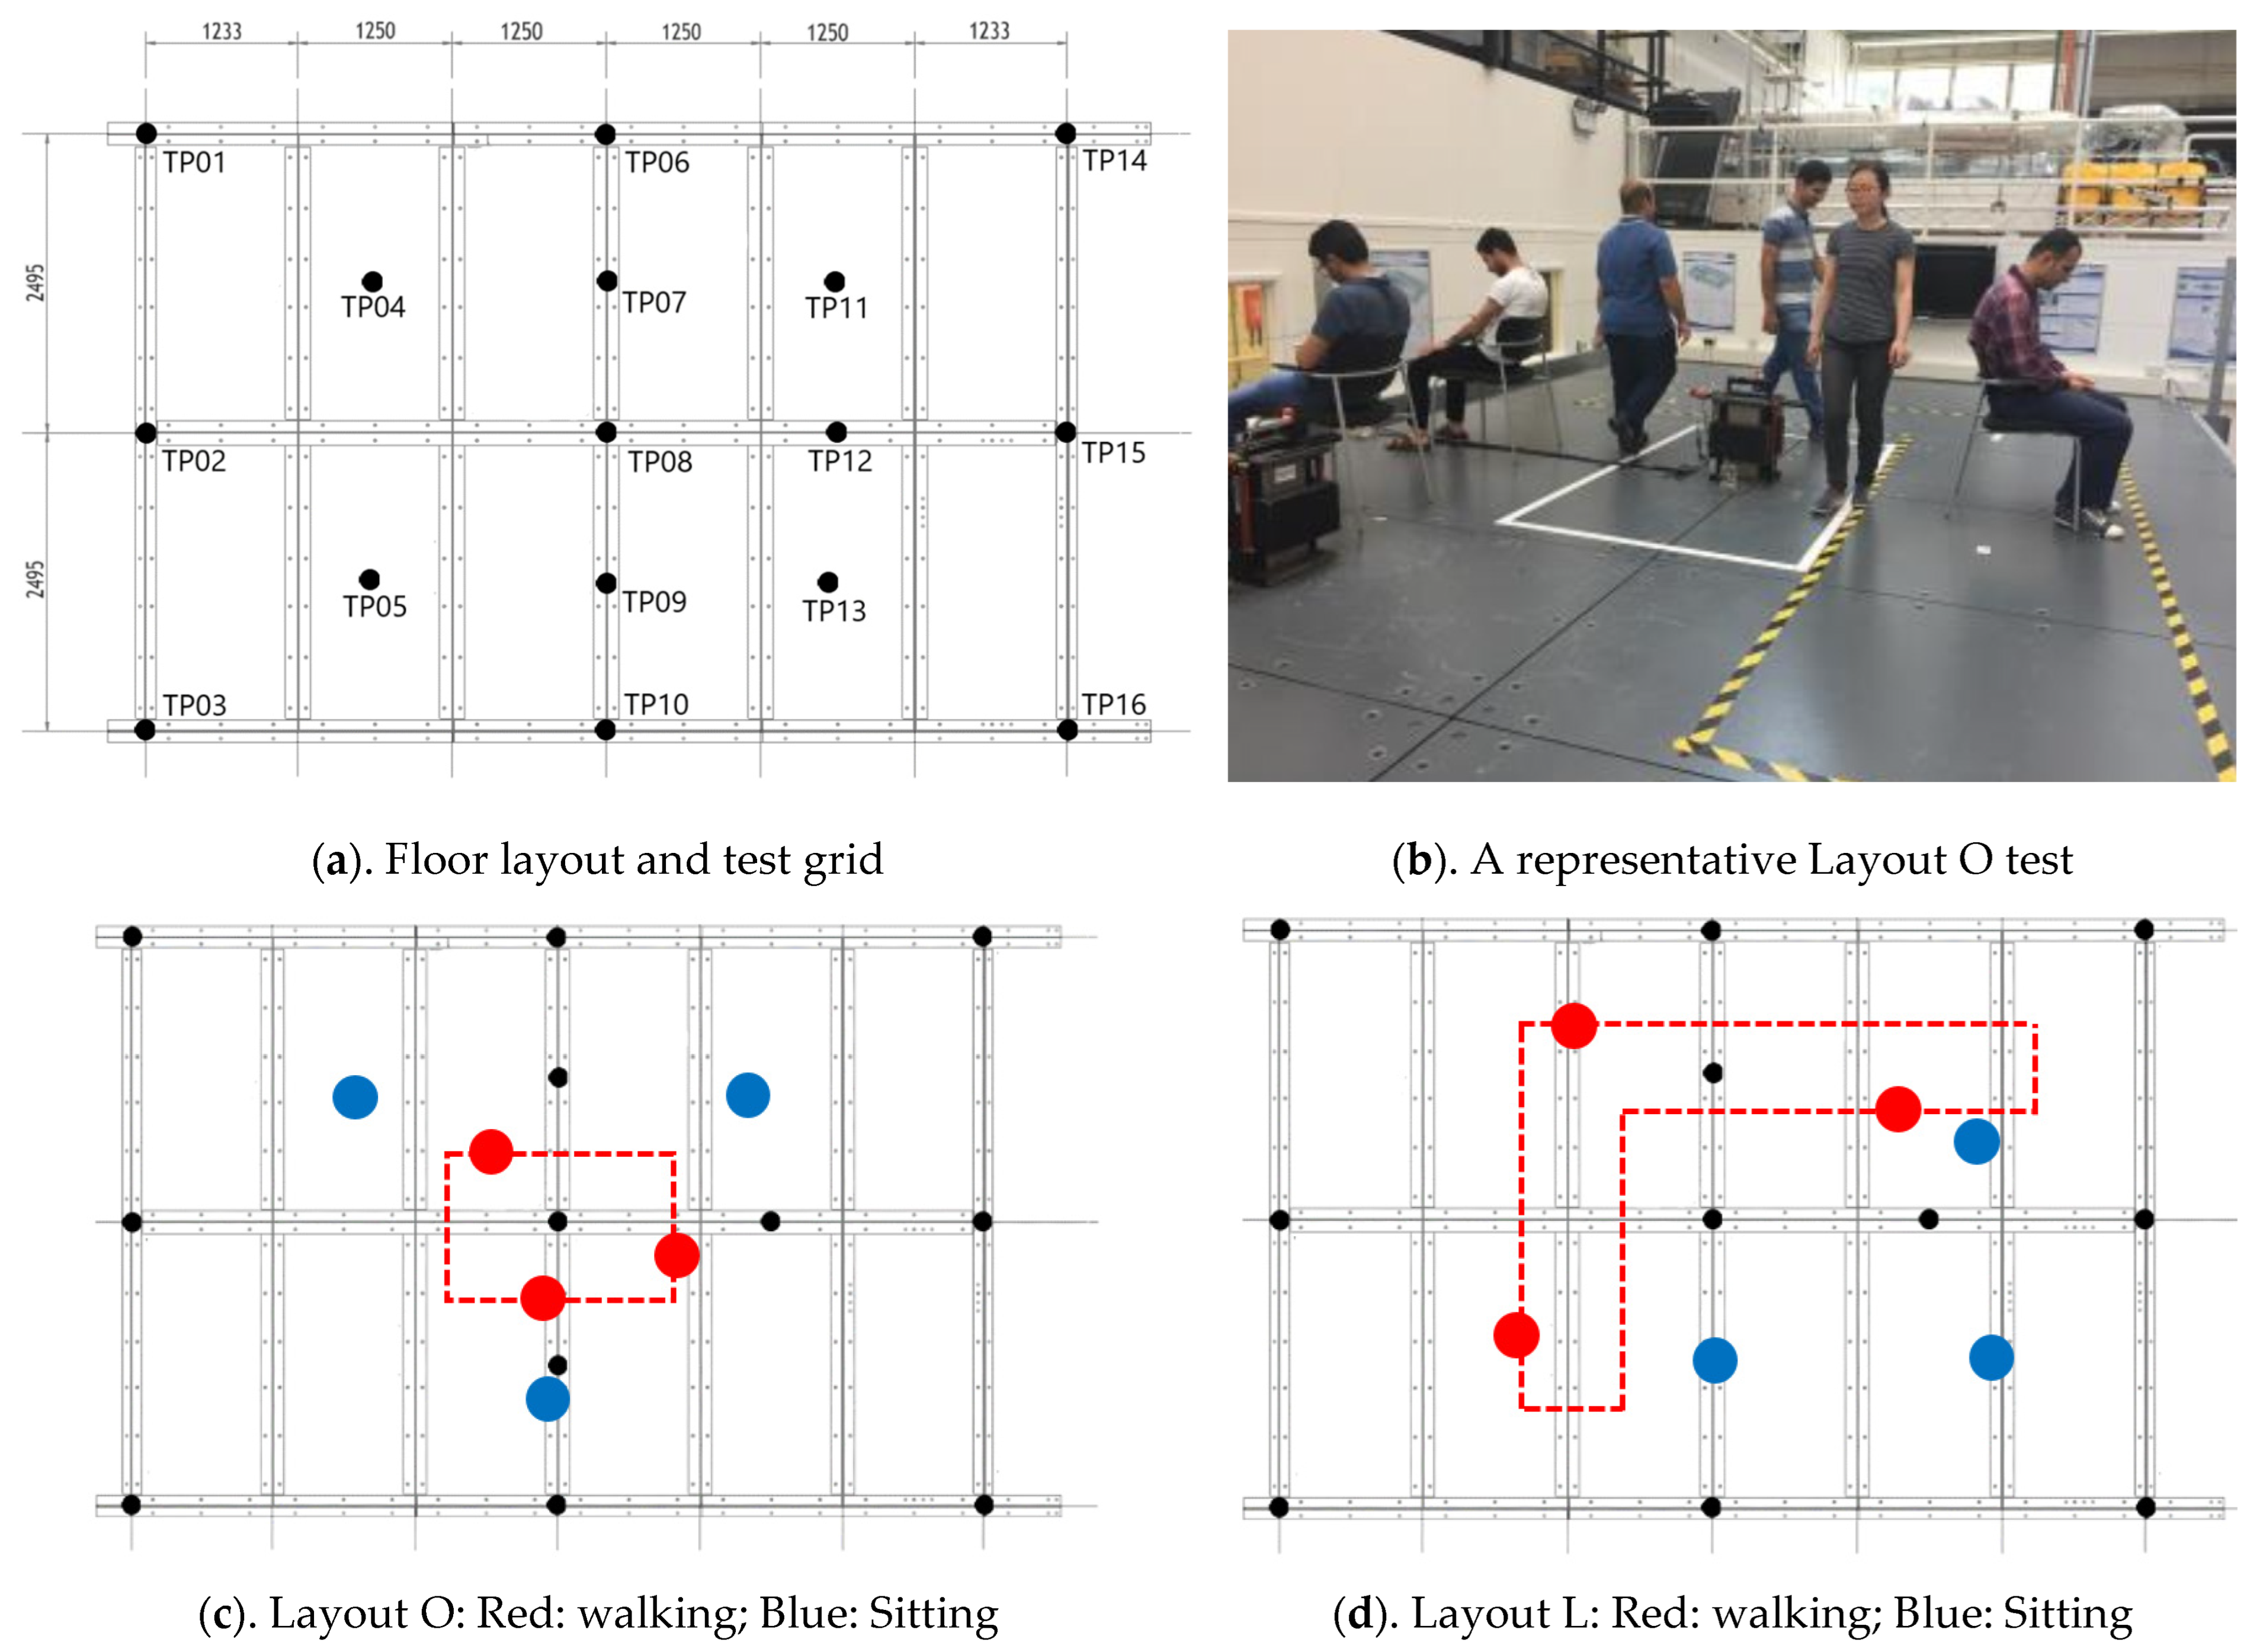
2. Experimental Measurements
2.1. Test Setup
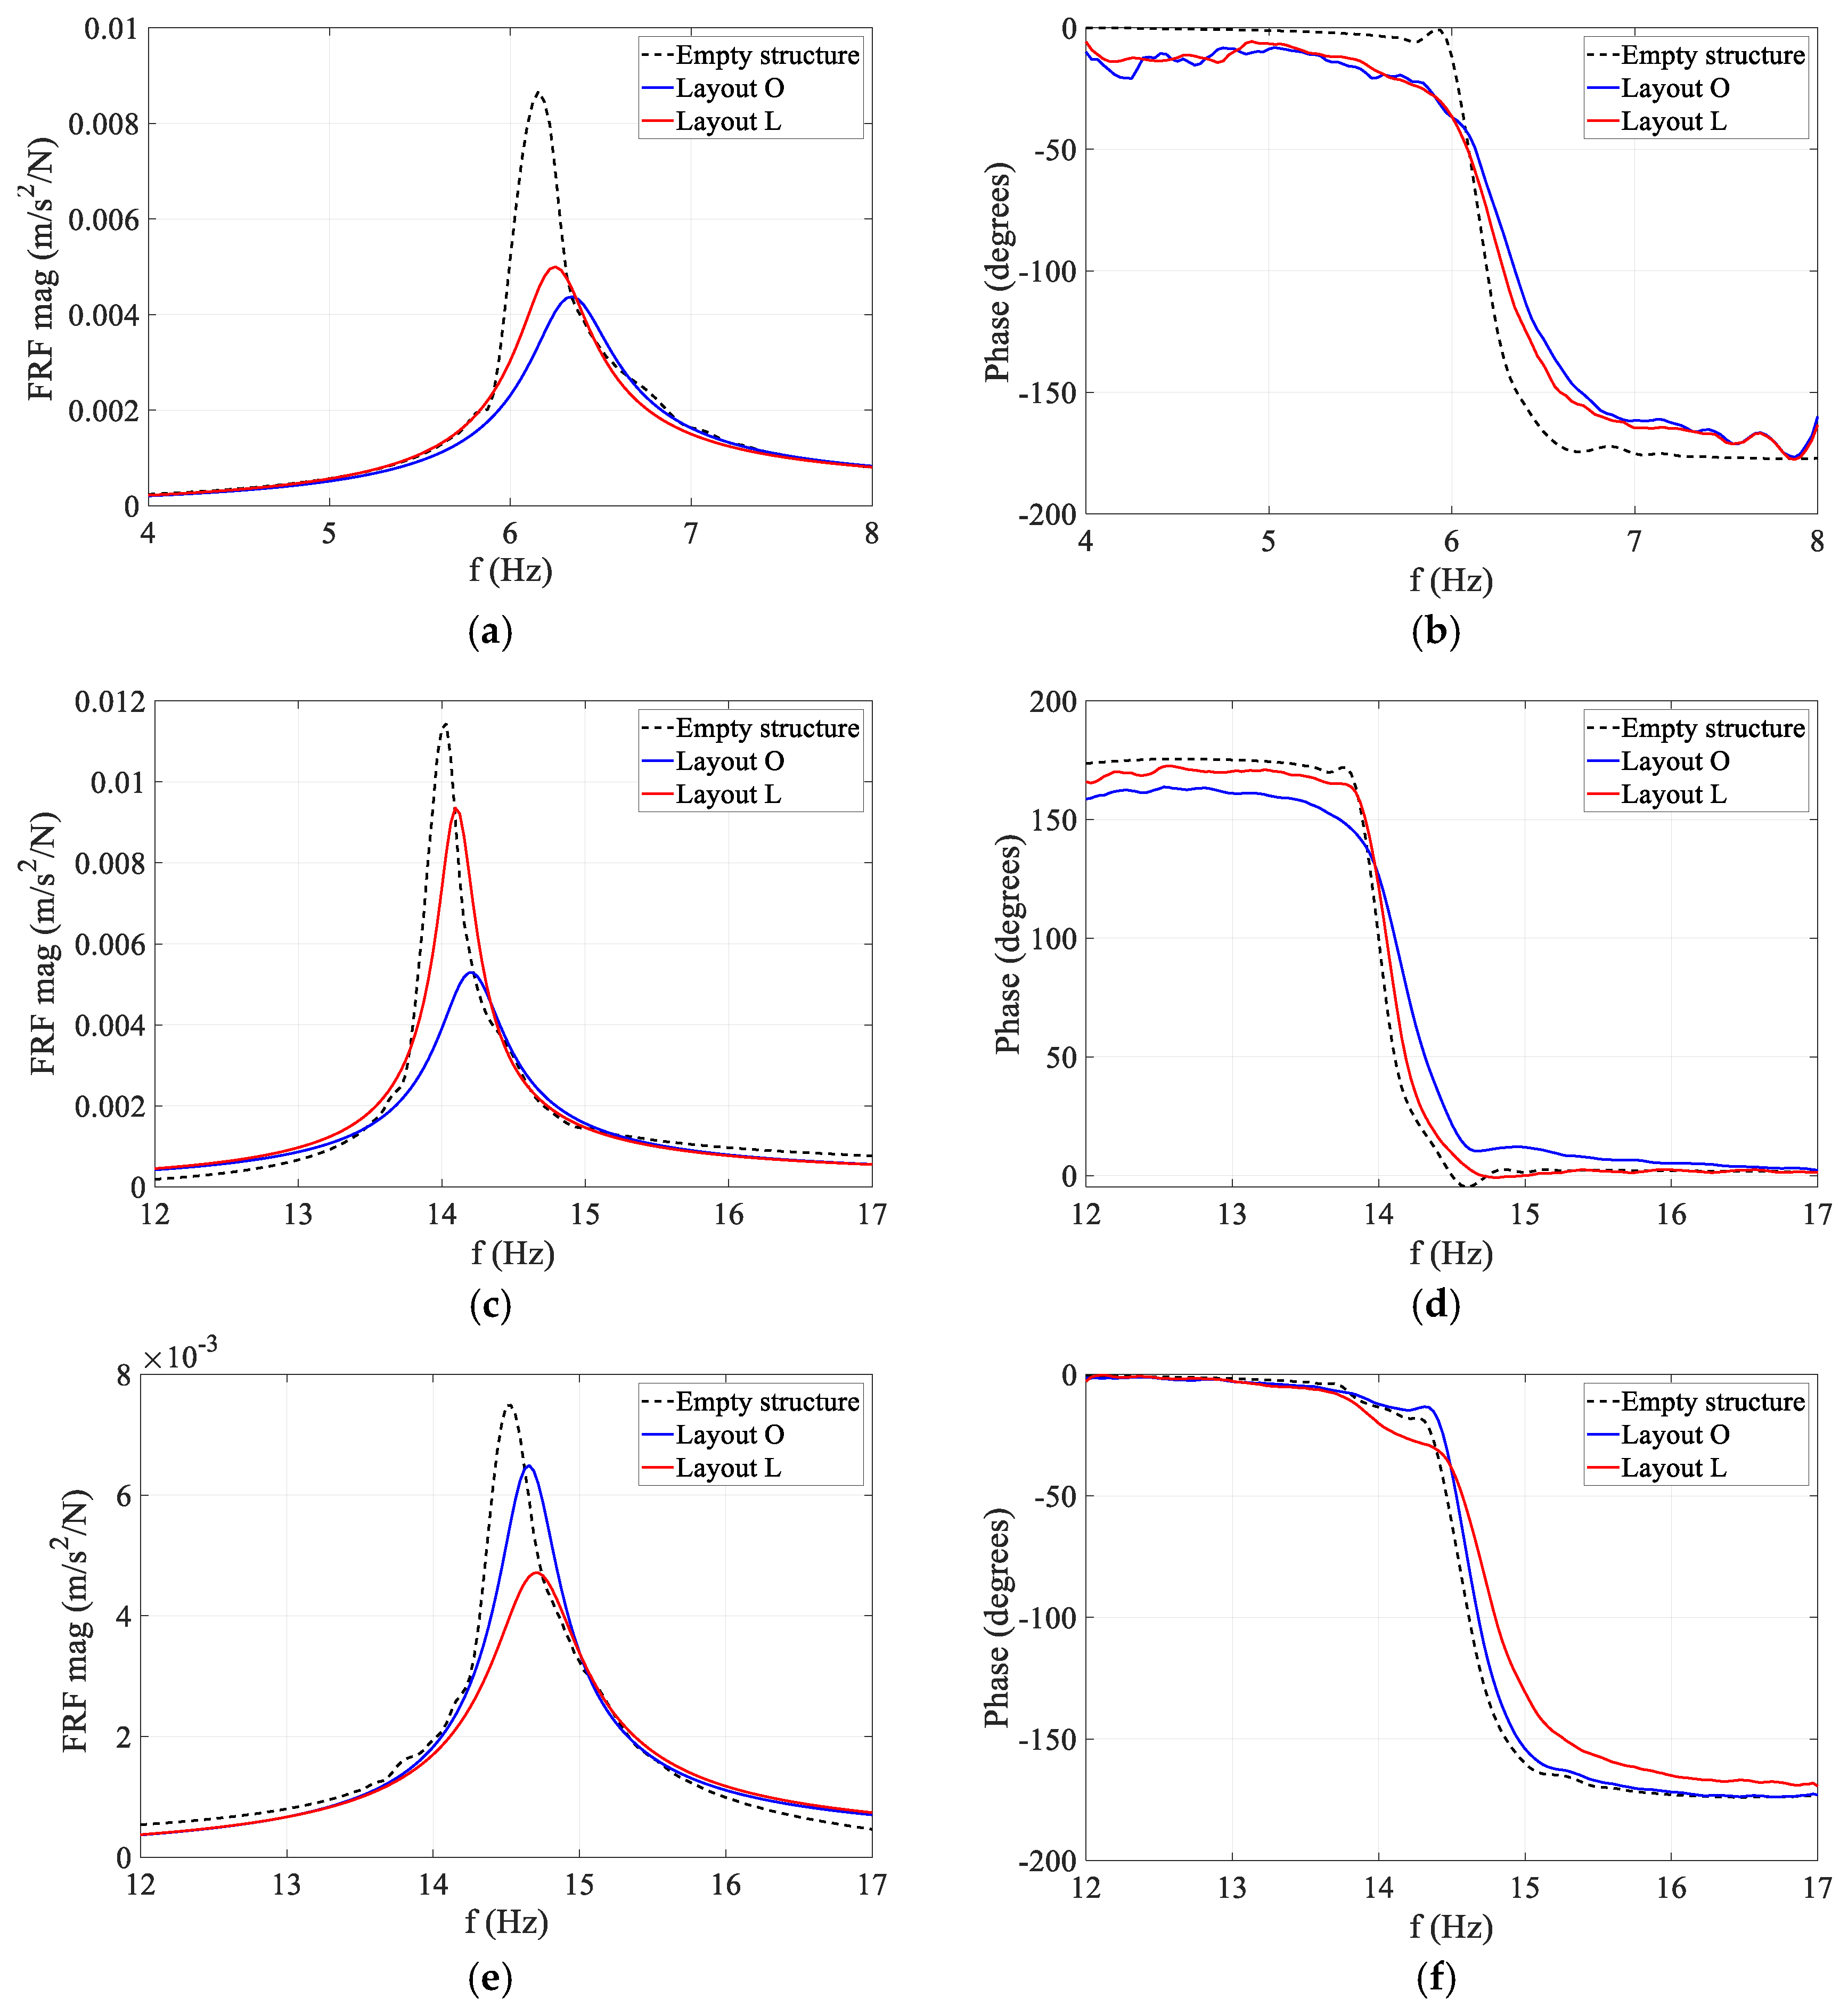
2.2. System Identification
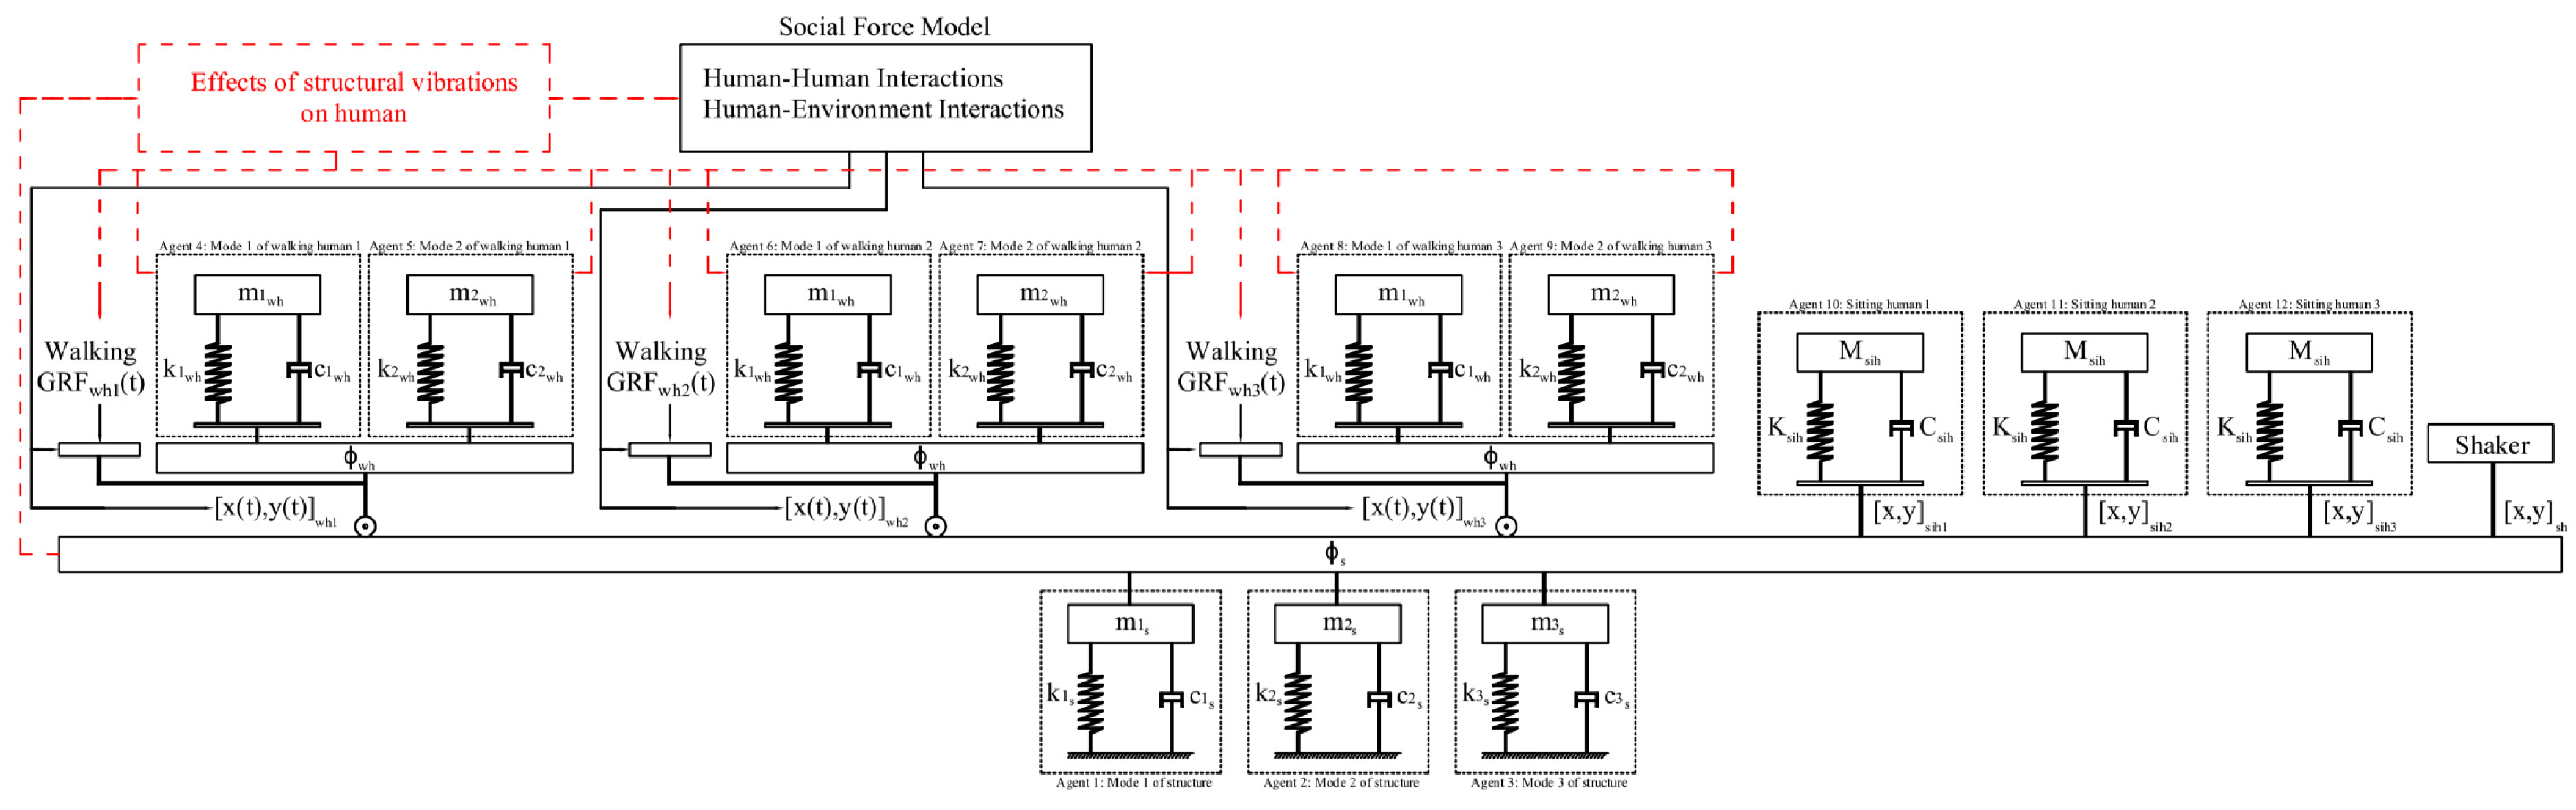
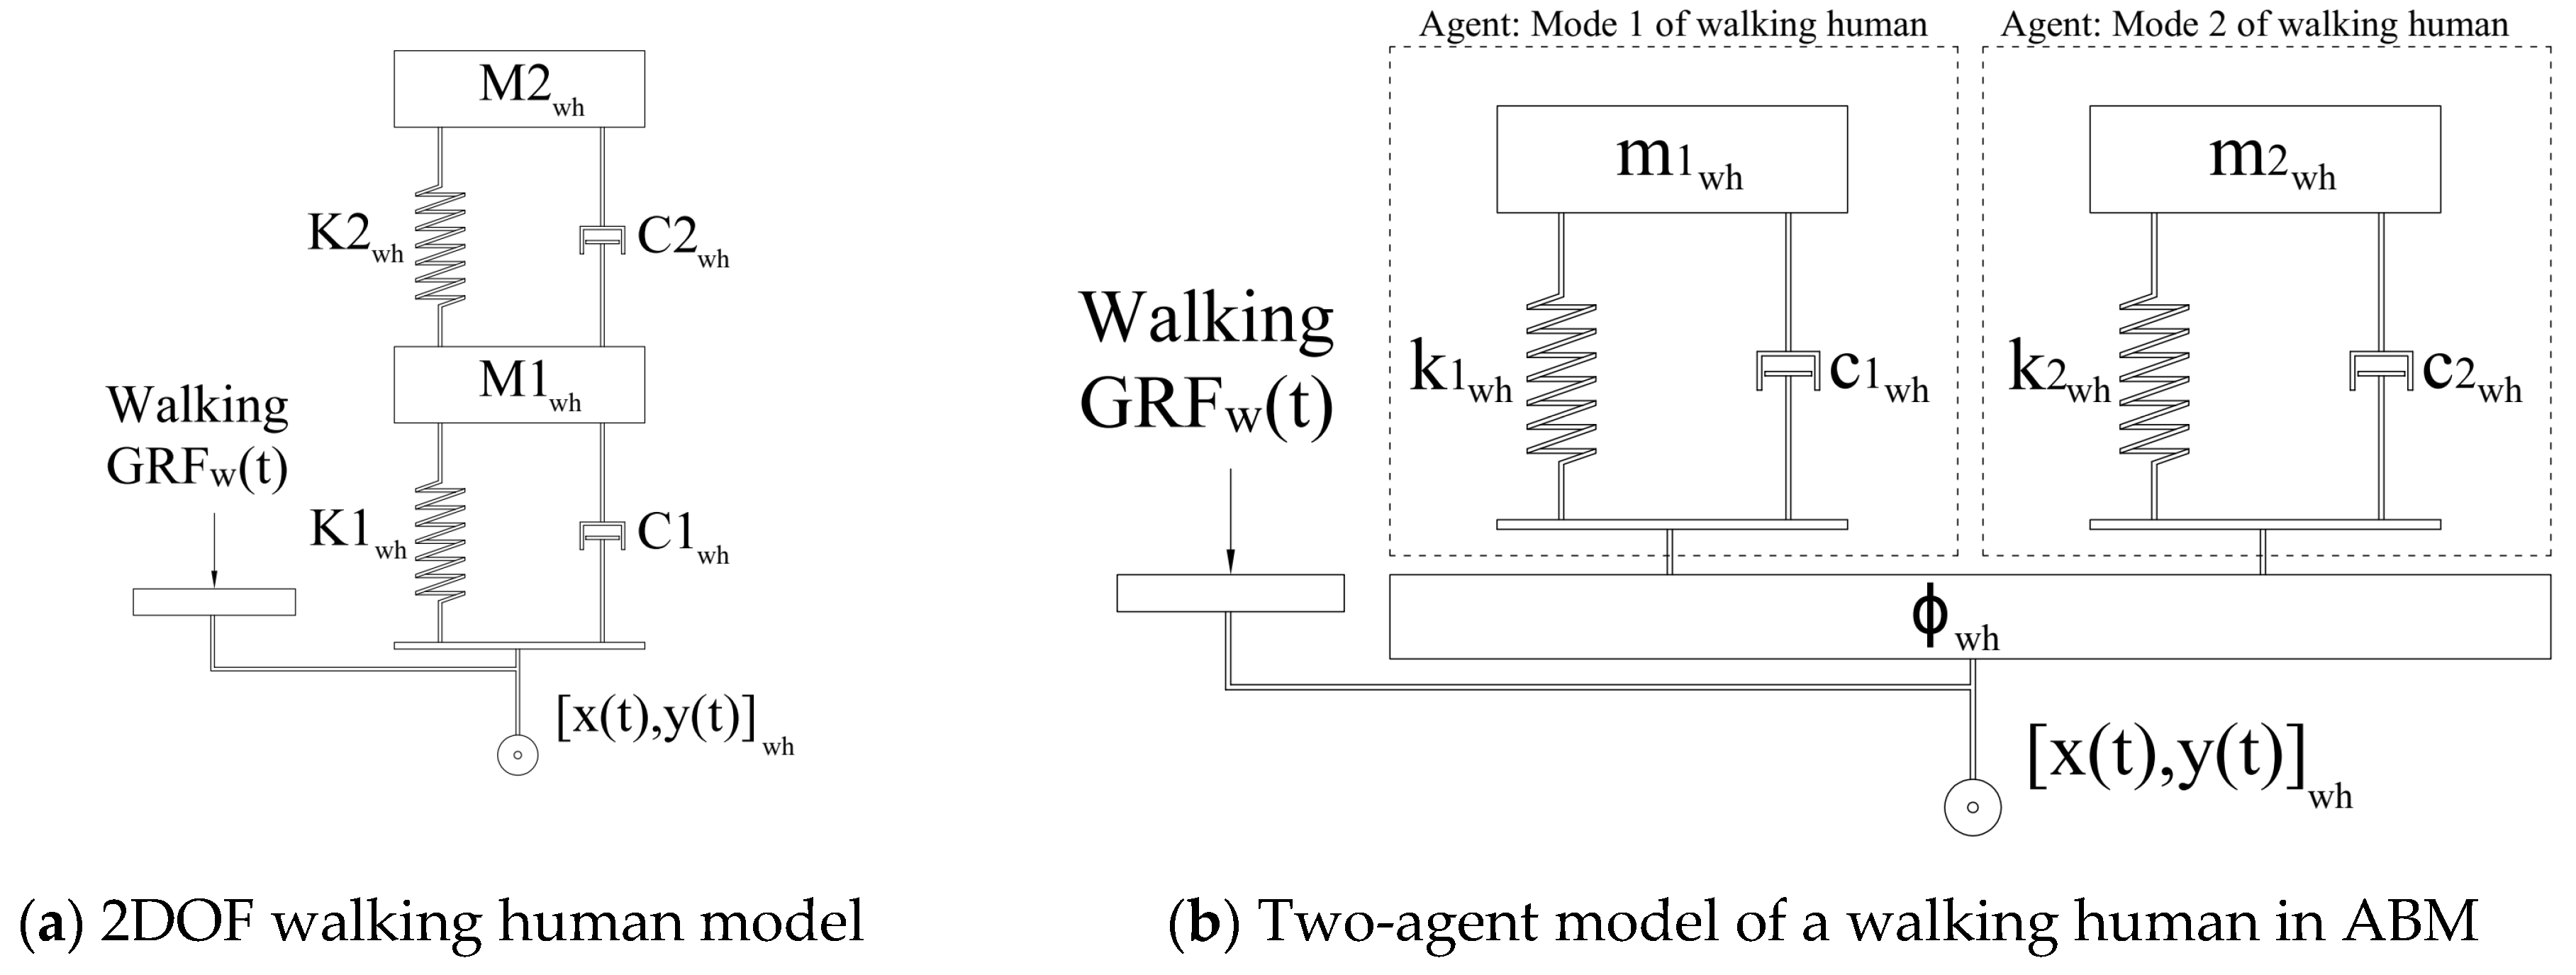
3. Agent-Based Model
3.1. Human-Structure Dynamic Interactions
3.2. Human-Human and Human-Environment Interactions
3.2.1. Social Force Model
3.2.2. SFM Quantitative Validation
4. AVSA Framework
4.1. Initialization
- I.
- Modeling structural dynamics
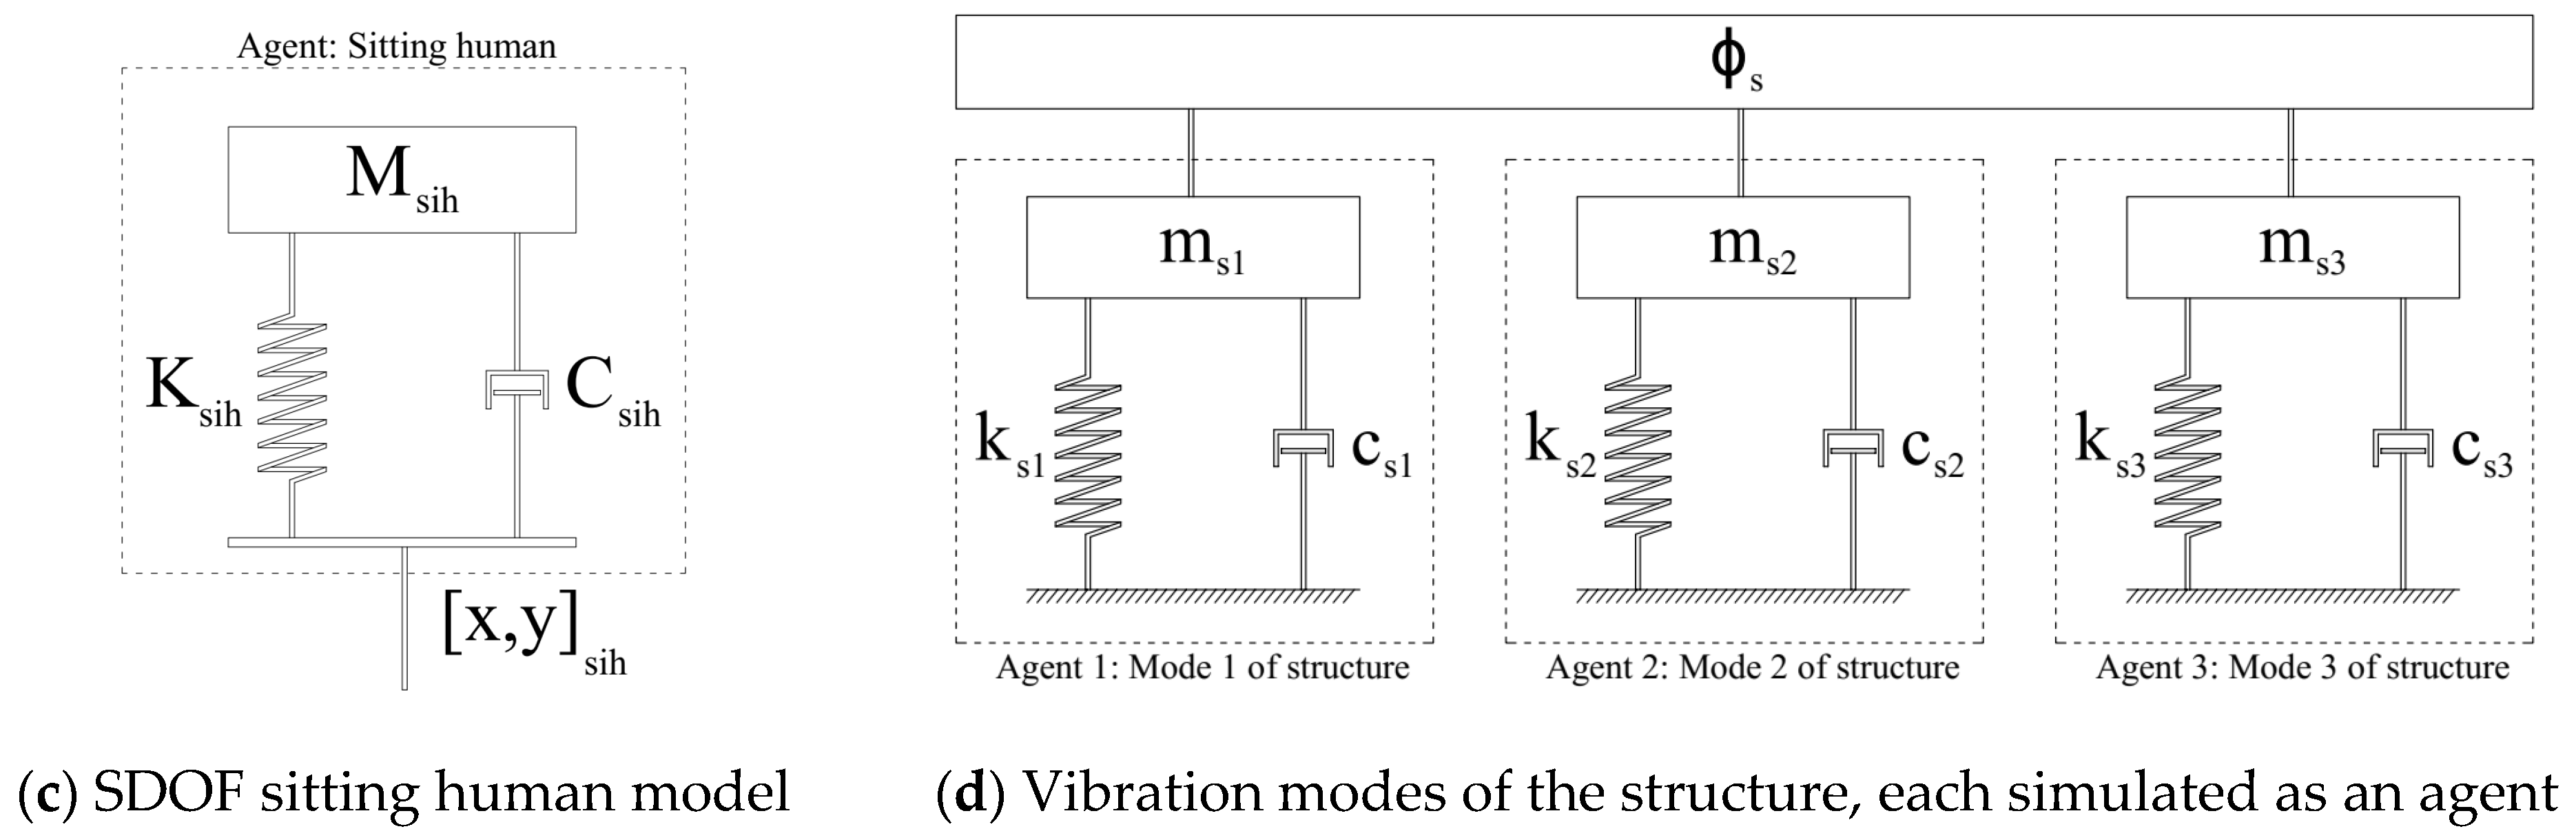
- Determine how many modes of structure are relevant for simulation by analyzing the modal properties of the empty structure. Use an SDOF model to simulate the contribution of each mode.
- II.
- Modeling human dynamics
- Determine the type/s of human posture/s or task/s relevant to the structural usage, e.g., walking, sitting, standing, etc. Assign an appropriate linear mass-spring-damper (MSD) agent model to each task/posture to simulate their dynamics. For instance, use two SDOF agents to represent the dynamics of each walking subject (assuming a 2DOF walking human model), and an SDOF agent to represent a sitting subject.
- Assign a randomly selected (preferably measured) walking set to each of the walking subjects j. The freely available online measured walking force datasets can be used as the source.
- III.
- Modeling human-environment interactions using SFM
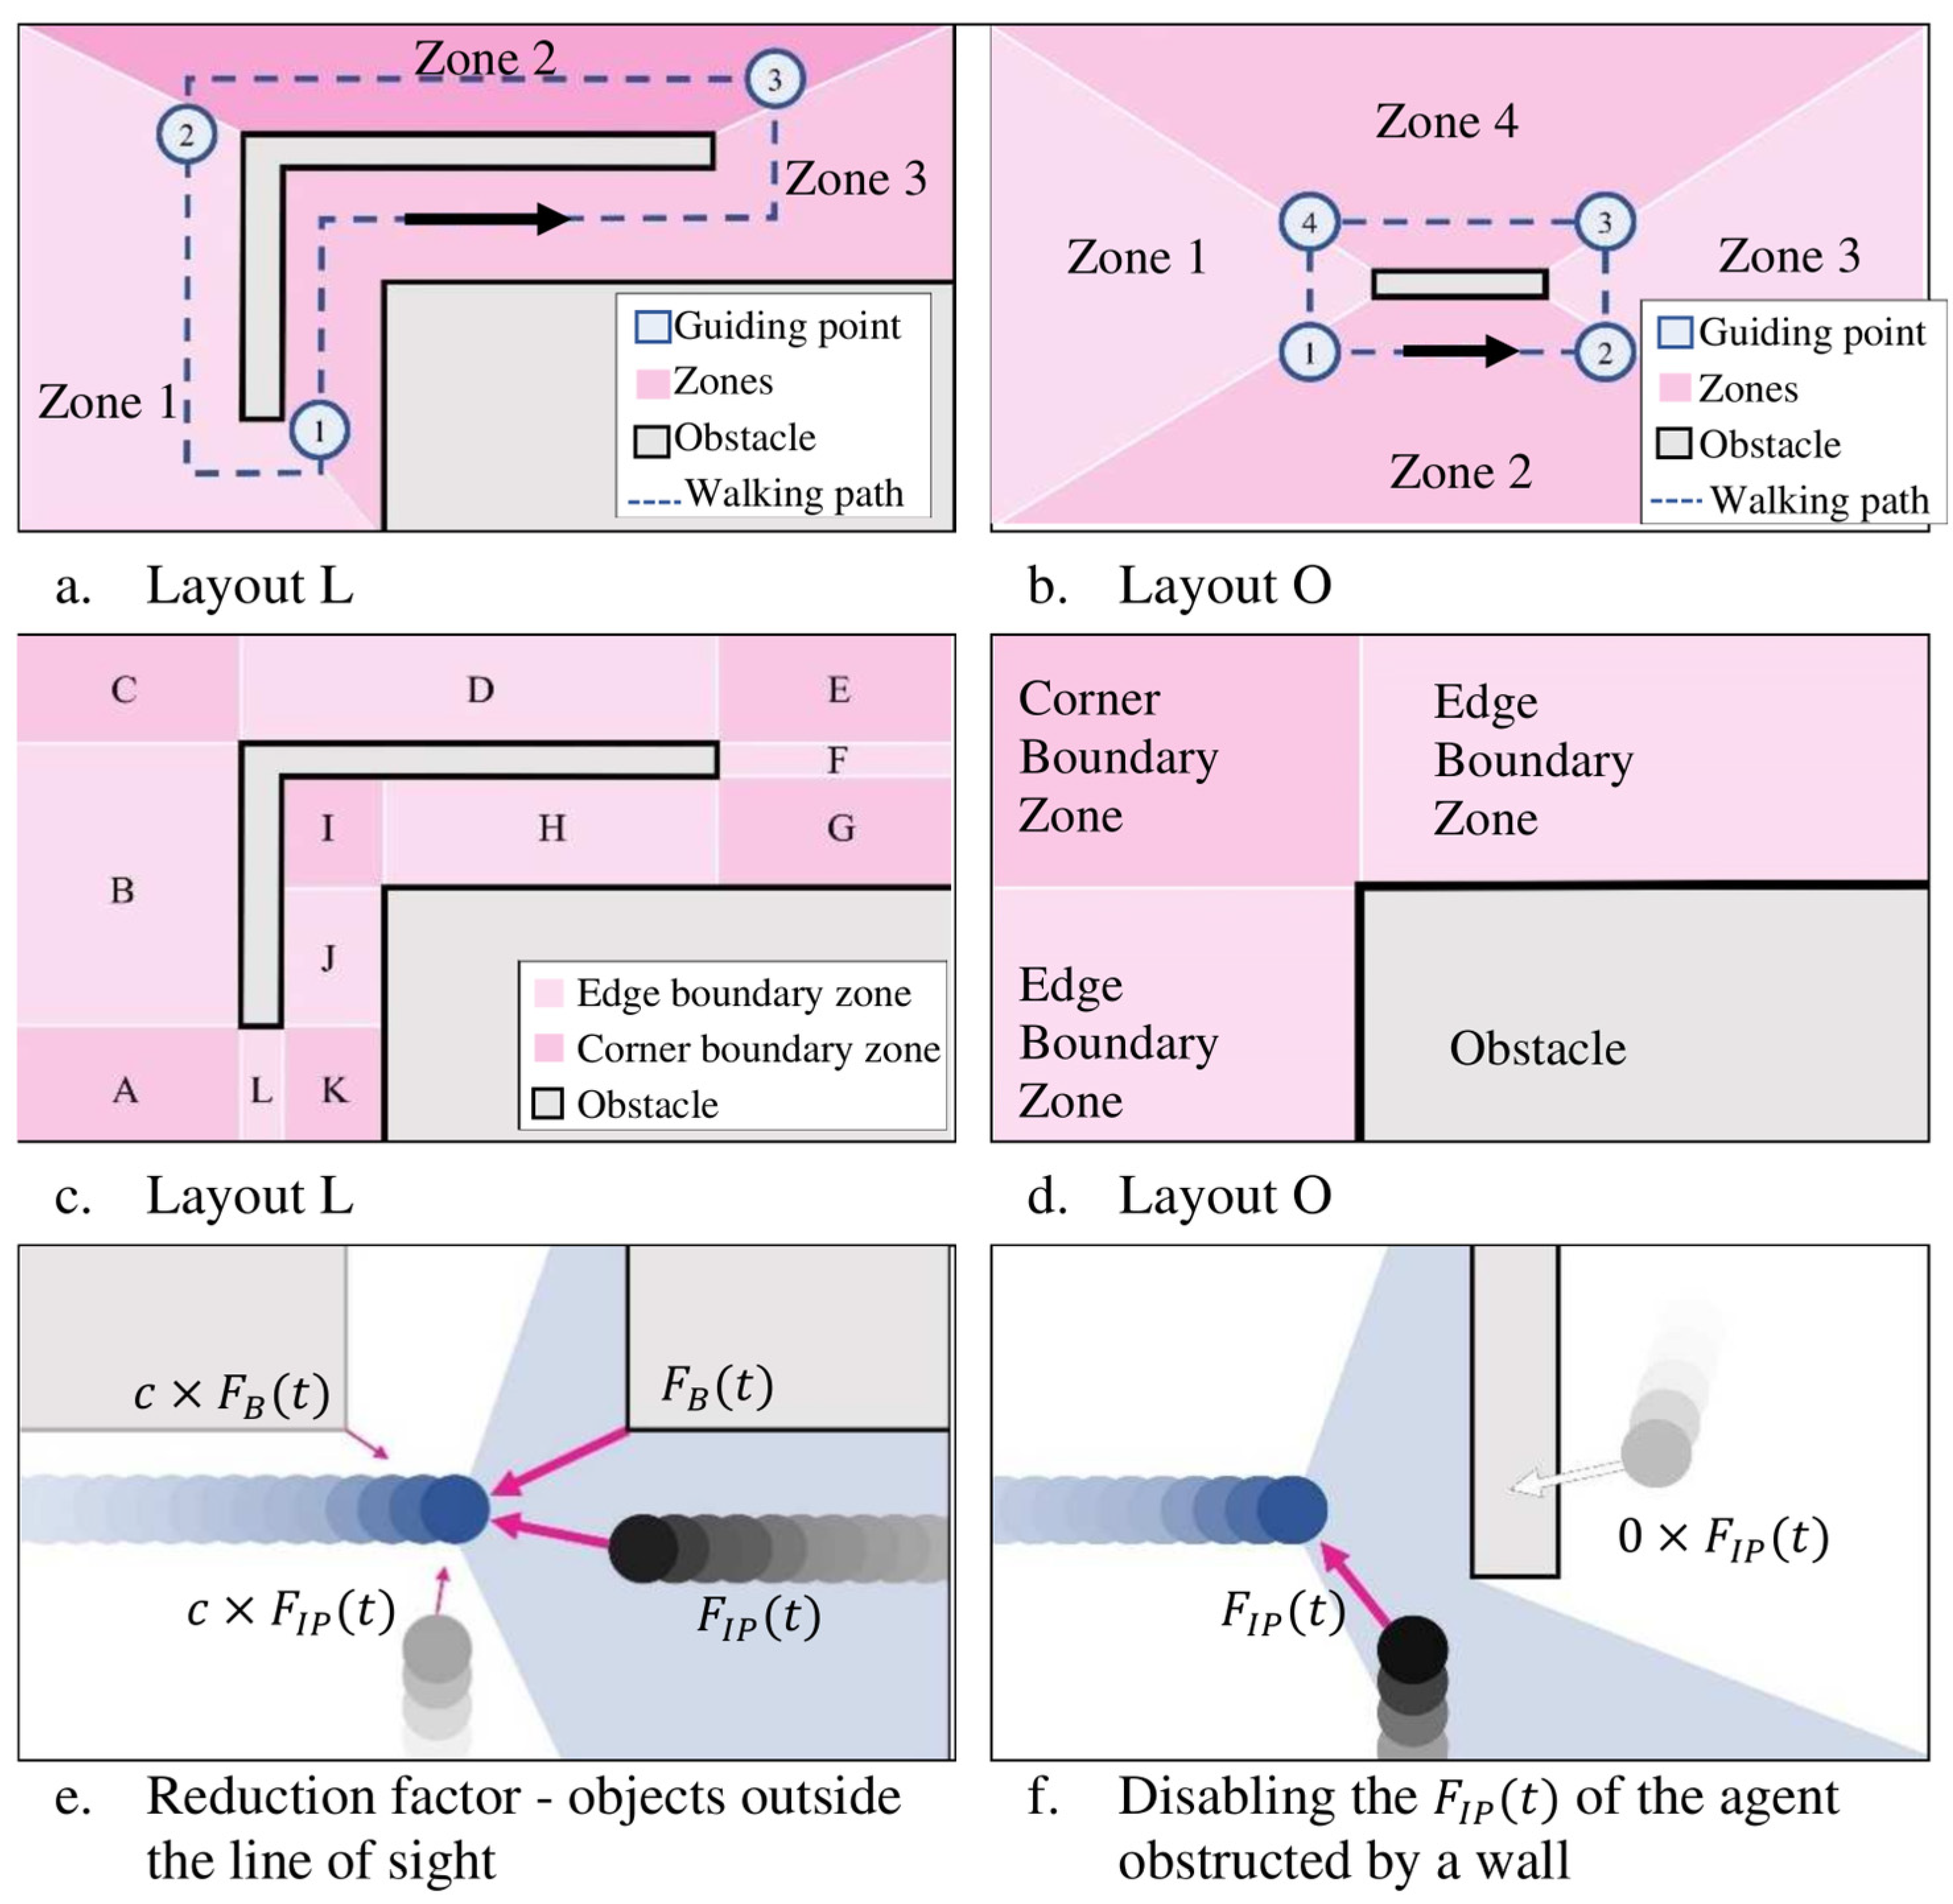
- Define the floor plan and geometry of the walkways, boundaries, obstacles, and the location of entrance and exit points.
- Divide the walkway into a set of zones, each containing a guiding point at their exit to define the motive force equation.
- Define the ‘edge’ and ‘corner’ boundary zones and formulate the boundary force equation for each zone.
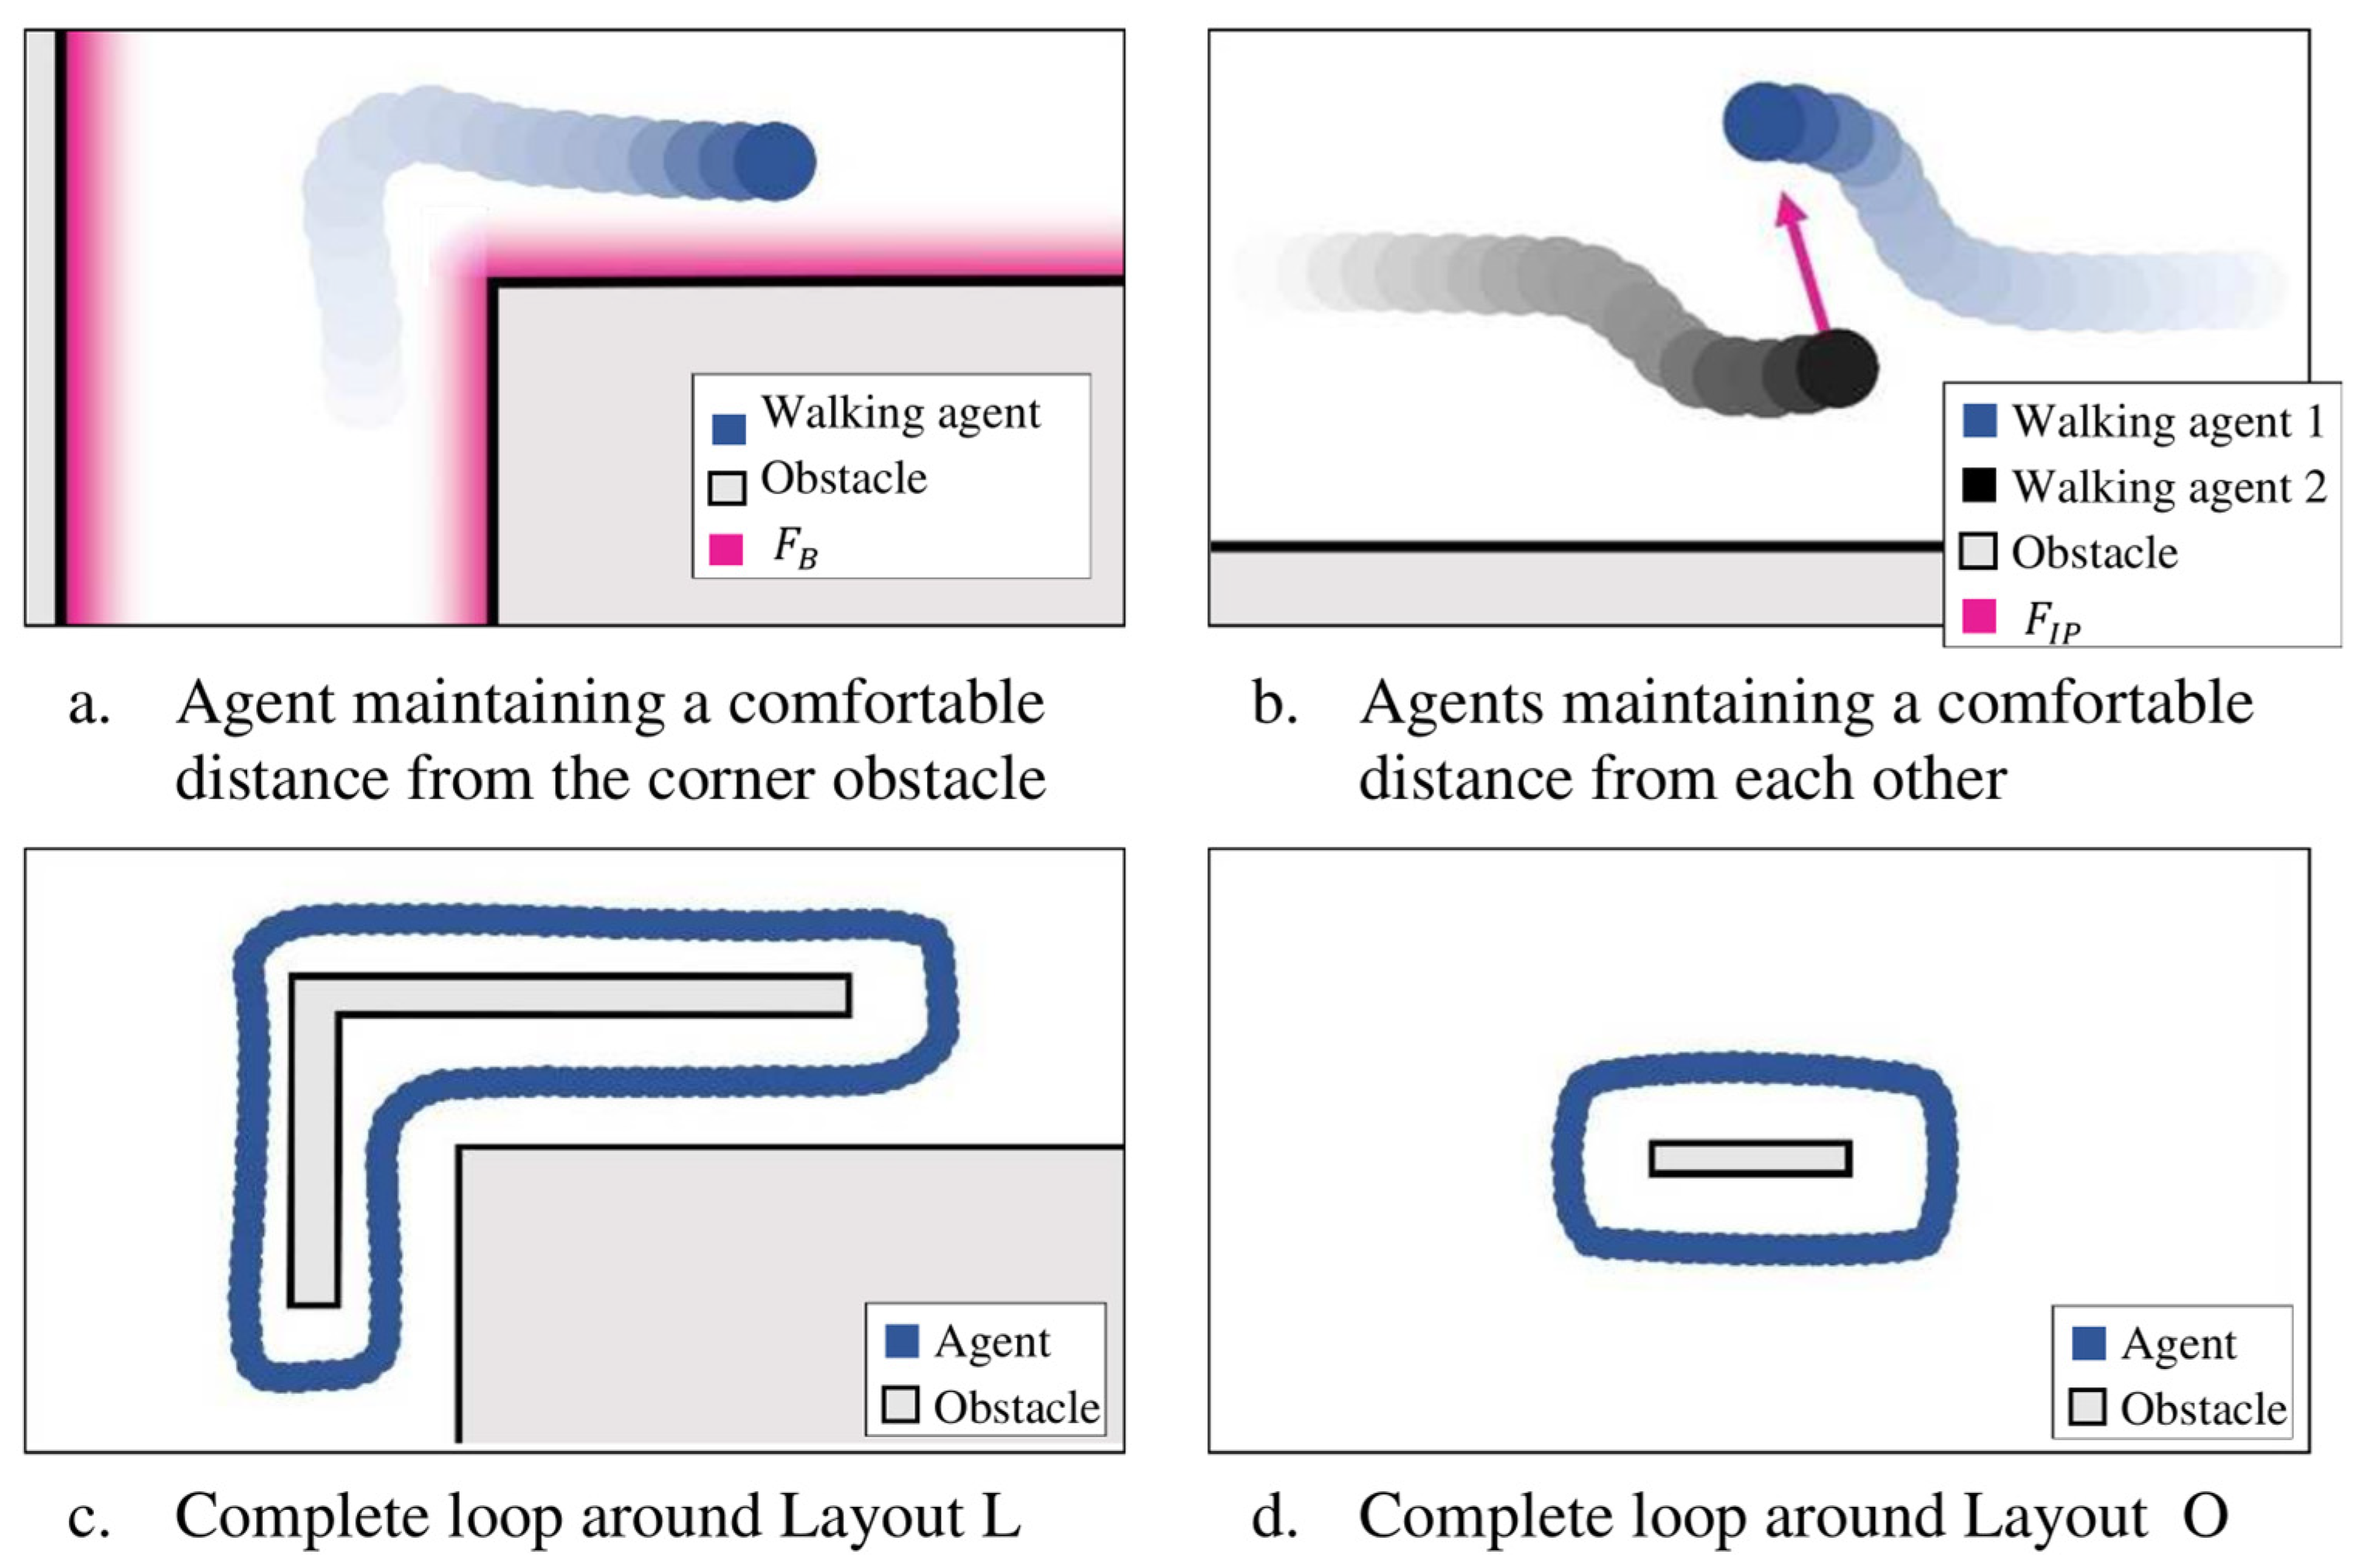
- Formulate the equation for inter-pedestrian force and the resultant force . determines the heading, velocity, and position of each subject on the floor in each time step .
- Define the set value or the statistical distribution that determines the number of human subjects entering, exiting, or present on the structure and their posture/task.
4.2. Response Simulation
- I.
- Set the next time step (step ‘i’).
- II.
- SFM was run to calculate the new position of each walking subject ‘j’ on the floor and their walking speed based on their interactions with other agents and the environment.
- III.
- Each walking person ‘j’ was moved to their new location .
- IV.
- For each walking subject ‘j’, their was used to find the walking force magnitude from their pre-assigned pool of GRFs.
- V.
- The physical acceleration response of the structure from the previous timestep was transmitted to each human model (both sitting and walking) based on their location on the floor. This response is felt by each human ‘j’ as the base excitation calculated using the modal acceleration response from the previous timestep () and the mode shape ordinates at the location of human ‘j’ () for each mode ‘q’ of the structure:
- VI.
- For each walking human:
- The mode shape was used to calculate the modal base excitation experienced by mode one and two of the walking human.
- The modal response of the two human modes was calculated using the Newmark integration method [30]. This was performed by taking the previous timestep displacement and velocity as initial conditions for the current step.
- The physical acceleration response of the walking human masses and were calculated from the corresponding modal responses using .
- The of the 2DoF human model was calculated:
- VII.
- For each sitting human:
- The response of the SDOF sitting human model to the base excitation at the location of each sitting subject ‘j’ was calculated using the Newmark integration method [30]. This was performed by taking the previous timestep displacement and velocity as initial conditions for the current step.
- The of the SDOF sitting human model was calculated:
- VIII.
- The total force experienced by each mode ‘q’ of the structure is calculated using , taking into account and of each walking subject, of each sitting subject, and the shaker force :
- IX.
- The response of each mode of the structure was then calculated using the Newmark integration method [30], using the displacement and velocity of the previous timestep as initial conditions for the current timestep:
- X.
- The process was repeated.
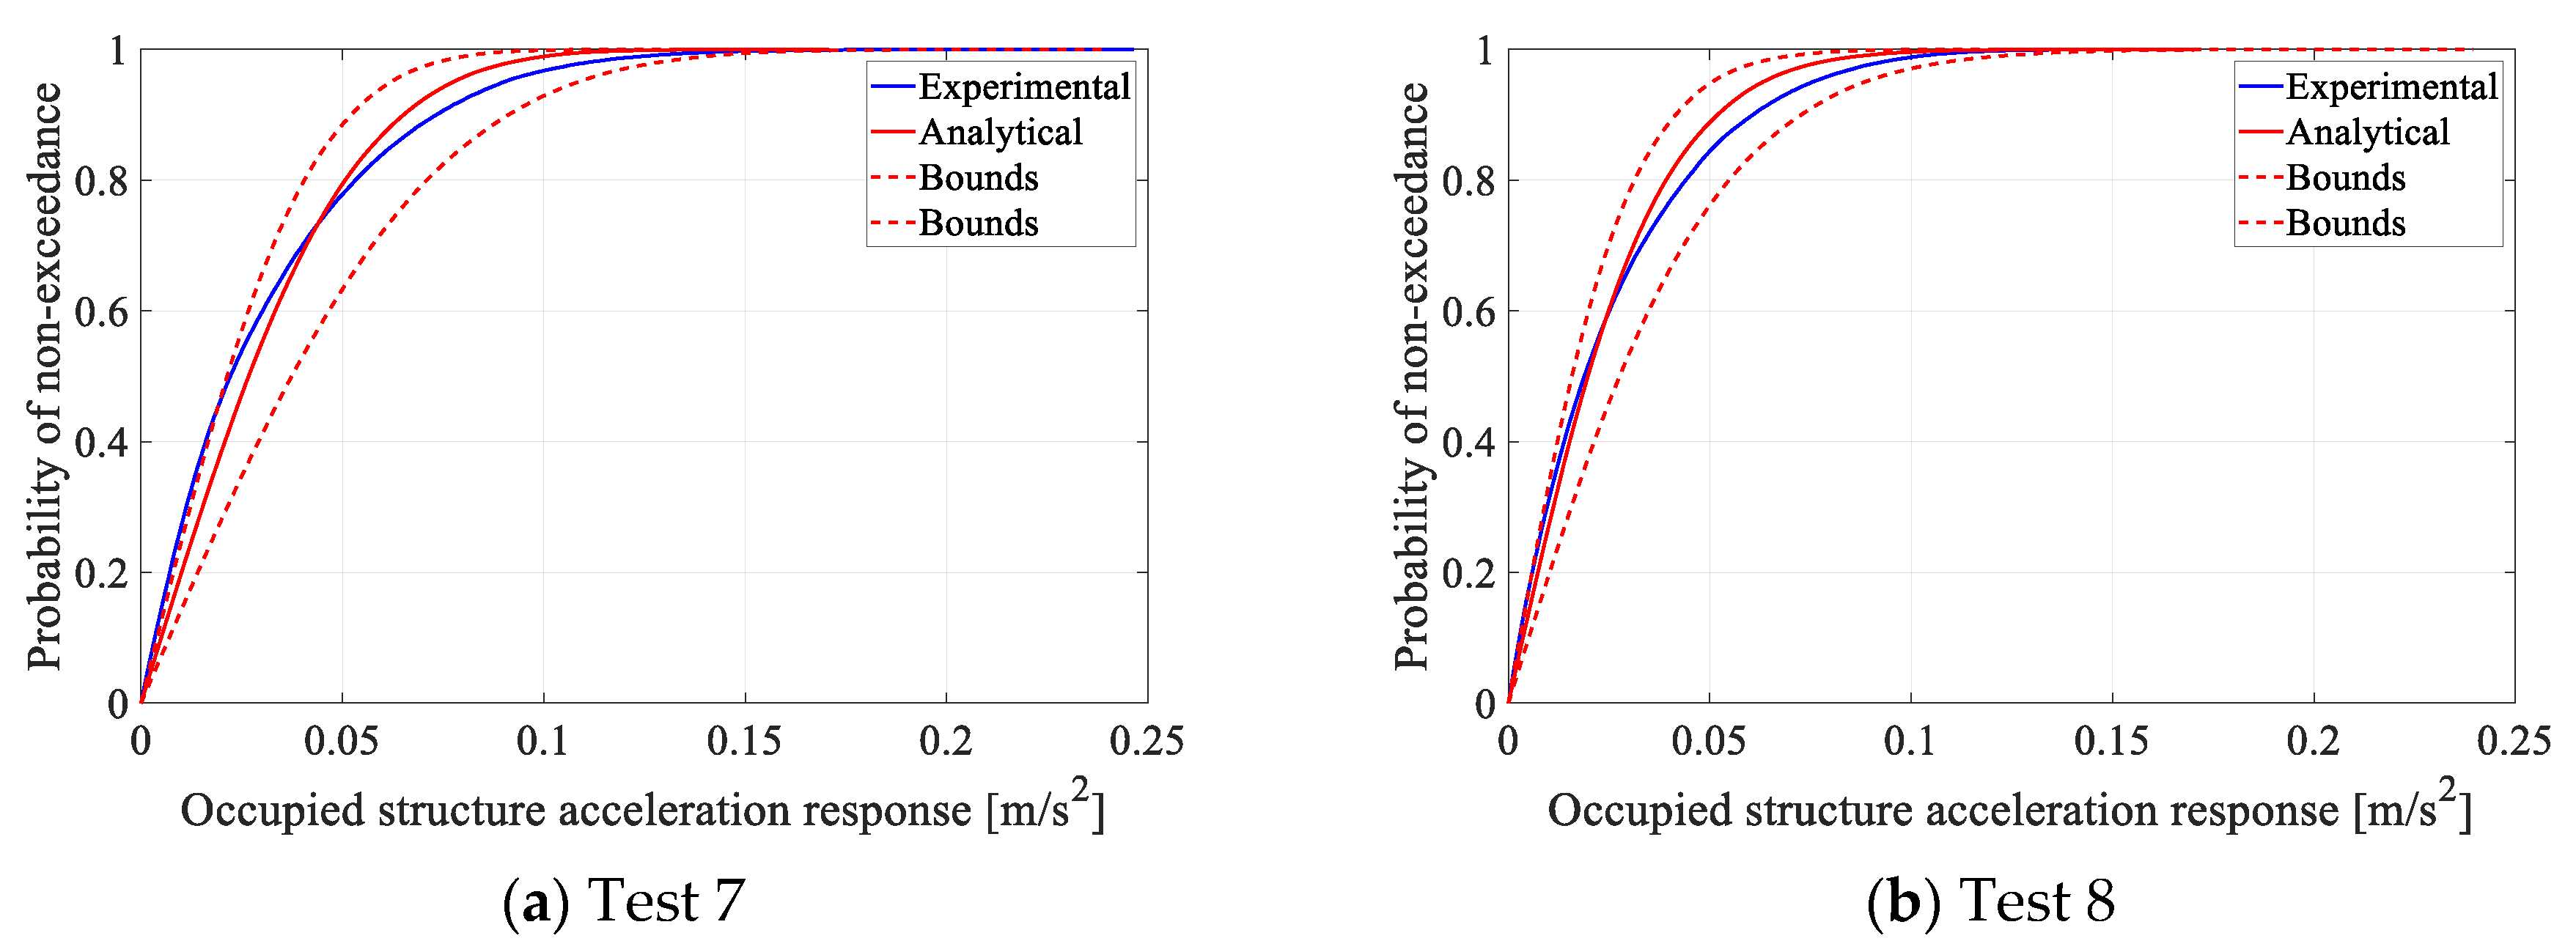
4.3. Vibration Serviceability Assessment
5. Experimental Verification
6. Conclusions
Author Contributions
Funding
Institutional Review Board Statement
Informed Consent Statement
Data Availability Statement
Conflicts of Interest
Nomenclature
| Symbol/acronym | Description |
| HSI | Human-Structure Interactions |
| HEI | Human-Environment Interactions |
| HHI | Human-Human Interactions |
| HSEI | Human-Structure-Environment Interactions |
| VSA | Vibration Serviceability Assessment |
| I-VSA | Interaction-based Vibration Serviceability Assessment method |
| AVSA | Agent-based Vibration Serviceability Assessment method |
| FRF | Frequency Response Function |
| CDF | Cumulative Distribution Function |
| ML CDF | Moving-Location Cumulative Distribution Function |
| RM | Response monitoring test |
| TP | Test point |
| ABM | Agent-Based Model |
| SDOF | Single degree of freedom |
| DoF | Degree of freedom |
| GRF | Ground reaction force (walking) |
| SFM | Social Force Model |
| Mass | |
| Damping coefficient | |
| Stiffness | |
| Walking human | |
| Sitting human | |
| Interaction force | |
| Time | |
| Coordinates of each person on the floor at time t | |
| Walking speed, heading velocity | |
| Resultant force (SFM) | |
| Motive force (SFM) | |
| Inter-pedestrian force (SFM) | |
| Boundary force (SFM) | |
| Agent reaction time (SFM) | |
| Mass constant (SFM) | |
| Force constant (SFM) | |
| Distance constant (SFM) | |
| Agent personal radius in inter-personal interaction (SFM) | |
| Agent personal radius in relation to boundaries (SFM) | |
| Distance of the agent from the edge (SFM) | |
| Distance of the agent from the corner (SFM) | |
| Field of view reduction factor (SFM) | |
| Unity-normalized mode shape magnitude | |
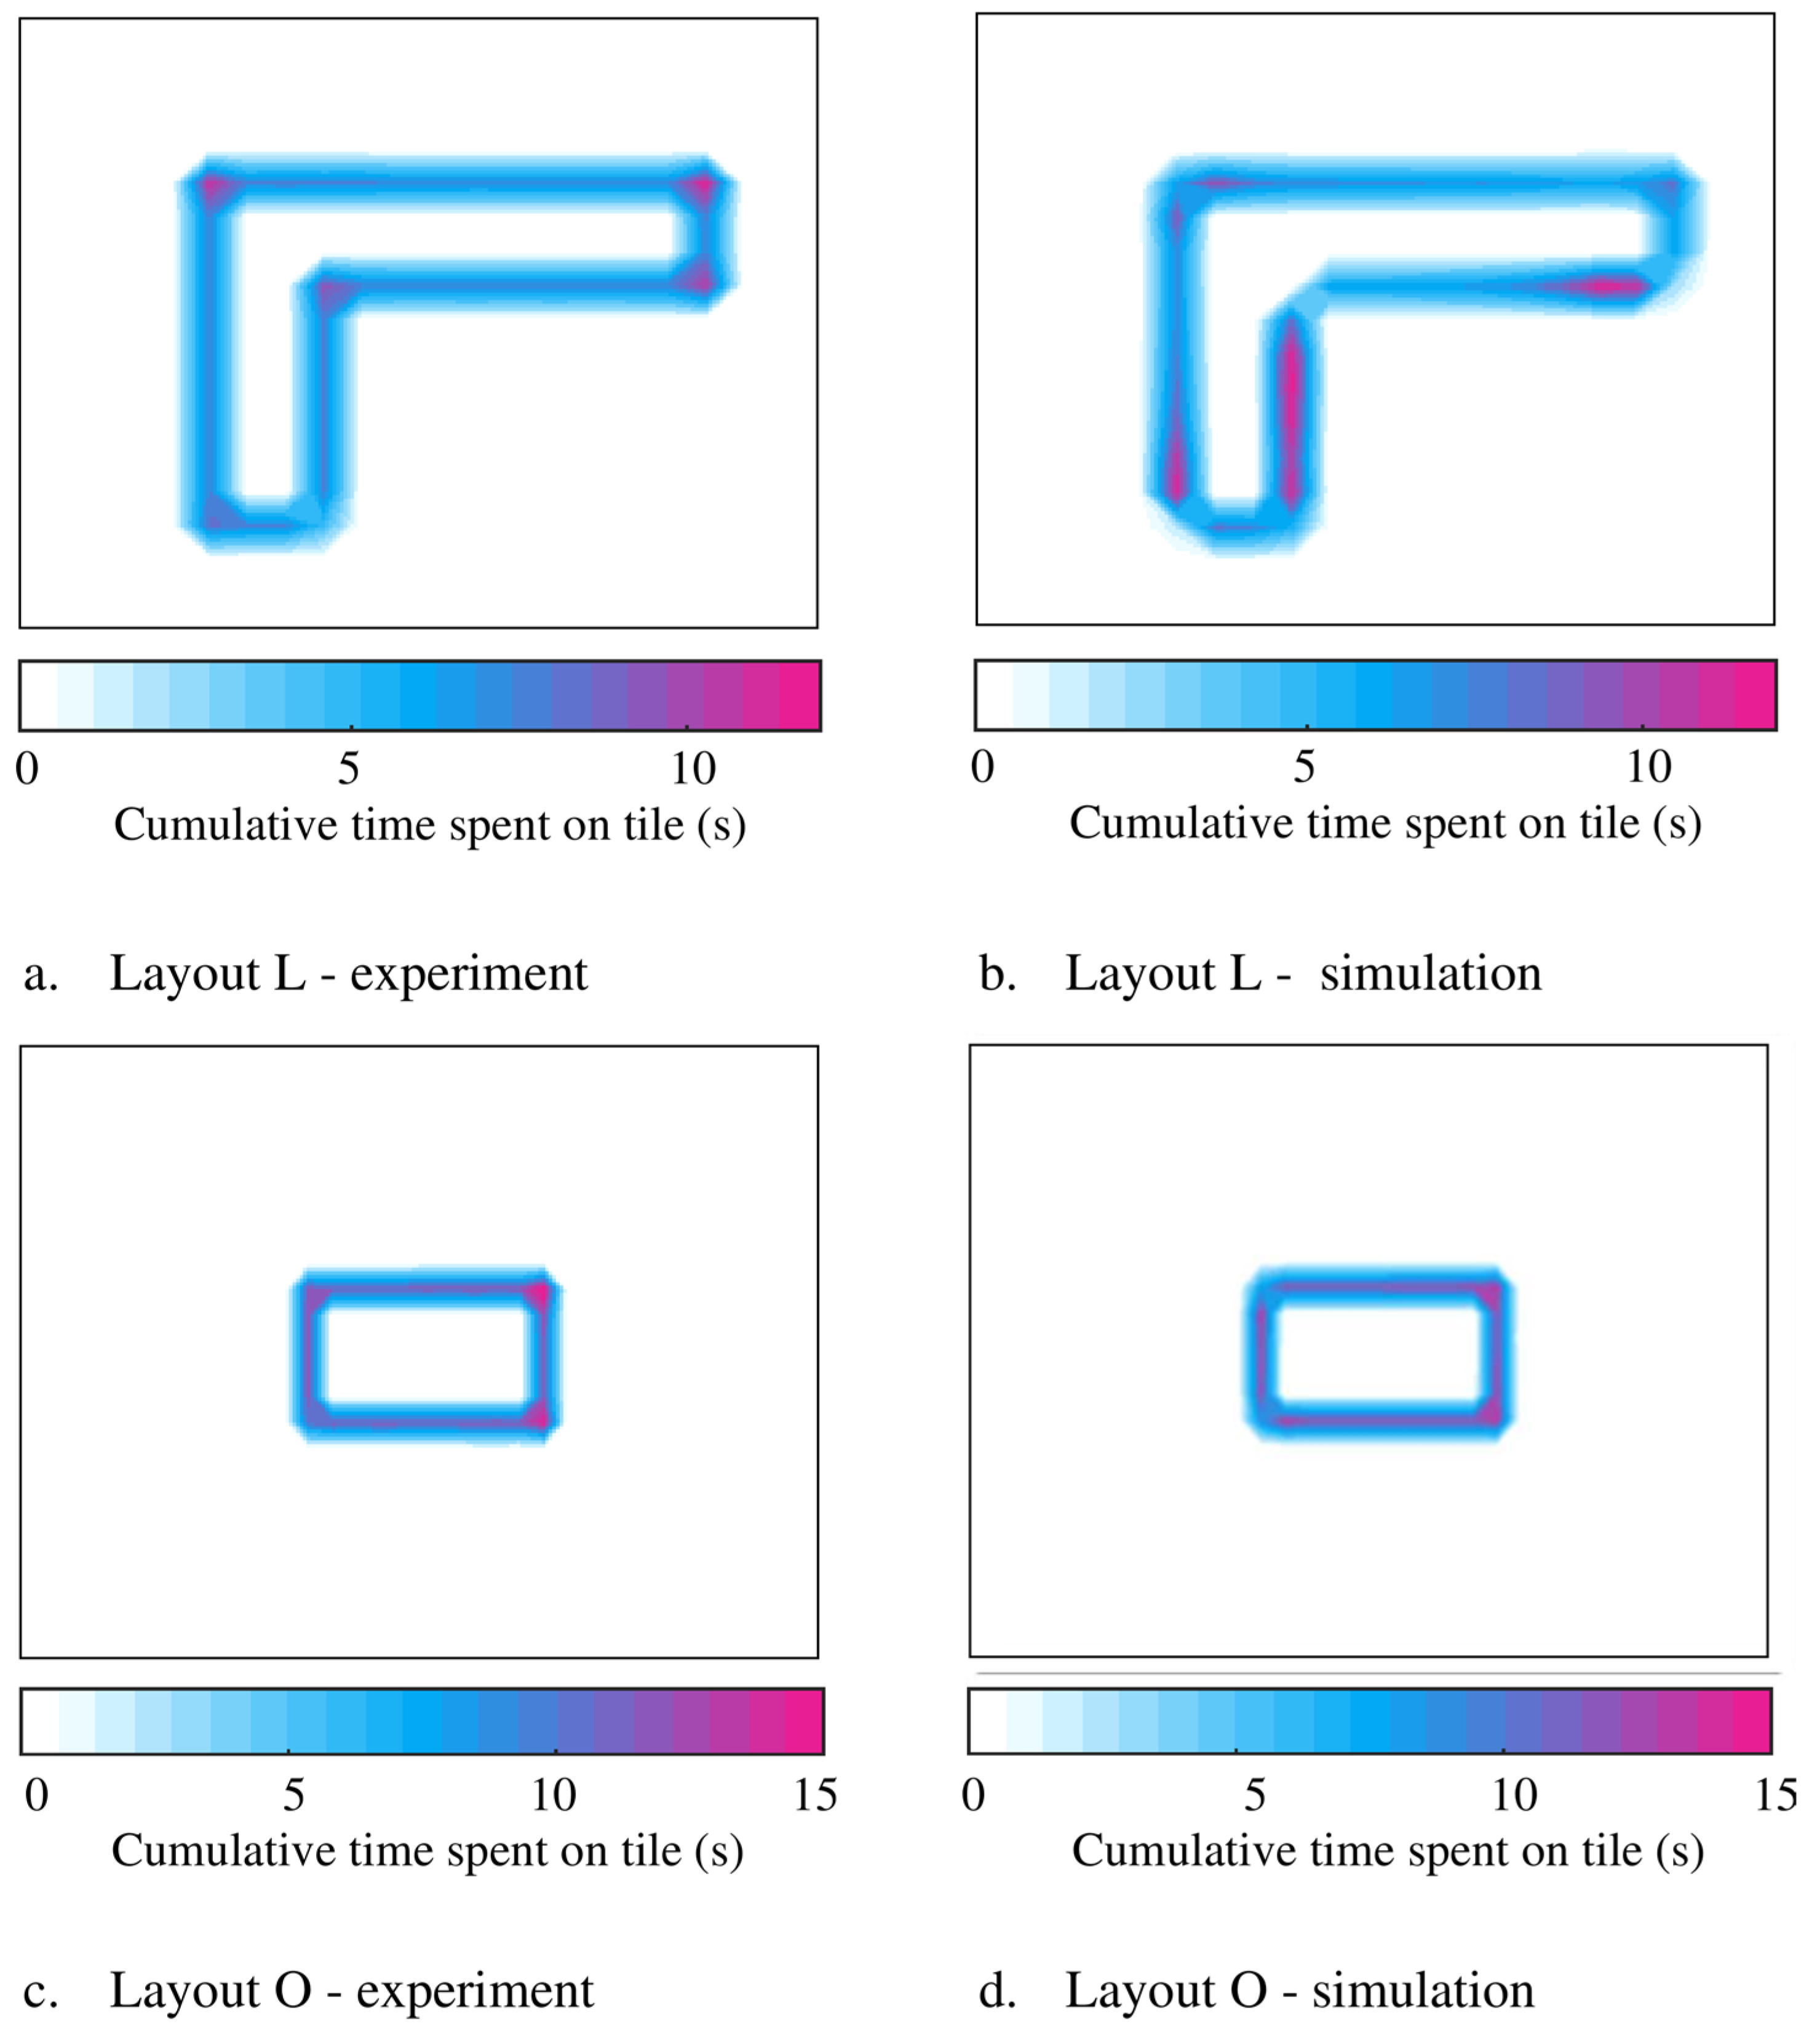
| Total time all subjects have spent in each of the mode-shape zones during each test (simulation) | |
| Total time all subjects have spent in each of the mode-shape zones during each test (experimental) | |
| Error value | |
| Modal frequency | |
| Modal damping ratio | |
| Modal mass | |
| Change in modal frequency | |
| W | Walking |
| S | Sitting |
| Acceleration in the vertical direction | |
| Shaker force | |
| of structure | |
| Mean value | |
| Standard deviation |
References
- Ahmadi, E.; Caprani, C.; Živanović, S.; Evans, N.; Heidarpour, A. A framework for quantification of human-structure interaction in vertical direction. J. Sound Vib. 2018, 432, 351–372. [Google Scholar] [CrossRef]
- Muhammad, Z.; Reynolds, P.; Avci, O.; Hussein, M. Review of Pedestrian Load Models for Vibration Serviceability Assessment of Floor Structures. Vibration 2018, 2, 1–24. [Google Scholar] [CrossRef]
- Fitzpatrick, A.; Dallard, P.; le Bourva, S.; Low, A.; Ridsill Smith, R.; Willford, M. Linking London: The Millennium Bridge; The Royal Academy of Engineering: London, UK, 2001. [Google Scholar]
- Živanović, S.; Pavić, A. Probabilistic modeling of walking excitation for building floors. J. Perform. Constr. Facil. 2009, 23, 132–143. [Google Scholar] [CrossRef]
- Zivanovic, S.; Diaz, I.M.; Pavic, A. Influence of Walking and Standing Crowds on Structural Dynamic Properties. In Proceedings of the IMAC-XXVII, Orlando, FL, USA, 9–12 February 2009. [Google Scholar]
- Shahabpoor, E.; Pavic, A.; Racic, V. Using MSD model to simulate human-structure interaction during walking. In Conference Proceedings of the Society for Experimental Mechanics Series; Springer: New York, NY, USA, 2013. [Google Scholar]
- Kasperski, M. Damping Induced by Pedestrians. In Proceedings of the 9th International EURODYN Conference, Porto, Portugal, 30 June–2 July 2014. [Google Scholar]
- Shahabpoor, E.; Pavic, A.; Racic, V.; Zivanovic, S. Effect of group walking traffic on dynamic properties of pedestrian structures. J. Sound Vib. 2017, 387, 207–225. [Google Scholar] [CrossRef]
- Mohammed, A.; Pavic, A. Human-structure dynamic interaction between building floors and walking occupants in vertical direction. Mech. Syst. Signal Process. 2021, 147, 107036. [Google Scholar] [CrossRef]
- Ahmadi, E.; Caprani, C.; Živanović, S.; Heidarpour, A. Experimental validation of moving spring-mass-damper model for human-structure interaction in the presence of vertical vibration. Structures 2021, 29, 1274–1285. [Google Scholar] [CrossRef]
- do Nascimento Gonzaga, I.B.; Pfeil, M.S.; Varela, W.D. Modal parameters to estimate the dynamic response of footbridges considering the human-structure interaction. Eng. Struct. 2025, 323, 119271. [Google Scholar] [CrossRef]
- Liang, H.; Xie, W.; Wei, P.; Zhou, Y.; Zhang, Z. Identification of Human Body Dynamics from a Human-Structure System: An Experimental Study. Exp. Tech. 2023, 47, 449–470. [Google Scholar] [CrossRef]
- Wang, Z.; Wen, J.; Kou, C.; Huo, H.; Chen, A.; Fan, B. Vertical human-structure interaction of a simply-supported steel-glass composite footbridge under both standing and moving pedestrians. Structures 2022, 47, 1212–1224. [Google Scholar] [CrossRef]
- Carlsöö, S. The effect of vibration on the skeleton, joints and muscles. A review of the literature. Appl. Ergon. 1982, 13, 251–258. [Google Scholar] [CrossRef]
- Ortiz, A.R.; Caicedo, J.M. Modeling the effects of a human standing on a structure using a closed loop–control system. J. Eng. Mech. 2019, 145, 04019025. [Google Scholar] [CrossRef]
- Griffin, M. Handbook of Human Vibration; Academic Press: London, UK, 1990. [Google Scholar]
- Shahabpoor, E.; Pavic, A.; Racic, V. Identification of walking human model using agent-based modelling. Mech. Syst. Signal Process. 2018, 103, 352–367. [Google Scholar] [CrossRef]
- Carroll, S.; Owen, J.; Hussein, M. Experimental identification of the lateral human–structure interaction mechanism and assessment of the inverted-pendulum biomechanical model. J. Sound Vib. 2014, 333, 5865–5884. [Google Scholar] [CrossRef]
- Mohammed, A.S.; Pavic, A. Simulation of People’s Movements on Floors Using Social Force Model. In Conference Proceedings of the Society for Experimental Mechanics Series; Pakzad, S., Ed.; Dynamics of Civil Structures; Springer: Cham, Switzerland, 2019; Volume 2, p. 2. [Google Scholar] [CrossRef]
- Zhang, X.; Yang, W.; Zhu, Q.; Chen, Z. Dynamic Effect of Bidirectional Crowd Behavior on Footbridges Considering Human–Structure Interaction. J. Bridg. Eng. 2024, 30, 04024103. [Google Scholar] [CrossRef]
- Bocian, M.; Burn, J.F.; Macdonald, J.H.; Brownjohn, J.M. From phase drift to synchronisation–pedestrian stepping behaviour on laterally oscillating structures and consequences for dynamic stability. J. Sound Vib. 2017, 392, 382–399. [Google Scholar] [CrossRef]
- Alzubaidi, A.T.; Caicedo, J.M. Modeling human-structure interaction using control models. In Conference Proceedings of the Society for Experimental Mechanics Series; Springer: Cham, Switzerland, 2019; Volume 2, pp. 183–190. [Google Scholar] [CrossRef]
- Calonge, J.D.; Gomez, D.; Ortiz, A.R. Robust feedback models with structured uncertainties for human–structure interaction. Mech. Syst. Signal Process. 2023, 202, 110681. [Google Scholar] [CrossRef]
- Bayat, E.; Tubino, F. Human-induced vibrations of floors: A probabilistic approach. Eng. Struct. 2024, 300, 117198. [Google Scholar] [CrossRef]
- Shahabpoor, E.; Pavic, A.; Racic, V. Structural vibration serviceability: New design framework featuring human-structure interaction. Eng. Struct. 2017, 136, 295–311. [Google Scholar] [CrossRef]
- Gonçalves, M.S.; Pavic, A.; Pimentel, R.L. Vibration serviceability assessment of office floors for realistic walking and floor layout scenarios: Literature review. Adv. Struct. Eng. 2020, 23, 1238–1255. [Google Scholar] [CrossRef]
- Hudson, E.; Reynolds, P. Design and Construction of a Reconfigurable Pedestrian Structure. Exp. Tech. 2017, 41, 203–214. [Google Scholar] [CrossRef]
- APS Dynamics, 2014. APS 400 ELECTRO-SEIS Long Stroke Shaker with Linear Ball Bearings. 2014. Available online: https://www.alliantech.com/img/cms/Product_DataSheet/SPEKTRA/APS_400.pdf (accessed on 10 June 2015).
- Shahabpoor, E.; Pavic, A. Human-structure dynamic interactions: Identification of two-degrees-of-freedom walking human model. J. Sound Vib. 2024, 569, 117974. [Google Scholar] [CrossRef]
- Clough, R.W.; Penzien, J. Dynamics of Structures, 2nd ed.; McGraw-Hill: New York, NY, USA, 1993. [Google Scholar]
- Shahabpoor, E.; Pavic, A.; Racic, V. Identification of mass–spring–damper model of walking humans. Structures 2016, 5, 233–246. [Google Scholar] [CrossRef]
- Helbing, D.; Molnár, P. Social force model for pedestrian dynamics. Phys. Rev. E 1995, 51, 4282–4286. [Google Scholar] [CrossRef] [PubMed]

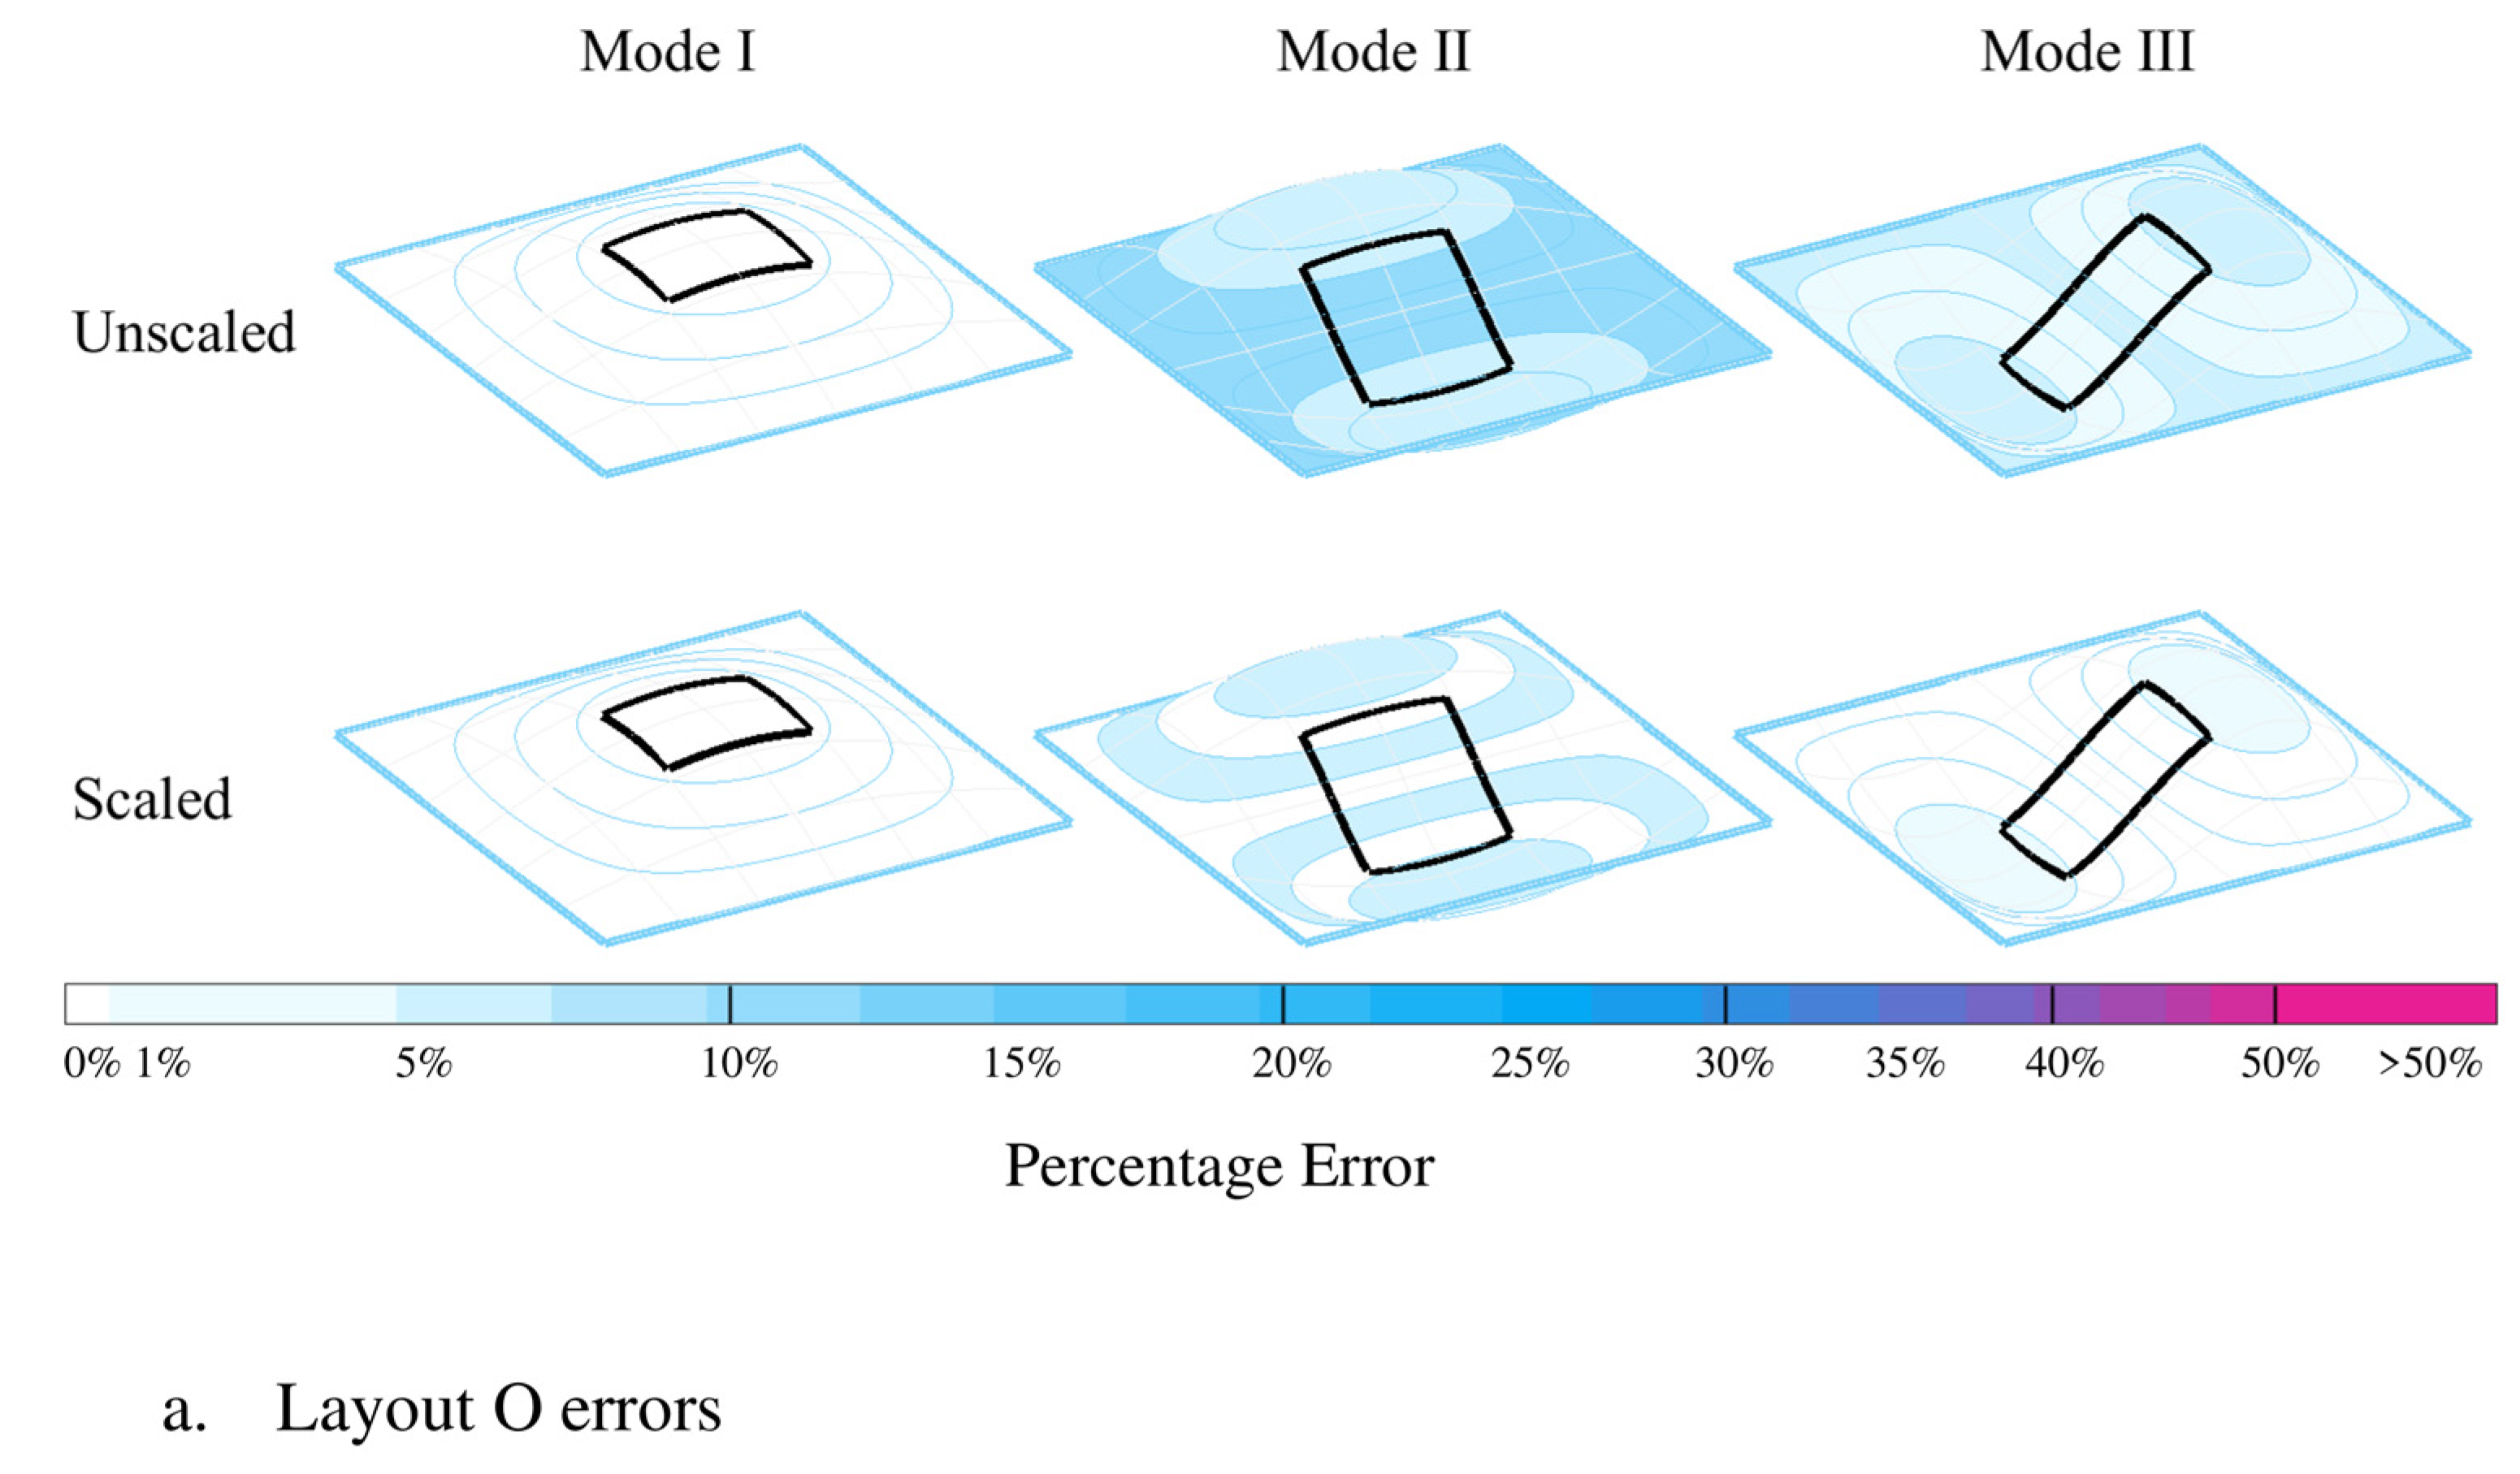
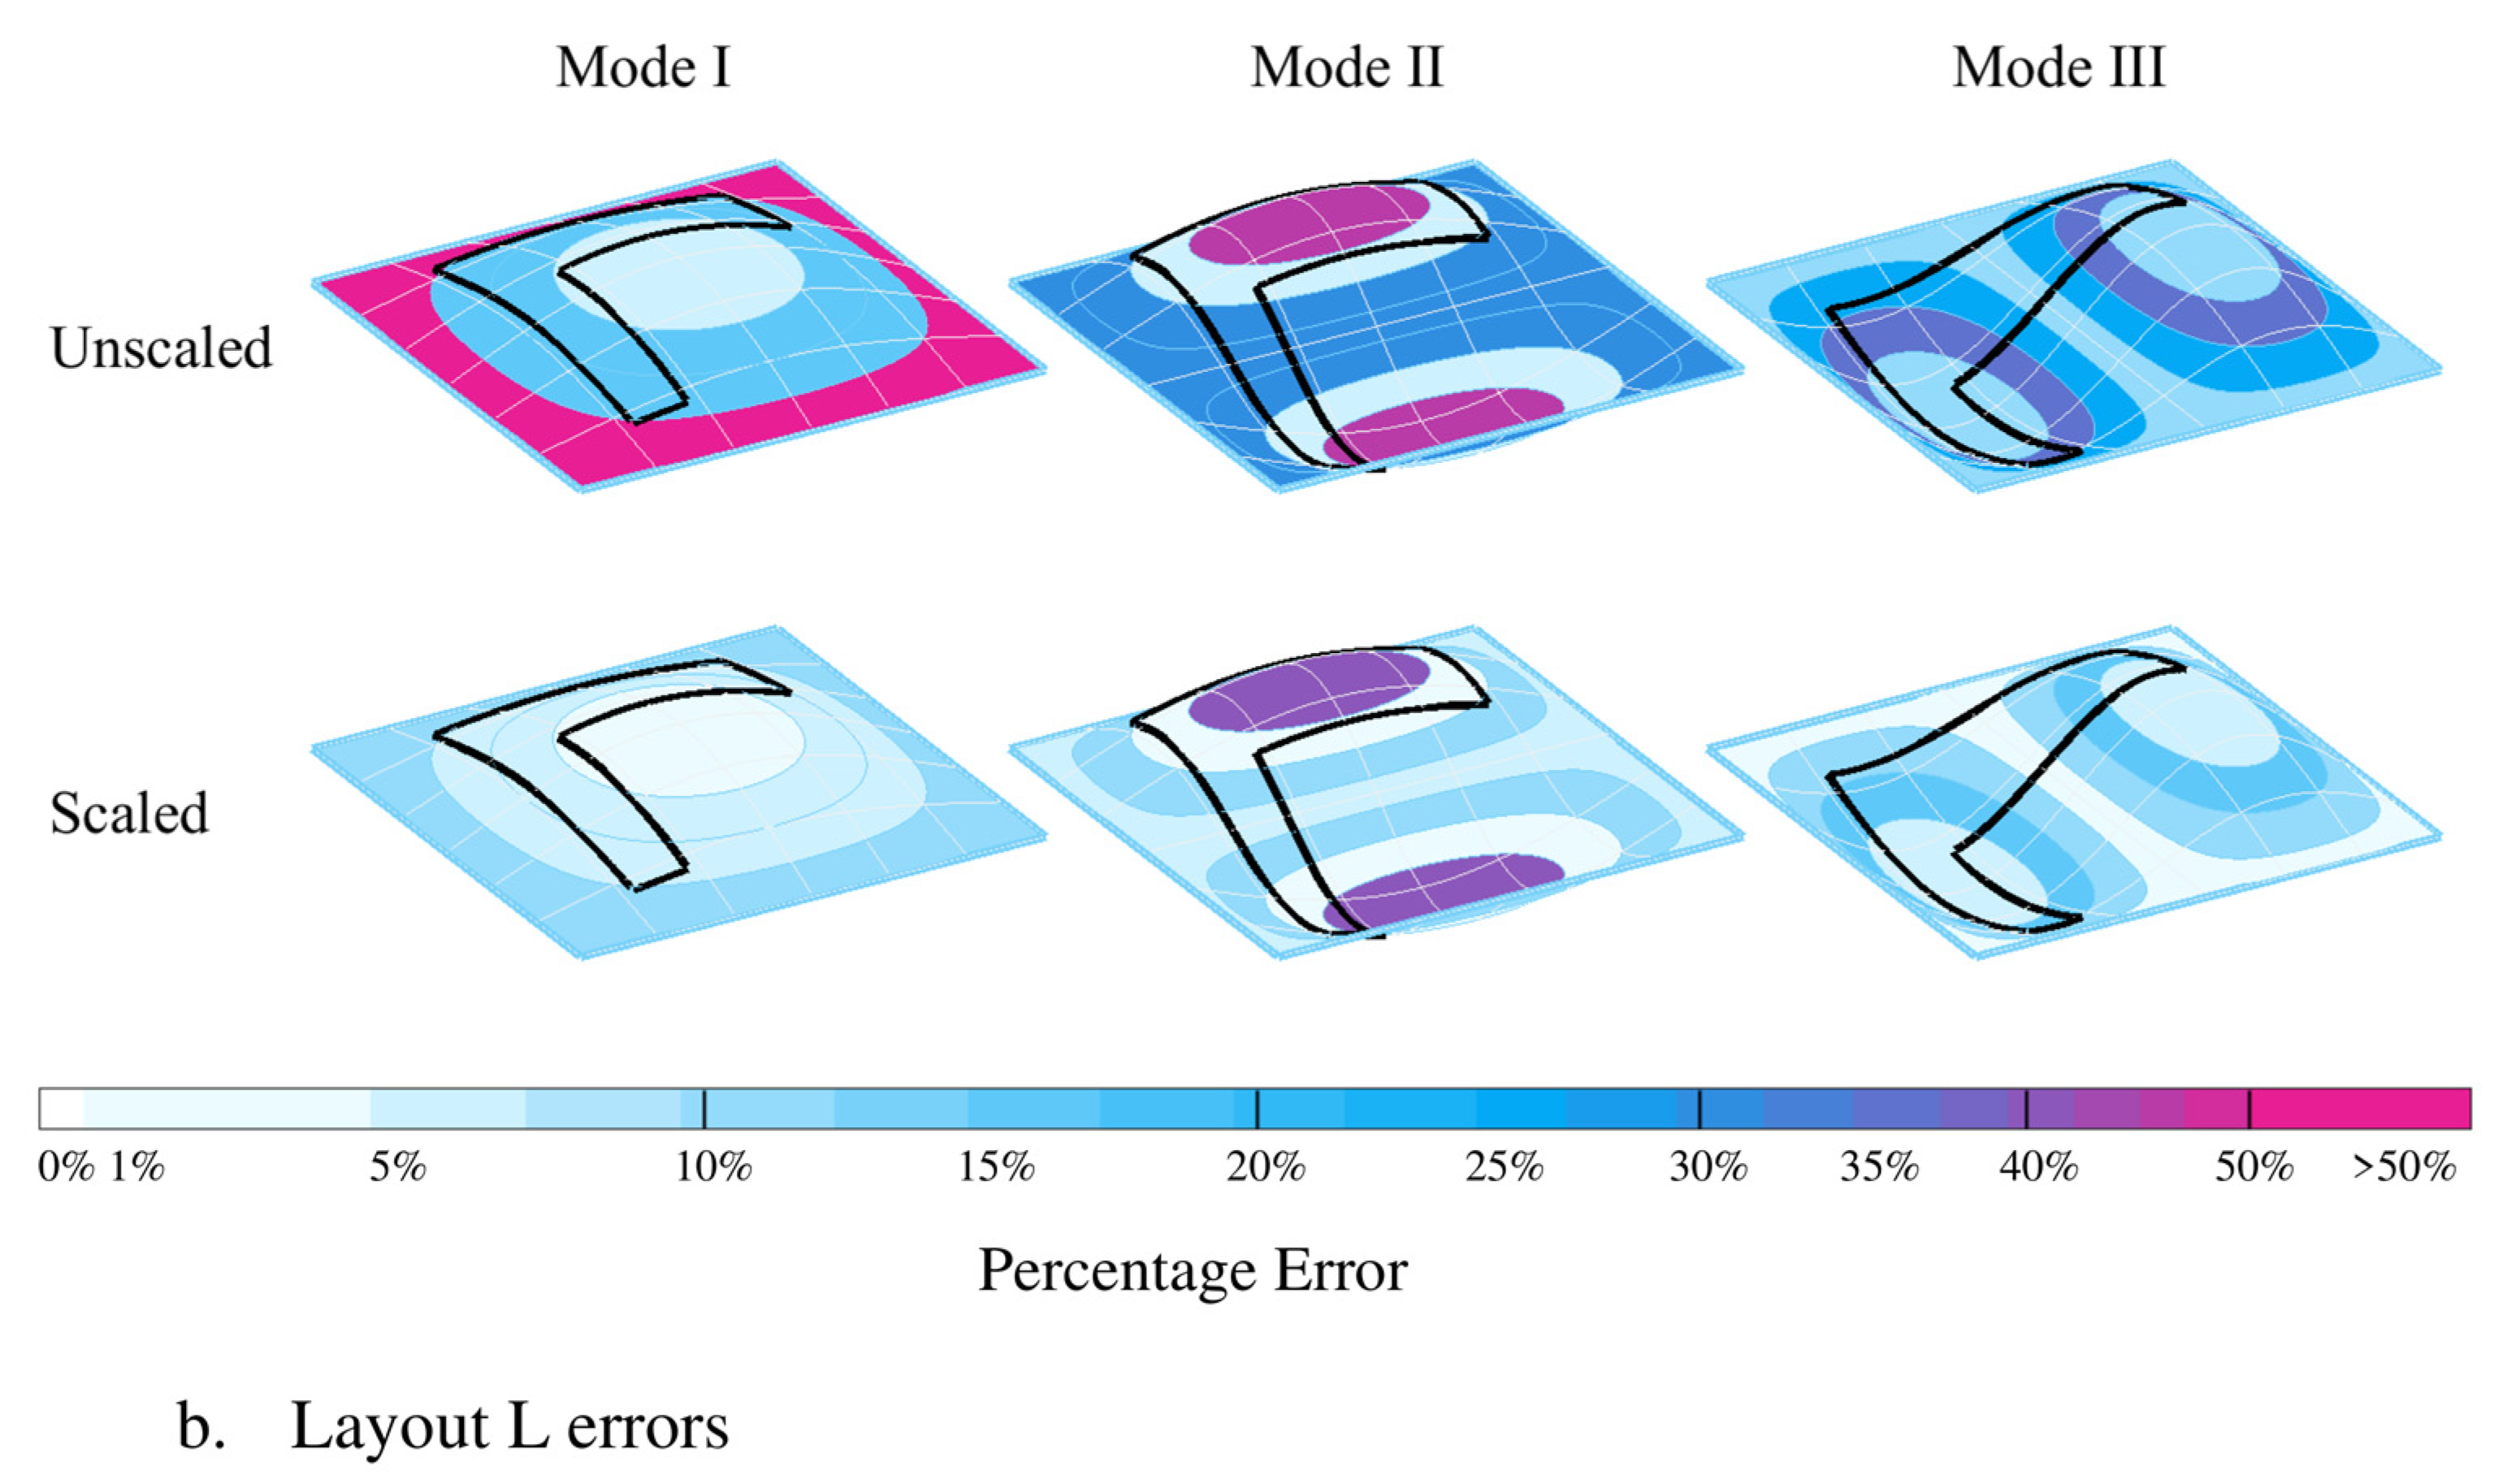
| ID | Description | Mode | Layout | Shape | ||||
|---|---|---|---|---|---|---|---|---|
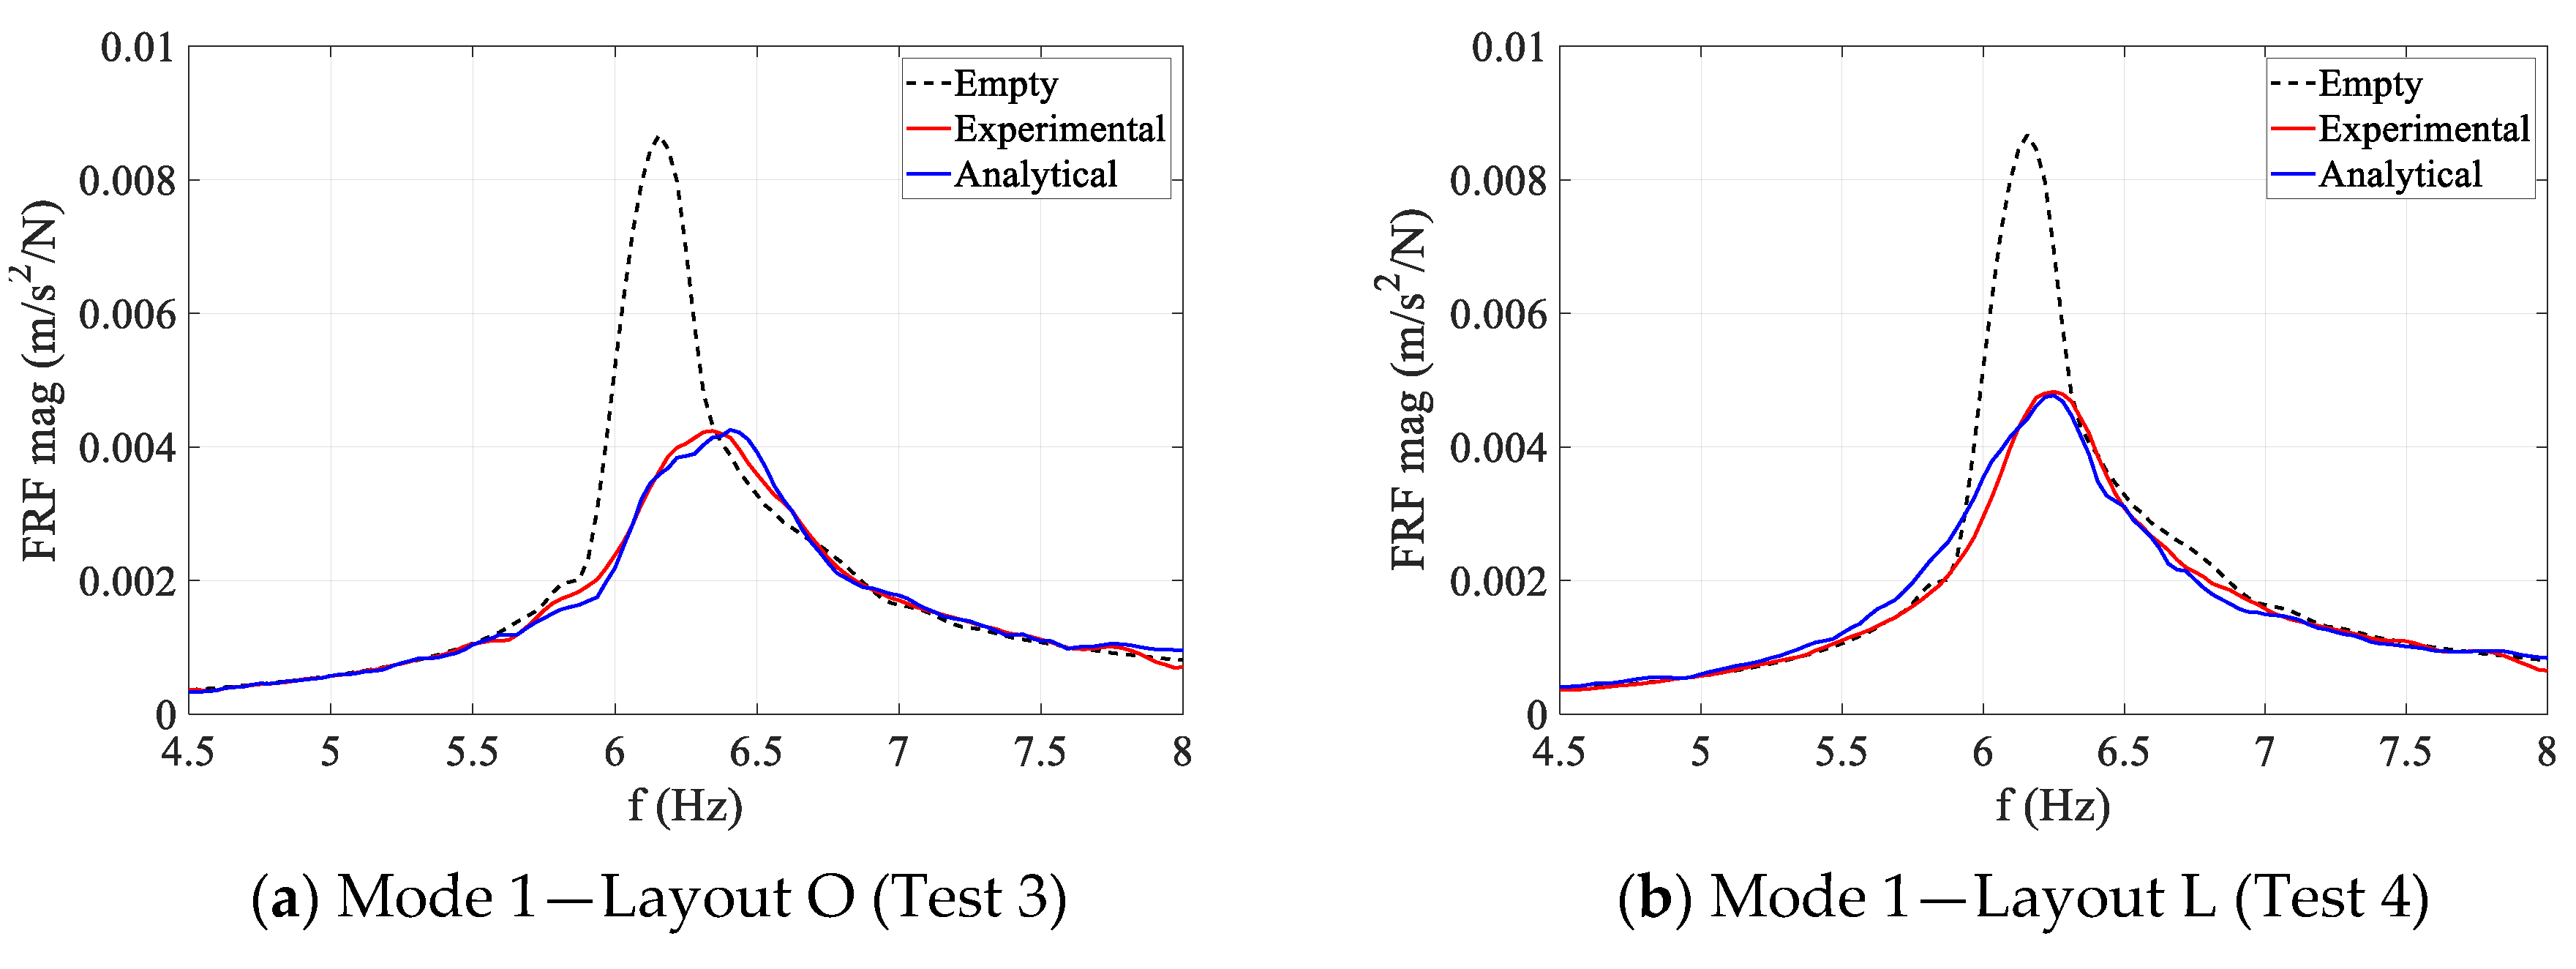
| 01 | FRF—Empty | 1 | - | 6.15 | 1.8 | 3000 | 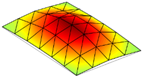 | |
| 03 | FRF—3W-3S | 1 | O | 6.32 | 3.6 | 3175 | 2.8% | |
| 04 | FRF—3W-3S | 1 | L | 6.24 | 3.2 | 3125 | 1.5% | |
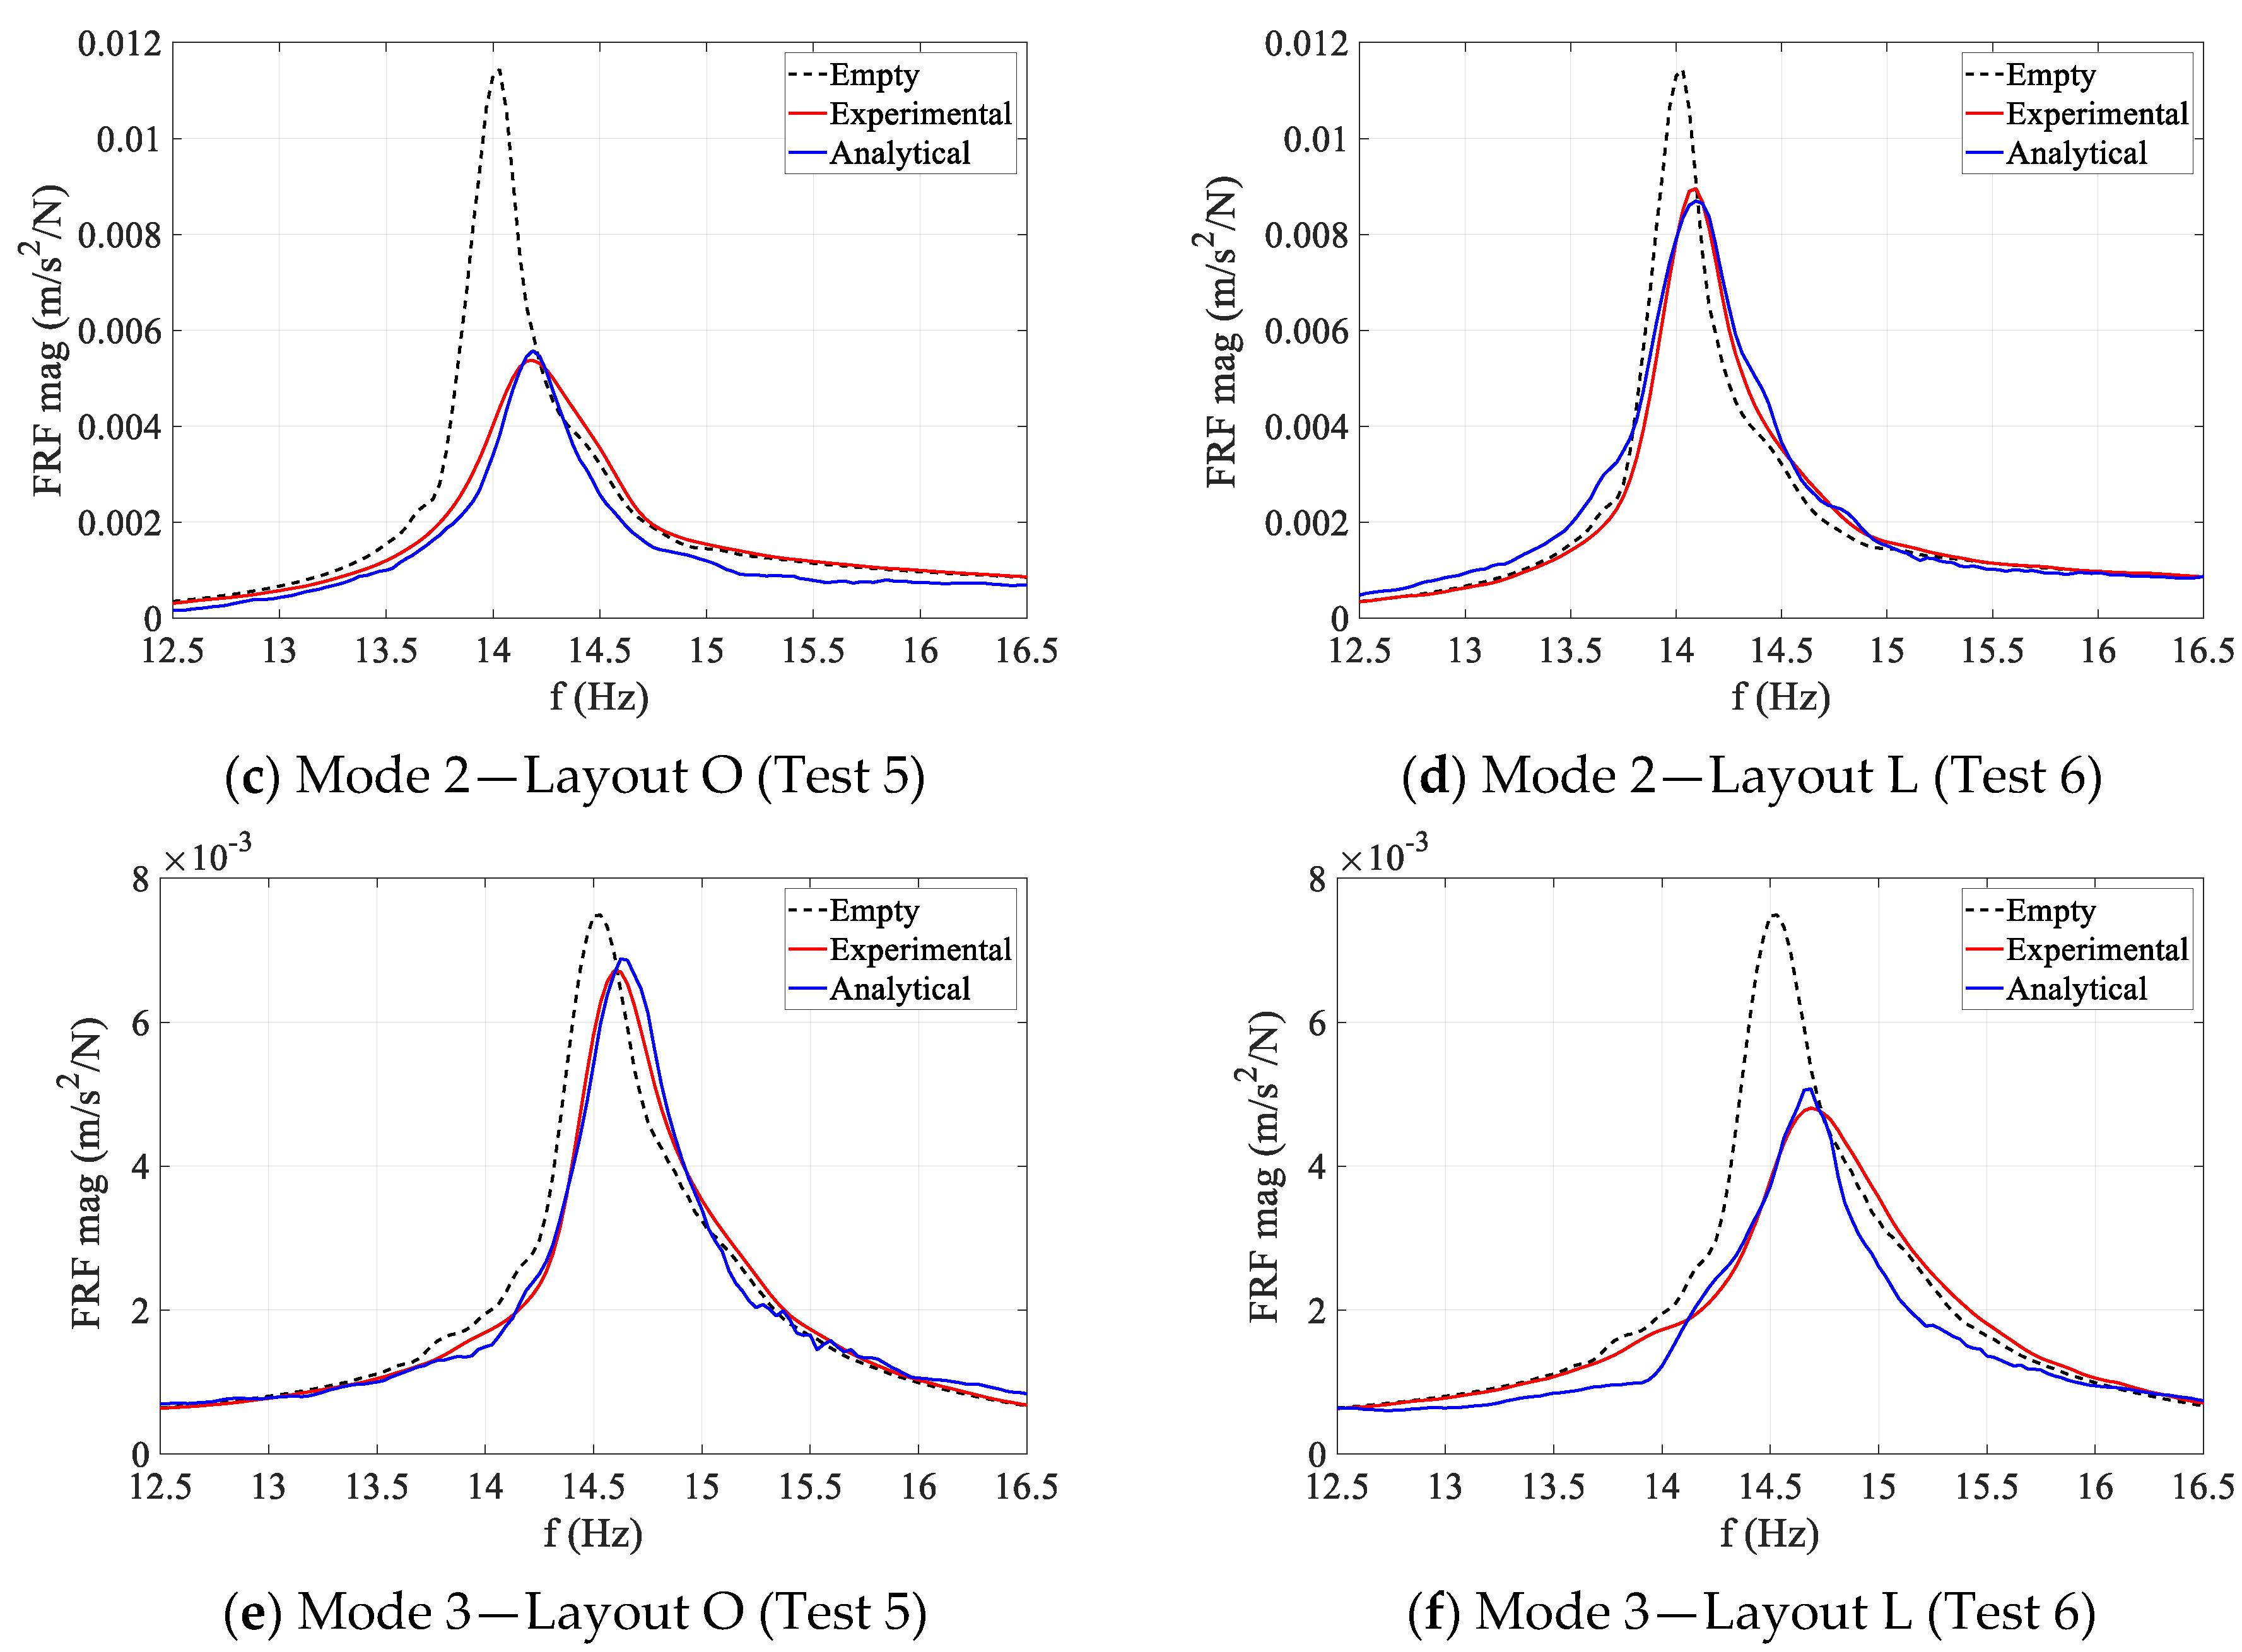
| 02 | FRF—Empty | 2 | - | 14.02 | 0.78 | 5600 | 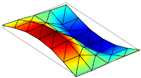 | |
| 05 | FRF—3W-3S | 2 | O | 14.18 | 1.60 | 5700 | 1.1% | |
| 06 | FRF—3W-3S | 2 | L | 14.10 | 0.91 | 5800 | 0.6% | |
| 02 | FRF—Empty | 3 | - | 14.52 | 1.15 | 5600 | 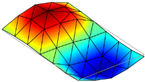 | |
| 05 | FRF—3W-3S | 3 | O | 14.60 | 1.27 | 5700 | 0.6% | |
| 06 | FRF—3W-3S | 3 | L | 14.69 | 1.78 | 5800 | 1.2% | |
| 07 | RM—3W-3S | All | O | - | - | - | - | |
| 08 | RM—3W-3S | All | L | - | - | - | - |
Disclaimer/Publisher’s Note: The statements, opinions and data contained in all publications are solely those of the individual author(s) and contributor(s) and not of MDPI and/or the editor(s). MDPI and/or the editor(s) disclaim responsibility for any injury to people or property resulting from any ideas, methods, instructions or products referred to in the content. |
© 2024 by the authors. Licensee MDPI, Basel, Switzerland. This article is an open access article distributed under the terms and conditions of the Creative Commons Attribution (CC BY) license (https://creativecommons.org/licenses/by/4.0/).
Share and Cite
Shahabpoor, E.; Berari, B.; Pavic, A. Vibration Serviceability Assessment of Floor Structures: Simulation of Human–Structure–Environment Interactions Using Agent-Based Modeling. Sensors 2025, 25, 126. https://doi.org/10.3390/s25010126
Shahabpoor E, Berari B, Pavic A. Vibration Serviceability Assessment of Floor Structures: Simulation of Human–Structure–Environment Interactions Using Agent-Based Modeling. Sensors. 2025; 25(1):126. https://doi.org/10.3390/s25010126
Chicago/Turabian StyleShahabpoor, Erfan, Bernard Berari, and Aleksandar Pavic. 2025. "Vibration Serviceability Assessment of Floor Structures: Simulation of Human–Structure–Environment Interactions Using Agent-Based Modeling" Sensors 25, no. 1: 126. https://doi.org/10.3390/s25010126
APA StyleShahabpoor, E., Berari, B., & Pavic, A. (2025). Vibration Serviceability Assessment of Floor Structures: Simulation of Human–Structure–Environment Interactions Using Agent-Based Modeling. Sensors, 25(1), 126. https://doi.org/10.3390/s25010126