
Exploring Deep Learning to Predict Coconut Milk Adulteration Using FT-NIR and Micro-NIR Spectroscopy


Abstract
1. Introduction
2. Materials and Methods
2.1. Sample Collection
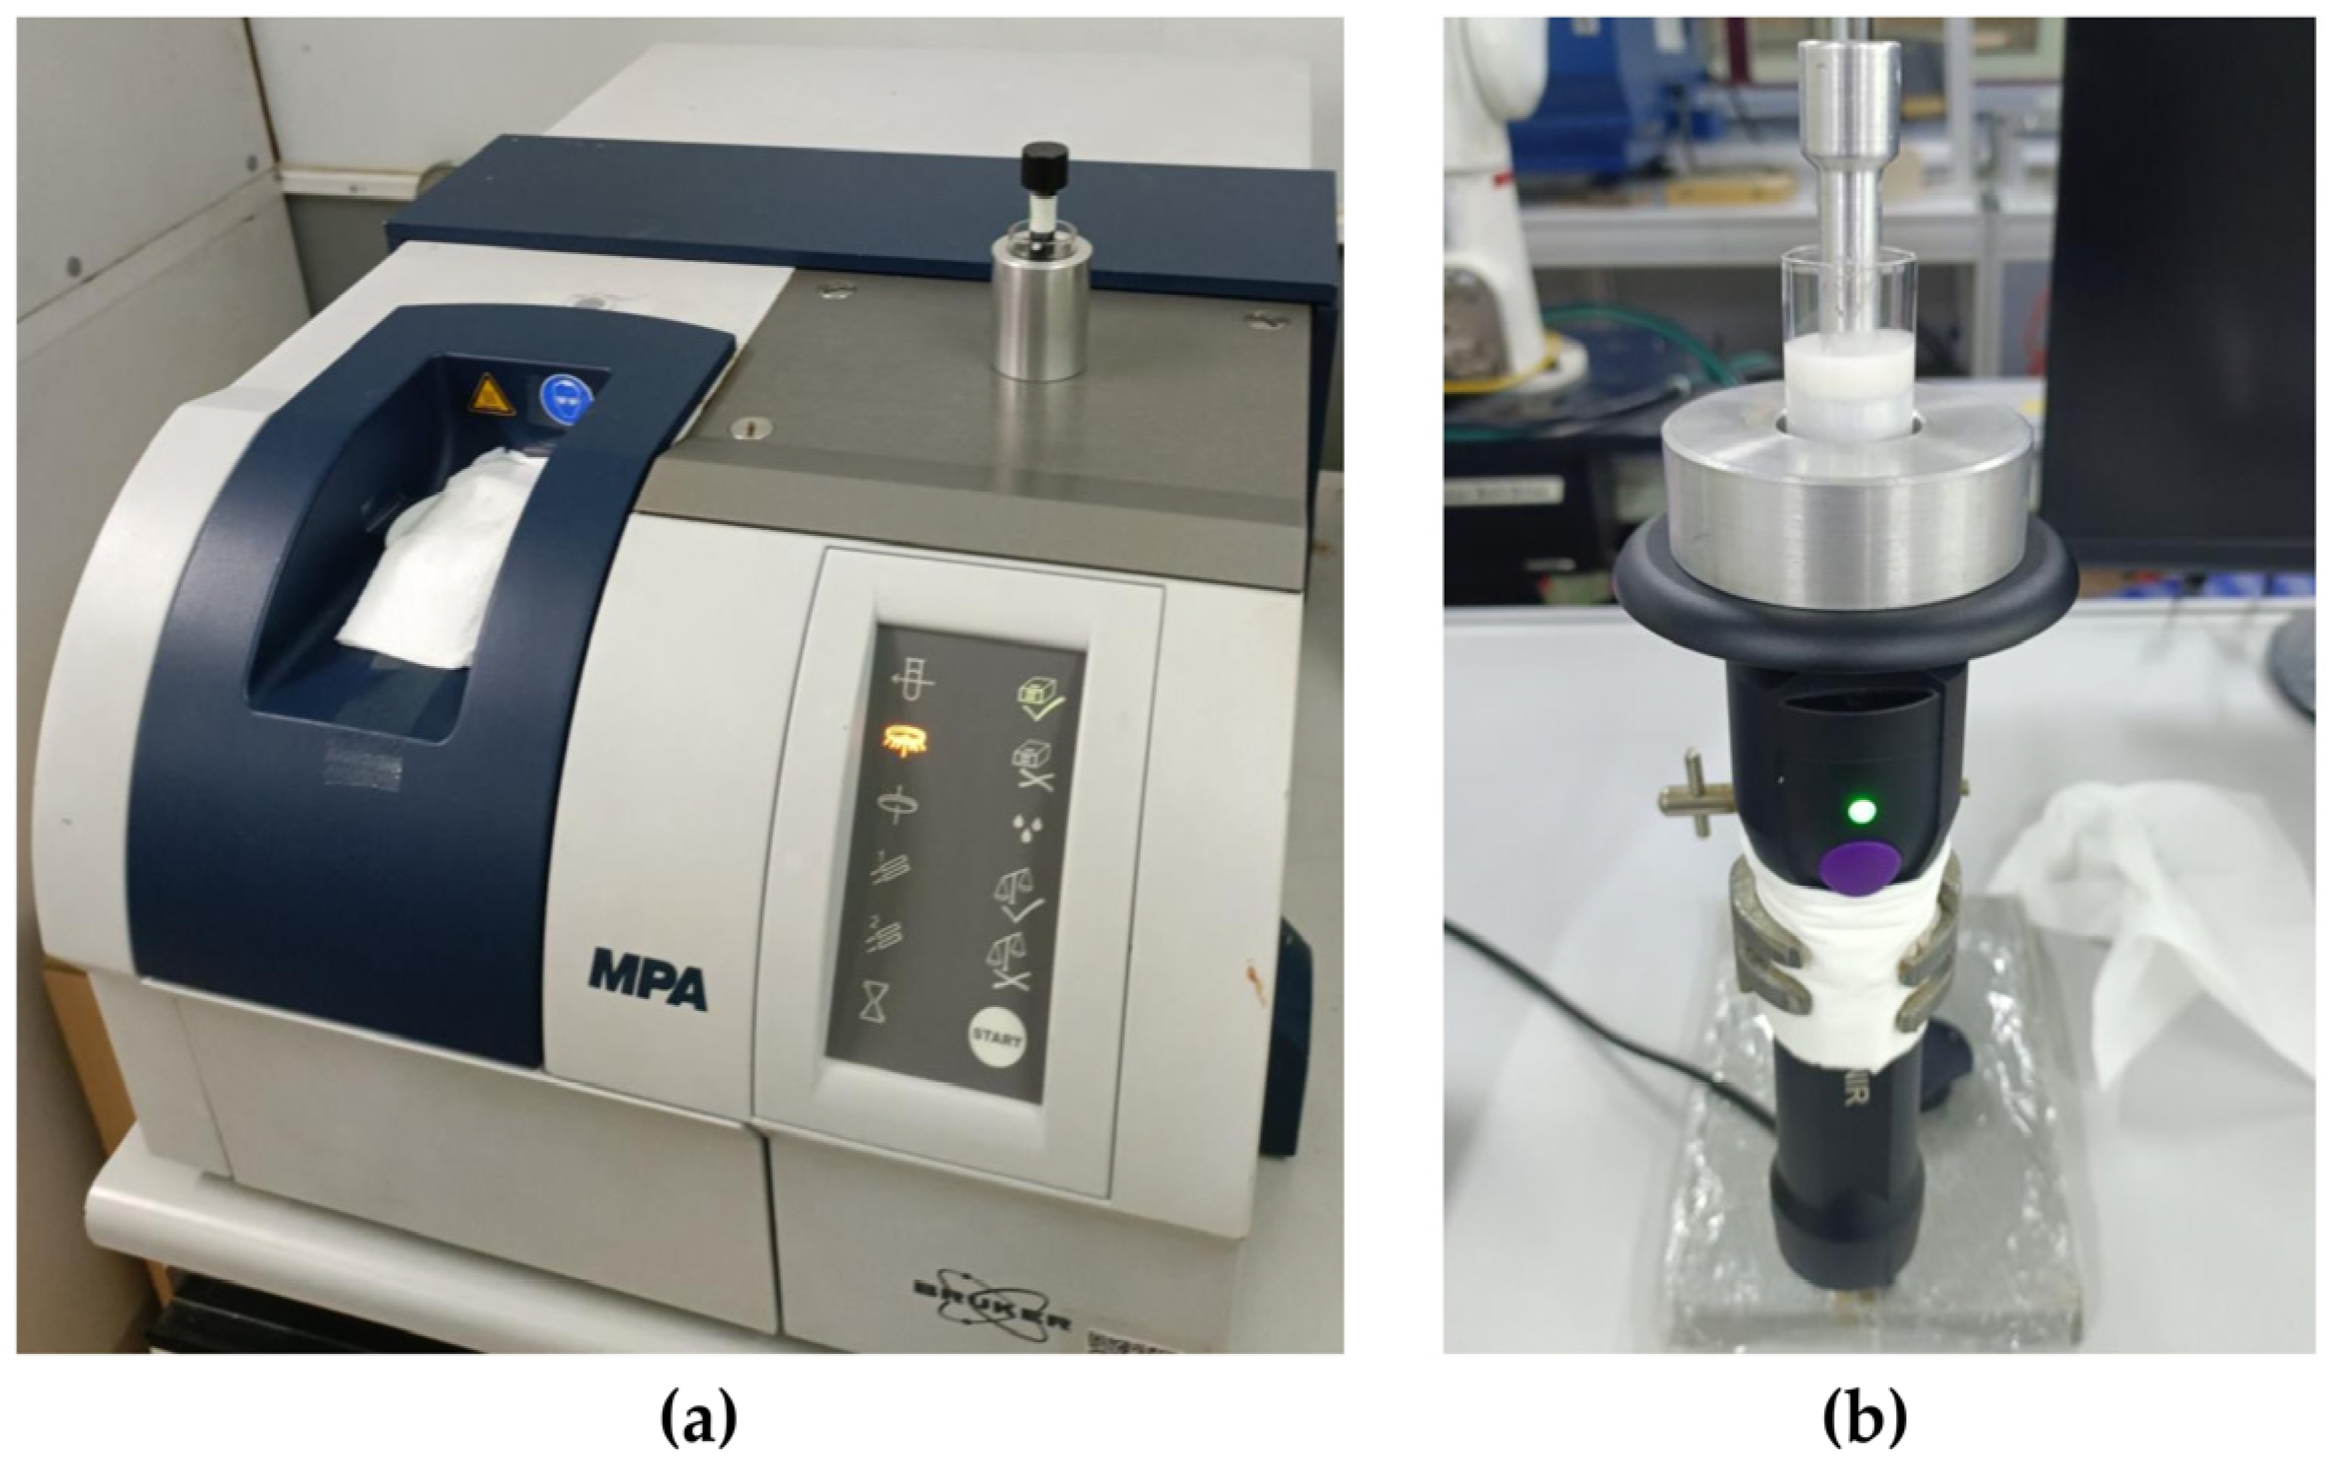
2.2. NIR Spectroscopy Data Acquisition
2.3. Data Handling for Modelling
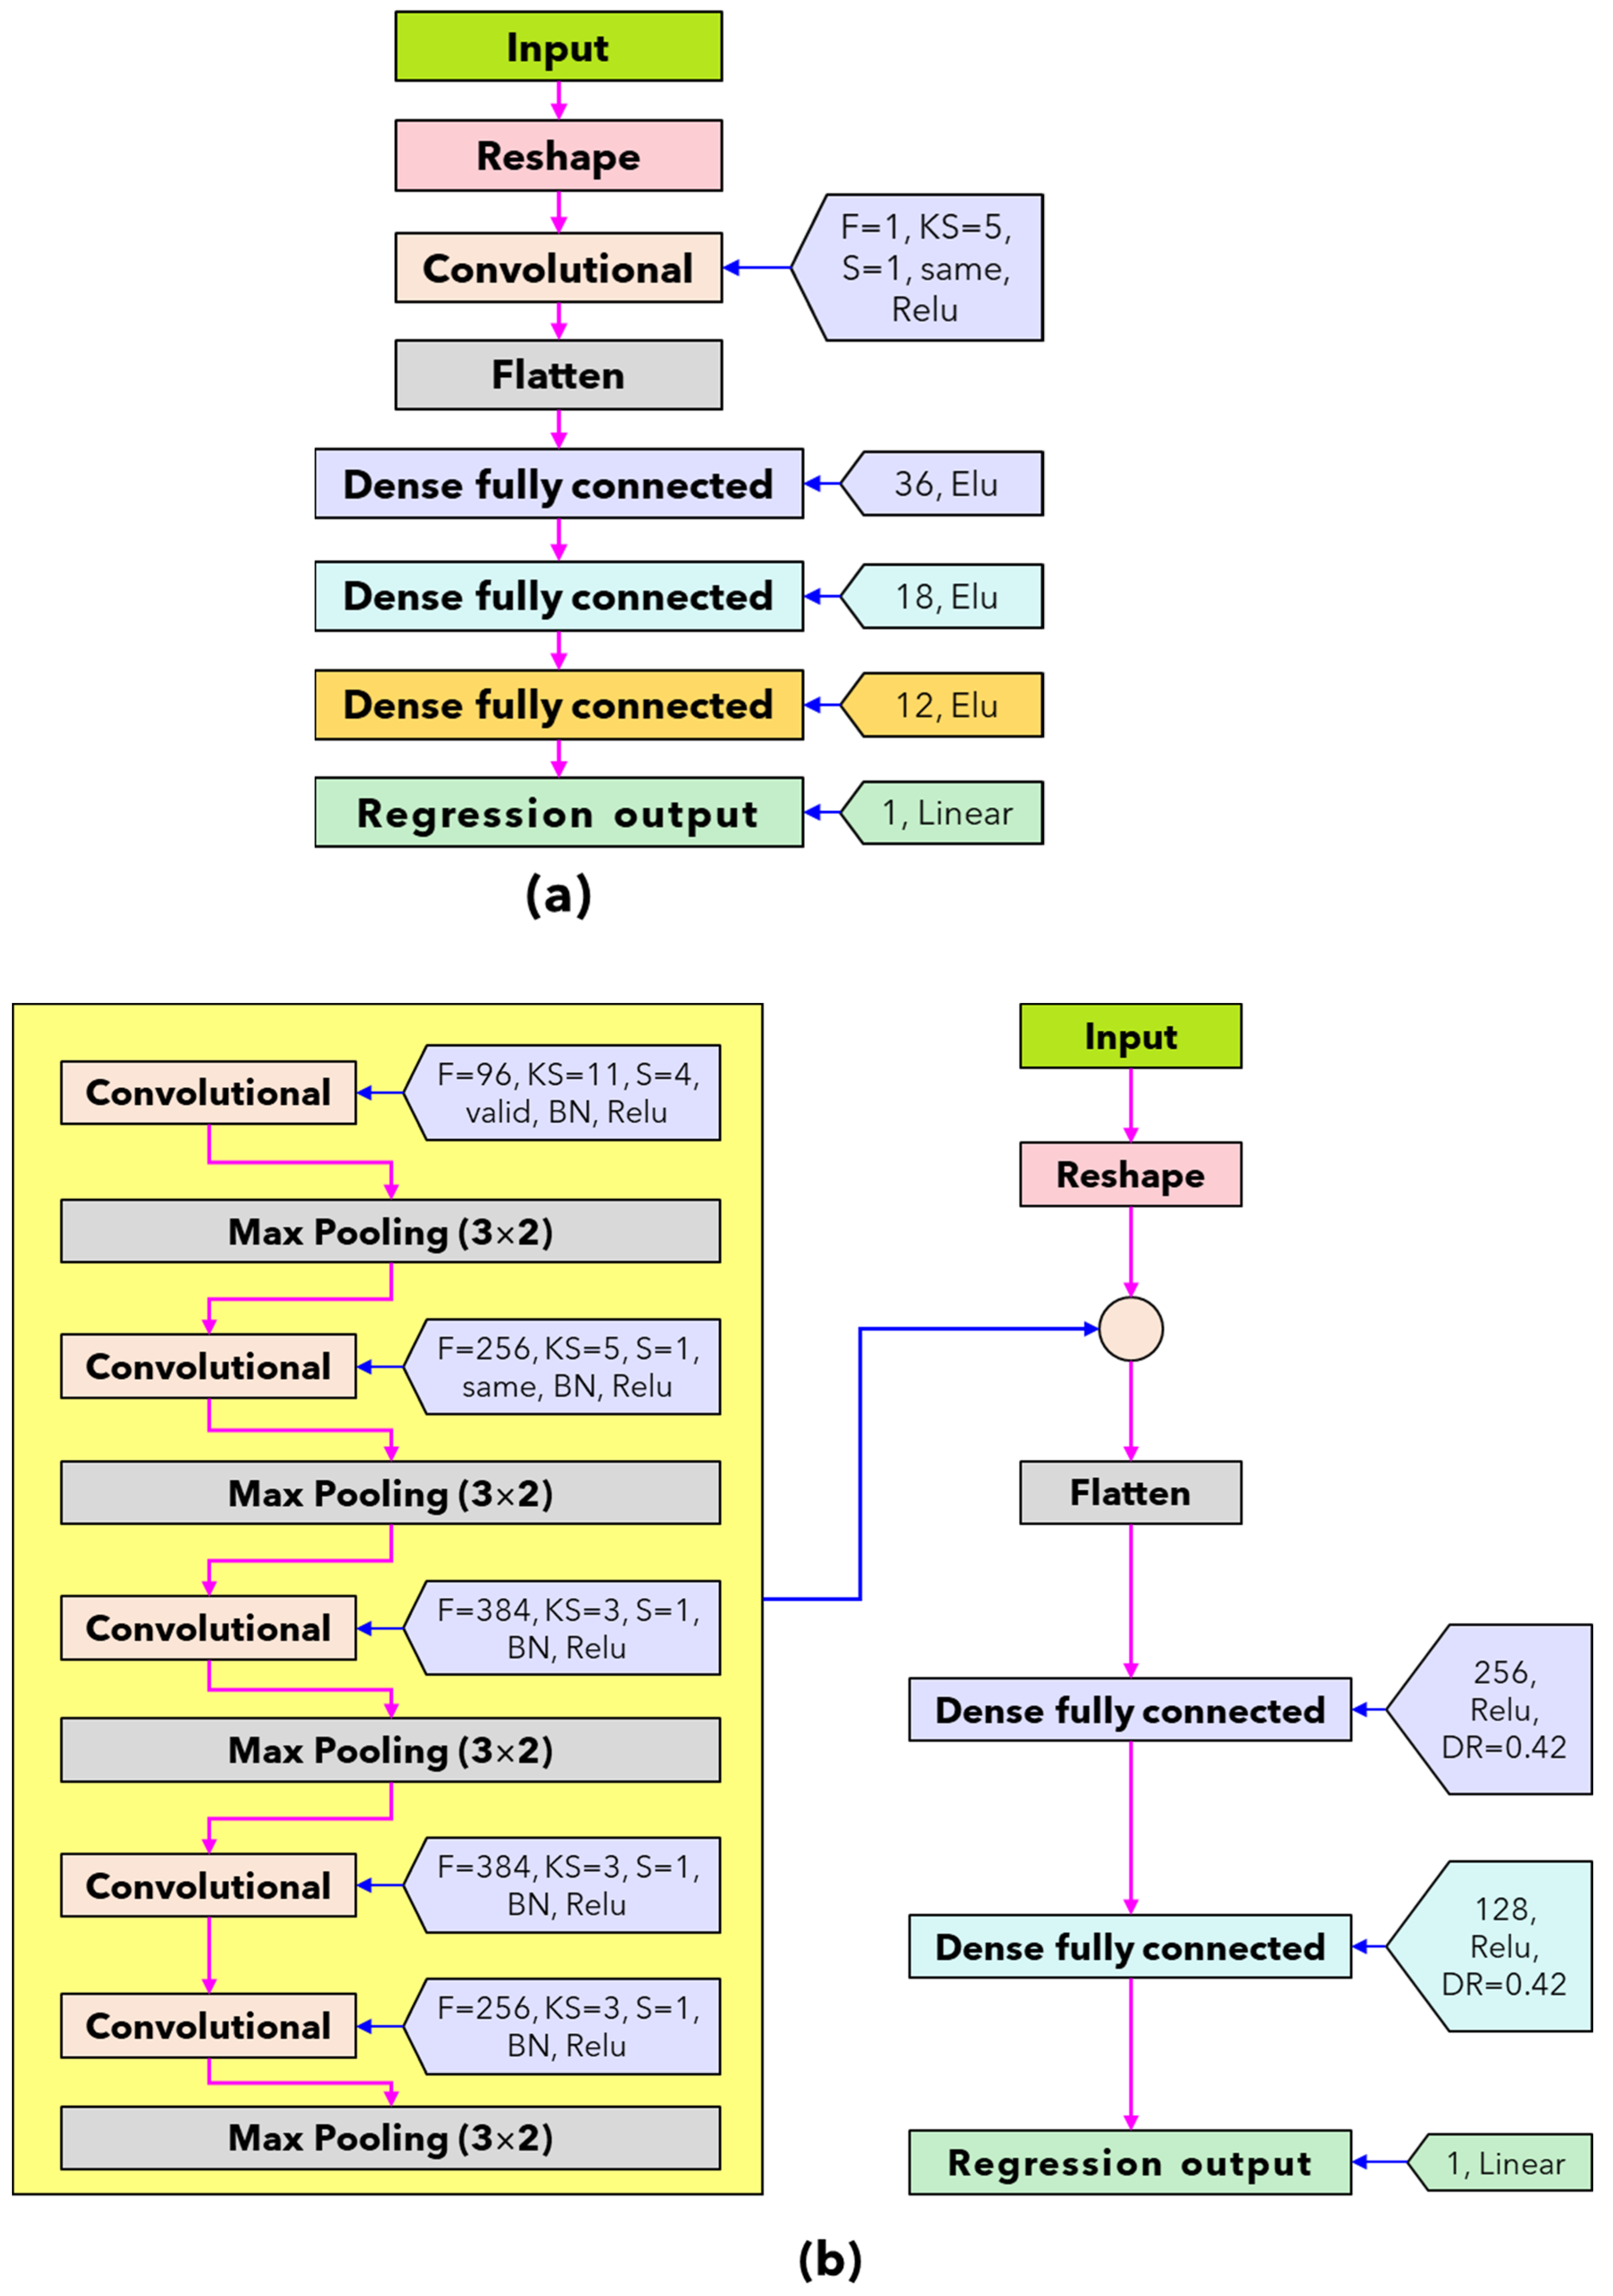
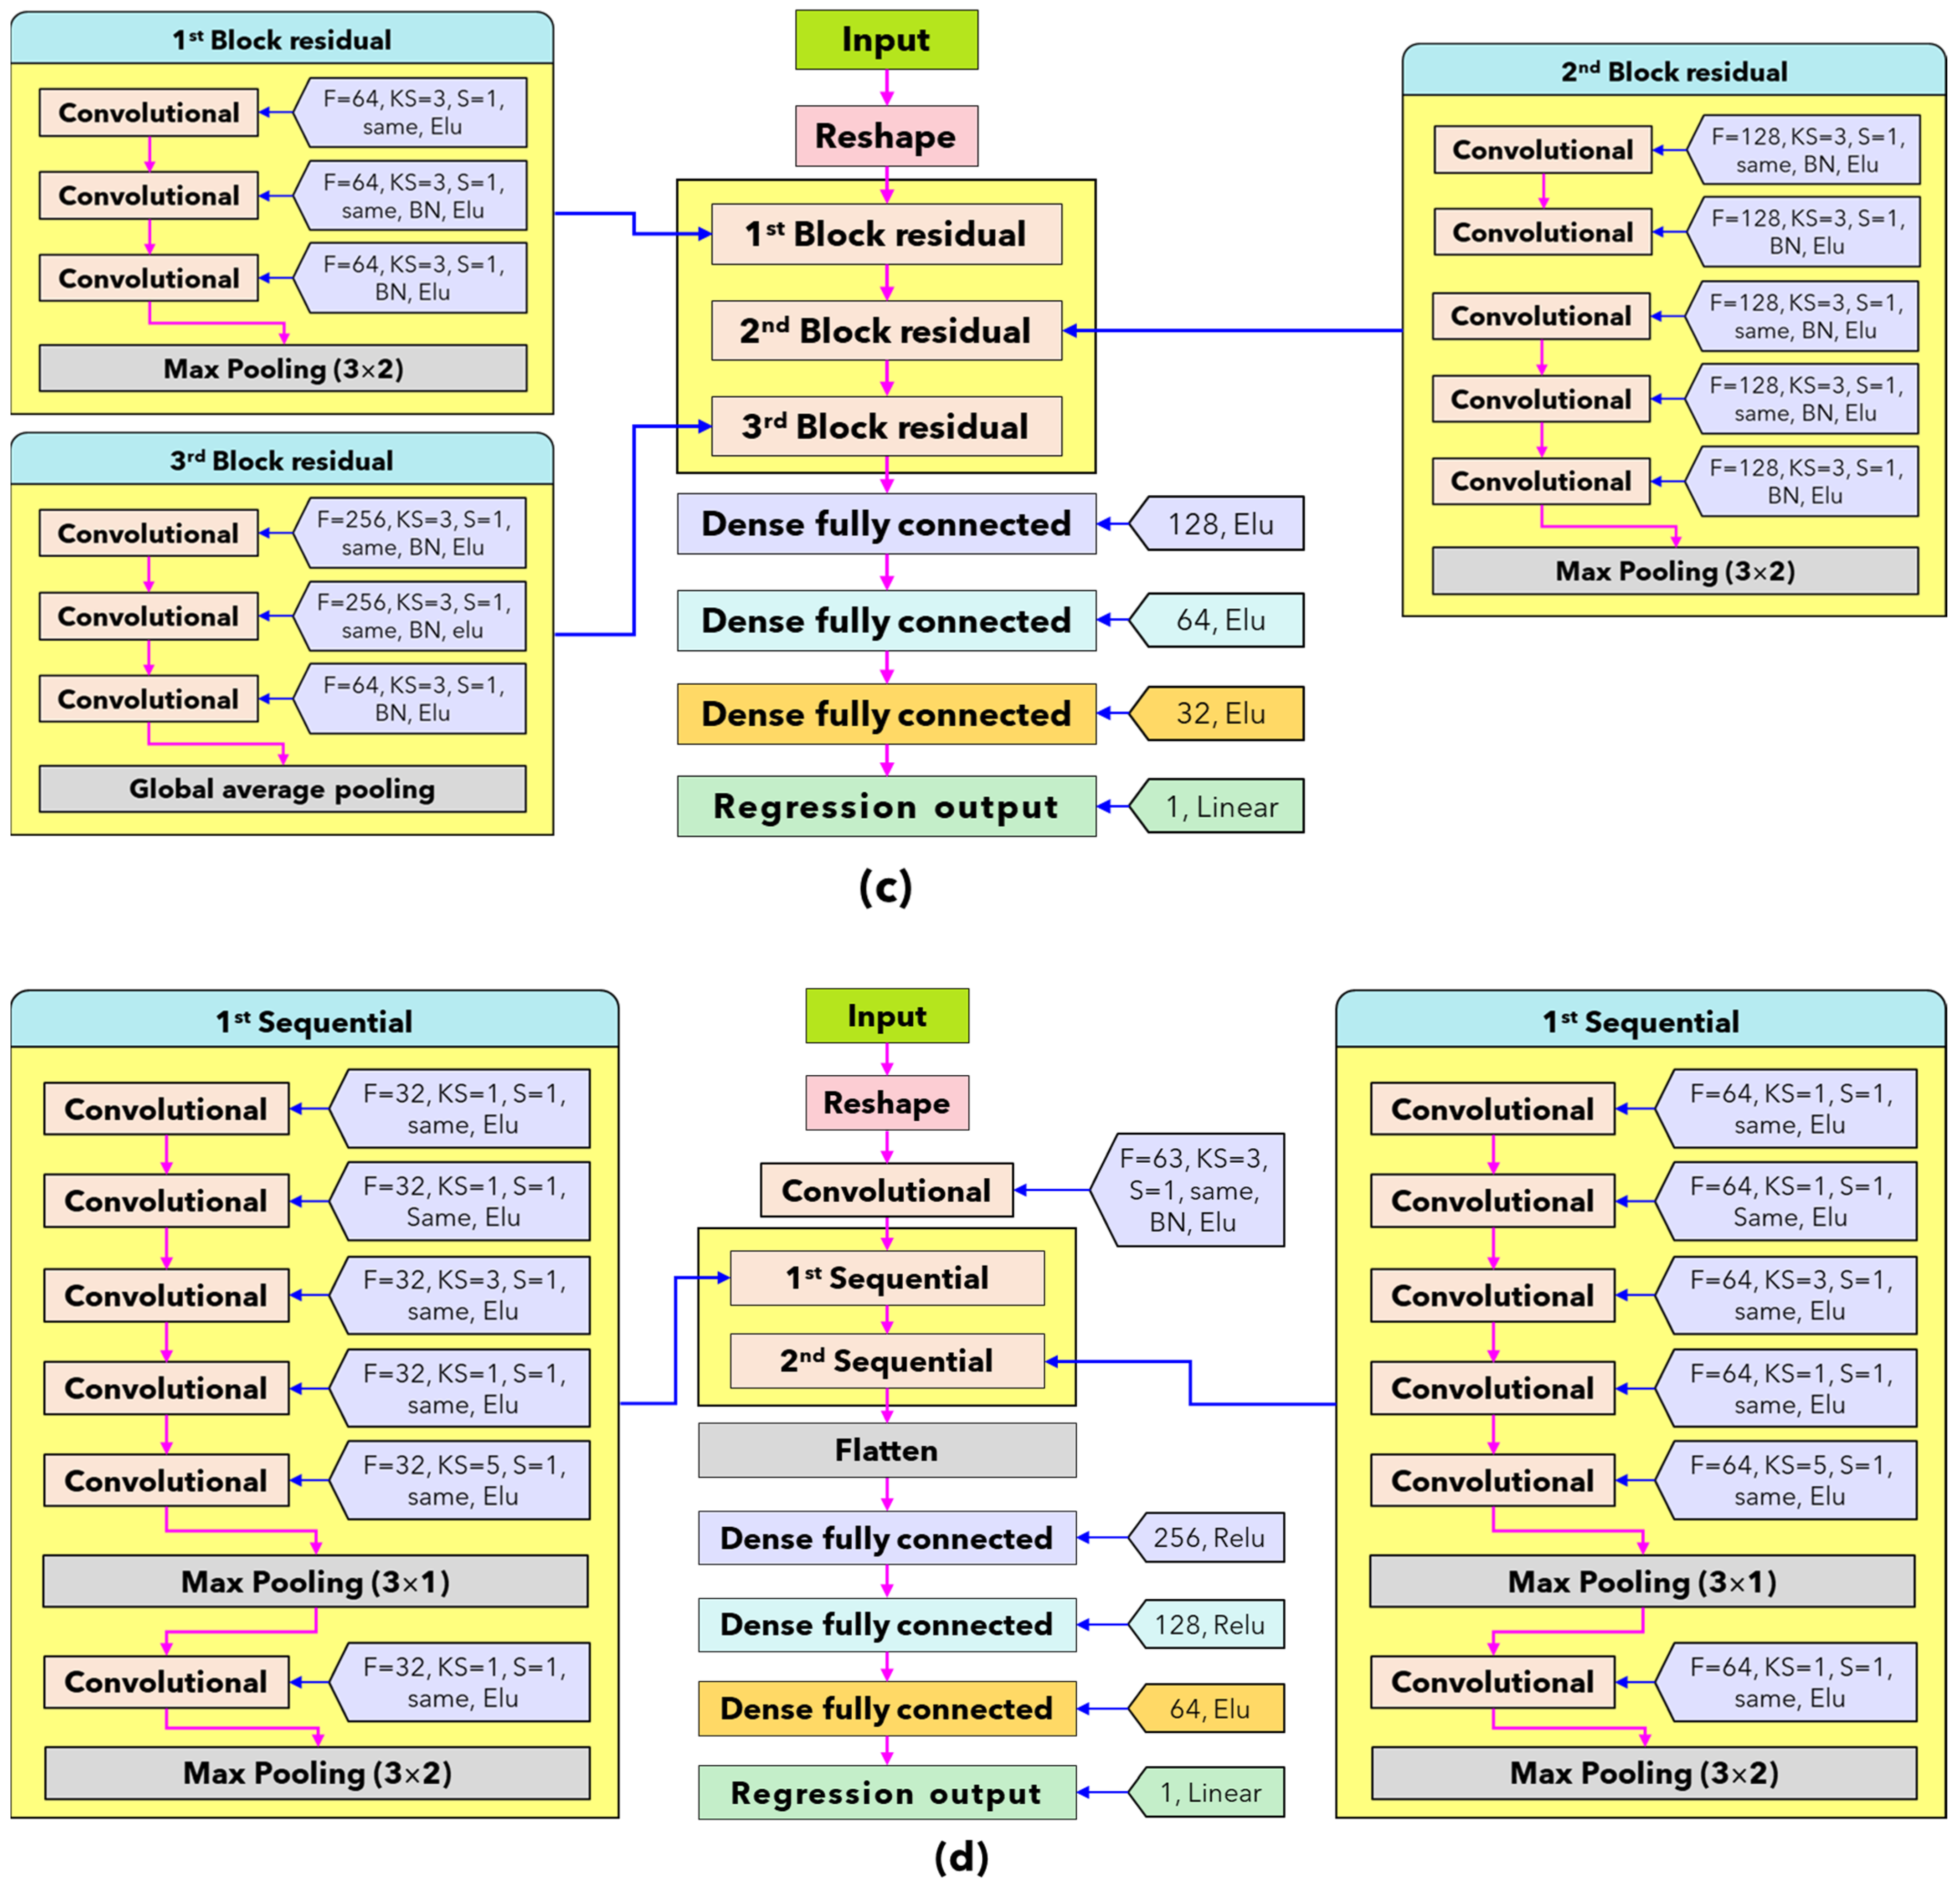
2.4. Deep-Learning Model Development
2.5. Performance Model Evaluation
3. Results
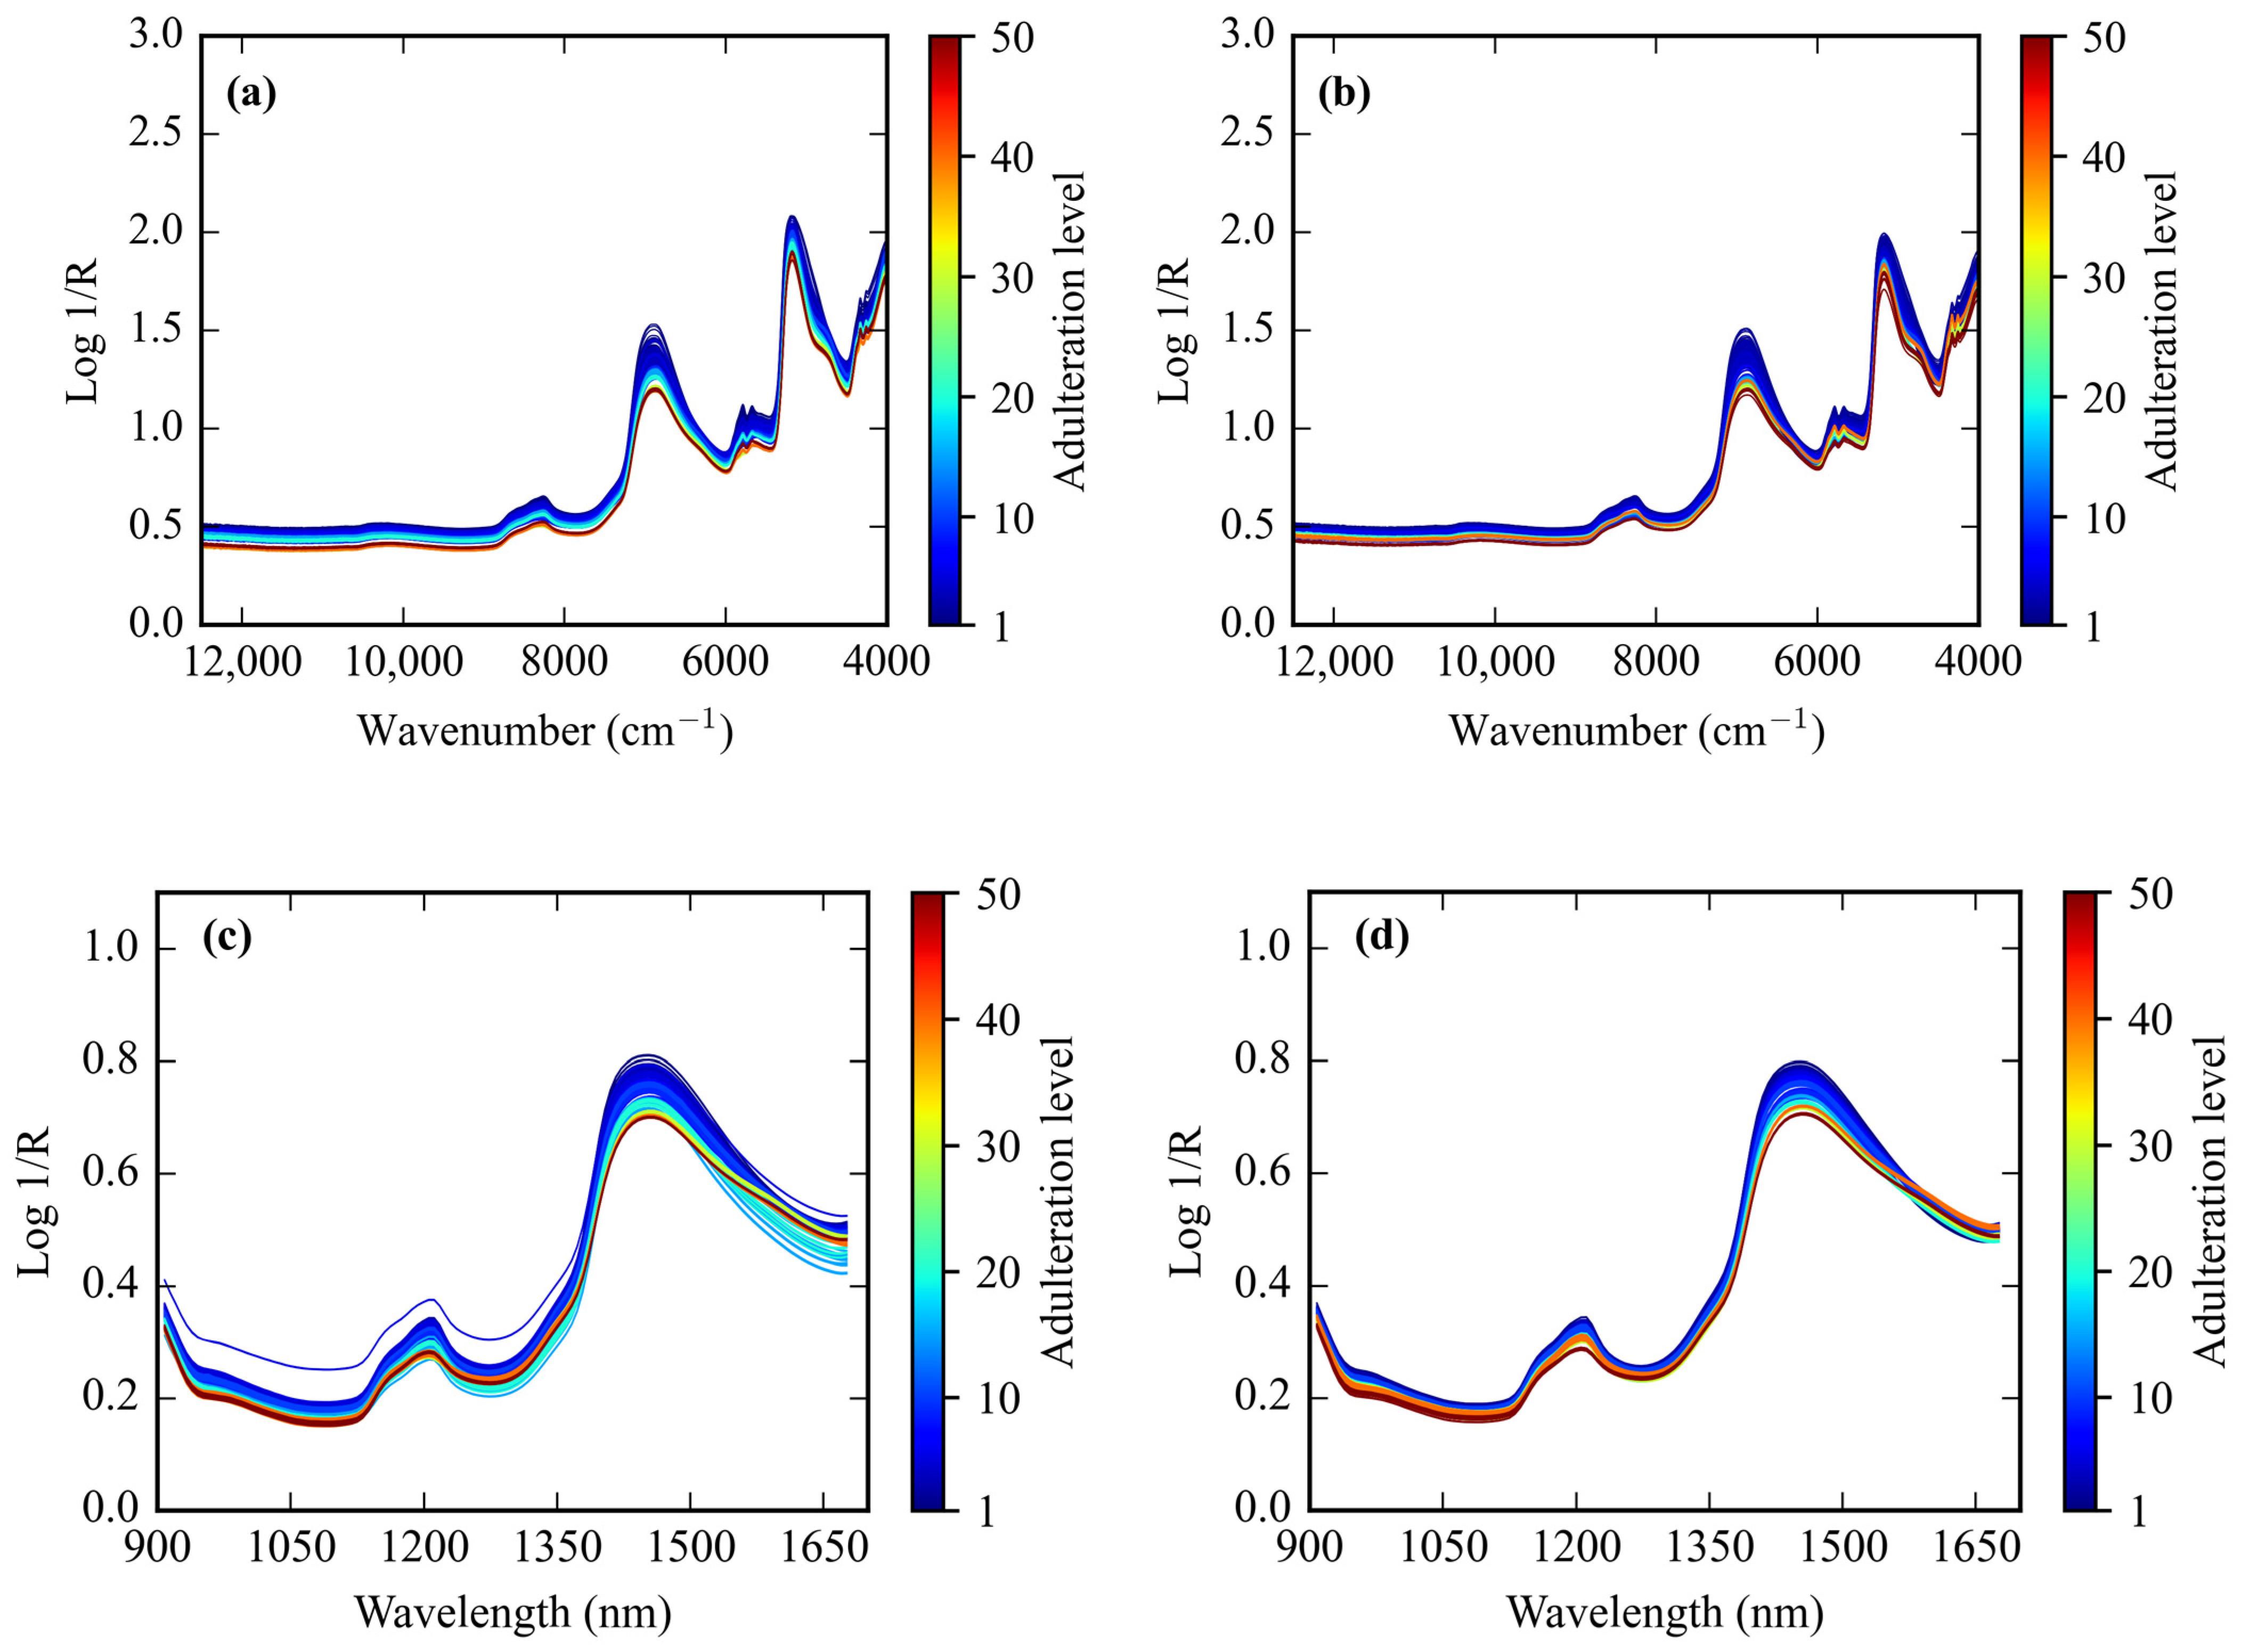
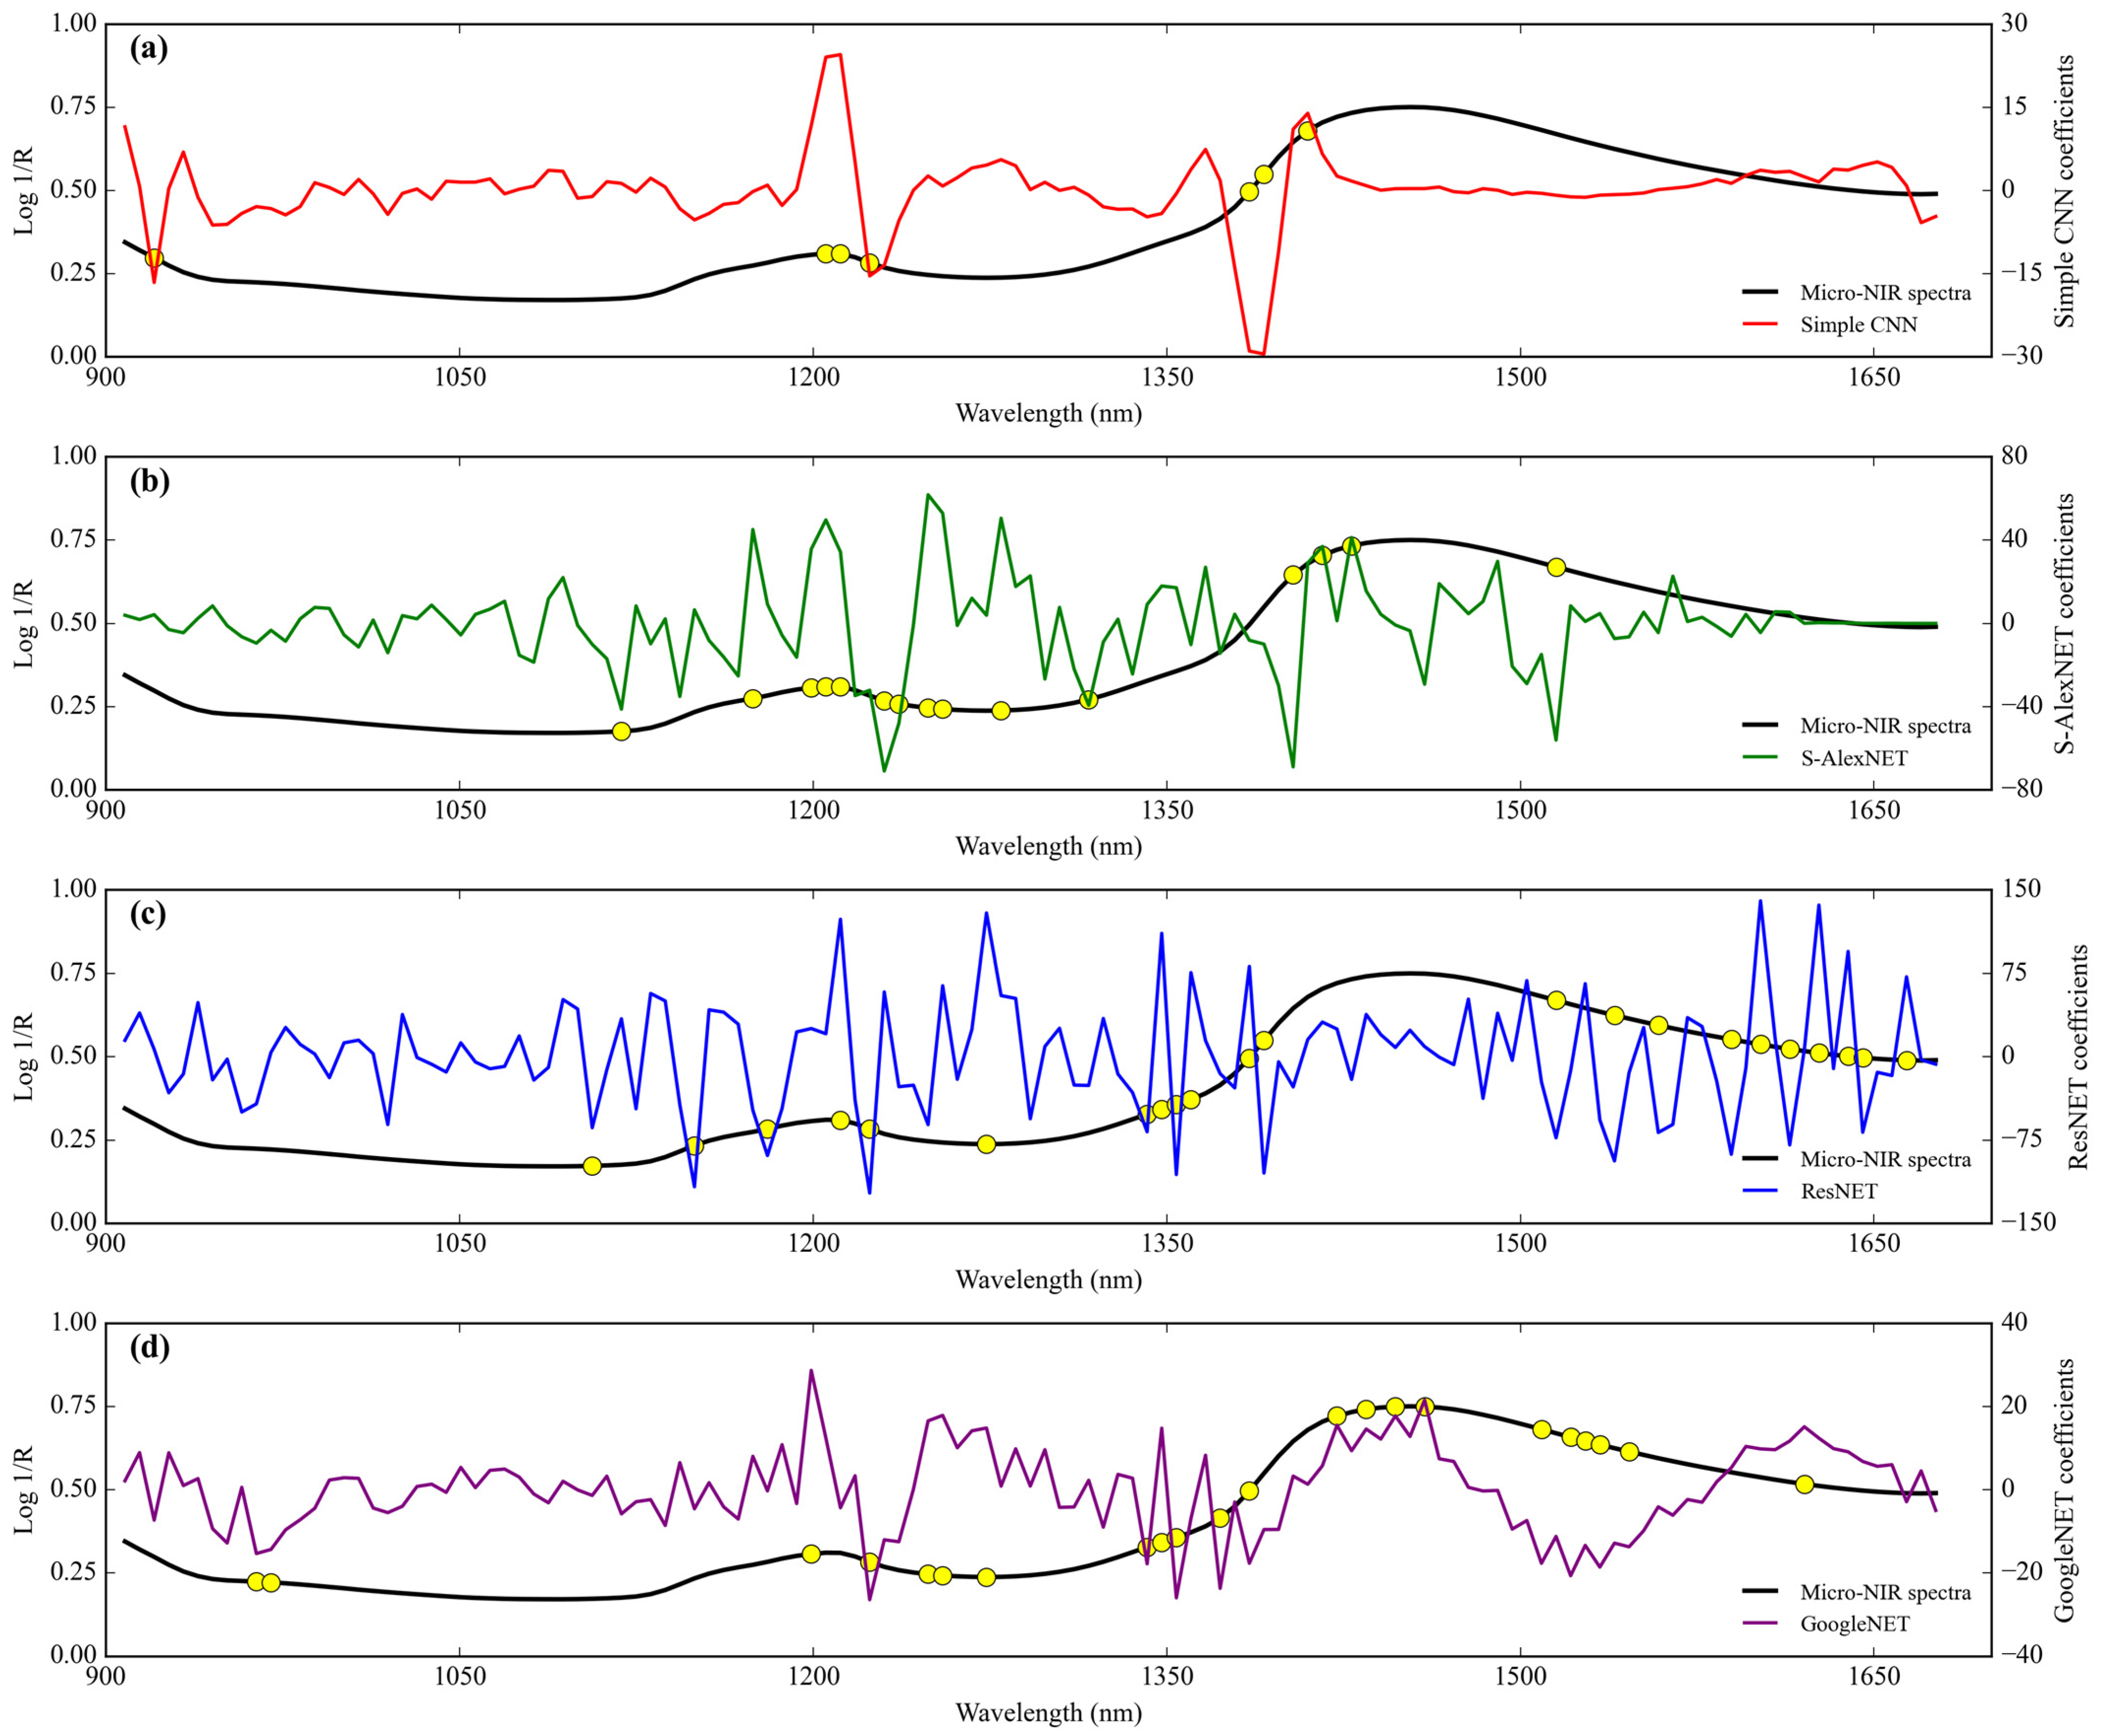
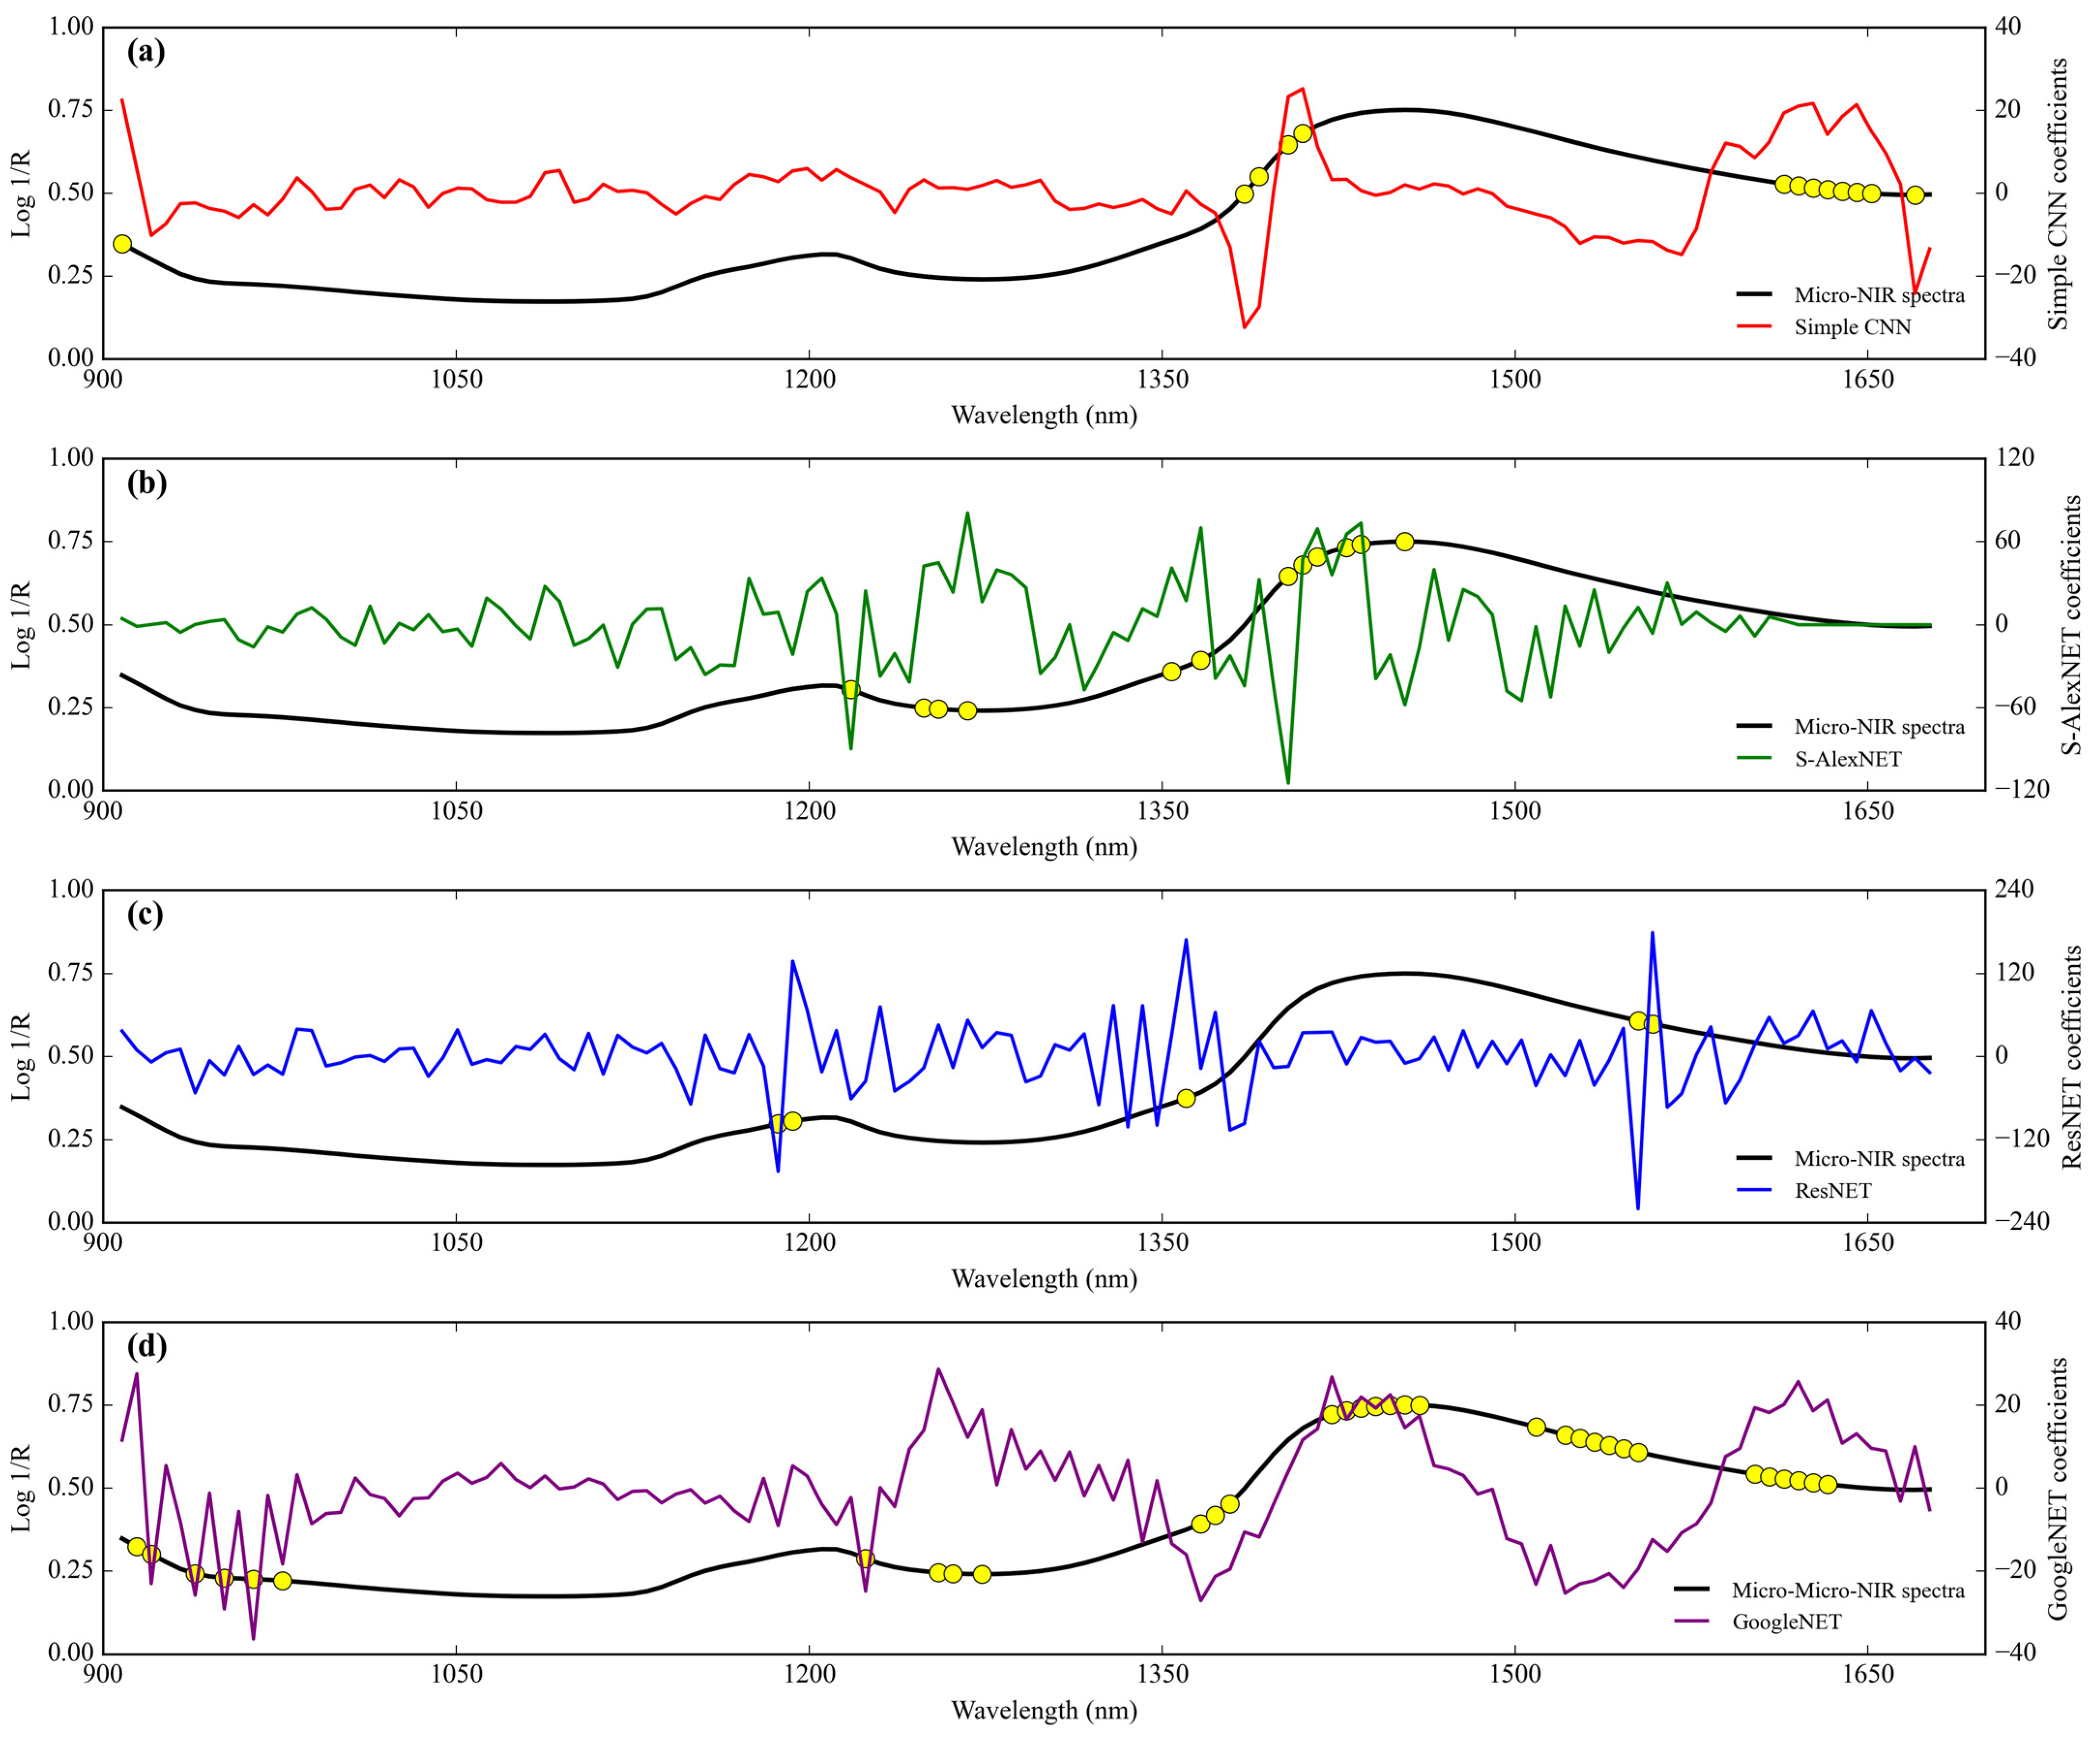
3.1. NIR Spectra Features
3.2. Calibration Models Development Base on FT-NIR
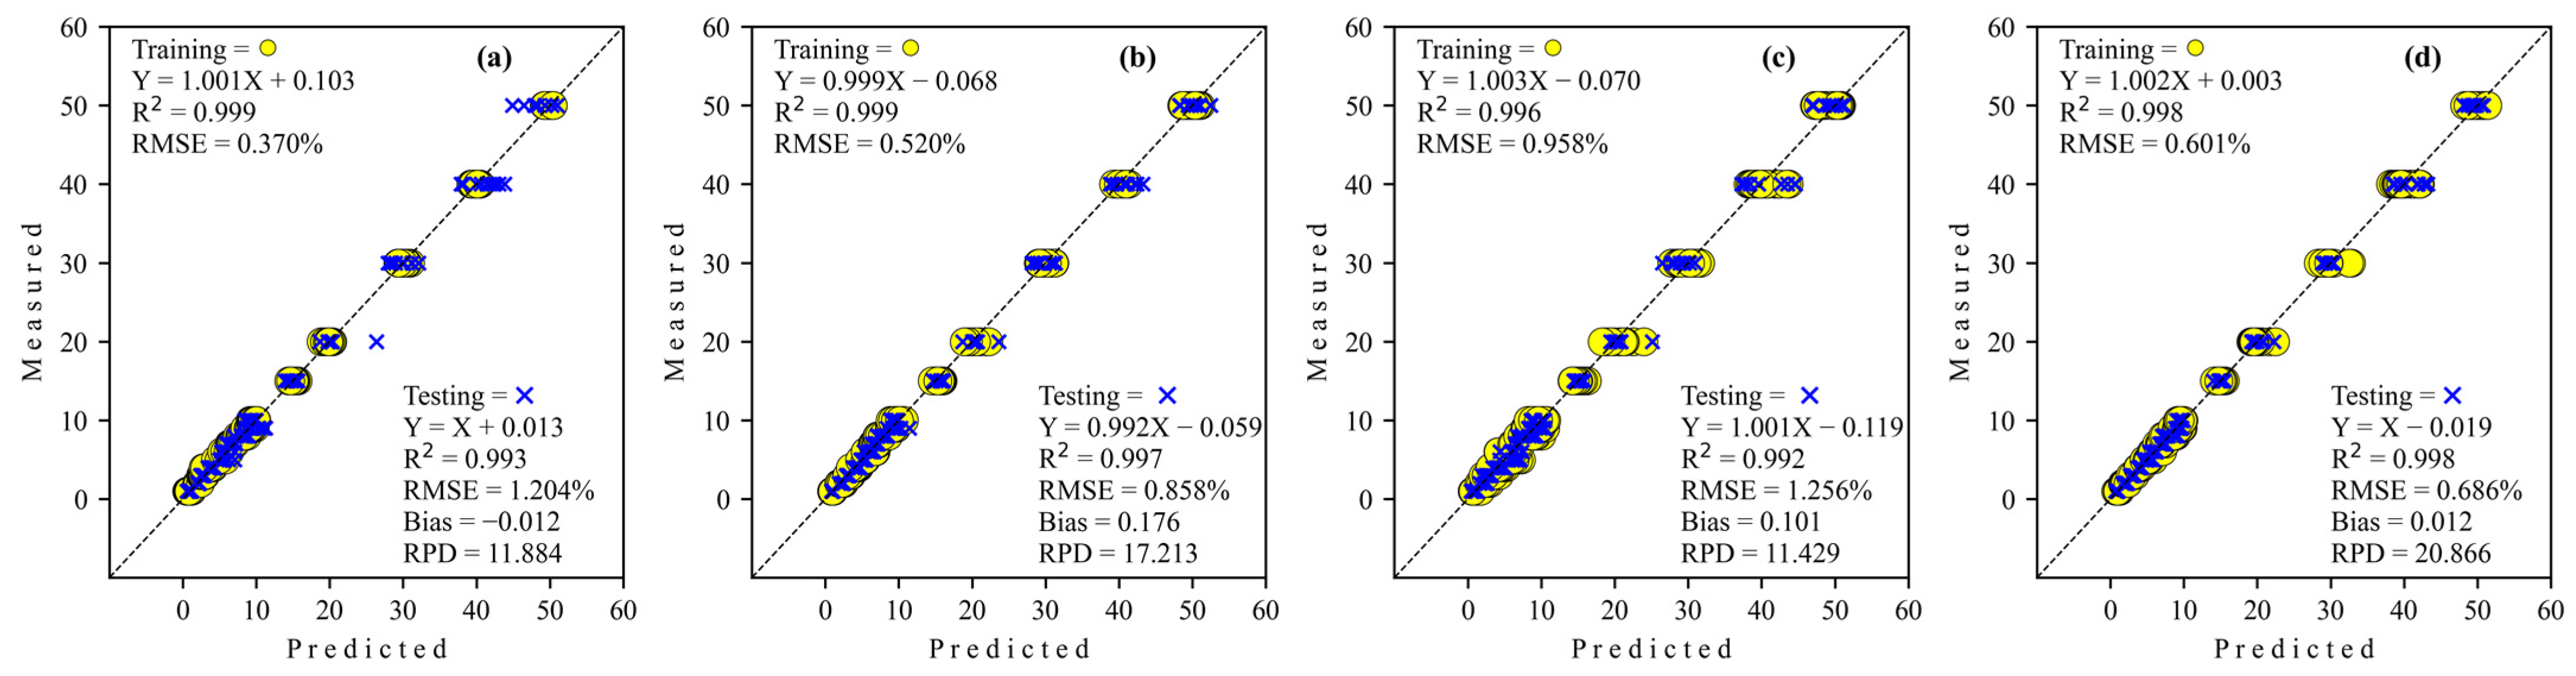
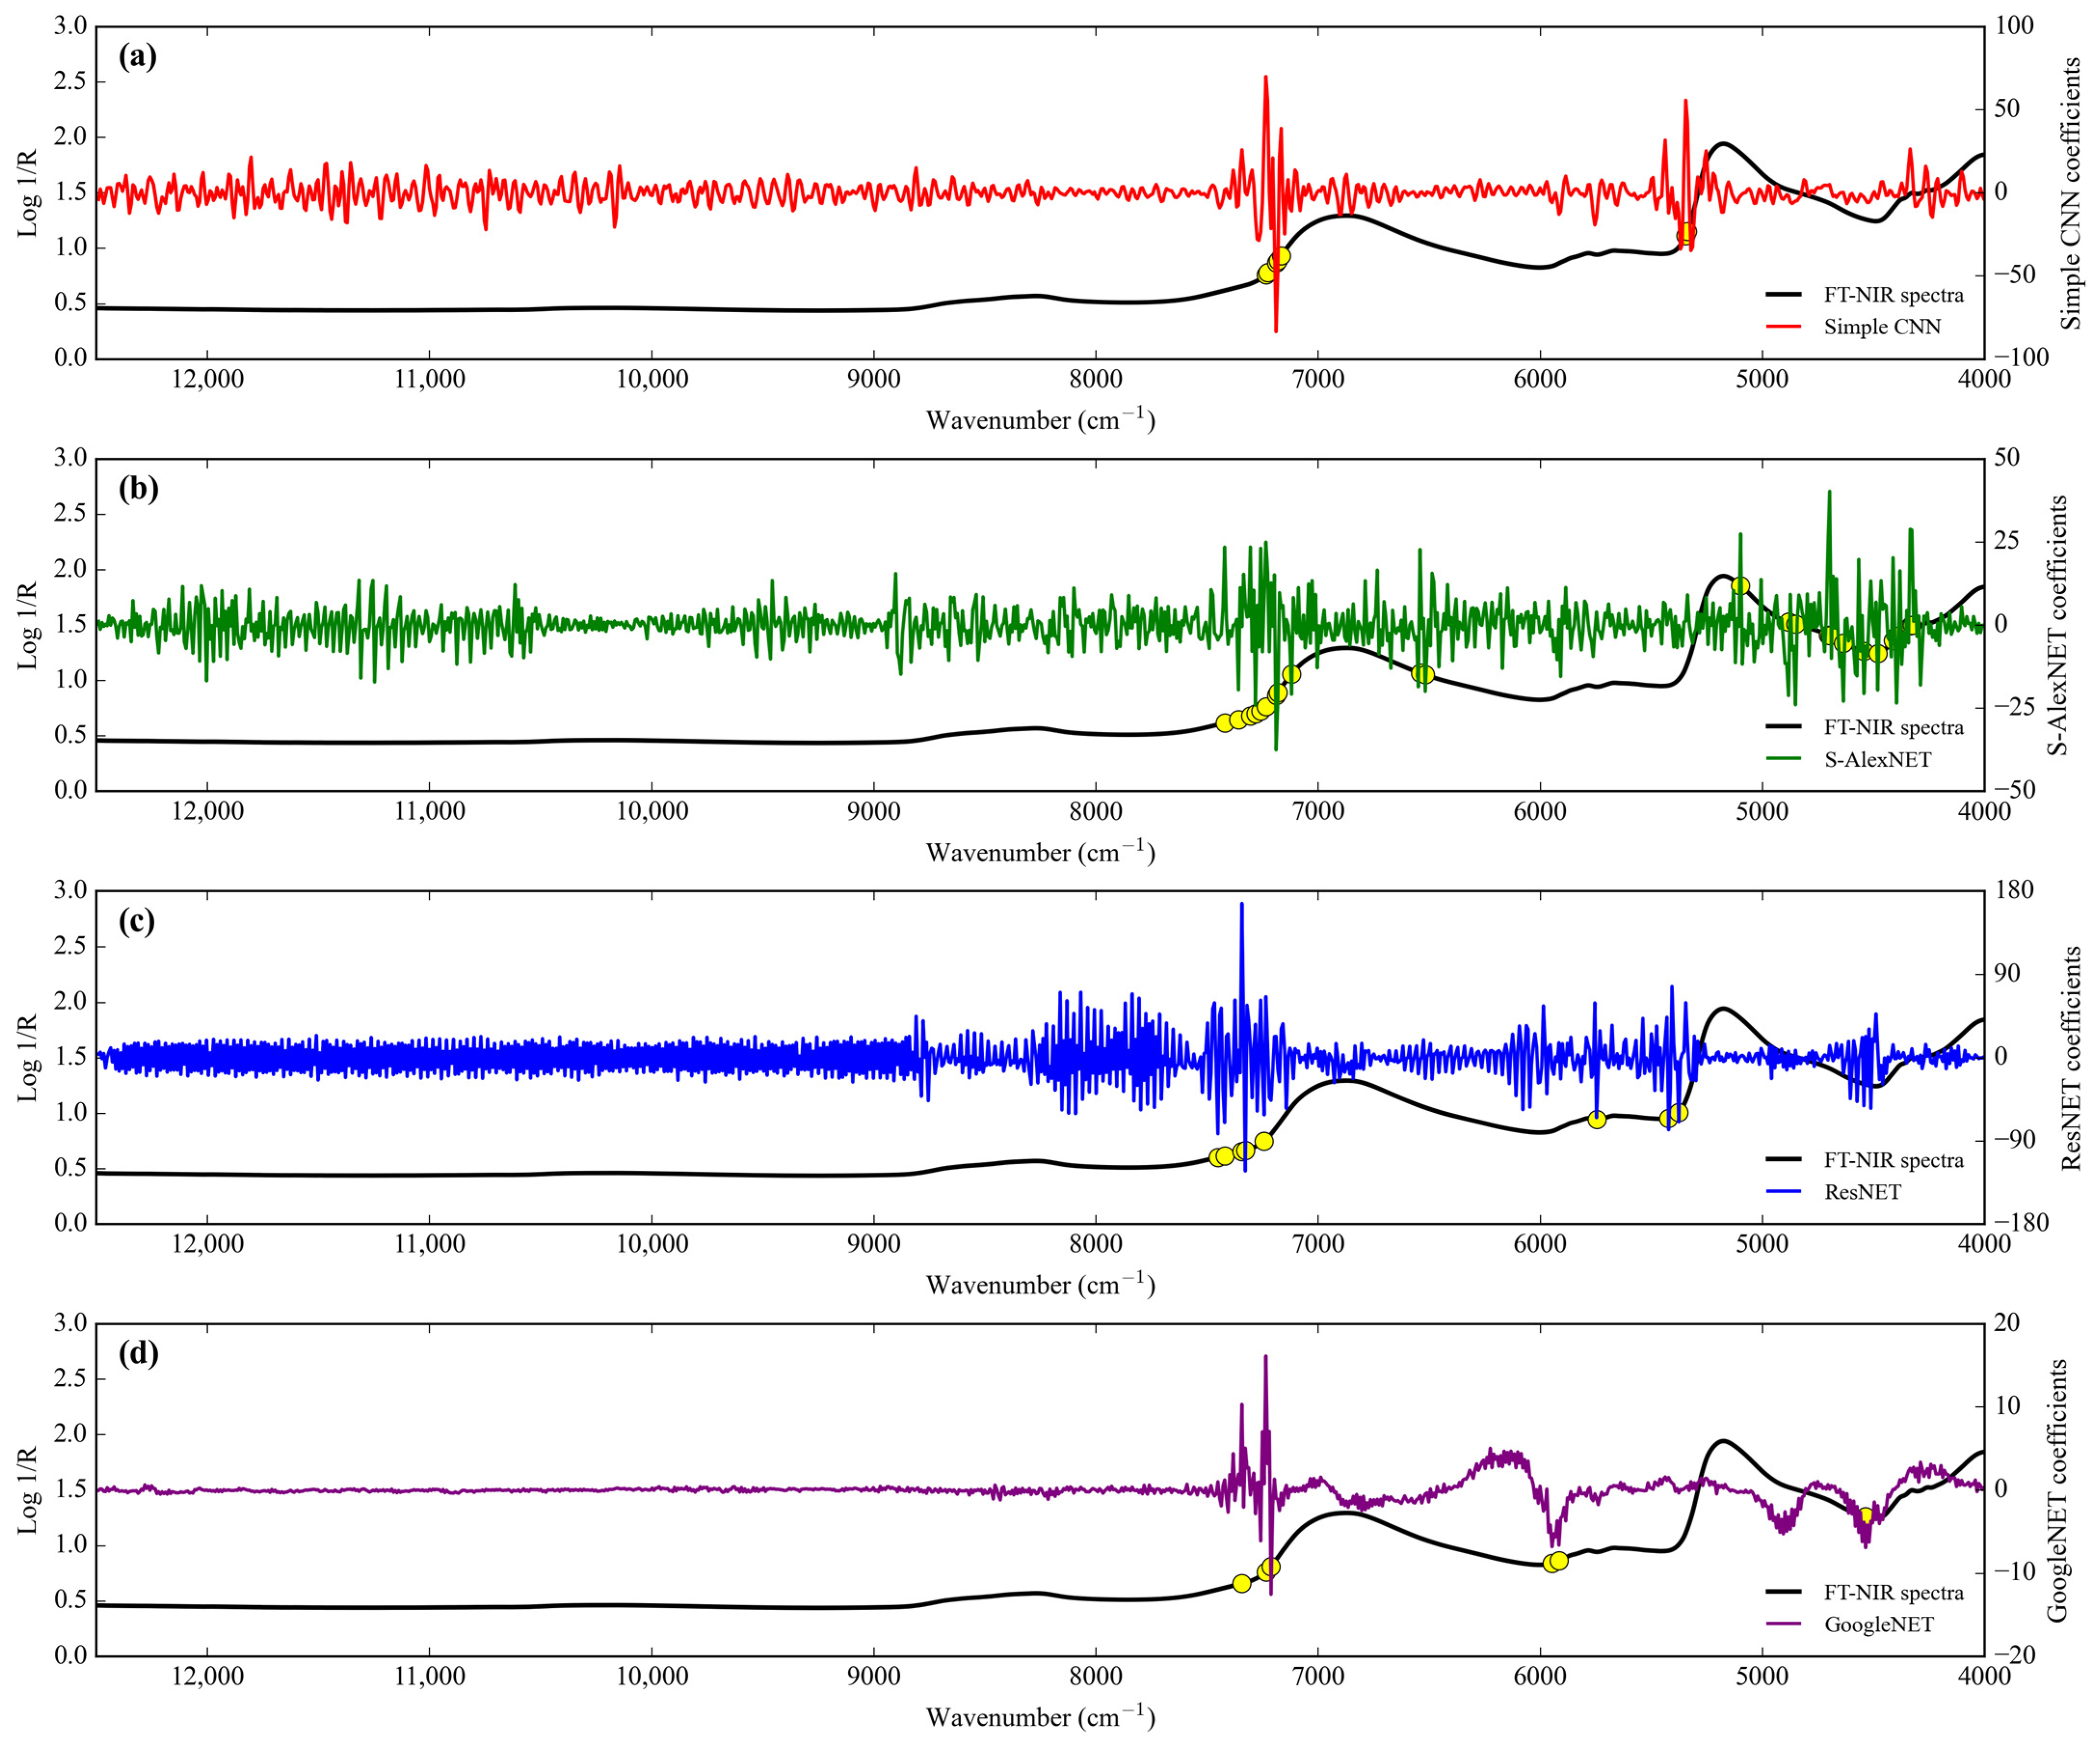
3.2.1. Adulteration by Corn Flour
3.2.2. Adulteration by Tapioca Starch
3.3. Calibration Models Development Base on Micro-NIR
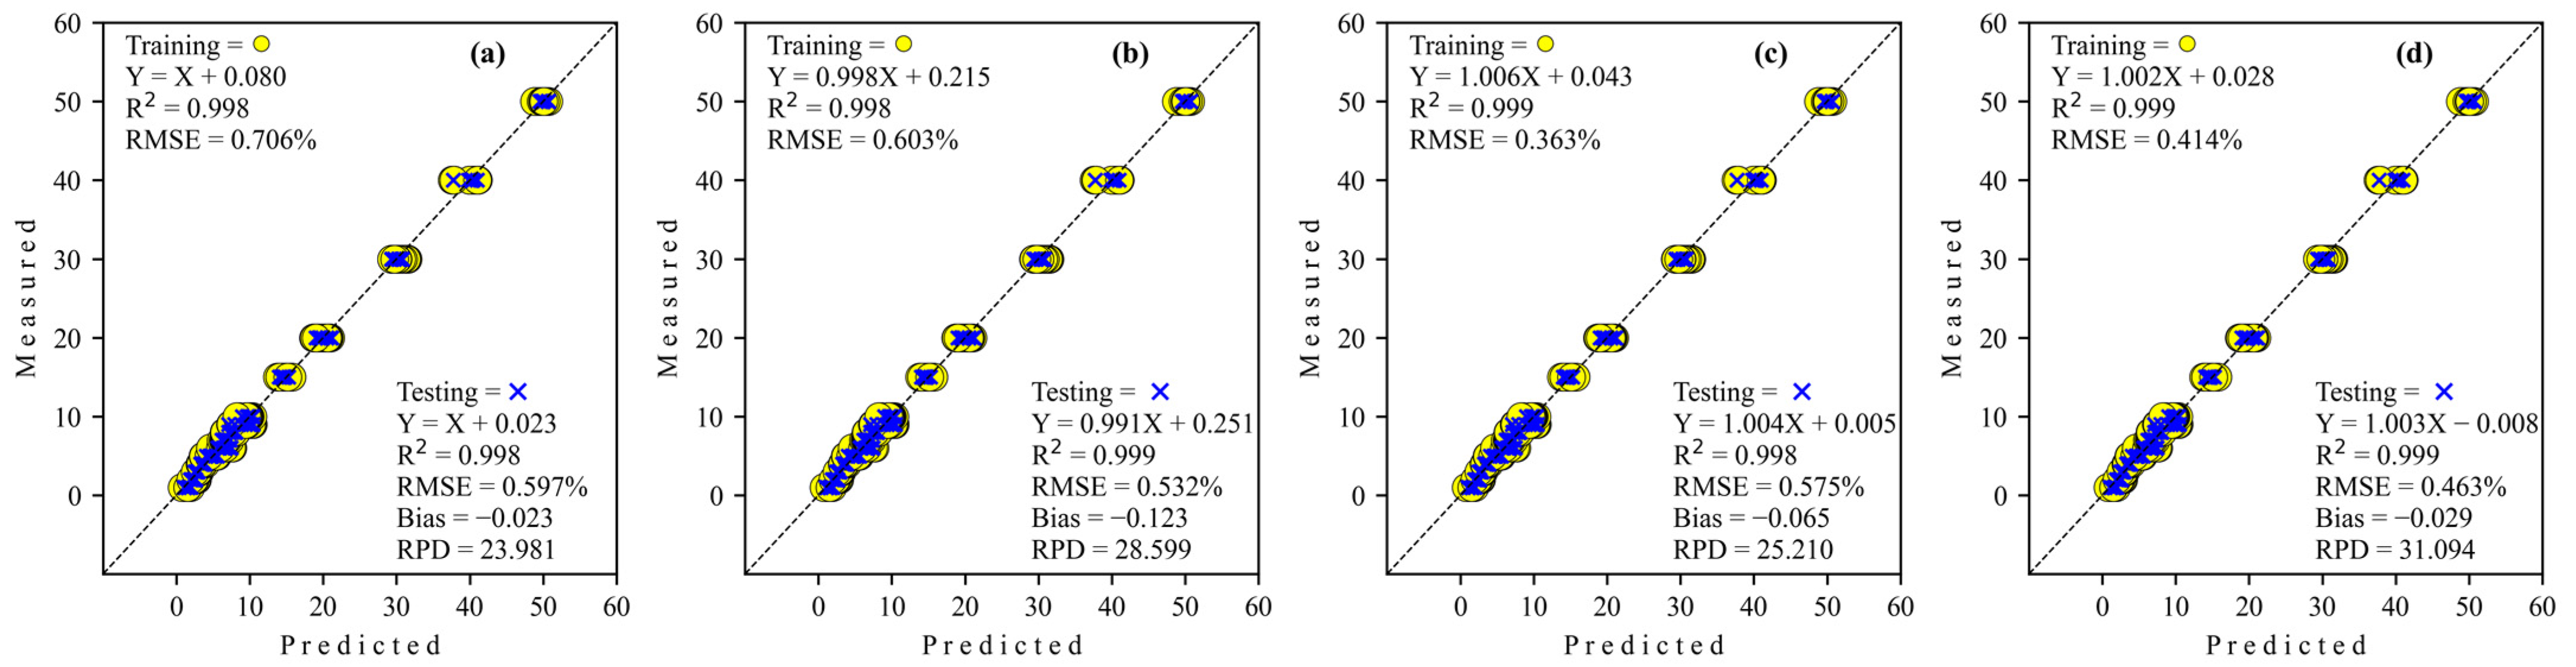
3.3.1. Adulteration by Corn Flour
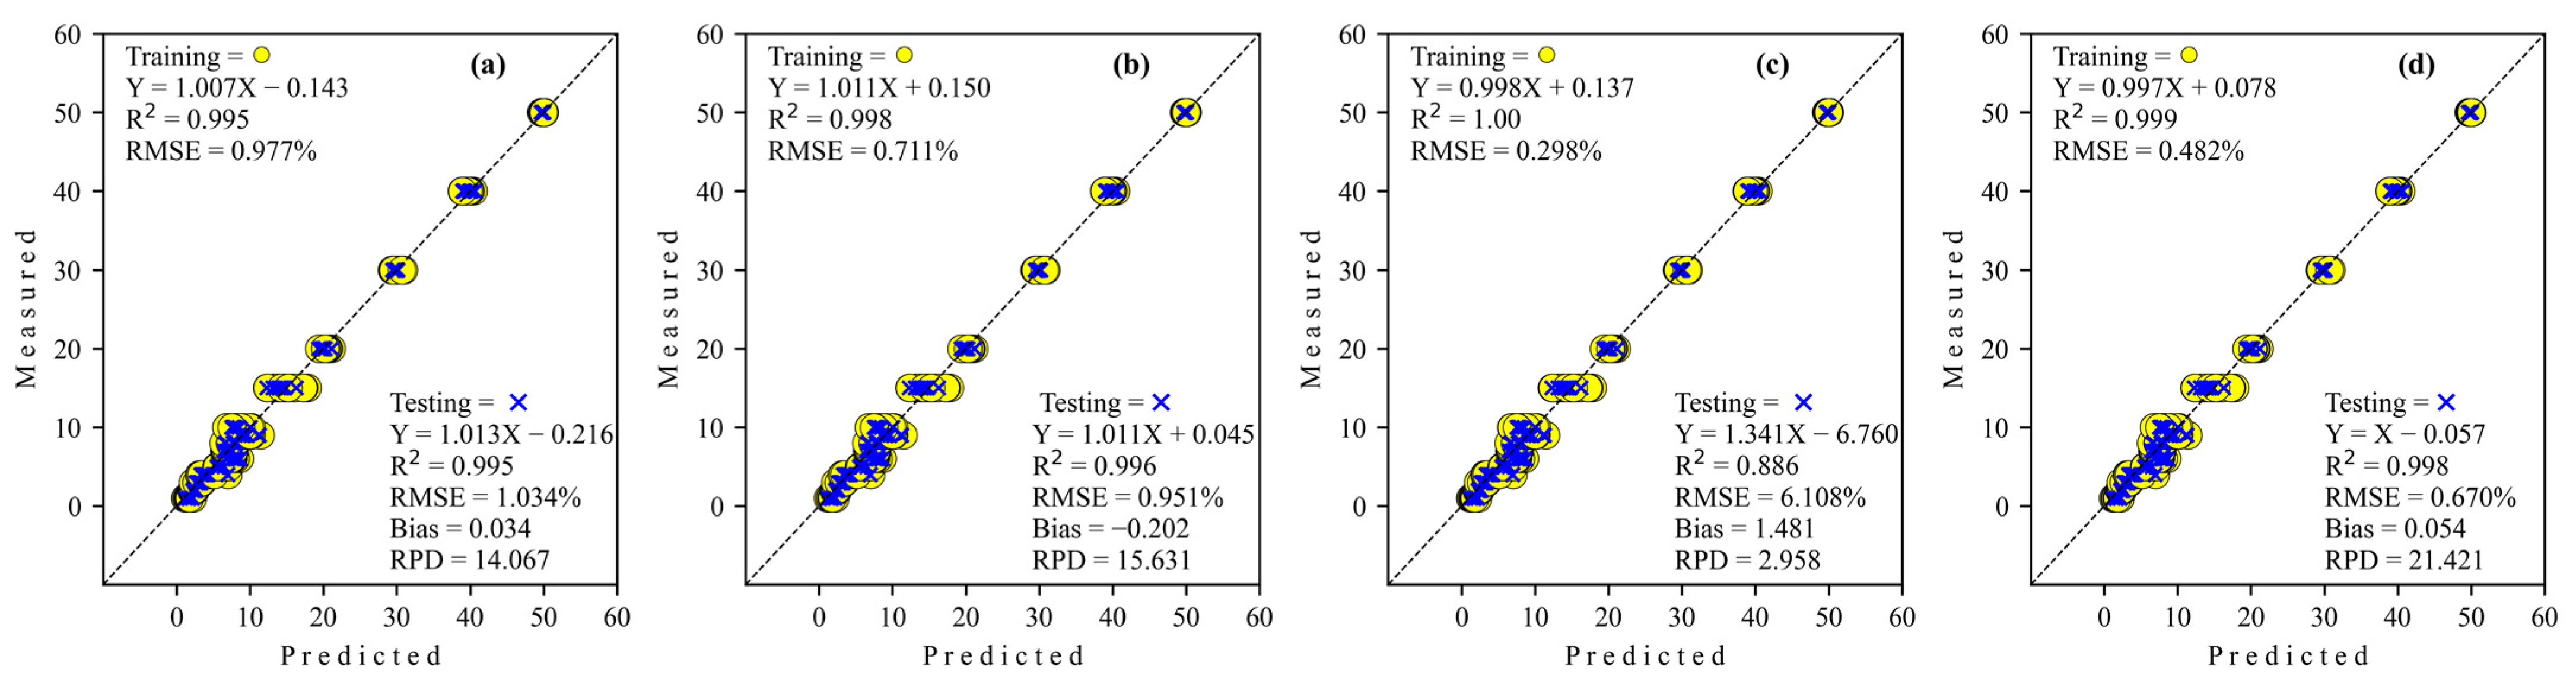
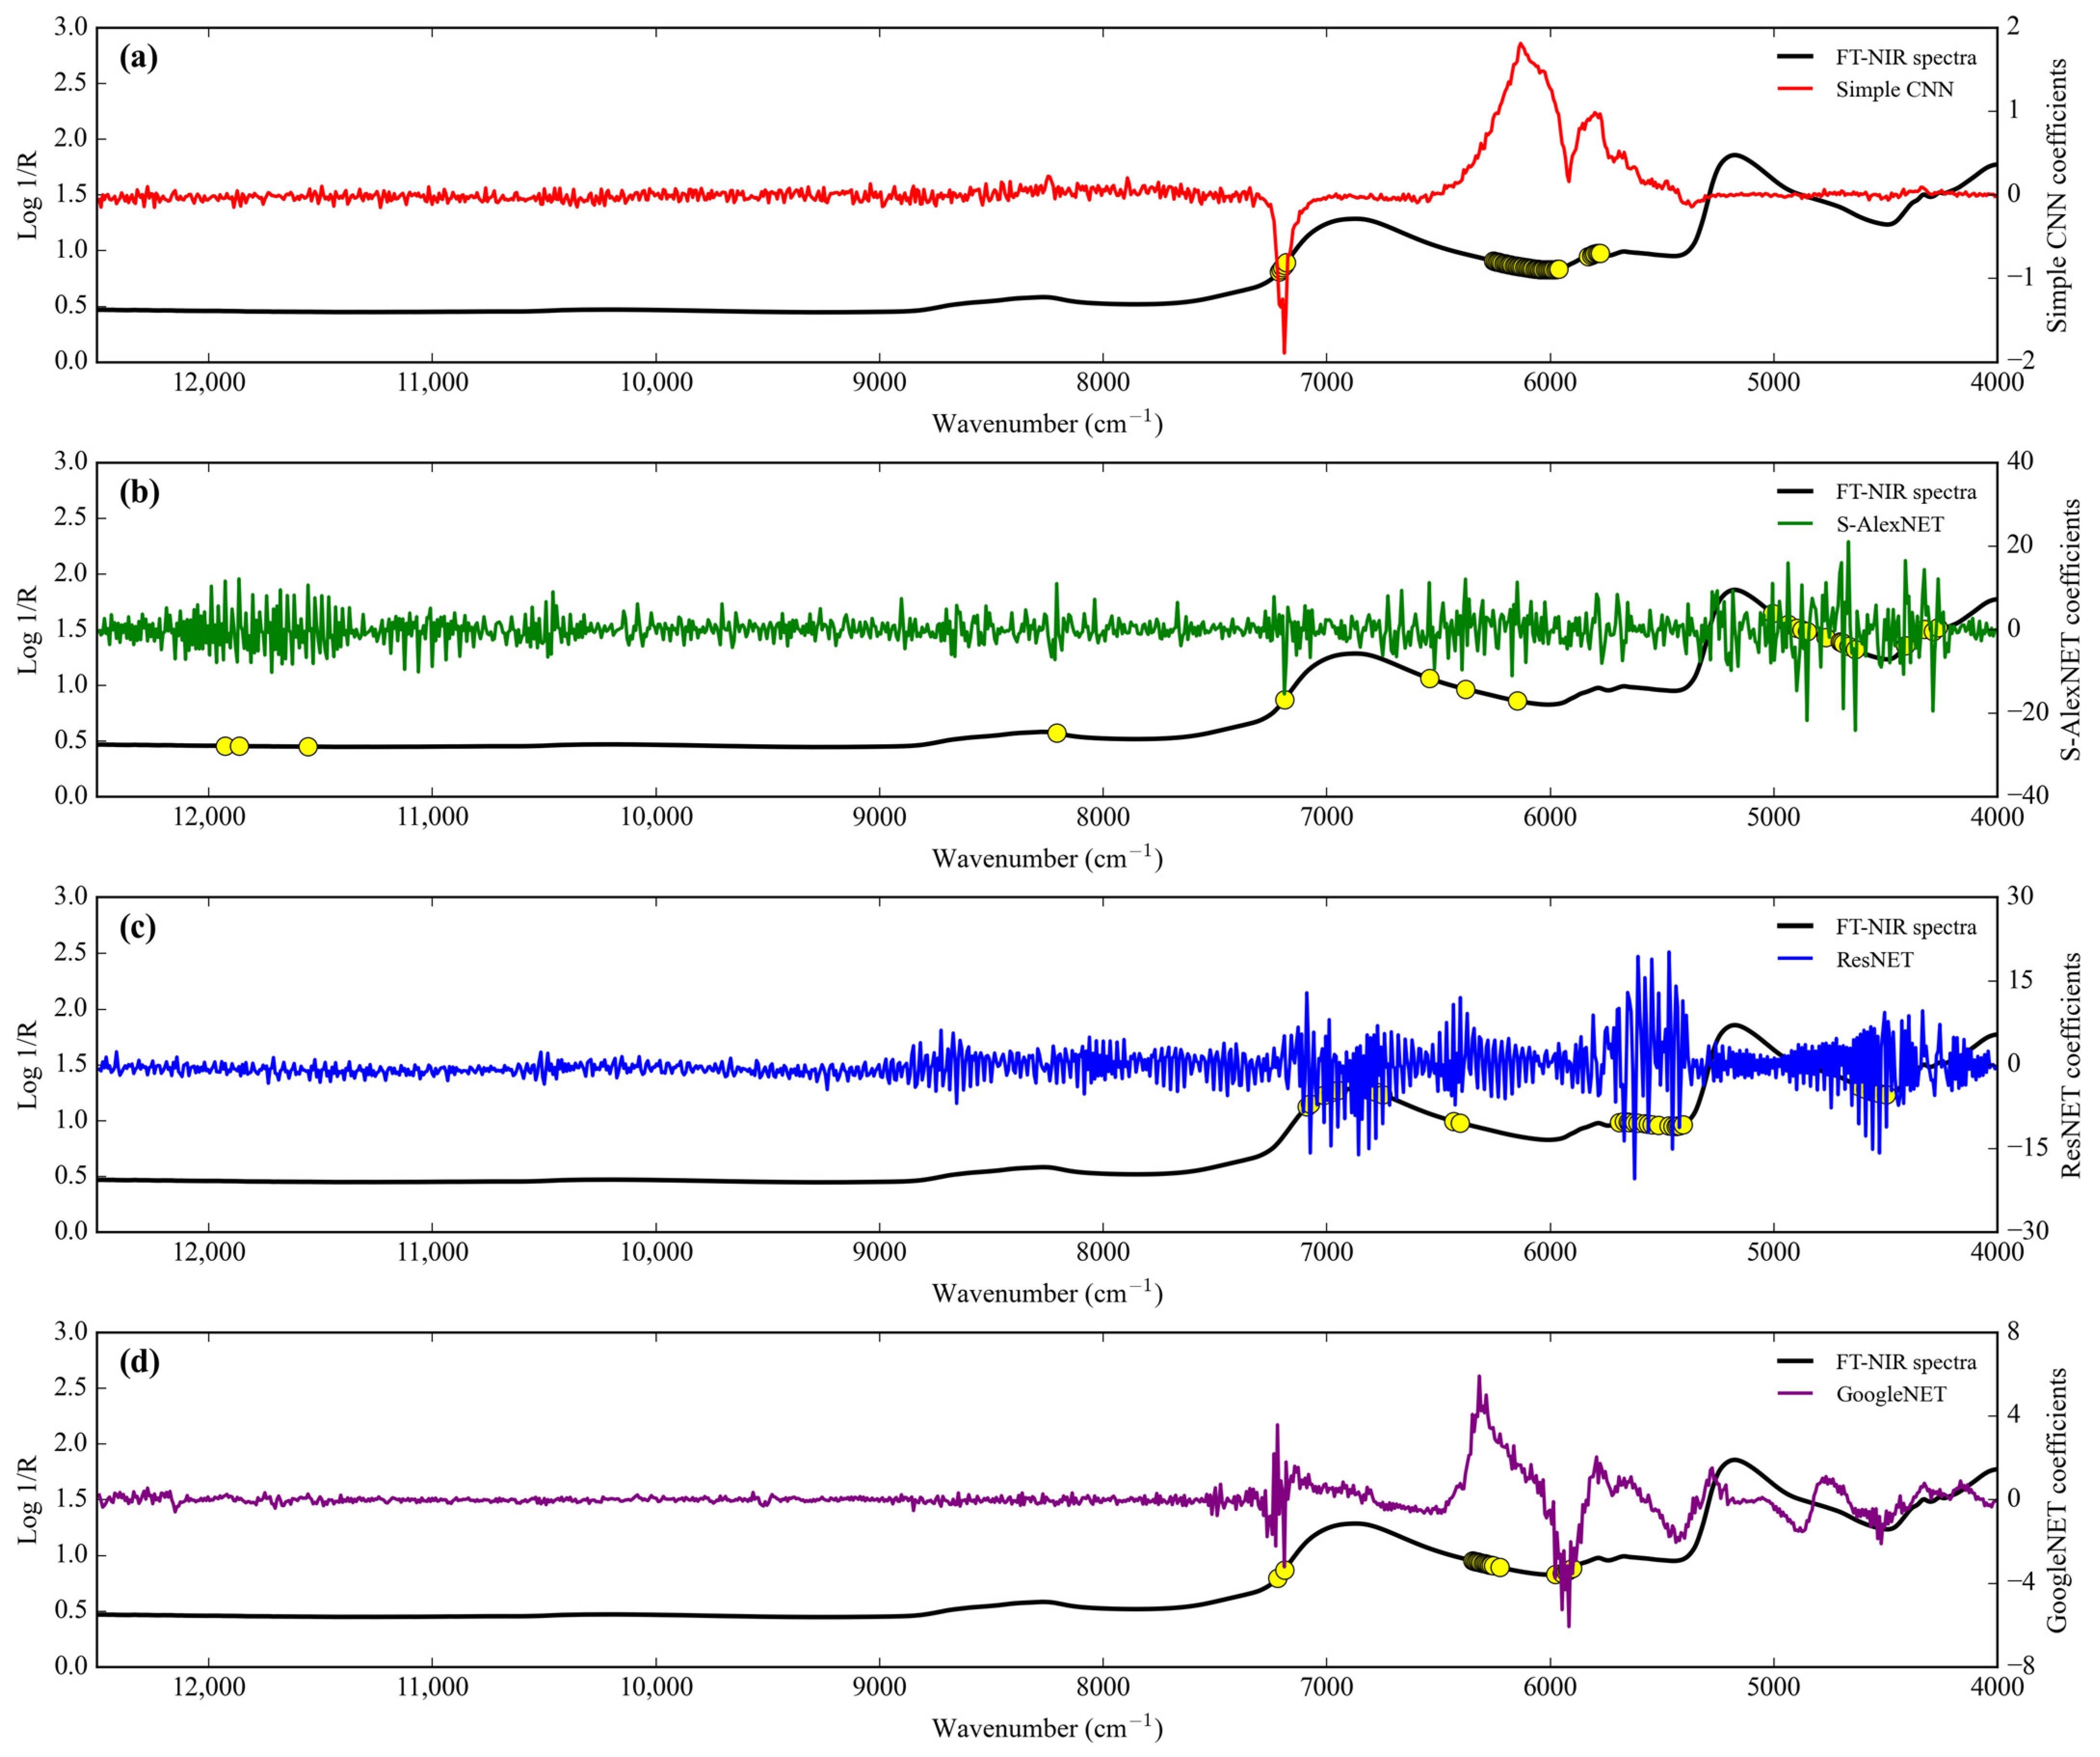
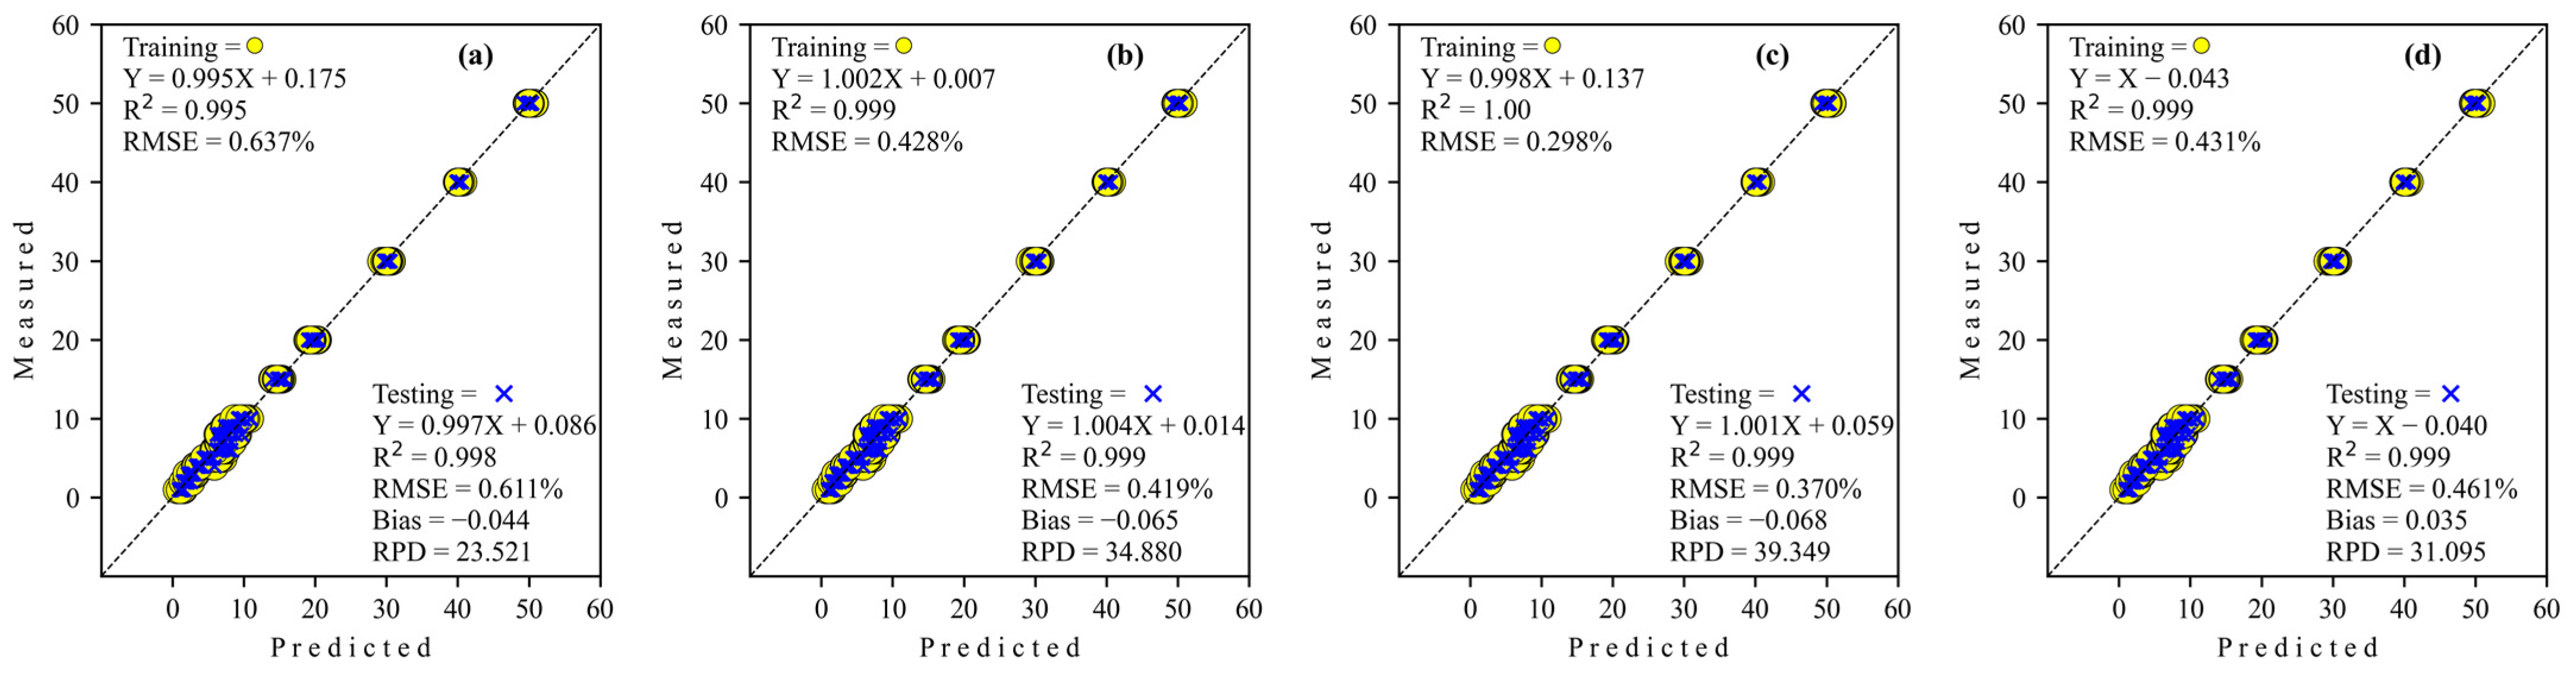
3.3.2. Adulteration by Tapioca Starch
4. Discussion
5. Conclusions
Author Contributions
Funding
Institutional Review Board Statement
Informed Consent Statement
Data Availability Statement
Acknowledgments
Conflicts of Interest
References
- Tansakul, A.; Chaisawang, P. Thermophysical properties of coconut milk. J. Food Eng. 2006, 73, 276–280. [Google Scholar] [CrossRef]
- Lakshanasomya, N.; Danudol, A.; Ningnoi, T. Method performance study for total solids and total fat in coconut milk and products. J. Food Compos. Anal. 2011, 24, 650–655. [Google Scholar] [CrossRef]
- Azlin-Hashim, S.; Siang, Q.L.; Yusof, F.; Zainol, M.K.; Mohd Yusof, H. Chemical composition and potential adulterants in coconut milk sold in Kuala Lumpur. Malays. Appl. Biol. 2019, 48, 27–34. [Google Scholar]
- Nallan Chakravartula, S.S.; Moscetti, R.; Bedini, G.; Nardella, M.; Massantini, R. Use of convolutional neural network (CNN) combined with FT-NIR spectroscopy to predict food adulteration: A case study on coffee. Food Control 2022, 135, 108816. [Google Scholar] [CrossRef]
- Acquarelli, J.; van Laarhoven, T.; Gerretzen, J.; Tran, T.N.; Buydens, L.M.C.; Marchiori, E. Convolutional neural networks for vibrational spectroscopic data analysis. Anal. Chim. Acta 2017, 954, 22–31. [Google Scholar] [CrossRef] [PubMed]
- Sitorus, A.; Lapcharoensuk, R. A rapid method to predict type and adulteration of coconut milk by near-infrared spectroscopy combined with machine learning and chemometric tools. Microchem. J. 2023, 195, 109461. [Google Scholar] [CrossRef]
- Al-Awadhi, M.A.; Deshmukh, R.R. Detection of Adulteration in Coconut Milk using Infrared Spectroscopy and Machine Learning. In Proceedings of the 2021 International Conference of Modern Trends in Information and Communication Technology Industry (MTICTI), Sana’a, Yemen, 4–6 December 2021; pp. 1–4. [Google Scholar]
- Cui, C.; Fearn, T. Modern practical convolutional neural networks for multivariate regression: Applications to NIR calibration. Chemom. Intell. Lab. Syst. 2018, 182, 9–20. [Google Scholar] [CrossRef]
- Engel, J.; Gerretzen, J.; Szymanska, E.; Jansen, J.J.; Downey, G.; Blanchet, L.; Buydens, L.M.C. Breaking with trends in pre-processing? TrAC Trends Anal. Chem. 2013, 50, 96–106. [Google Scholar] [CrossRef]
- Bengio, Y.; Courville, A.; Vincent, P. Representation Learning: A Review and New Perspectives. IEEE Trans. Pattern Anal. Mach. Intell. 2013, 35, 1798–1828. [Google Scholar] [CrossRef]
- Gron, A. Hands-On Machine Learning with Scikit Learn Keras&Tensorflow. 2019; Sebastopol O’Reilly Media Google Scholar Google Scholar Digital Library: California, CA, USA, 2019. [Google Scholar]
- Liu, Y.; Zhou, S.; Han, W.; Li, C.; Liu, W.; Qiu, Z.; Chen, H. Detection of Adulteration in Infant Formula Based on Ensemble Convolutional Neural Network and Near-Infrared Spectroscopy. Foods 2021, 10, 785. [Google Scholar] [CrossRef]
- Said, M.; Wahba, A.; Khalil, D. Semi-supervised deep learning framework for milk analysis using NIR spectrometers. Chemom. Intell. Lab. Syst. 2022, 228, 104619. [Google Scholar] [CrossRef]
- Weng, S.; Guo, B.; Tang, P.; Yin, X.; Pan, F.; Zhao, J.; Huang, L.; Zhang, D. Rapid detection of adulteration of minced beef using Vis/NIR reflectance spectroscopy with multivariate methods. Spectrochim. Acta Part A Mol. Biomol. Spectrosc. 2020, 230, 118005. [Google Scholar] [CrossRef] [PubMed]
- Manley, M. Near-infrared spectroscopy and hyperspectral imaging: Non-destructive analysis of biological materials. Chem. Soc. Rev. 2014, 43, 8200–8214. [Google Scholar] [CrossRef] [PubMed]
- Passos, D.; Mishra, P. Deep Tutti Frutti: Exploring CNN architectures for dry matter prediction in fruit from multi-fruit near-infrared spectra. Chemom. Intell. Lab. Syst. 2023, 243, 105023. [Google Scholar] [CrossRef]
- Yang, J.; Wang, J.; Lu, G.; Fei, S.; Yan, T.; Zhang, C.; Lu, X.; Yu, Z.; Li, W.; Tang, X. TeaNet: Deep learning on Near-Infrared Spectroscopy (NIR) data for the assurance of tea quality. Comput. Electron. Agric. 2021, 190, 106431. [Google Scholar] [CrossRef]
- Jin, B.; Zhang, C.; Jia, L.; Tang, Q.; Gao, L.; Zhao, G.; Qi, H. Identification of Rice Seed Varieties Based on Near-Infrared Hyperspectral Imaging Technology Combined with Deep Learning. ACS Omega 2022, 7, 4735–4749. [Google Scholar] [CrossRef] [PubMed]
- Benmouna, B.; García-Mateos, G.; Sabzi, S.; Fernandez-Beltran, R.; Parras-Burgos, D.; Molina-Martínez, J.M. Convolutional Neural Networks for Estimating the Ripening State of Fuji Apples Using Visible and Near-Infrared Spectroscopy. Food Bioprocess Technol. 2022, 15, 2226–2236. [Google Scholar] [CrossRef]
- Gulli, A.; Pal, S. Deep Learning with Keras; Packt Publishing Ltd.: Birmingham, UK, 2017. [Google Scholar]
- Abadi, M.; Barham, P.; Chen, J.; Chen, Z.; Davis, A.; Dean, J.; Devin, M.; Ghemawat, S.; Irving, G.; Isard, M. TensorFlow: A system for Large-Scale machine learning. In Proceedings of the 12th USENIX Symposium on Operating Systems Design and Implementation (OSDI ’16), Savannah, GA, USA, 2–4 November 2016; pp. 265–283. [Google Scholar]
- Chu, X.; Huang, Y.; Yun, Y.-H.; Bian, X. Chemometric Methods in Analytical Spectroscopy Technology; Springer: Berlin/Heidelberg, Germany, 2022. [Google Scholar] [CrossRef]
- Malvandi, A.; Feng, H.; Kamruzzaman, M. Application of NIR spectroscopy and multivariate analysis for Non-destructive evaluation of apple moisture content during ultrasonic drying. Spectrochim. Acta Part A Mol. Biomol. Spectrosc. 2022, 269, 120733. [Google Scholar] [CrossRef] [PubMed]
- Büning-Pfaue, H. Analysis of water in food by near infrared spectroscopy. Food Chem. 2003, 82, 107–115. [Google Scholar] [CrossRef]
- Workman, J., Jr.; Weyer, L. Practical Guide to Interpretive Near-Infrared Spectroscopy; CRC Press: Boca Raton, FL, USA, 2007. [Google Scholar] [CrossRef]
- Osborne, B.G.; Fearn, T.; Hindle, P.H. Practical NIR Spectroscopy with Applications in Food and Beverage Analysis; Longman Scientific and Technical: London, UK, 1993. [Google Scholar]
- Conzen, J. Multivariate Calibration: A Practical Guide for Developing Methods in the Quantitative Analytical Chemistry; BrukerOptik GmbH: Ettlingen, Germany, 2006. [Google Scholar]
- Basri, K.N.; Laili, A.R.; Tuhaime, N.A.; Hussain, M.N.; Bakar, J.; Sharif, Z.; Abdul Khir, M.F.; Zoolfakar, A.S. FT-NIR, MicroNIR and LED-MicroNIR for detection of adulteration in palm oil via PLS and LDA. Anal. Methods 2018, 10, 4143–4151. [Google Scholar] [CrossRef]
- Lan, Z.; Zhang, Y.; Zhang, Y.; Liu, F.; Ji, D.; Cao, H.; Wang, S.; Lu, T.; Meng, J. Rapid evaluation on pharmacodynamics of Curcumae Rhizoma based on Micro-NIR and benchtop-NIR. J. Pharm. Biomed. Anal. 2021, 200, 114074. [Google Scholar] [CrossRef] [PubMed]
- Palermo, G.; Piraino, P.; Zucht, H.-D. Performance of PLS regression coefficients in selecting variables for each response of a multivariate PLS for omics-type data. Adv. Appl. Bioinform. Chem. 2009, 2, 57–70. [Google Scholar] [CrossRef]
- Wold, S.; Sjöström, M.; Eriksson, L. PLS-regression: A basic tool of chemometrics. Chemom. Intell. Lab. Syst. 2001, 58, 109–130. [Google Scholar] [CrossRef]
- Jiang, H.; Chen, Q. Determination of Adulteration Content in Extra Virgin Olive Oil Using FT-NIR Spectroscopy Combined with the BOSS–PLS Algorithm. Molecules 2019, 24, 2134. [Google Scholar] [CrossRef]
- Wang, Z.; Wu, Q.; Kamruzzaman, M. Portable NIR spectroscopy and PLS based variable selection for adulteration detection in quinoa flour. Food Control 2022, 138, 108970. [Google Scholar] [CrossRef]
- Li, Z.; Song, J.; Ma, Y.; Yu, Y.; He, X.; Guo, Y.; Dou, J.; Dong, H. Identification of aged-rice adulteration based on near-infrared spectroscopy combined with partial least squares regression and characteristic wavelength variables. Food Chem. X 2023, 17, 100539. [Google Scholar] [CrossRef]
- Chen, H.; Tan, C.; Lin, Z.; Li, H. Quantifying several adulterants of notoginseng powder by near-infrared spectroscopy and multivariate calibration. Spectrochim. Acta Part A Mol. Biomol. Spectrosc. 2019, 211, 280–286. [Google Scholar] [CrossRef]
- Chong, I.-G.; Jun, C.-H. Performance of some variable selection methods when multicollinearity is present. Chemom. Intell. Lab. Syst. 2005, 78, 103–112. [Google Scholar] [CrossRef]
- Jiang, H.; Lu, J. Using an optimal CC-PLSR-RBFNN model and NIR spectroscopy for the starch content determination in corn. Spectrochim. Acta Part A Mol. Biomol. Spectrosc. 2018, 196, 131–140. [Google Scholar] [CrossRef]
- Williams, P. Influence of water on prediction of composition and quality factors: The aquaphotomics of low moisture agricultural materials. J. Near Infrared Spectrosc. 2009, 17, 315–328. [Google Scholar] [CrossRef]
- Phetpan, K.; Sirisomboon, P. Evaluation of the moisture content of tapioca starch using near-infrared spectroscopy. J. Innov. Opt. Health Sci. 2015, 8, 1550014. [Google Scholar] [CrossRef]


 Feature importance.
Feature importance.
Feature importance.
 Feature importance.
Feature importance.
Feature importance.
 Feature importance.
Feature importance.
Feature importance.
 Feature importance.
Feature importance.
Feature importance.

| Adulteration Material | Instruments | m | Training | Testing | ||||||
|---|---|---|---|---|---|---|---|---|---|---|
| Min–Max | Mean | SD | n | Min–Max | Mean | SD | n | |||
| Corn flour | FT-NIR | 1102 | 1–50 | 14.00 | 14.329 | 315 | 1–50 | 14.00 | 14.359 | 135 |
| Micro-NIR | 125 | 1–50 | 14.00 | 14.329 | 315 | 1–50 | 14.00 | 14.359 | 135 | |
| Tapioca starch | FT-NIR | 1102 | 1–50 | 14.00 | 14.329 | 315 | 1–50 | 14.00 | 14.359 | 135 |
| Micro-NIR | 125 | 1–50 | 14.00 | 14.329 | 315 | 1–50 | 14.00 | 14.359 | 135 | |
| Regressor | Epoch | Training | Testing | |||||
|---|---|---|---|---|---|---|---|---|
| R2 | RMSE | Bias | R2 | RMSE | Bias | RPD | ||
| Simple CNN | 8035 | 0.999 | 0.370 | −0.120 | 0.993 | 1.204 | −0.012 | 11.884 |
| S-AlexNET | 3300 | 0.999 | 0.520 | 0.076 | 0.997 | 0.858 | 0.176 | 17.213 |
| ResNET | 5929 | 0.996 | 0.958 | 0.027 | 0.992 | 1.256 | 0.101 | 11.429 |
| GoogleNET | 10202 | 0.998 | 0.601 | −0.037 | 0.998 | 0.686 | 0.012 | 20.866 |
| Regressor | Epoch | Training | Testing | |||||
|---|---|---|---|---|---|---|---|---|
| R2 | RMSE | Bias | R2 | RMSE | Bias | RPD | ||
| Simple CNN | 5633 | 0.995 | 0.977 | 0.039 | 0.995 | 1.034 | 0.034 | 14.067 |
| S-AlexNET | 3000 | 0.998 | 0.711 | −0.299 | 0.996 | 0.951 | −0.202 | 15.631 |
| ResNET | 2603 | 0.892 | 5.850 | 1.017 | 0.886 | 6.108 | 1.481 | 2.958 |
| GoogleNET | 10202 | 0.999 | 0.482 | −0.035 | 0.998 | 0.670 | 0.054 | 21.421 |
| Regressor | Epoch | Training | Testing | |||||
|---|---|---|---|---|---|---|---|---|
| R2 | RMSE | Bias | R2 | RMSE | Bias | RPD | ||
| Simple CNN | 6596 | 0.998 | 0.706 | −0.084 | 0.998 | 0.597 | −0.023 | 23.981 |
| S-AlexNET | 3300 | 0.998 | 0.603 | −0.183 | 0.999 | 0.532 | −0.123 | 28.599 |
| ResNET | 6091 | 0.999 | 0.363 | −0.129 | 0.998 | 0.575 | −0.065 | 25.210 |
| GoogleNET | 10128 | 0.999 | 0.414 | −0.053 | 0.999 | 0.463 | −0.029 | 31.094 |
| Regressor | Epoch | Training | Testing | |||||
|---|---|---|---|---|---|---|---|---|
| R2 | RMSE | Bias | R2 | RMSE | Bias | RPD | ||
| Simple CNN | 8872 | 0.998 | 0.637 | −0.105 | 0.998 | 0.611 | −0.044 | 23.521 |
| S-AlexNET | 2700 | 0.999 | 0.428 | −0.029 | 0.999 | 0.419 | −0.065 | 34.880 |
| ResNET | 7814 | 1.000 | 0.298 | −0.111 | 0.999 | 0.370 | −0.068 | 39.349 |
| GoogleNET | 9840 | 0.999 | 0.431 | 0.041 | 0.999 | 0.461 | 0.035 | 31.095 |
| Adulteration Material | Instruments | The Best Regressor | RPD |
|---|---|---|---|
| Corn flour | FT-NIR | GoogleNET | 20.866 |
| Micro-NIR | GoogleNET | 31.094 | |
| Tapioca starch | FT-NIR | GoogleNET | 21.421 |
| Micro-NIR | ResNET | 39.349 |
Disclaimer/Publisher’s Note: The statements, opinions and data contained in all publications are solely those of the individual author(s) and contributor(s) and not of MDPI and/or the editor(s). MDPI and/or the editor(s) disclaim responsibility for any injury to people or property resulting from any ideas, methods, instructions or products referred to in the content. |
© 2024 by the authors. Licensee MDPI, Basel, Switzerland. This article is an open access article distributed under the terms and conditions of the Creative Commons Attribution (CC BY) license (https://creativecommons.org/licenses/by/4.0/).
Share and Cite
Sitorus, A.; Lapcharoensuk, R. Exploring Deep Learning to Predict Coconut Milk Adulteration Using FT-NIR and Micro-NIR Spectroscopy. Sensors 2024, 24, 2362. https://doi.org/10.3390/s24072362
Sitorus A, Lapcharoensuk R. Exploring Deep Learning to Predict Coconut Milk Adulteration Using FT-NIR and Micro-NIR Spectroscopy. Sensors. 2024; 24(7):2362. https://doi.org/10.3390/s24072362
Chicago/Turabian StyleSitorus, Agustami, and Ravipat Lapcharoensuk. 2024. "Exploring Deep Learning to Predict Coconut Milk Adulteration Using FT-NIR and Micro-NIR Spectroscopy" Sensors 24, no. 7: 2362. https://doi.org/10.3390/s24072362
APA StyleSitorus, A., & Lapcharoensuk, R. (2024). Exploring Deep Learning to Predict Coconut Milk Adulteration Using FT-NIR and Micro-NIR Spectroscopy. Sensors, 24(7), 2362. https://doi.org/10.3390/s24072362