

Infrared and Visual Image Fusion Based on a Local-Extrema-Driven Image Filter


Abstract
1. Introduction
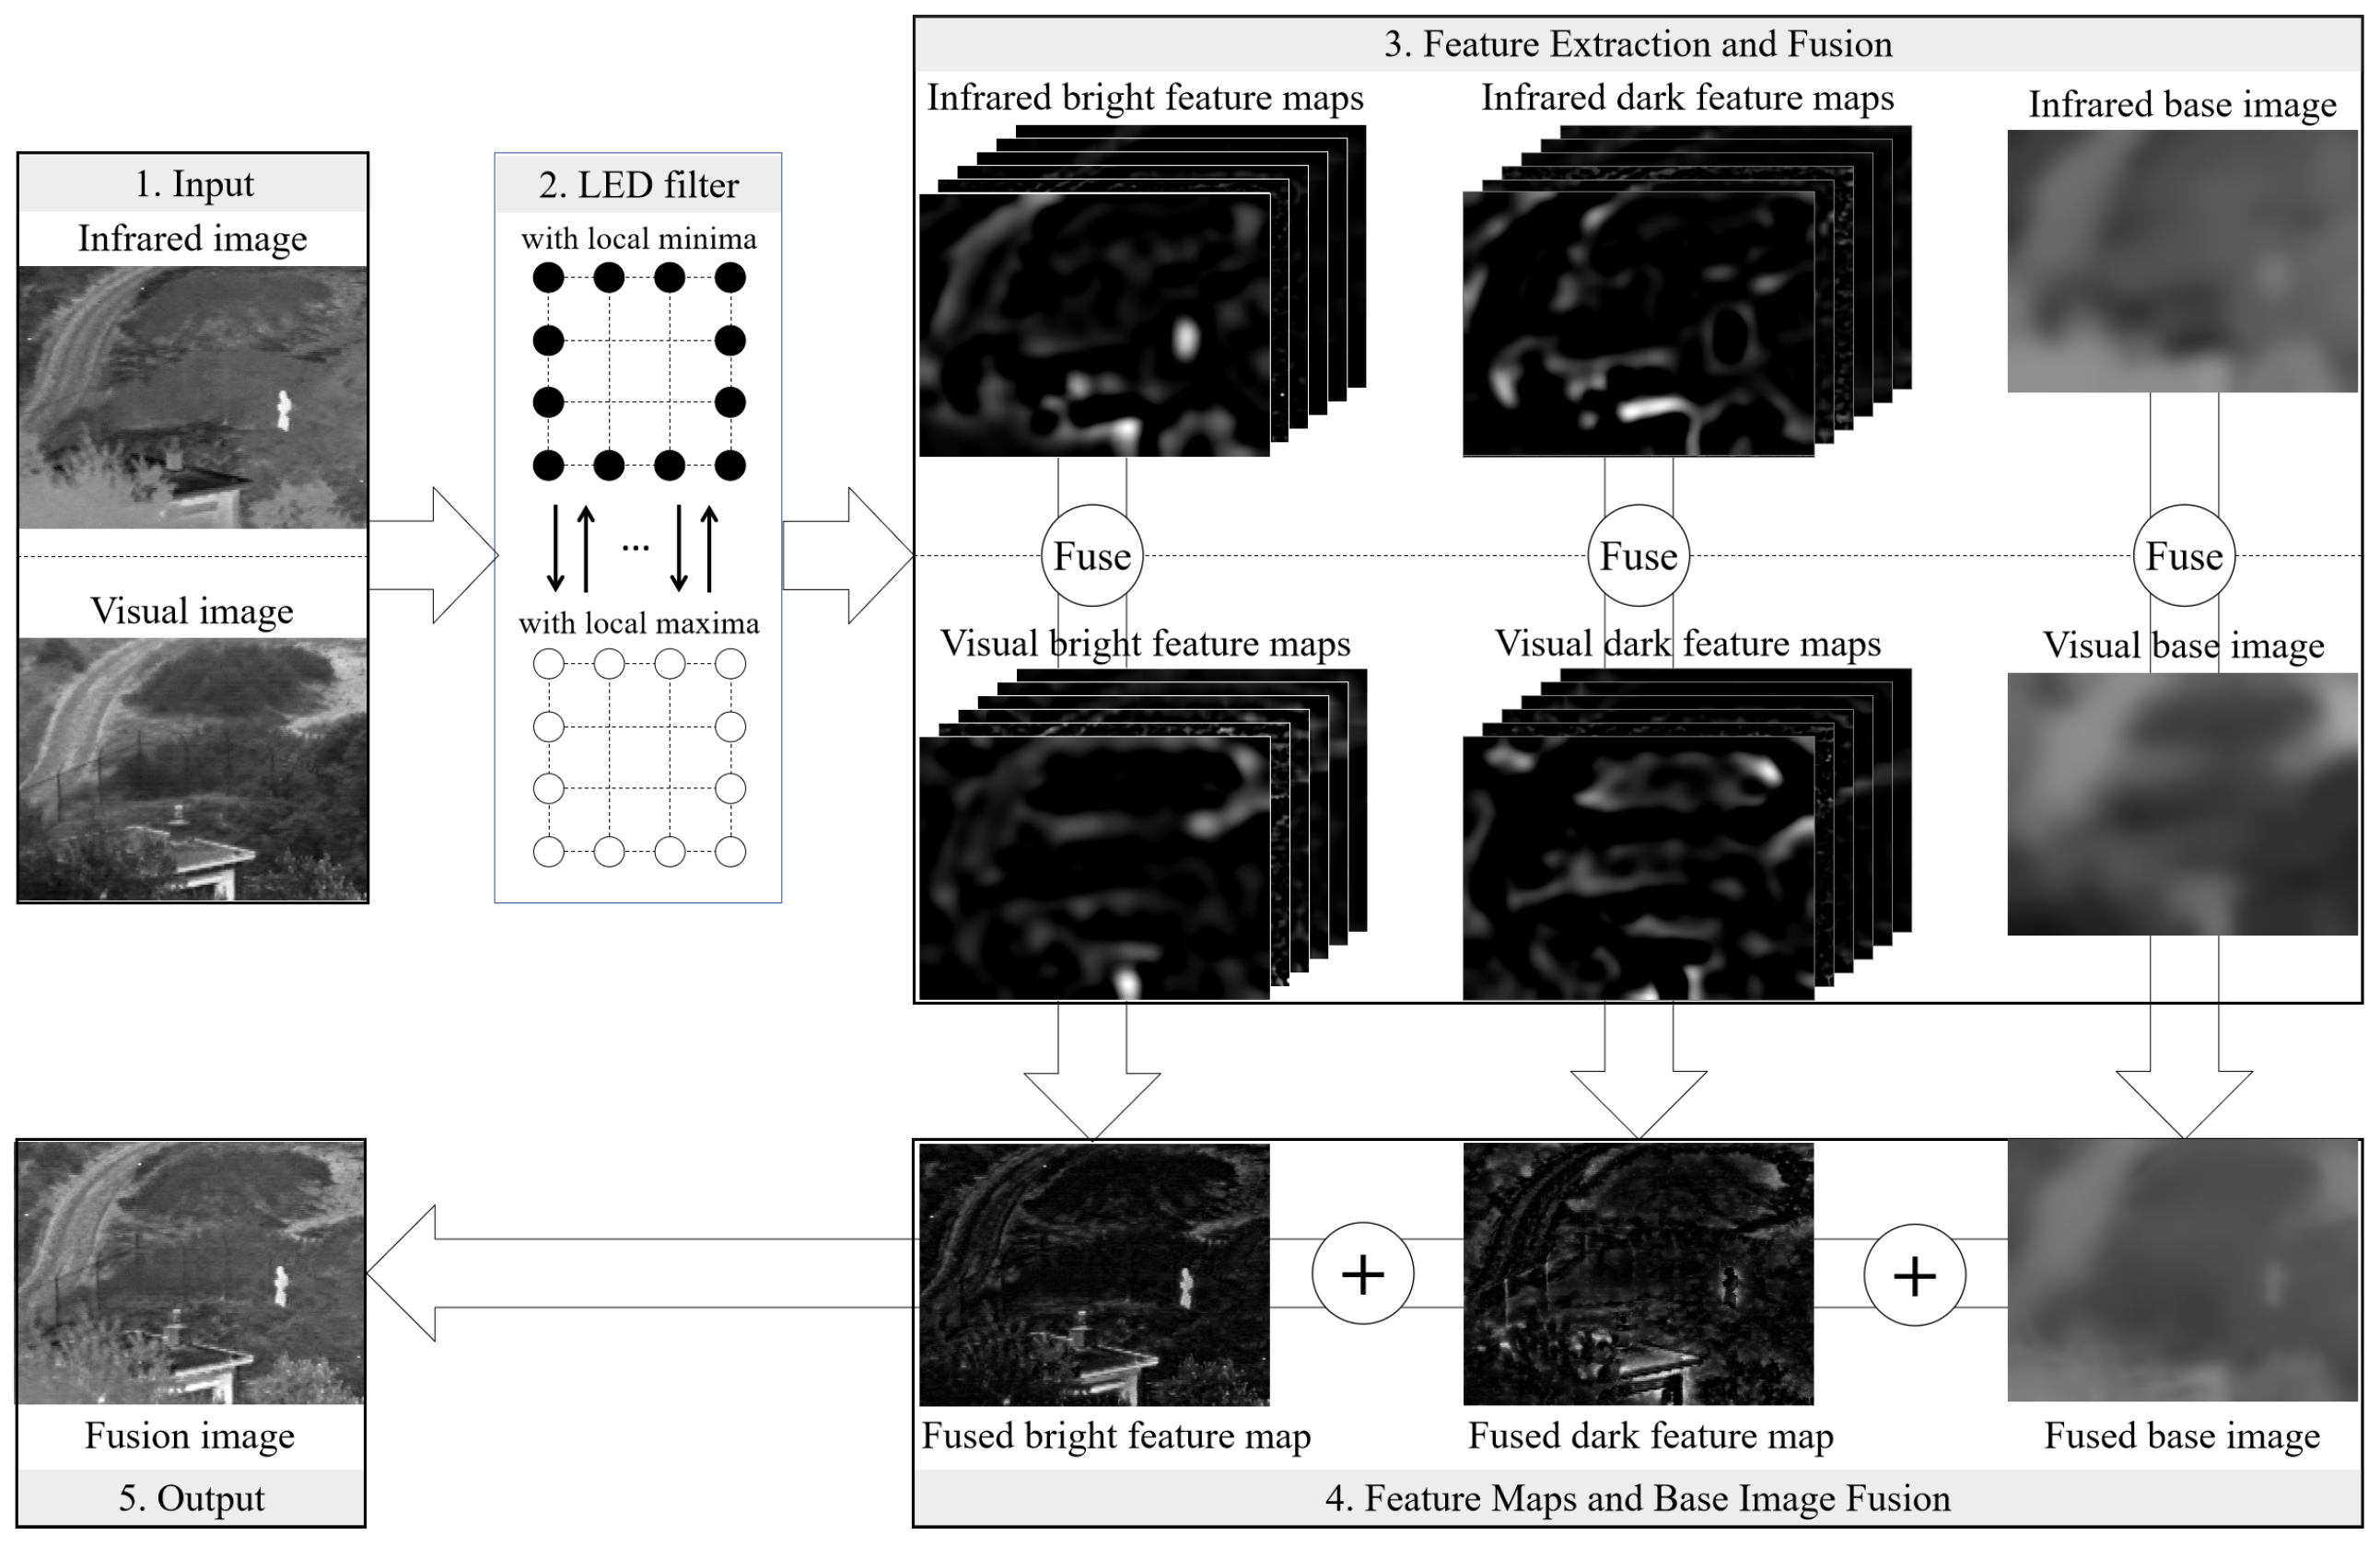
2. Proposed Method
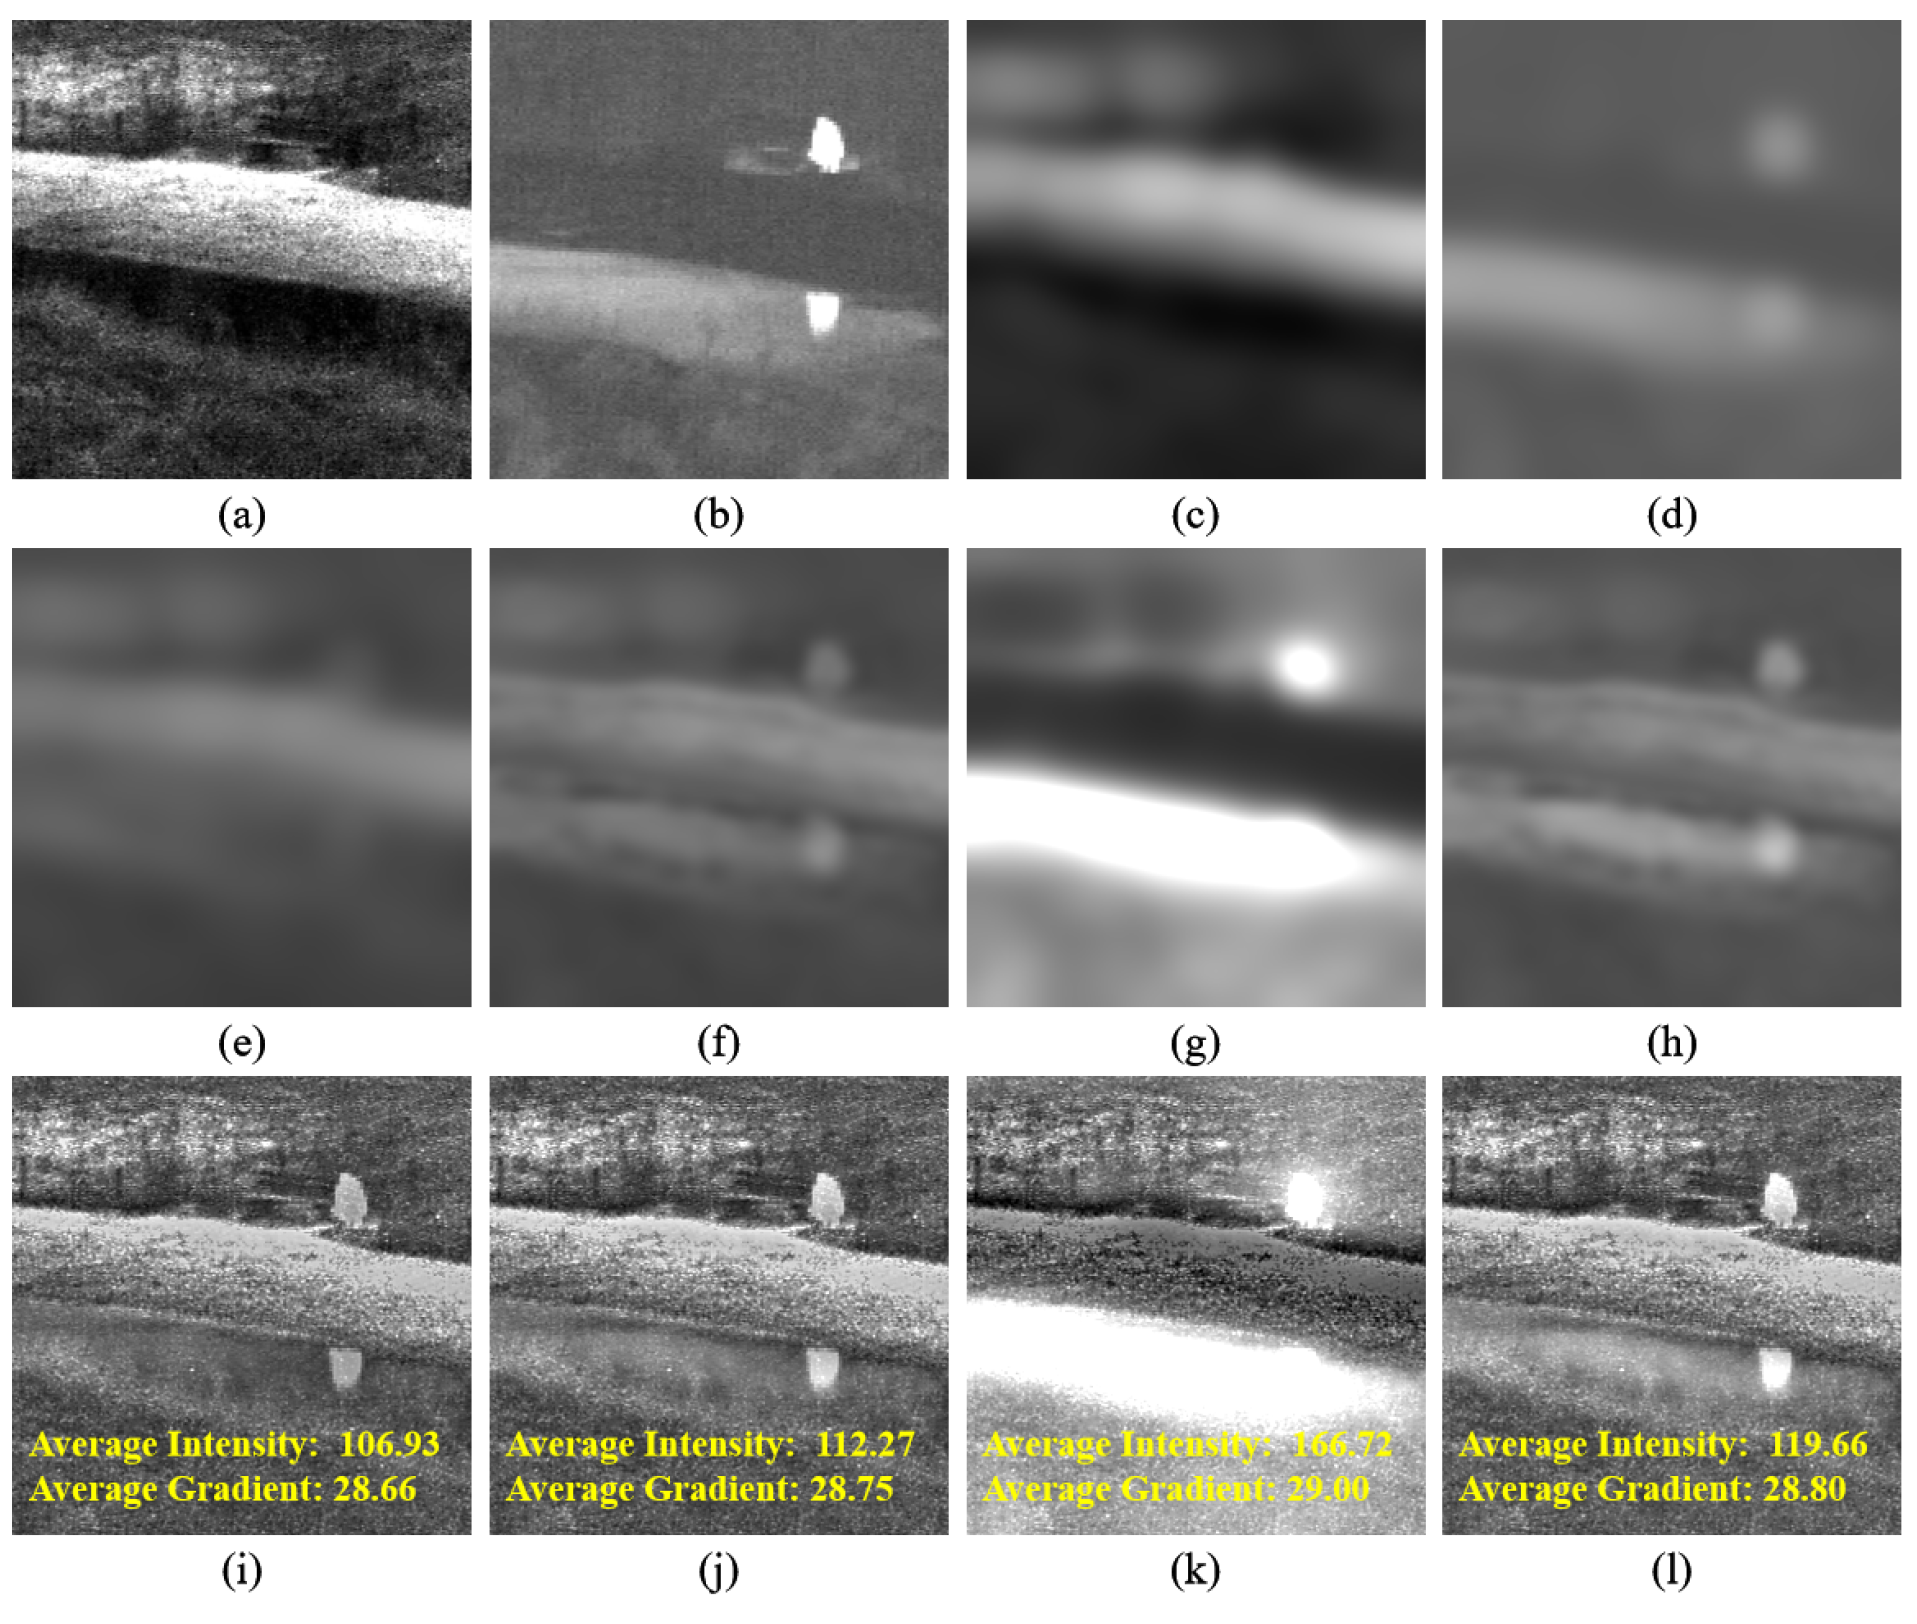
2.1. Local-Extrema-Driven Image Filter
2.2. Local-Extrema-Driven Image Fusion
2.3. Parameter Settings
3. Experimental Results and Discussion
3.1. Experimental Settings
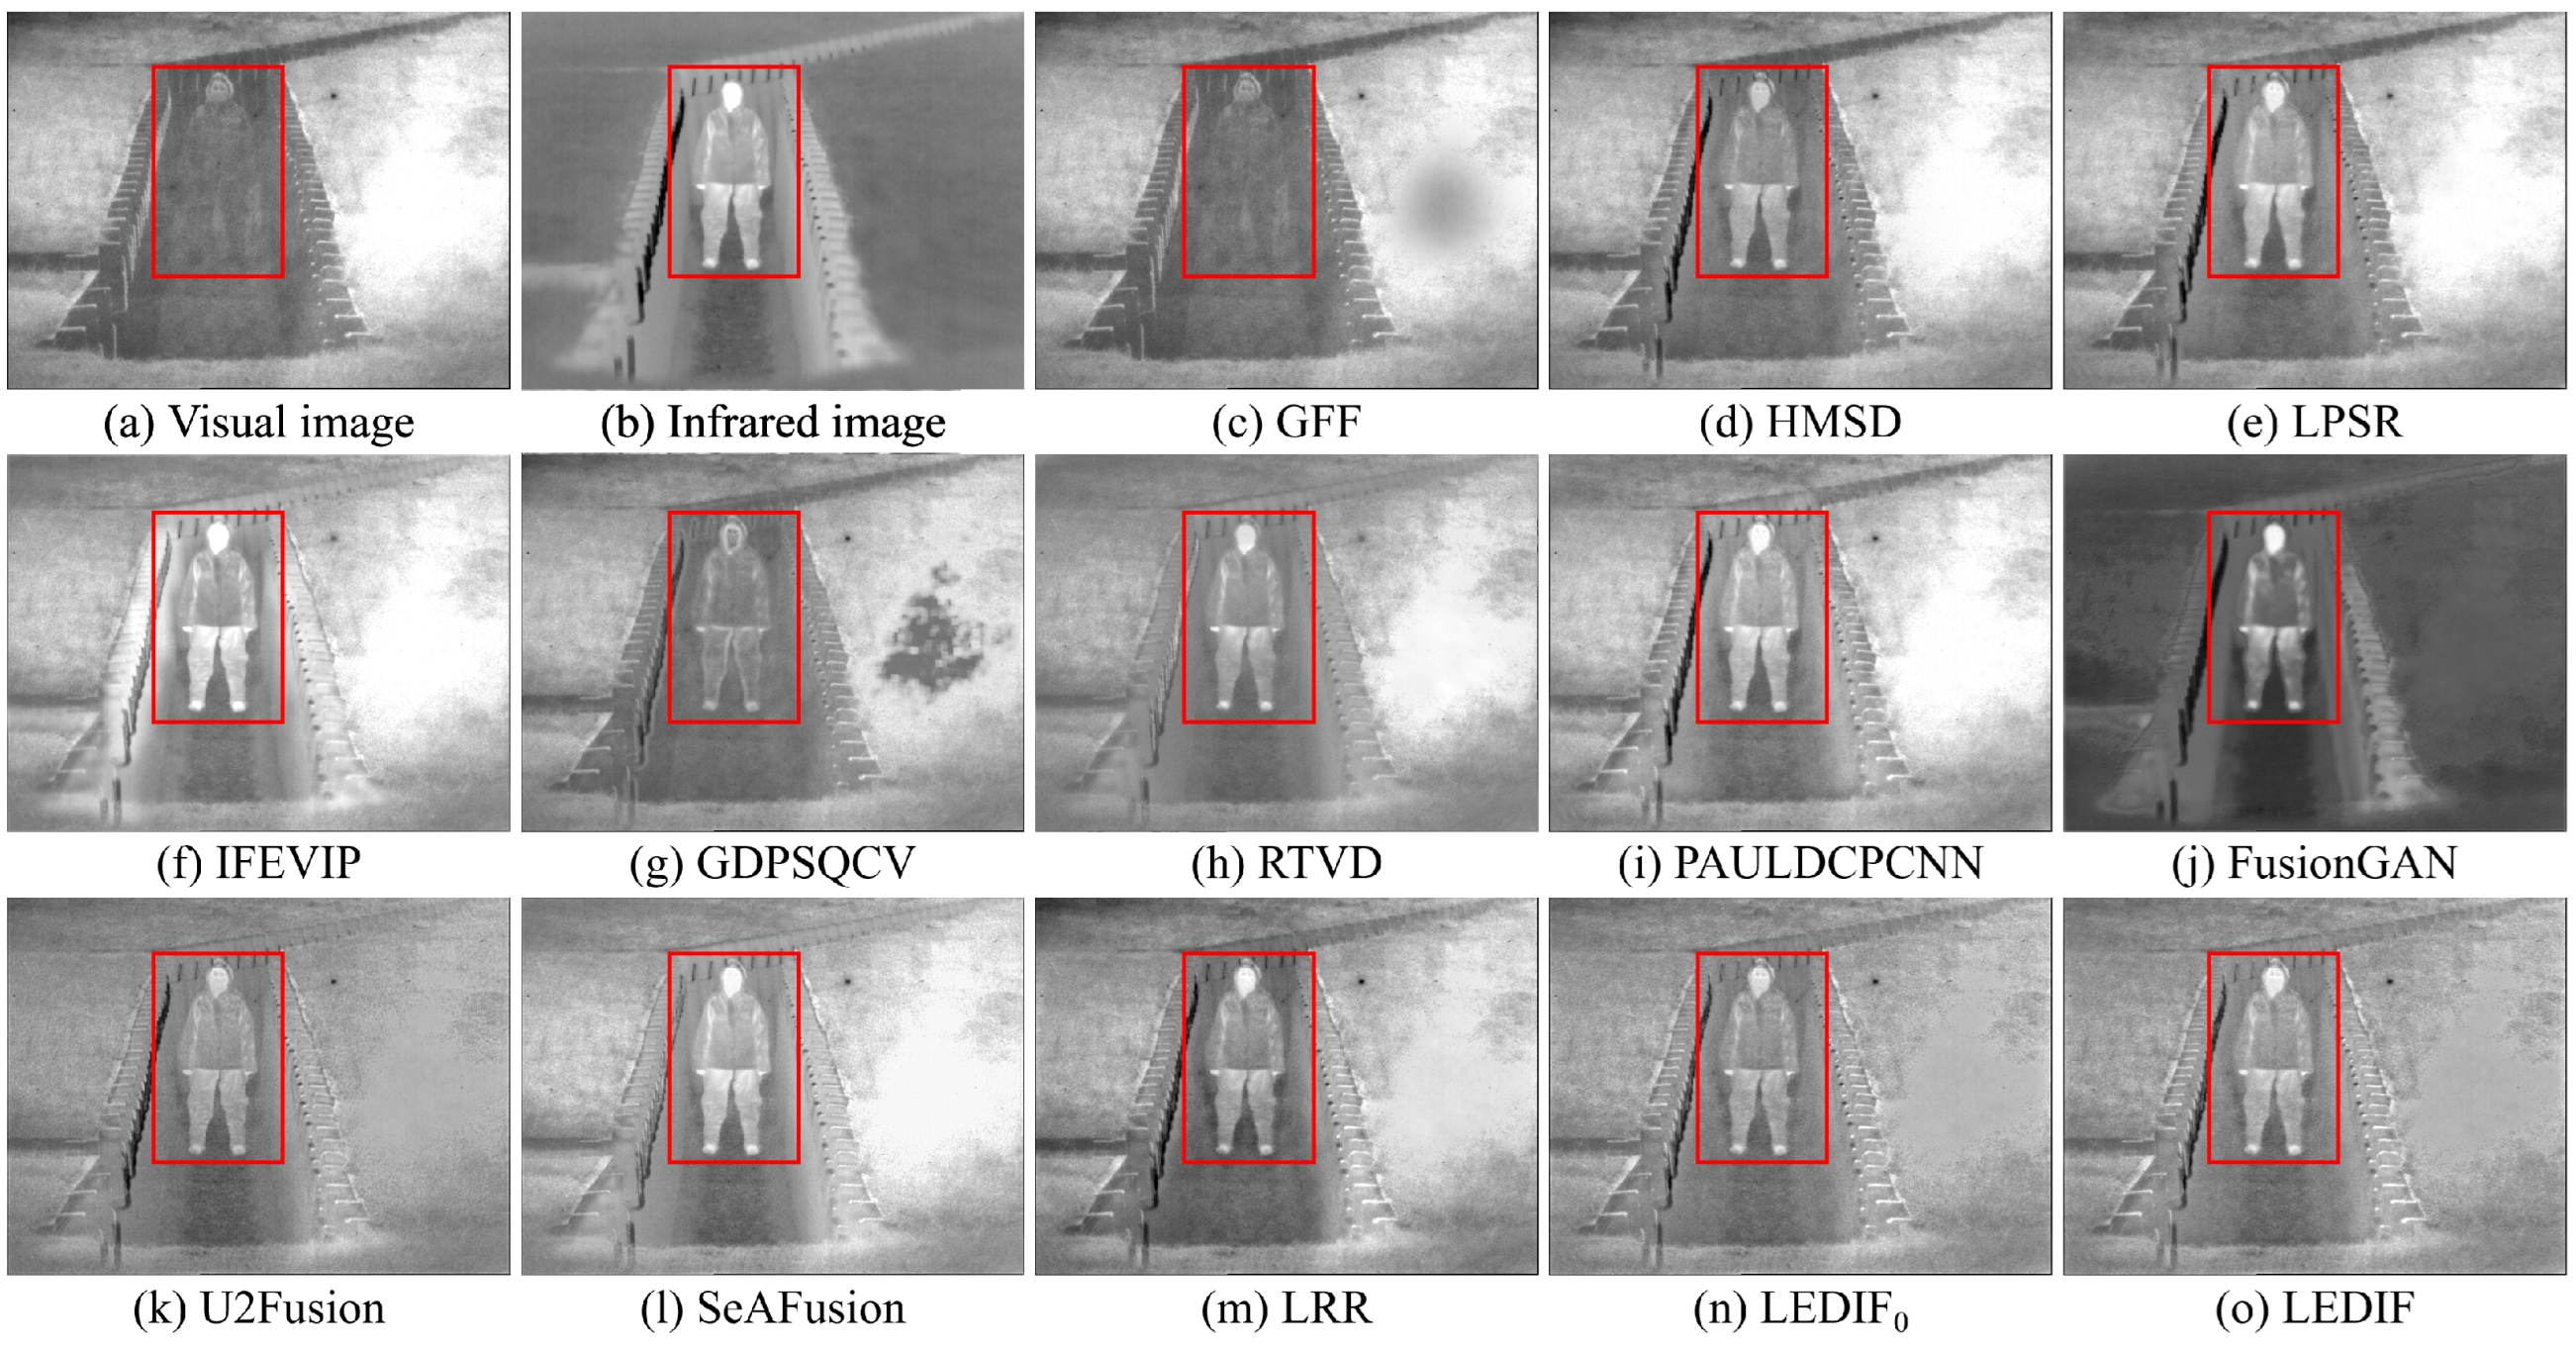
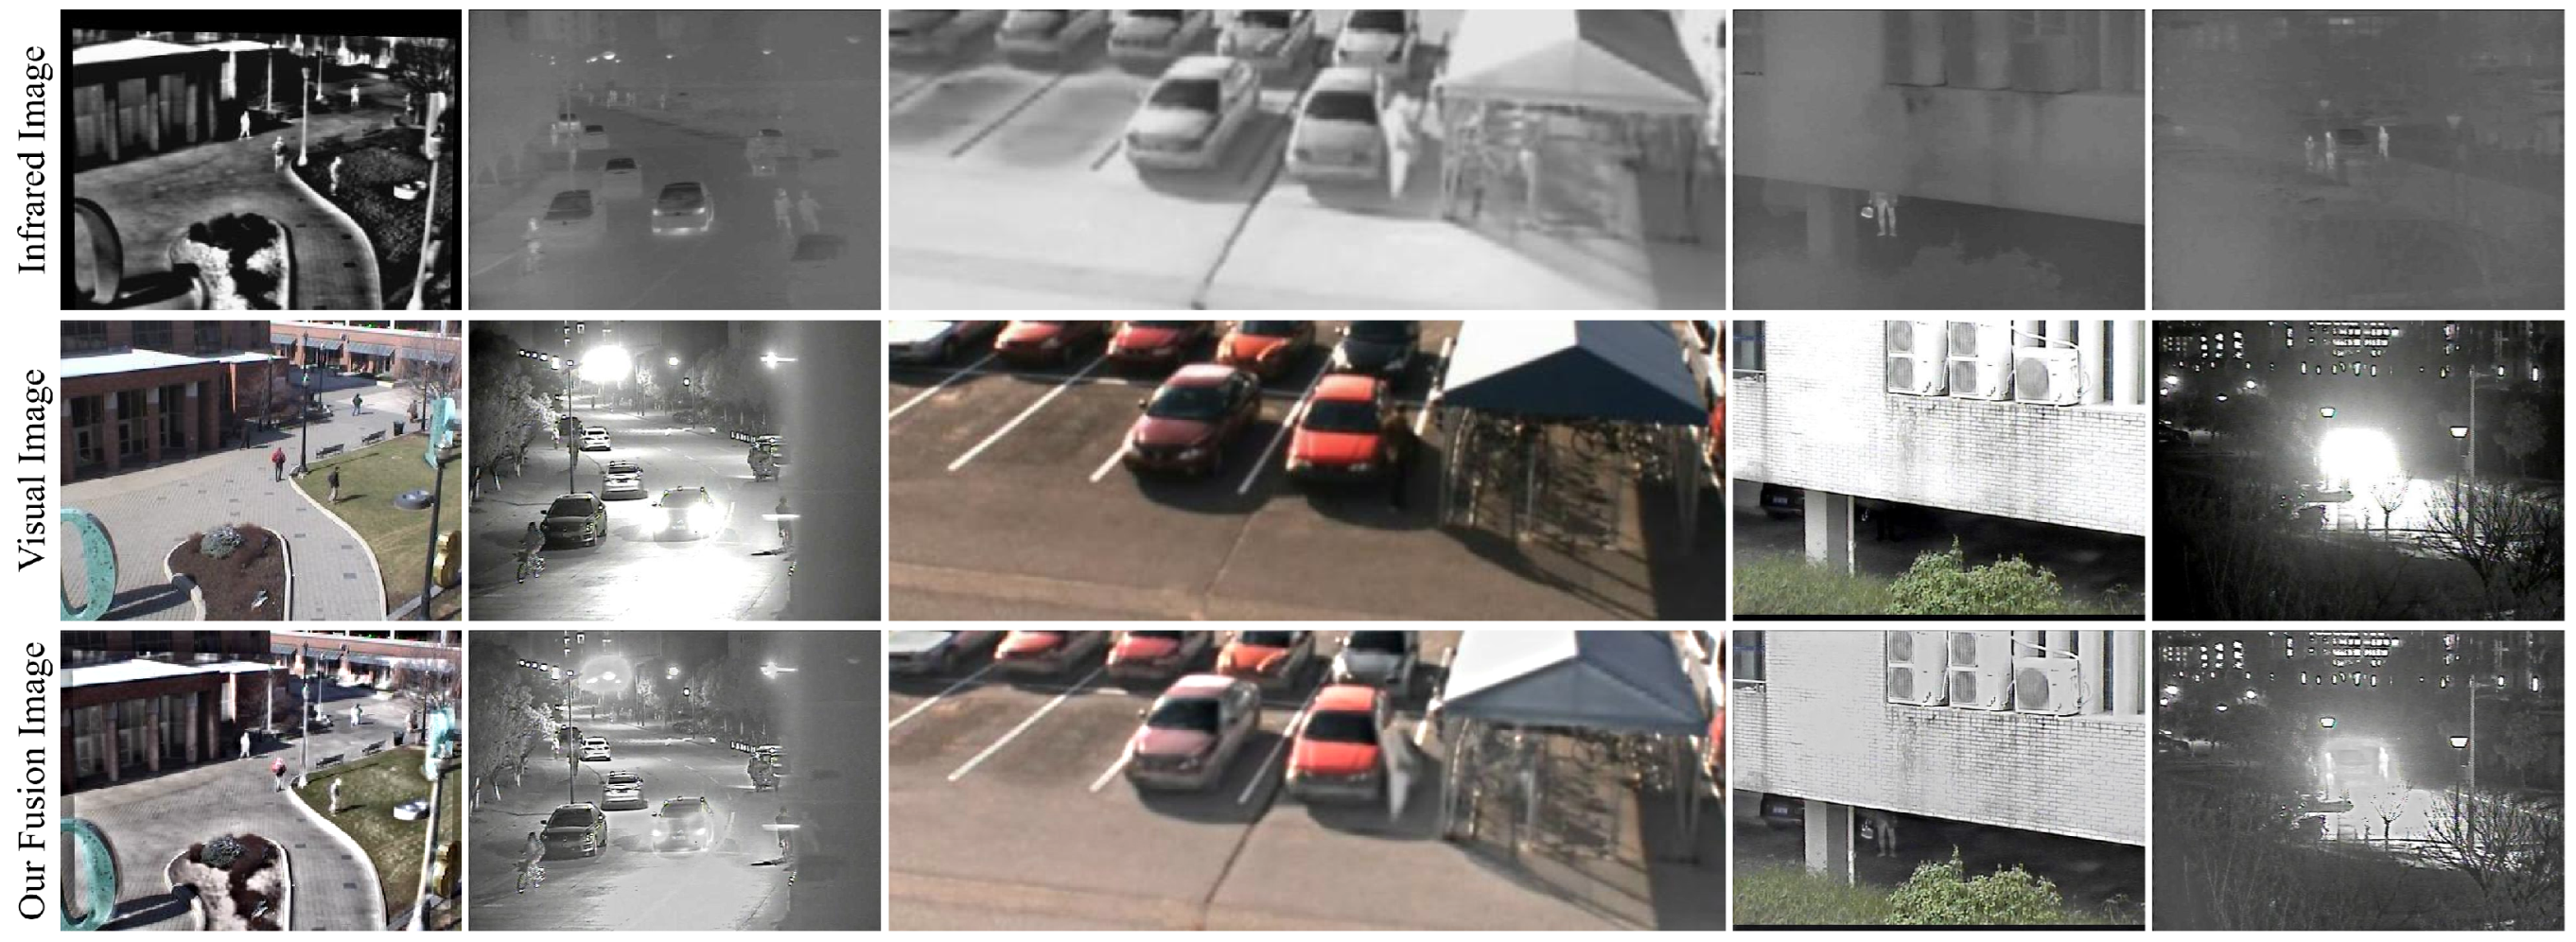
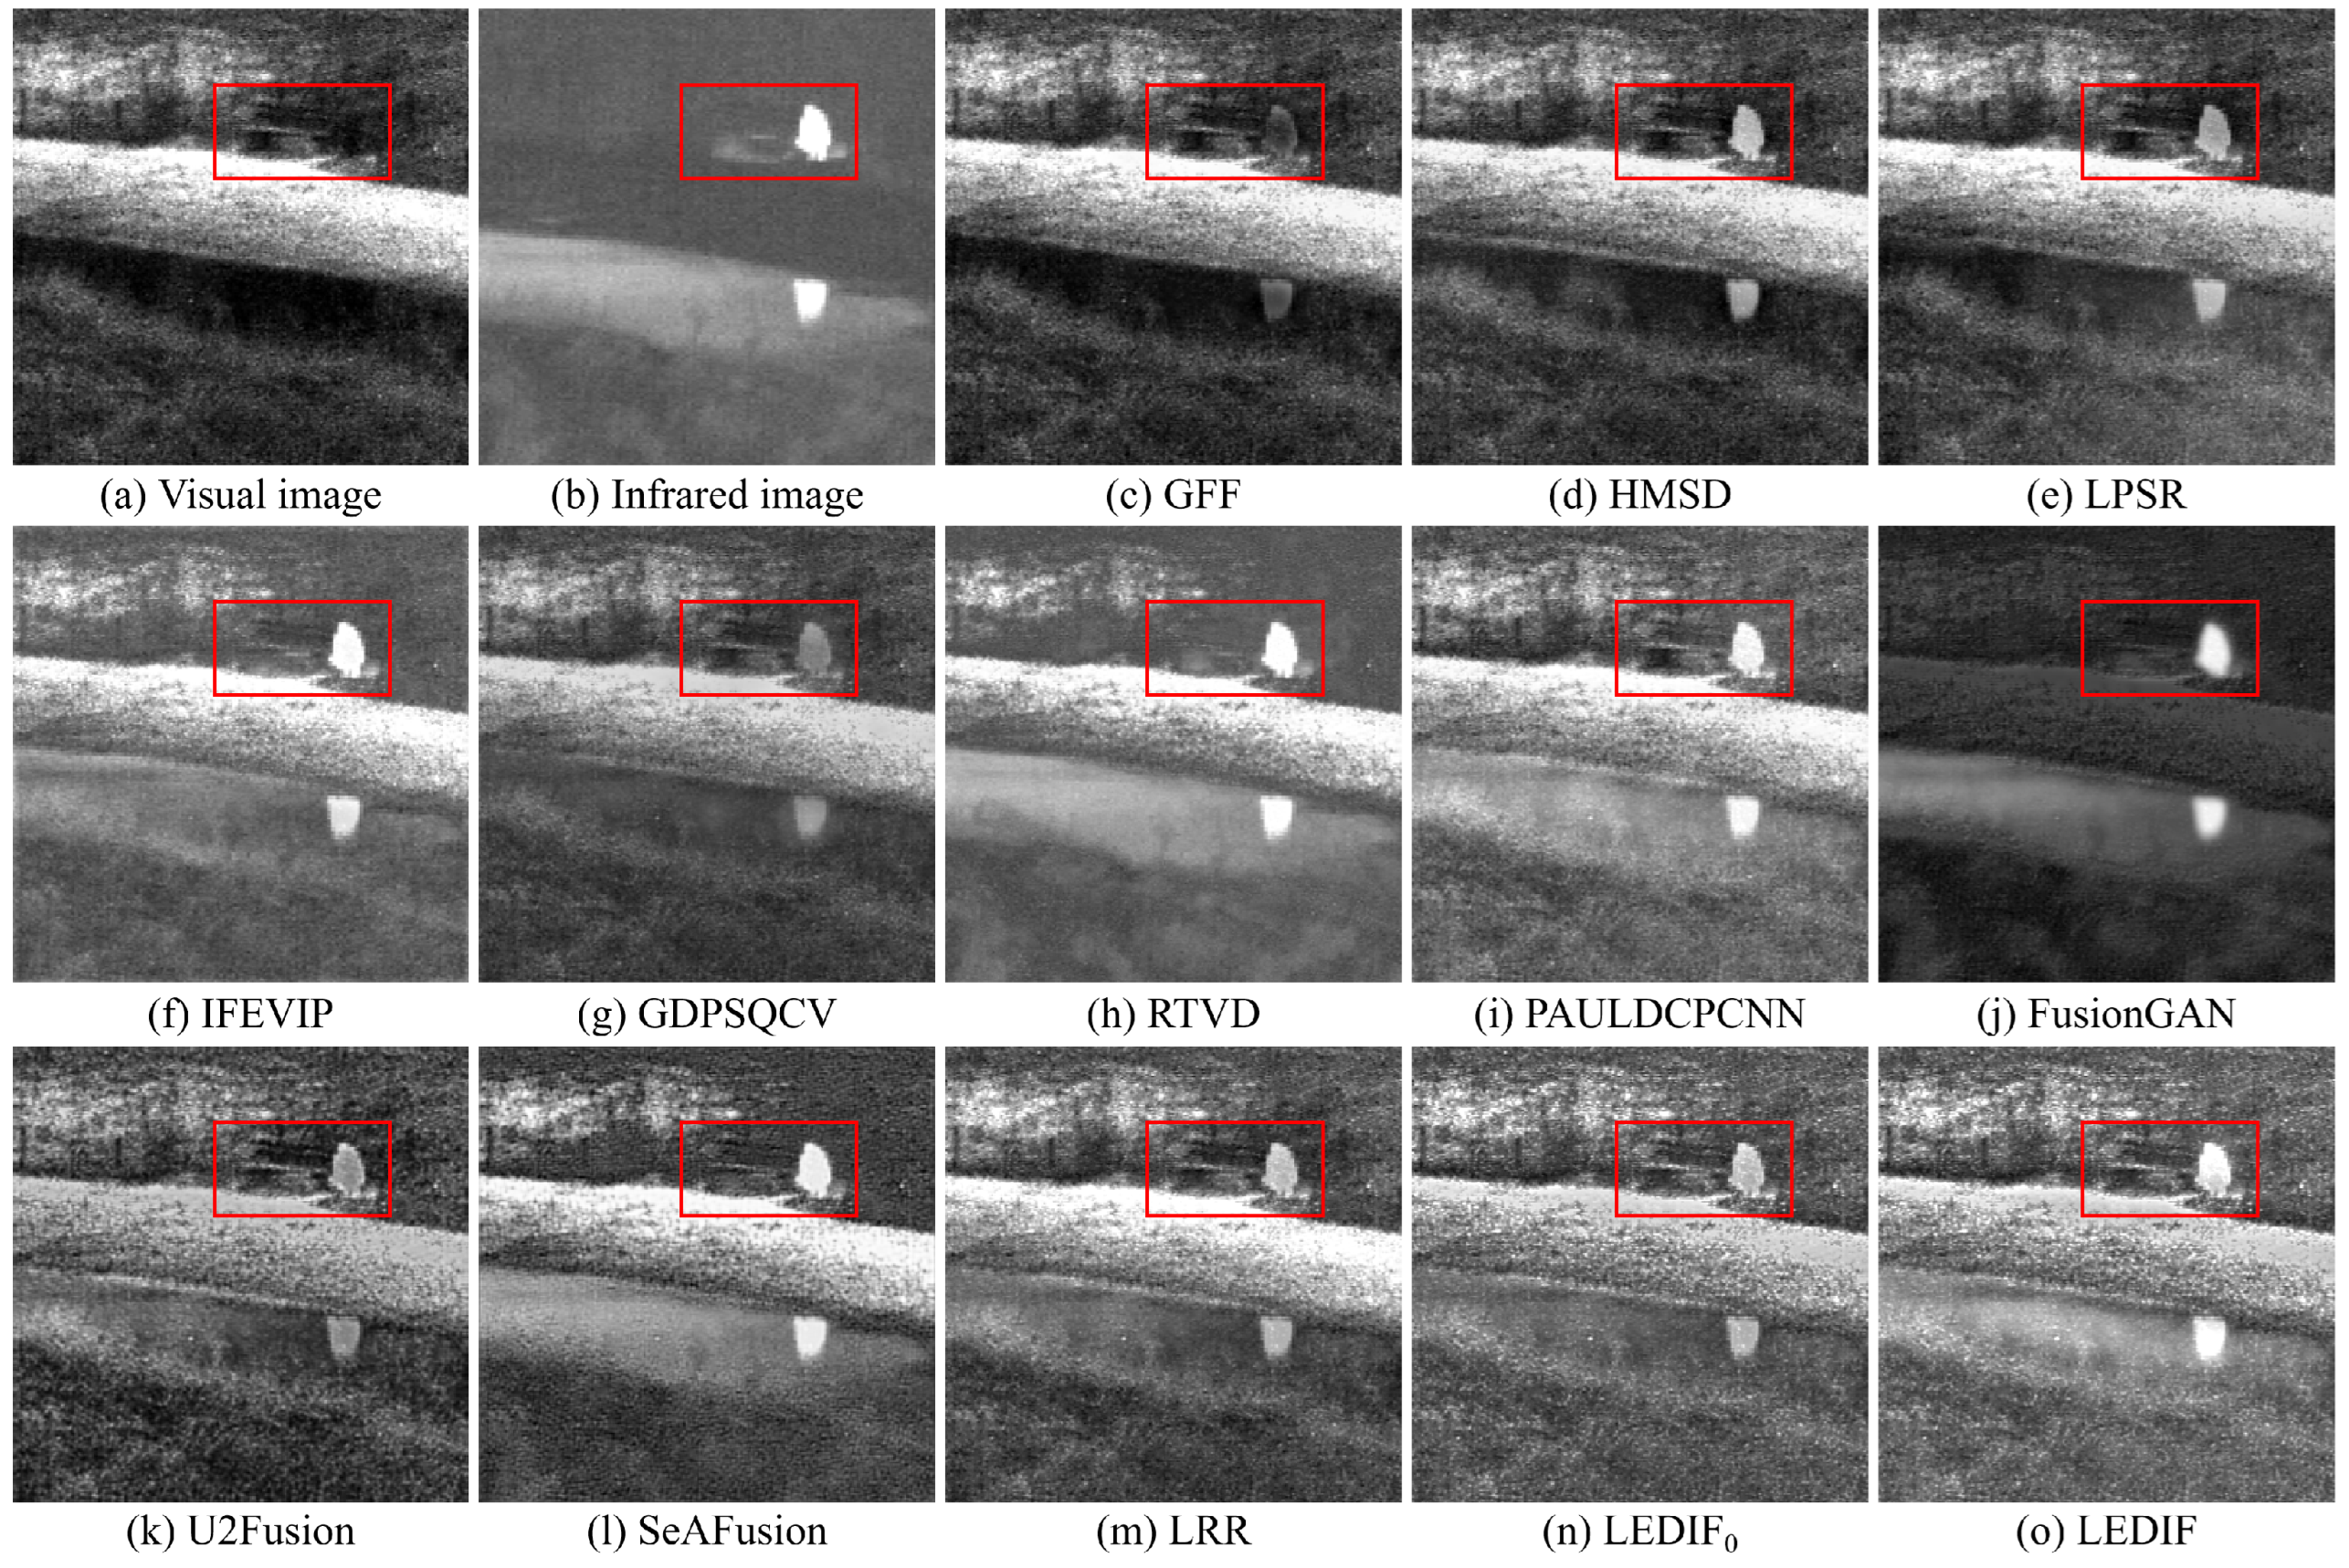
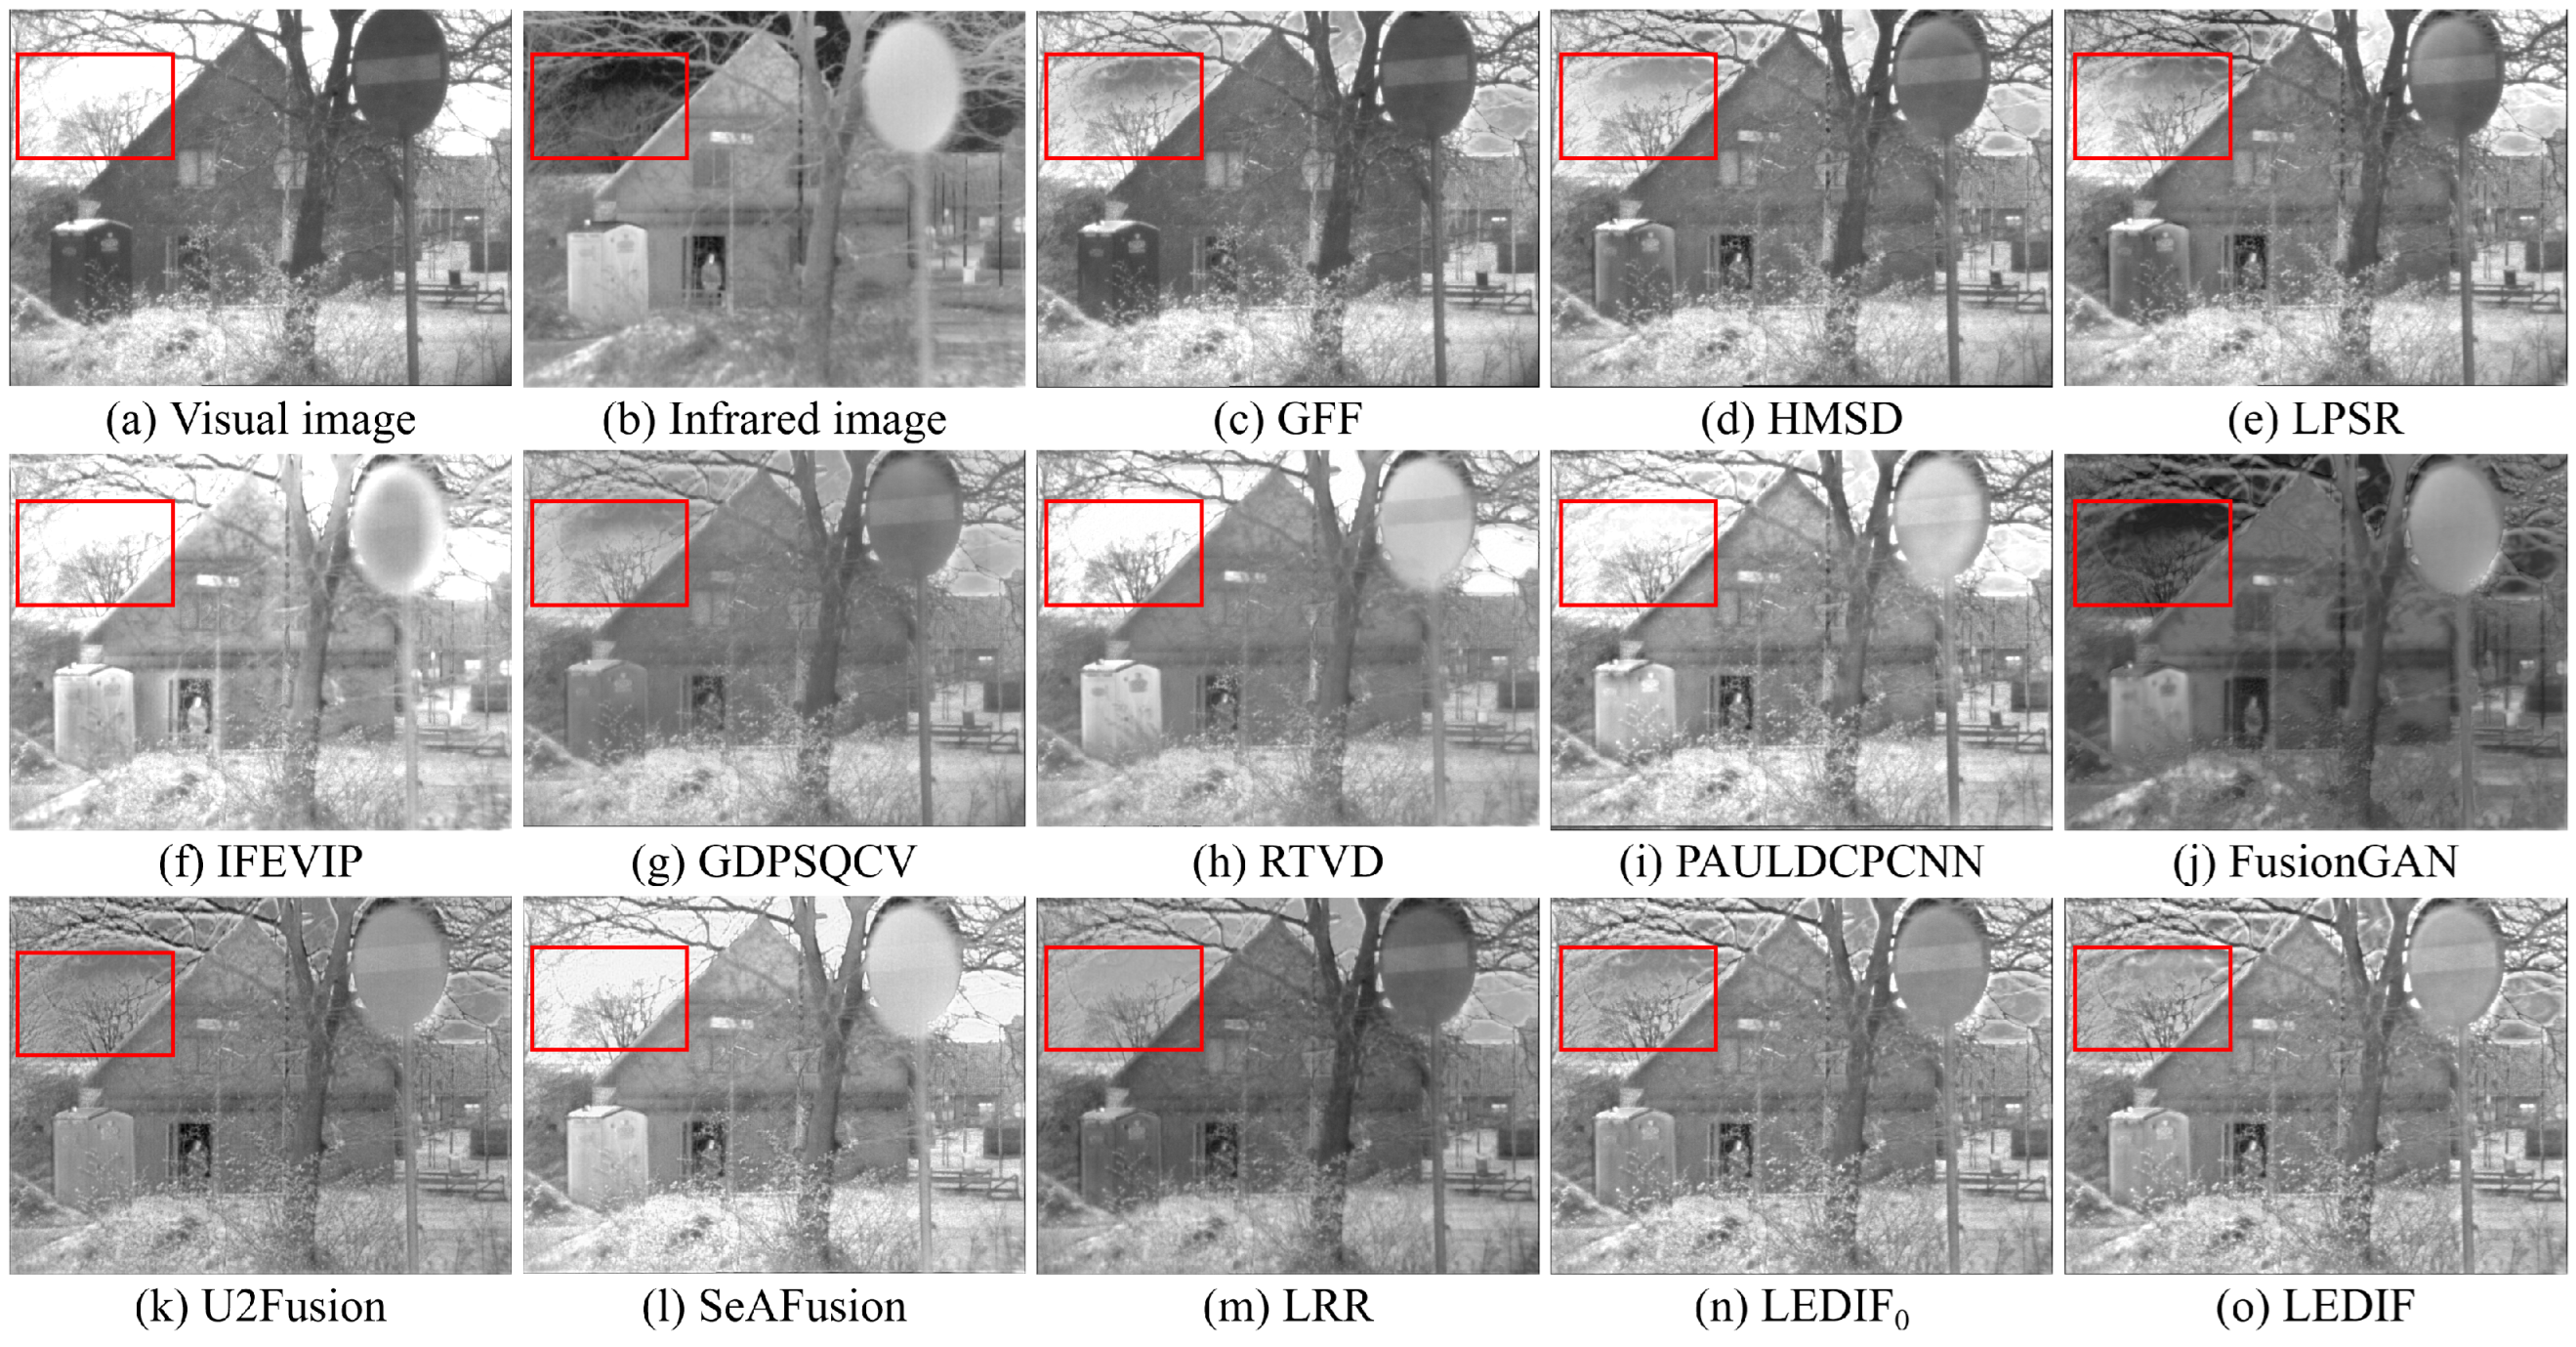
3.2. Qualitative Evaluation Results
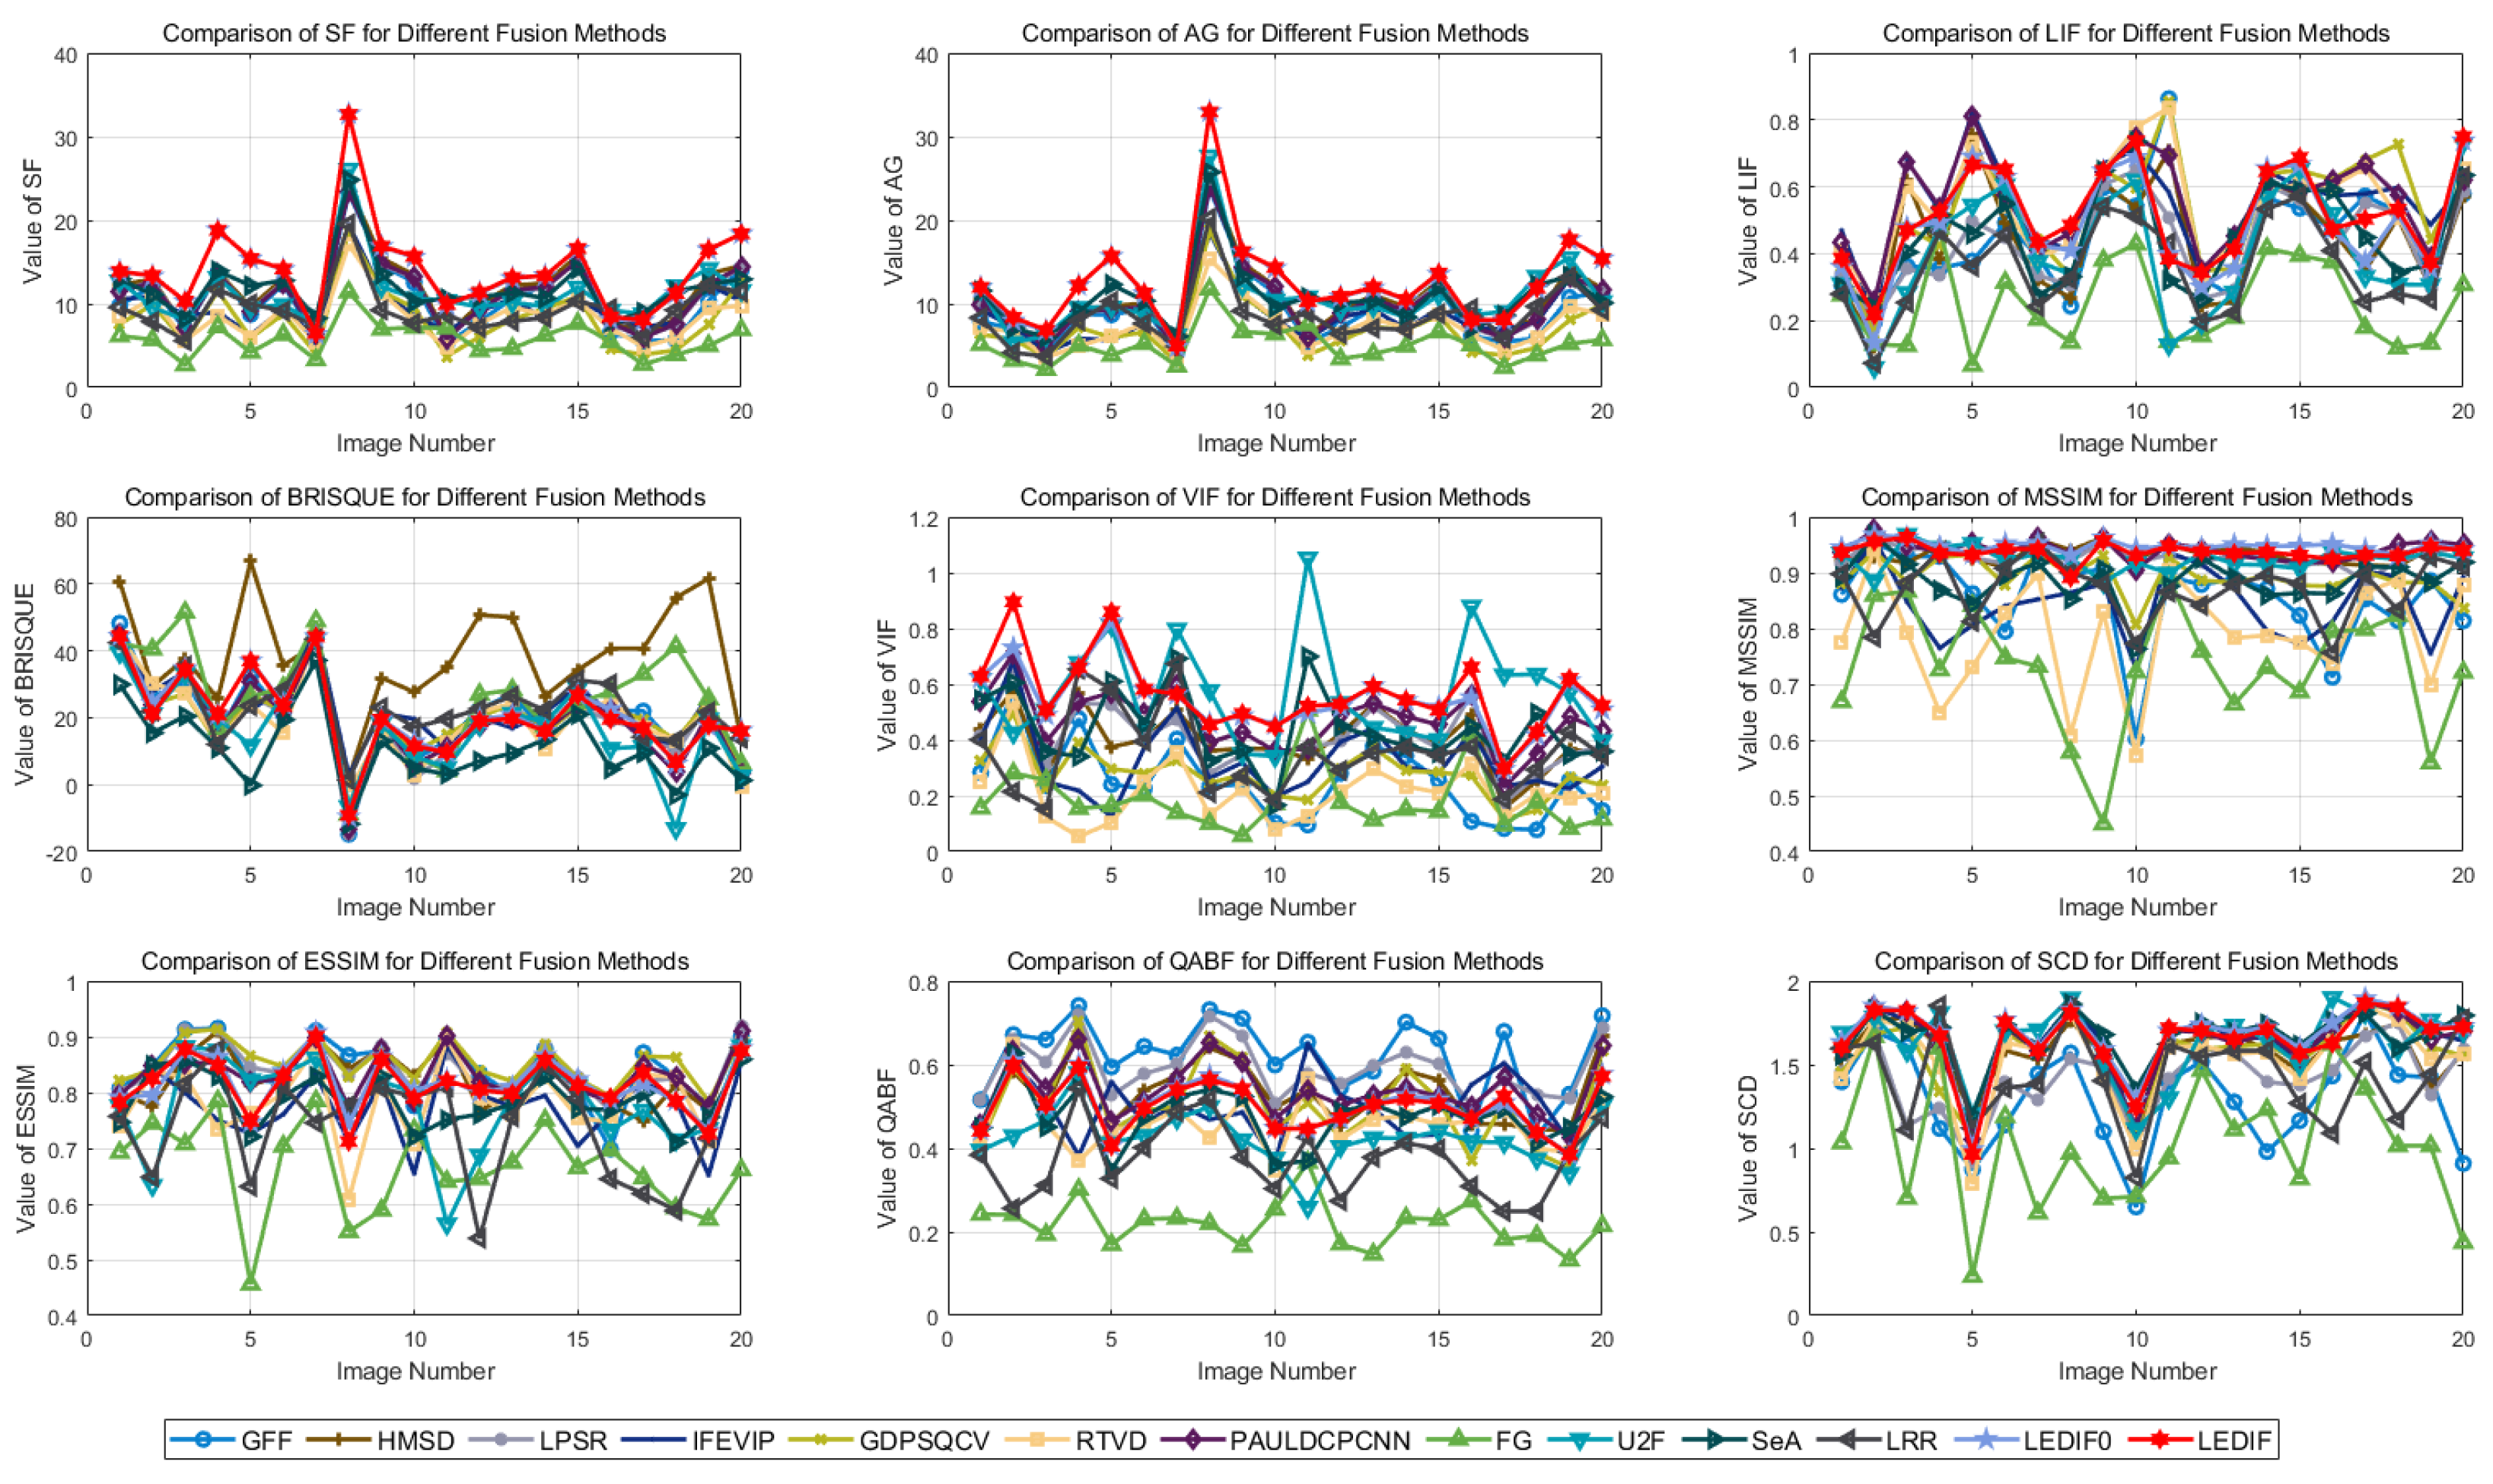
3.3. Quantitative Evaluation Results
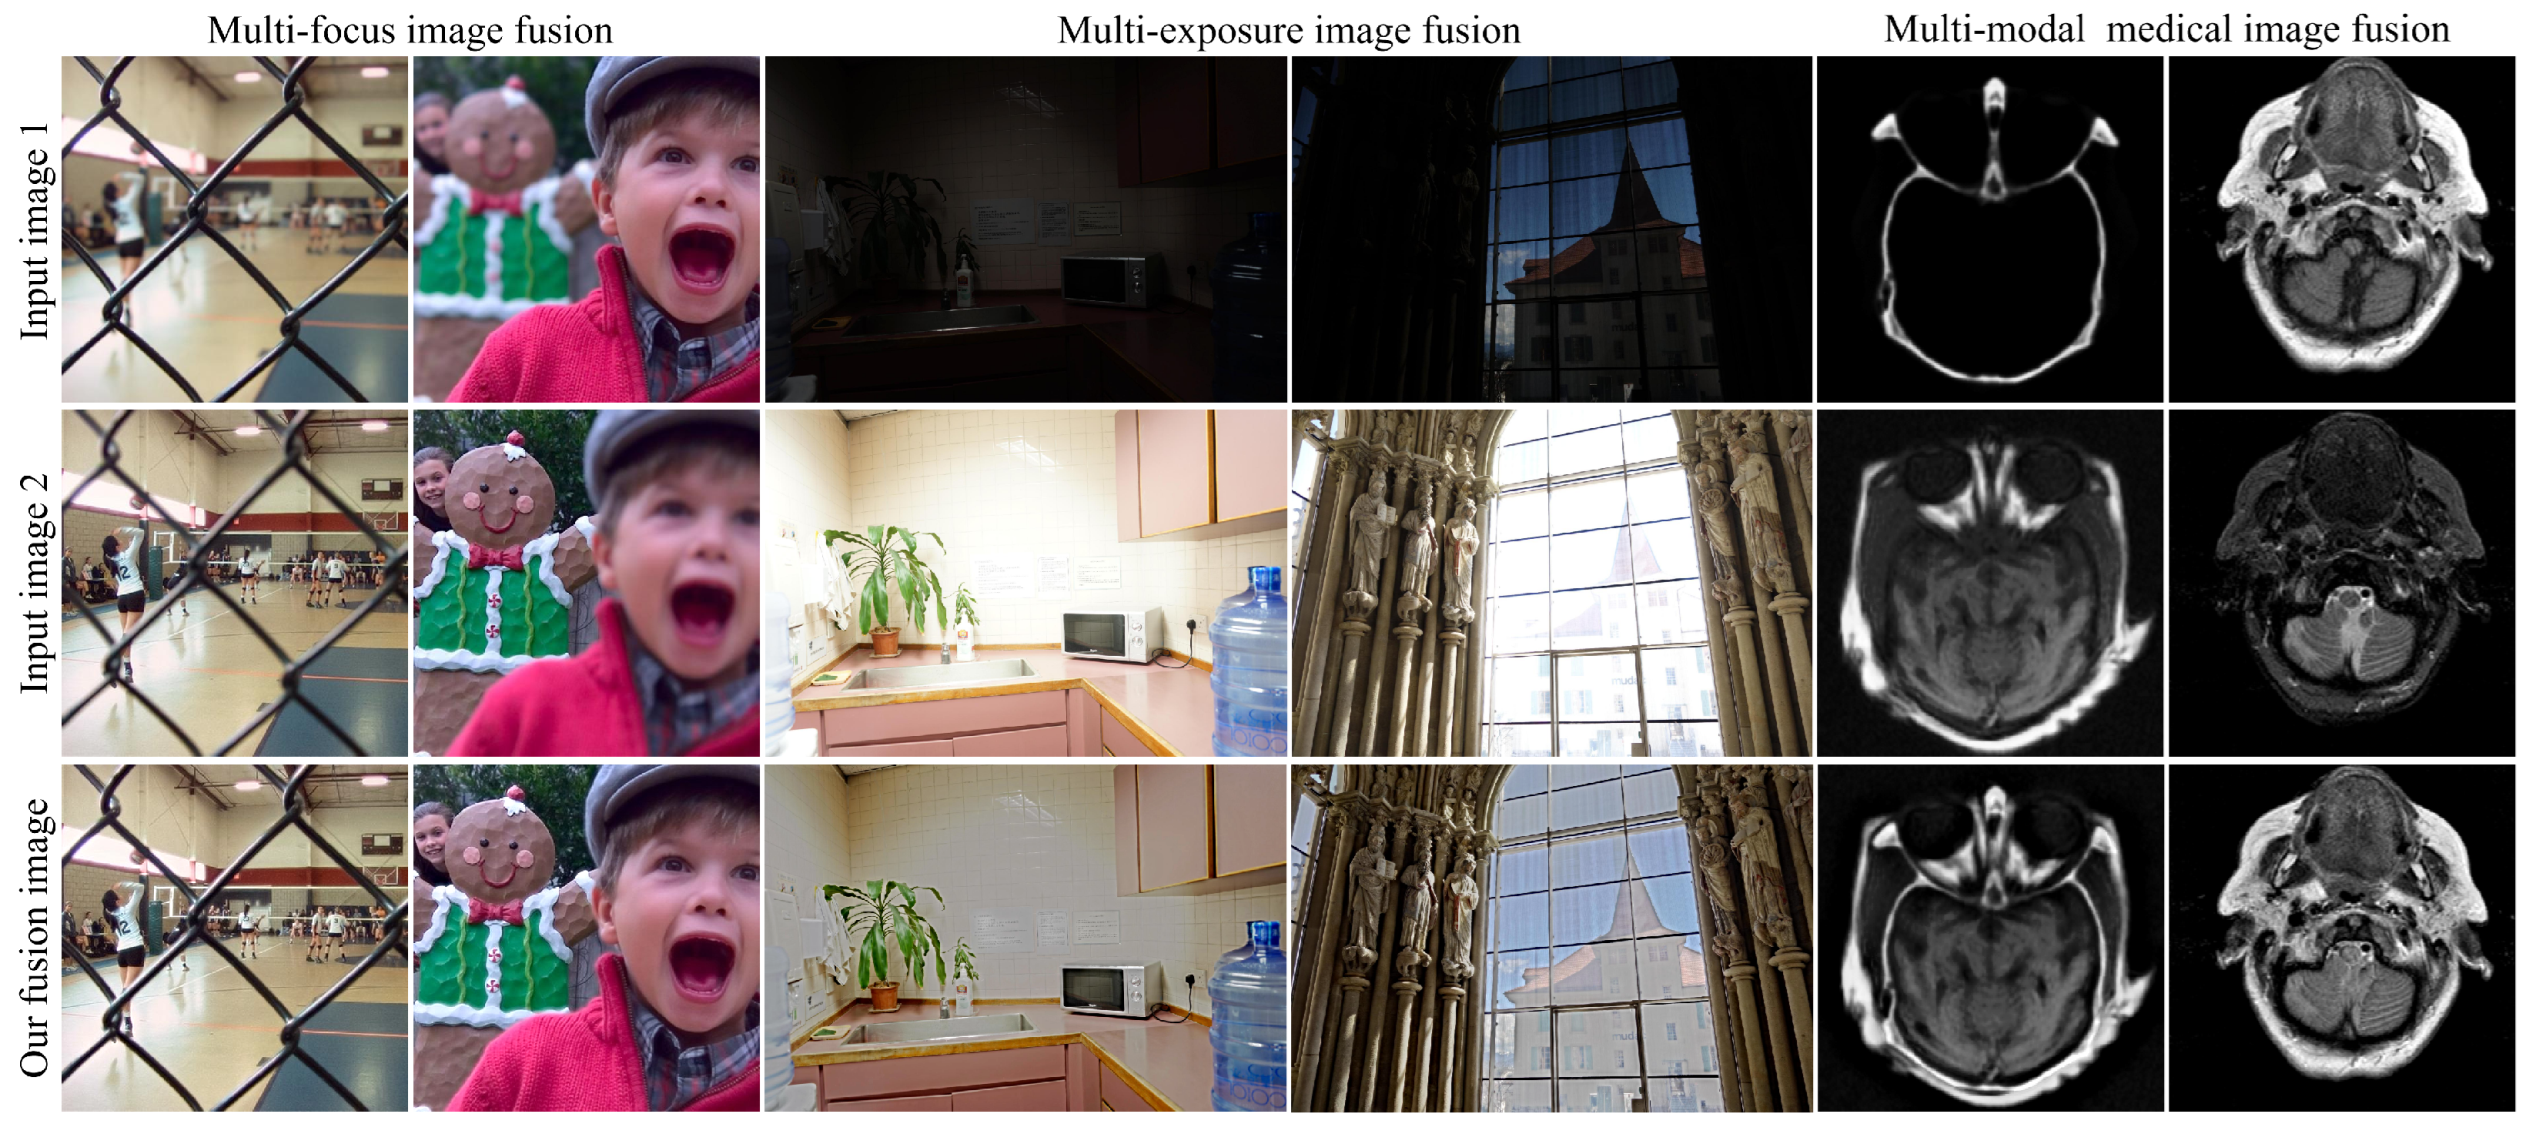
3.4. Further Discussion
4. Conclusions
Author Contributions
Funding
Institutional Review Board Statement
Informed Consent Statement
Data Availability Statement
Acknowledgments
Conflicts of Interest
References
- Li, S.; Kang, X.; Fang, L.; Hu, J.; Yin, H. Pixel-level image fusion: A survey of the state of the art. Inf. Fusion 2017, 33, 100–112. [Google Scholar] [CrossRef]
- Liu, Y.; Chen, X.; Wang, Z.; Wang, Z.J.; Ward, R.K.; Wang, X. Deep learning for pixel-level image fusion: Recent advances and future prospects. Inf. Fusion 2018, 42, 158–173. [Google Scholar] [CrossRef]
- Zhang, Y.; Liu, Y.; Sun, P.; Yan, H.; Zhao, X.; Zhang, L. IFCNN: A general image fusion framework based on convolutional neural network. Inf. Fusion 2020, 54, 99–118. [Google Scholar] [CrossRef]
- Xu, Z. Medical image fusion using multi-level local extrema. Inf. Fusion 2014, 19, 38–48. [Google Scholar] [CrossRef]
- Liu, Y.; Chen, X.; Cheng, J.; Peng, H. A medical image fusion method based on convolutional neural networks. In Proceedings of the 2017 20th International Conference on Information Fusion (Fusion), Xi’an, China, 10–13 July 2017; pp. 1–7. [Google Scholar]
- Wang, K.; Zheng, M.; Wei, H.; Qi, G.; Li, Y. Multi-modality medical image fusion using convolutional neural network and contrast pyramid. Sensors 2020, 20, 2169. [Google Scholar] [CrossRef] [PubMed]
- Zhang, Y.; Xiang, W.; Zhang, S.; Shen, J.; Wei, R.; Bai, X.; Zhang, L.; Zhang, Q. Local extreme map guided multi-modal brain image fusion. Front. Neurosci. 2022, 16, 1055451. [Google Scholar] [CrossRef] [PubMed]
- Huang, W.; Jing, Z. Evaluation of focus measures in multi-focus image fusion. Pattern Recognit. Lett. 2007, 28, 493–500. [Google Scholar] [CrossRef]
- Bai, X.; Zhang, Y.; Zhou, F.; Xue, B. Quadtree-based multi-focus image fusion using a weighted focus-measure. Inf. Fusion 2015, 22, 105–118. [Google Scholar] [CrossRef]
- Zhang, Q.; Levine, M.D. Robust multi-mocus image fusion using multi-task sparse representation and spatial context. IEEE Trans. Image Process. 2016, 26, 2045–2058. [Google Scholar] [CrossRef] [PubMed]
- Zhang, Y.; Bai, X.; Wang, T. Boundary finding based multi-focus image fusion through multi-scale morphological focus-measure. Inf. Fusion 2017, 35, 81–101. [Google Scholar] [CrossRef]
- Liu, Y.; Wang, Z. Dense SIFT for ghost-free multi-exposure fusion. J. Vis. Commun. Image Represent. 2015, 31, 208–224. [Google Scholar] [CrossRef]
- Bai, X. Infrared and visual image fusion through feature extraction by morphological sequential toggle operator. Infrared Phys. Technol. 2015, 71, 77–86. [Google Scholar] [CrossRef]
- Bai, X. Infrared and Visual Image Fusion through Fuzzy Measure and Alternating Operators. Sensors 2015, 15, 17149–17167. [Google Scholar] [CrossRef] [PubMed]
- Zhang, Y.; Zhang, L.; Bai, X.; Zhang, L. Infrared and visual image fusion through infrared feature extraction and visual information preservation. Infrared Phys. Technol. 2017, 83, 227–237. [Google Scholar] [CrossRef]
- Ma, J.; Yu, W.; Liang, P.; Li, C.; Jiang, J. FusionGAN: A generative adversarial network for infrared and visible image fusion. Inf. Fusion 2019, 48, 11–26. [Google Scholar] [CrossRef]
- Ma, J.; Ma, Y.; Li, C. Infrared and visible image fusion methods and applications: A survey. Inf. Fusion 2019, 45, 153–178. [Google Scholar] [CrossRef]
- Zhou, Z.; Li, S.; Wang, B. Multi-scale weighted gradient-based fusion for multi-focus images. Inf. Fusion 2014, 20, 60–72. [Google Scholar] [CrossRef]
- Toet, A. Image fusion by a ratio of low-pass pyramid. Pattern Recognit. Lett. 1989, 9, 245–253. [Google Scholar] [CrossRef]
- Burt, P.J.; Adelson, E.H. The Laplacian pyramid as a compact image code. IEEE Trans. Commun. 1983, 31, 532–540. [Google Scholar] [CrossRef]
- Lewis, J.J.; O’Callaghan, R.J.; Nikolov, S.G.; Bull, D.R.; Canagarajah, N. Pixel- and region-based image fusion with complex wavelets. Inf. Fusion 2007, 8, 119–130. [Google Scholar] [CrossRef]
- Li, H.; Manjunath, B.; Mitra, S.K. Multisensor image fusion using the wavelet transform. Graph. Model. Image Process. 1995, 57, 235–245. [Google Scholar] [CrossRef]
- Yang, B.; Li, S. Multifocus image fusion and restoration with sparse representation. IEEE Trans. Instrum. Meas. 2010, 59, 884–892. [Google Scholar] [CrossRef]
- Li, S.; Yin, H.; Fang, L. Group-sparse representation with dictionary learning for medical image denoising and fusion. IEEE Trans. Biomed. Eng. 2012, 59, 3450–3459. [Google Scholar] [CrossRef] [PubMed]
- Liu, Y.; Liu, S.; Wang, Z. A general framework for image fusion based on multi-scale transform and sparse representation. Inf. Fusion 2015, 24, 147–164. [Google Scholar] [CrossRef]
- Liu, Y.; Chen, X.; Peng, H.; Wang, Z. Multi-focus image fusion with a deep convolutional neural network. Inf. Fusion 2017, 36, 191–207. [Google Scholar] [CrossRef]
- Li, H.; Wu, X.J. DenseFuse: A fusion approach to infrared and visible images. IEEE Trans. Image Process. 2018, 28, 2614–2623. [Google Scholar] [CrossRef] [PubMed]
- Tang, L.; Yuan, J.; Ma, J. Image fusion in the loop of high-level vision tasks: A semantic-aware real-time infrared and visible image fusion network. Inf. Fusion 2022, 82, 28–42. [Google Scholar] [CrossRef]
- Li, H.; Xu, T.; Wu, X.J.; Lu, J.; Kittler, J. LRRNet: A Novel Representation Learning Guided Fusion Network for Infrared and Visible Images. IEEE Trans. Pattern Anal. Mach. Intell. 2023. [Google Scholar] [CrossRef] [PubMed]
- Li, F.; Zhou, Y.; Chen, Y.; Li, J.; Dong, Z.; Tan, M. Multi-scale attention-based lightweight network with dilated convolutions for infrared and visible image fusion. Complex Intell. Syst. 2023, 10, 1–15. [Google Scholar] [CrossRef]
- Zhang, Y.; Shen, J.; Guo, S.; Zhong, L.; Zhang, S.; Bai, X. Multi-scale Bézier Filter Based Infrared and Visual Image Fusion. In Proceedings of the Chinese Conference on Image and Graphics Technologies, Beijing, China, 17–19 August 2022; pp. 14–25. [Google Scholar]
- Zhang, Y.; Zhang, S.; Bai, X.; Zhang, L. Human chest CT image enhancement based on basic information preservation and detail enhancement. J. Image Graph. 2022, 27, 774–783. [Google Scholar]
- Wang, Z.; Bovik, A.C.; Sheikh, H.R.; Simoncelli, E.P. Image quality assessment: From error visibility to structural similarity. IEEE Trans. Image Process. 2004, 13, 600–612. [Google Scholar] [CrossRef]
- Ma, K.; Zeng, K.; Wang, Z. Perceptual quality assessment for multi-exposure image fusion. IEEE Trans. Image Process. 2015, 24, 3345–3356. [Google Scholar] [CrossRef]
- Toet, A. The TNO Multiband Image Data Collection. Data Brief 2017, 15, 249–251. [Google Scholar] [CrossRef]
- Li, S.; Kang, X.; Hu, J. Image fusion with guided filtering. IEEE Trans. Image Process. 2013, 22, 2864–2875. [Google Scholar]
- Kurban, R. Gaussian of differences: A simple and efficient general image fusion method. Entropy 2023, 25, 1215. [Google Scholar] [CrossRef]
- Chen, J.; Li, X.; Wu, K. Infrared and visible image fusion based on relative total variation decomposition. Infrared Phys. Technol. 2022, 123, 104112. [Google Scholar] [CrossRef]
- Panigrahy, C.; Seal, A.; Mahato, N.K. Parameter adaptive unit-linking dual-channel PCNN based infrared and visible image fusion. Neurocomputing 2022, 514, 21–38. [Google Scholar] [CrossRef]
- Xu, H.; Ma, J.; Jiang, J.; Guo, X.; Ling, H. U2Fusion: A unified unsupervised image fusion network. IEEE Trans. Pattern Anal. Mach. Intell. 2020, 44, 502–518. [Google Scholar] [CrossRef]
- Li, S.; Yang, B. Multifocus image fusion using region segmentation and spatial frequency. Image Vis. Comput. 2008, 26, 971–979. [Google Scholar] [CrossRef]
- Zhao, W.; Wang, D.; Lu, H. Multi-focus image fusion with a natural enhancement via a joint multi-level deeply supervised convolutional neural network. IEEE Trans. Circuits Syst. Video Technol. 2018, 29, 1102–1115. [Google Scholar] [CrossRef]
- Bai, X.; Zhou, F.; Xue, B. Noise-suppressed image enhancement using multiscale top-hat selection transform through region extraction. Appl. Opt. 2012, 51, 338–347. [Google Scholar] [CrossRef] [PubMed]
- Petrovic, V.; Xydeas, C. Objective image fusion performance characterisation. In Proceedings of the 10th IEEE International Conference on Computer Vision (ICCV’05) Volume 1, Beijing, China, 17–21 October 2005; pp. 1866–1871. [Google Scholar]
- Han, Y.; Cai, Y.; Cao, Y.; Xu, X. A new image fusion performance metric based on visual information fidelity. Inf. Fusion 2013, 14, 127–135. [Google Scholar] [CrossRef]
- Piella, G.; Heijmans, H. A new quality metric for image fusion. In Proceedings of the 2003 International Conference on Image Processing (Cat. No. 03CH37429), Barcelona, Spain, 14–17 September 2003; Volume 3, pp. III–173–176. [Google Scholar]
- Aslantas, V.; Bendes, E. A new image quality metric for image fusion: The sum of the correlations of differences. AEU Int. J. Electron. Commun. 2015, 69, 1890–1896. [Google Scholar] [CrossRef]
- Zhang, X.; Ye, P.; Xiao, G. VIFB: A visible and infrared image fusion benchmark. In Proceedings of the IEEE/CVF Conference on Computer Vision and Pattern Recognition Workshops, Seattle, WA, USA, 14–19 June 2020; pp. 104–105. [Google Scholar]


| Methods | SF | AG | LIF | BRISQUE | VIF | MSSIM | ESSIM | QABF | SCD |
|---|---|---|---|---|---|---|---|---|---|
| GFF | |||||||||
| HMSD | |||||||||
| LPSR | |||||||||
| IFEVIP | |||||||||
| GDPSQCV | |||||||||
| RTVD | |||||||||
| PAULDCPCNN | |||||||||
| FusionGAN | |||||||||
| U2Fusion | |||||||||
| SeAFusion | |||||||||
| LRR | |||||||||
| LEDIF |
Disclaimer/Publisher’s Note: The statements, opinions and data contained in all publications are solely those of the individual author(s) and contributor(s) and not of MDPI and/or the editor(s). MDPI and/or the editor(s) disclaim responsibility for any injury to people or property resulting from any ideas, methods, instructions or products referred to in the content. |
© 2024 by the authors. Licensee MDPI, Basel, Switzerland. This article is an open access article distributed under the terms and conditions of the Creative Commons Attribution (CC BY) license (https://creativecommons.org/licenses/by/4.0/).
Share and Cite
Xiang, W.; Shen, J.; Zhang, L.; Zhang, Y. Infrared and Visual Image Fusion Based on a Local-Extrema-Driven Image Filter. Sensors 2024, 24, 2271. https://doi.org/10.3390/s24072271
Xiang W, Shen J, Zhang L, Zhang Y. Infrared and Visual Image Fusion Based on a Local-Extrema-Driven Image Filter. Sensors. 2024; 24(7):2271. https://doi.org/10.3390/s24072271
Chicago/Turabian StyleXiang, Wenhao, Jianjun Shen, Li Zhang, and Yu Zhang. 2024. "Infrared and Visual Image Fusion Based on a Local-Extrema-Driven Image Filter" Sensors 24, no. 7: 2271. https://doi.org/10.3390/s24072271
APA StyleXiang, W., Shen, J., Zhang, L., & Zhang, Y. (2024). Infrared and Visual Image Fusion Based on a Local-Extrema-Driven Image Filter. Sensors, 24(7), 2271. https://doi.org/10.3390/s24072271