
Intelligent Integrated System for Fruit Detection Using Multi-UAV Imaging and Deep Learning †


 ,
,  and
and 
Abstract
1. Introduction
2. Materials and Methods
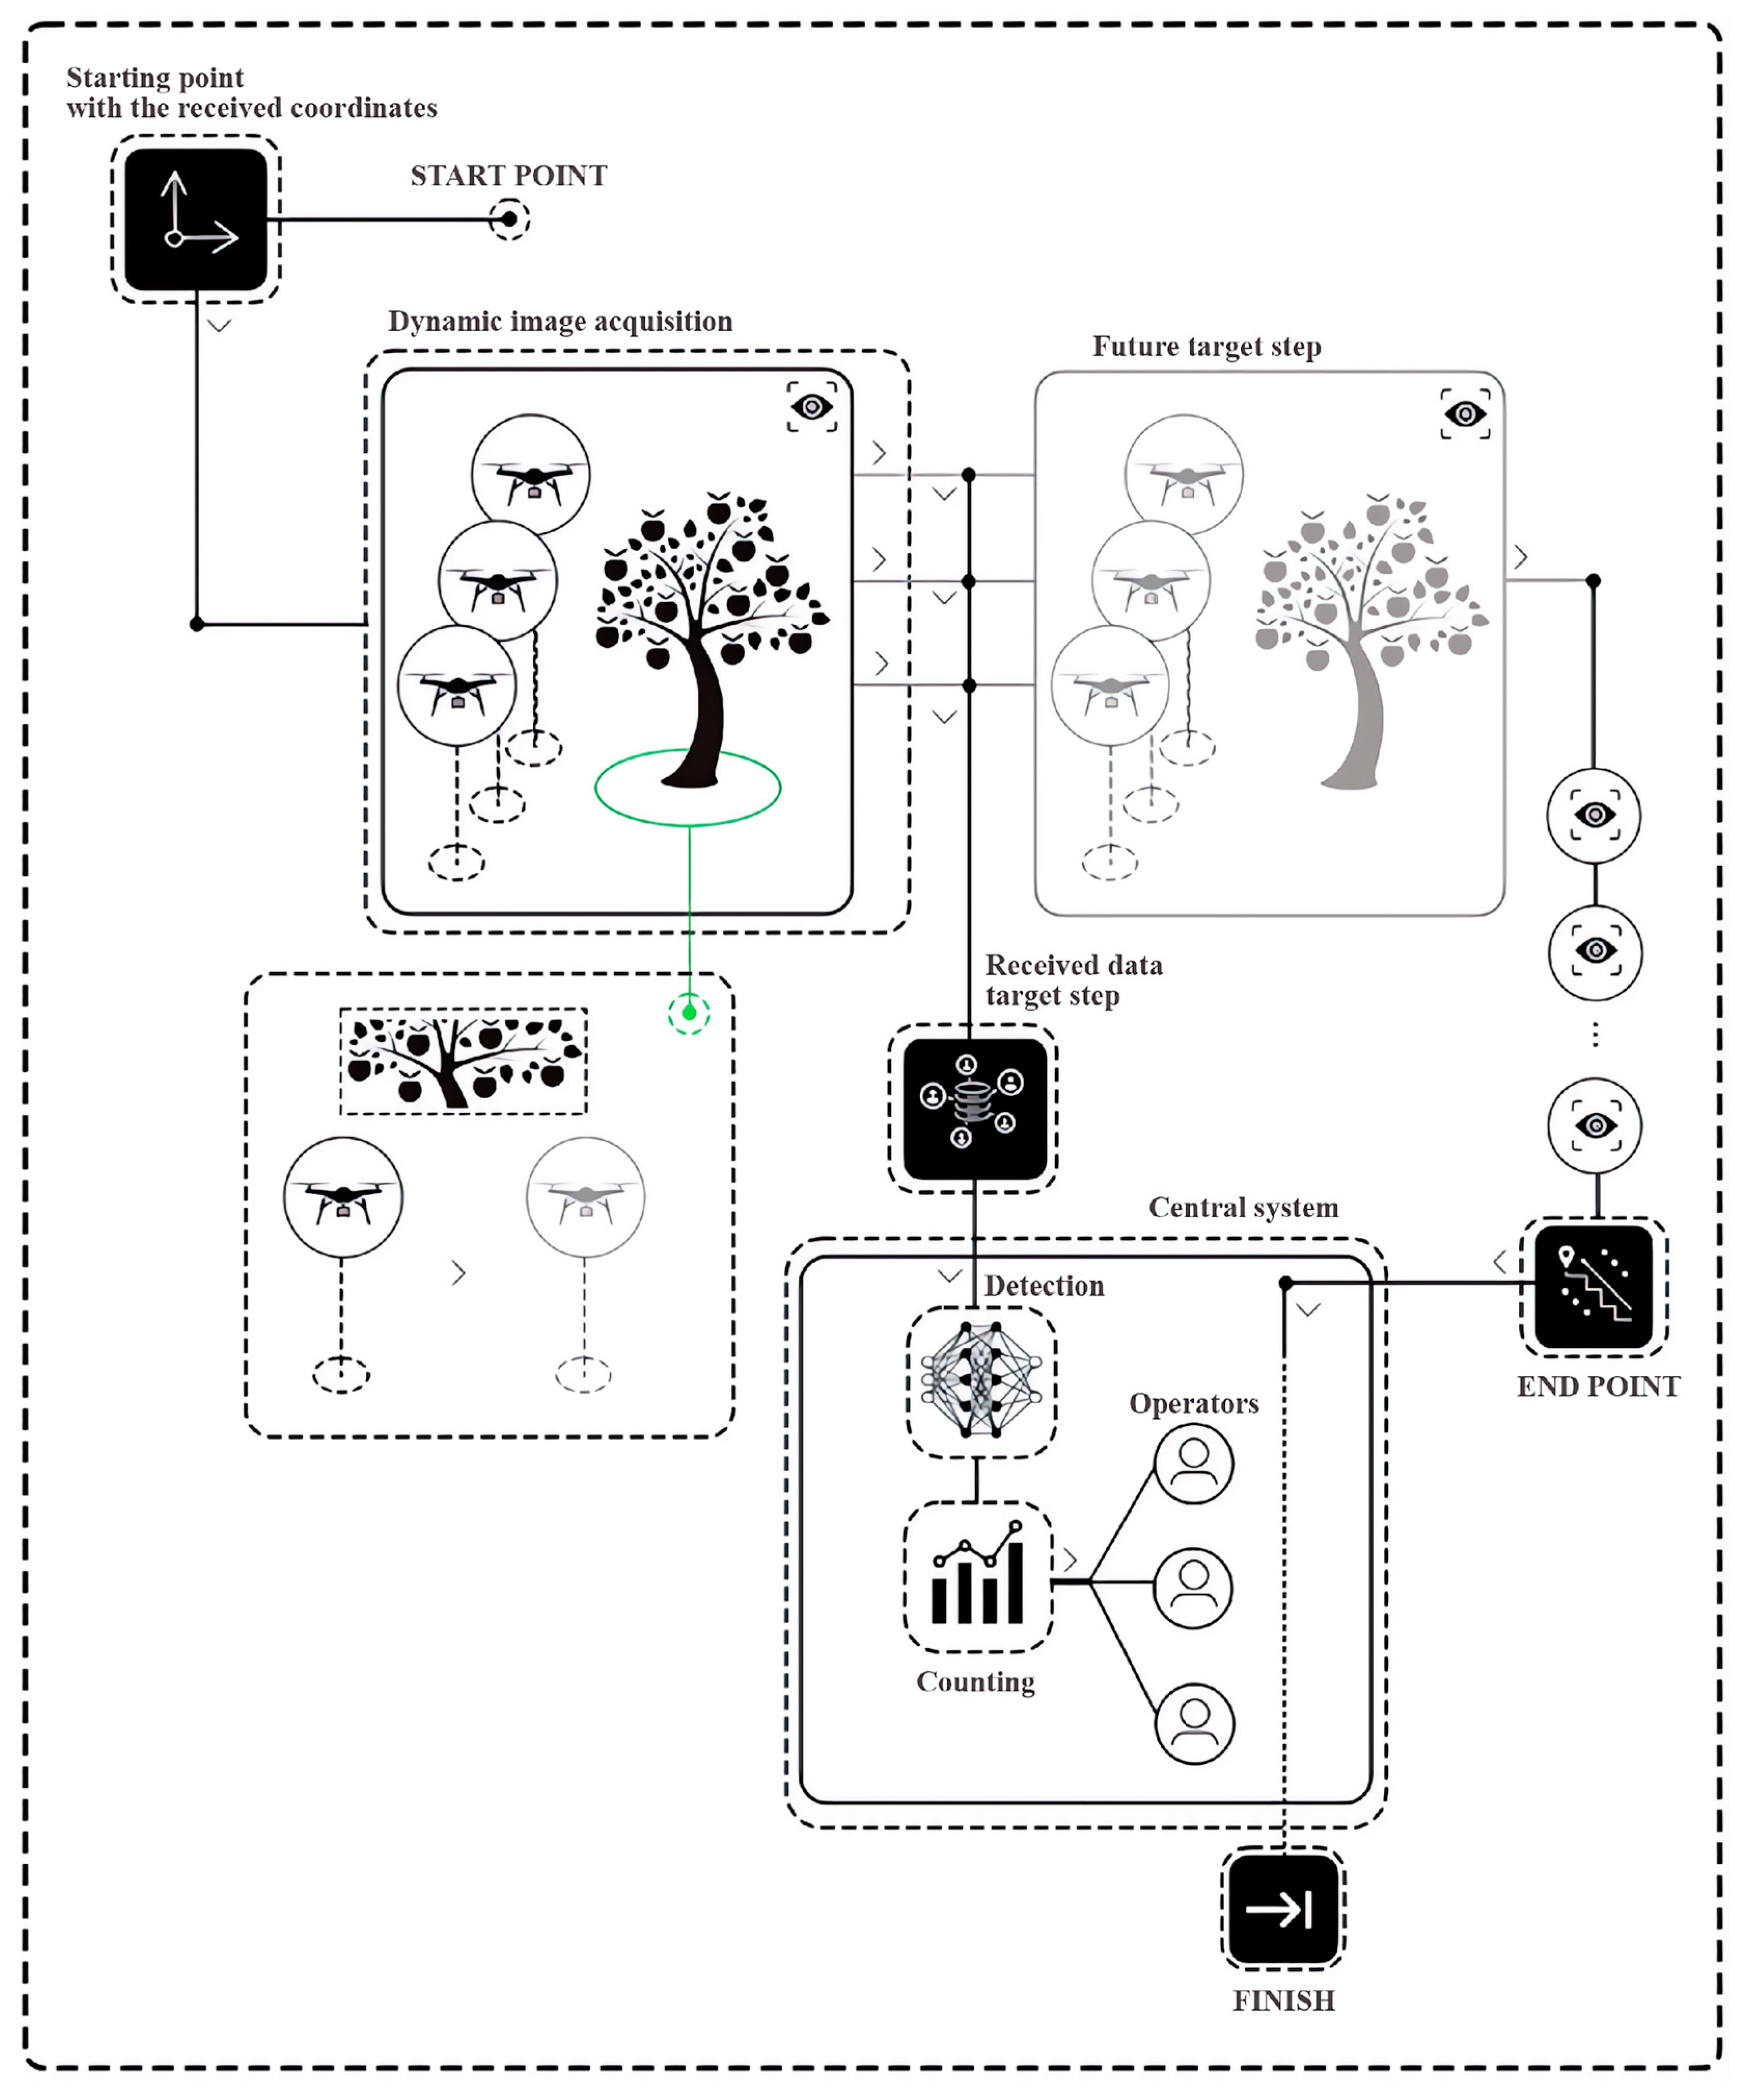
2.1. Method for the Dynamic Capture of Specified Structural Objects
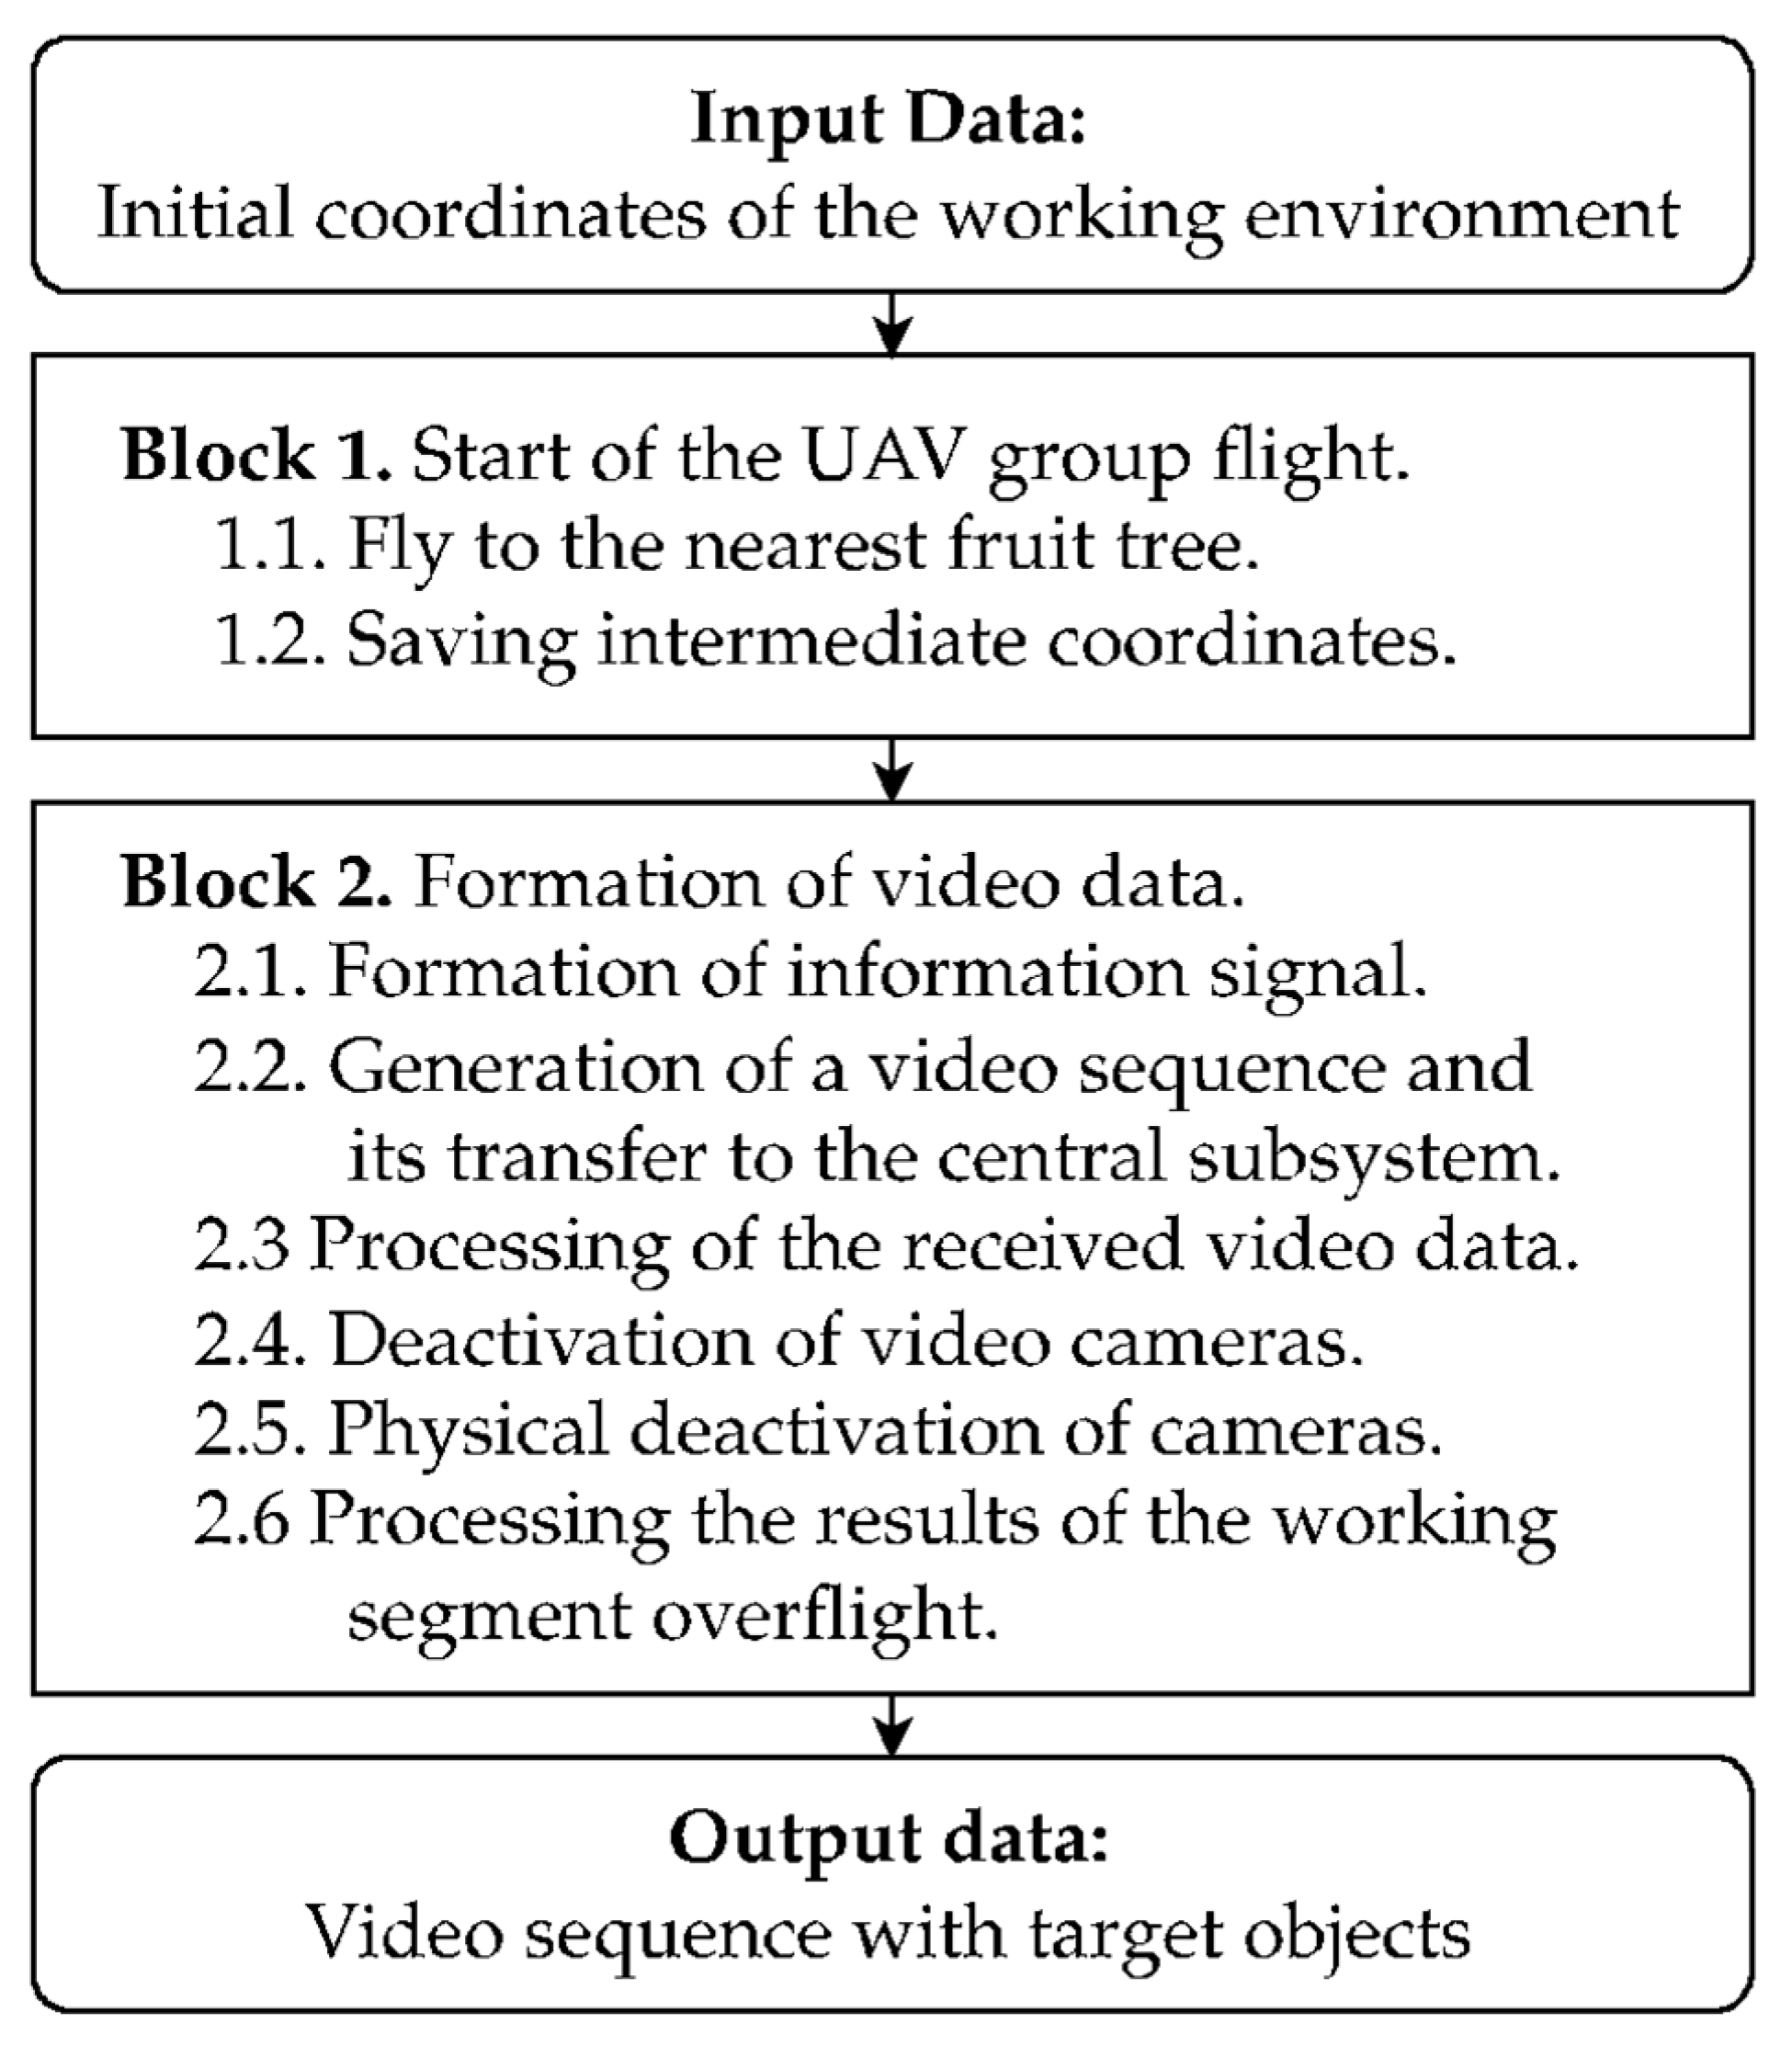
- Coordinates of the starting point in the working environment;
- Coordinates of the ending point in the working environment;
- Matrix of coordinates for the initial points of the work segments;
- Matrix of coordinates for the end points of the work segments;
- Matrix of coordinates for the initial UAV trajectory.
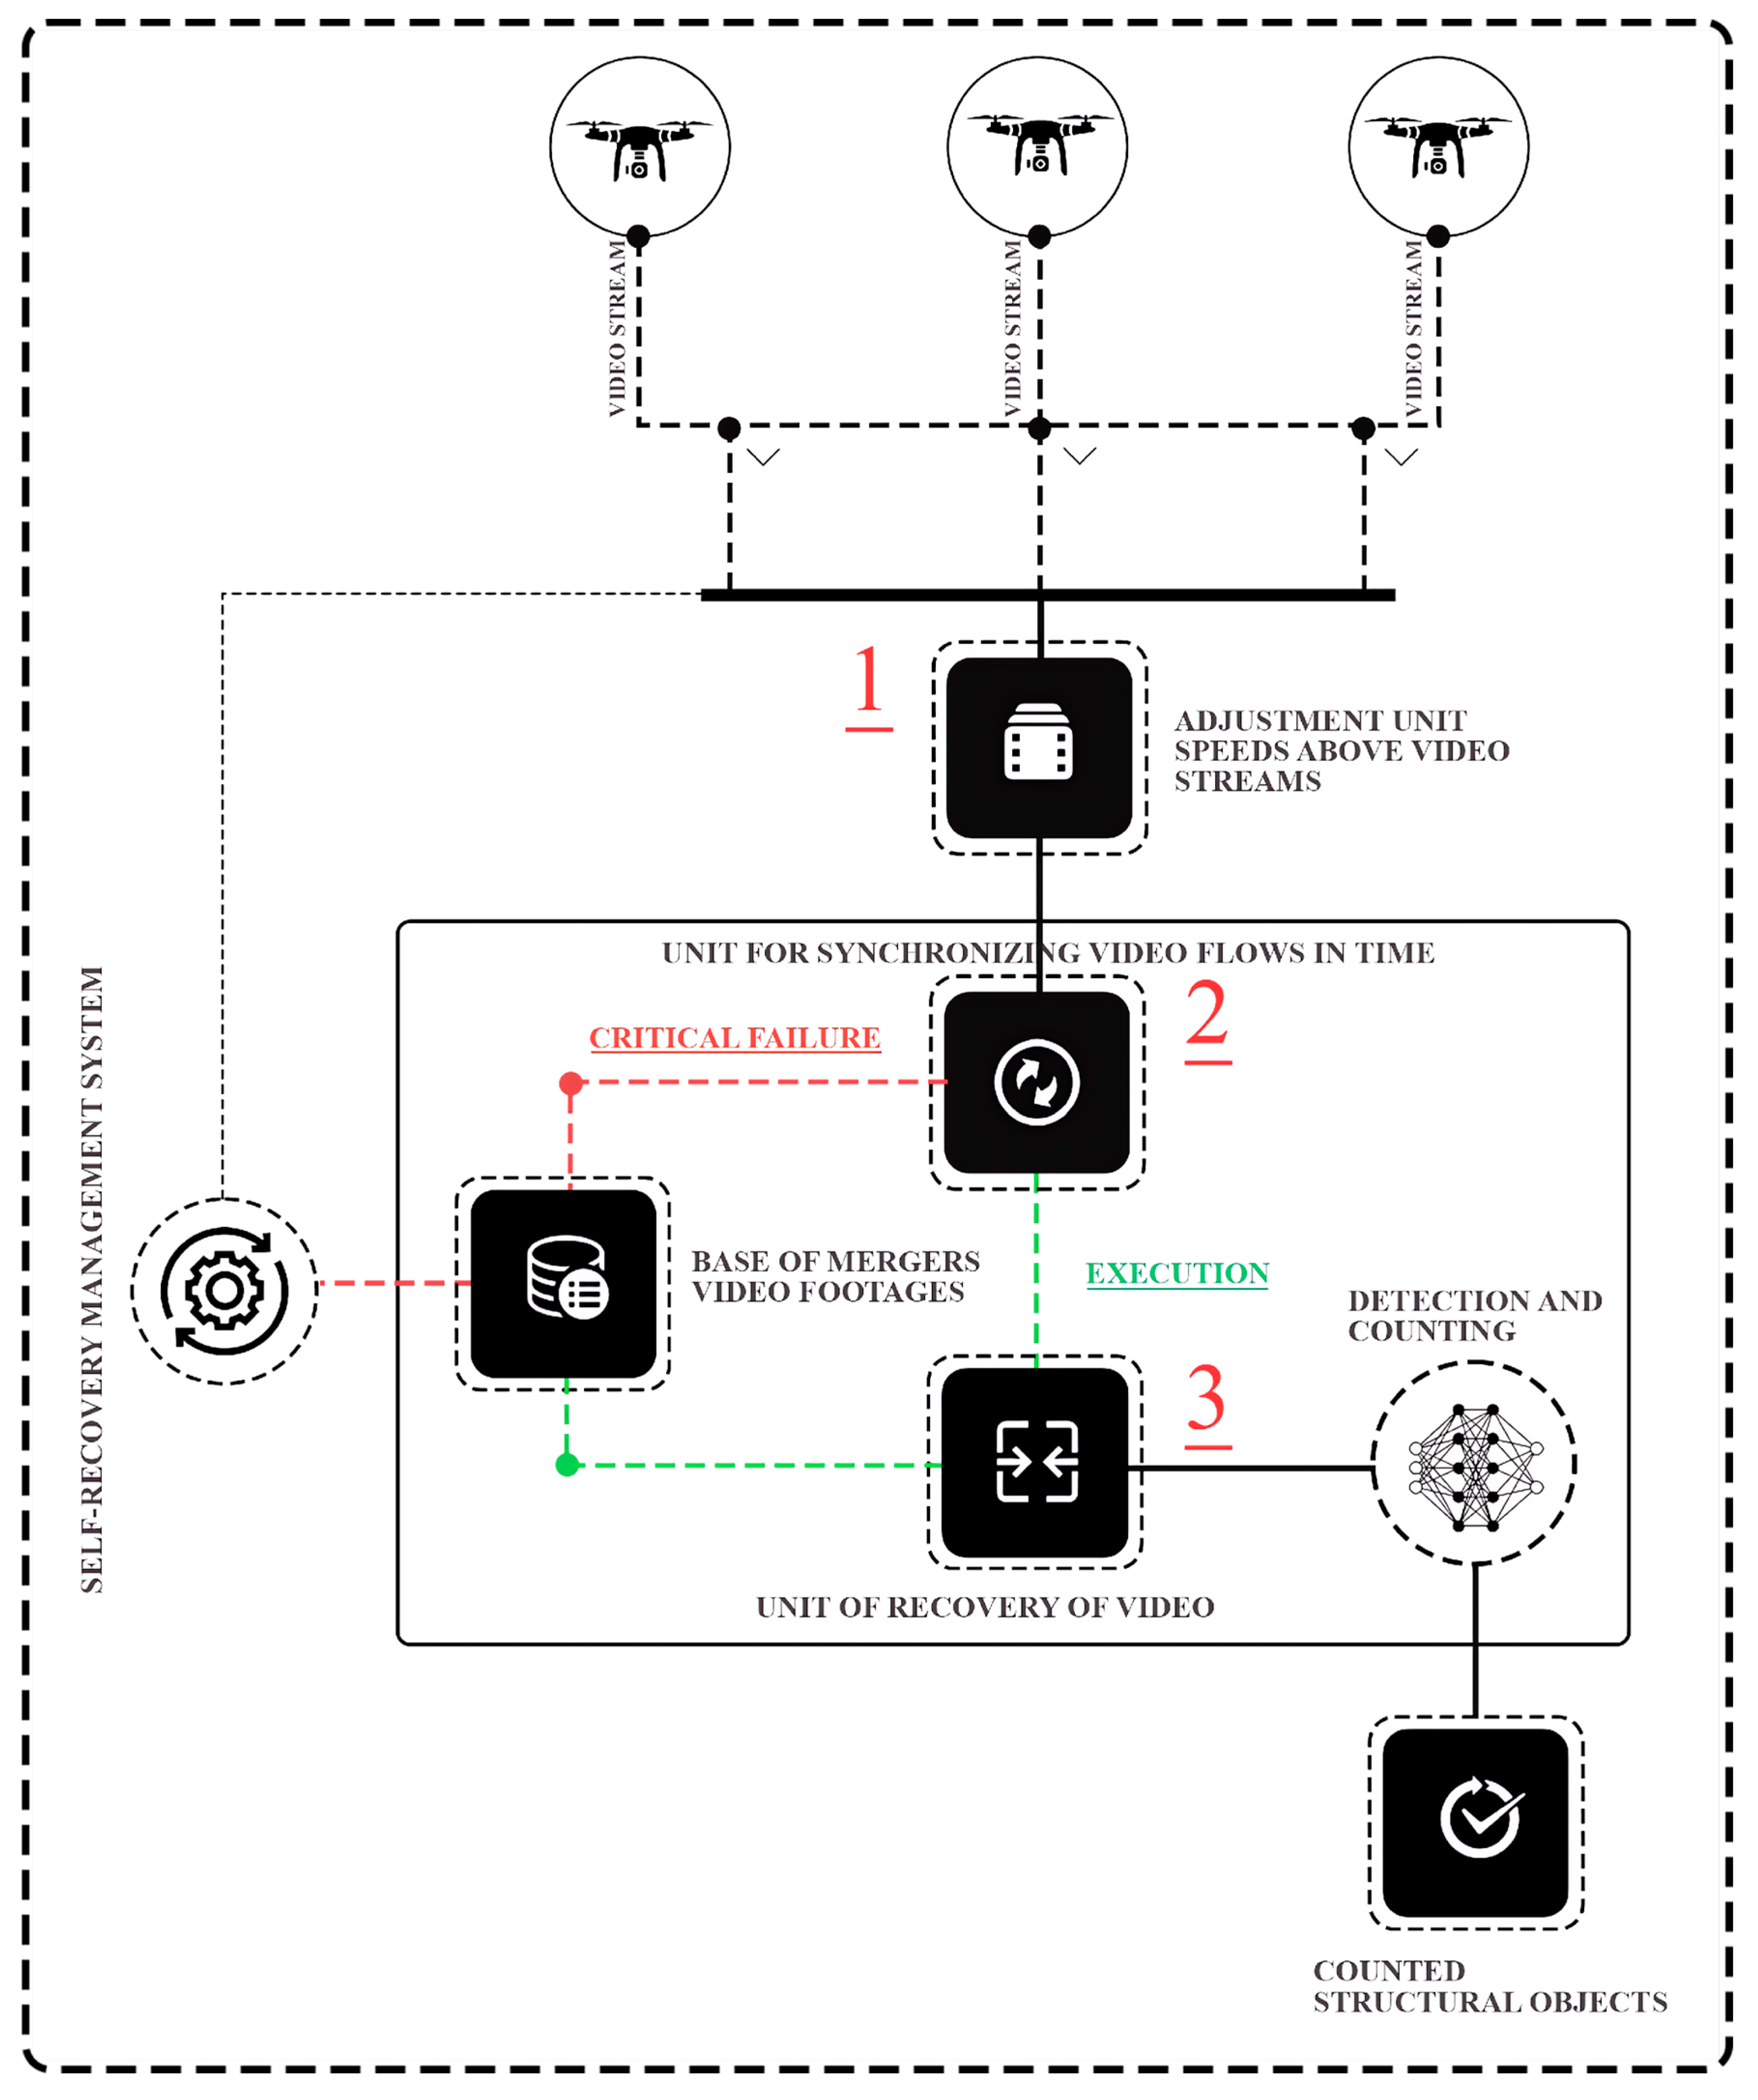
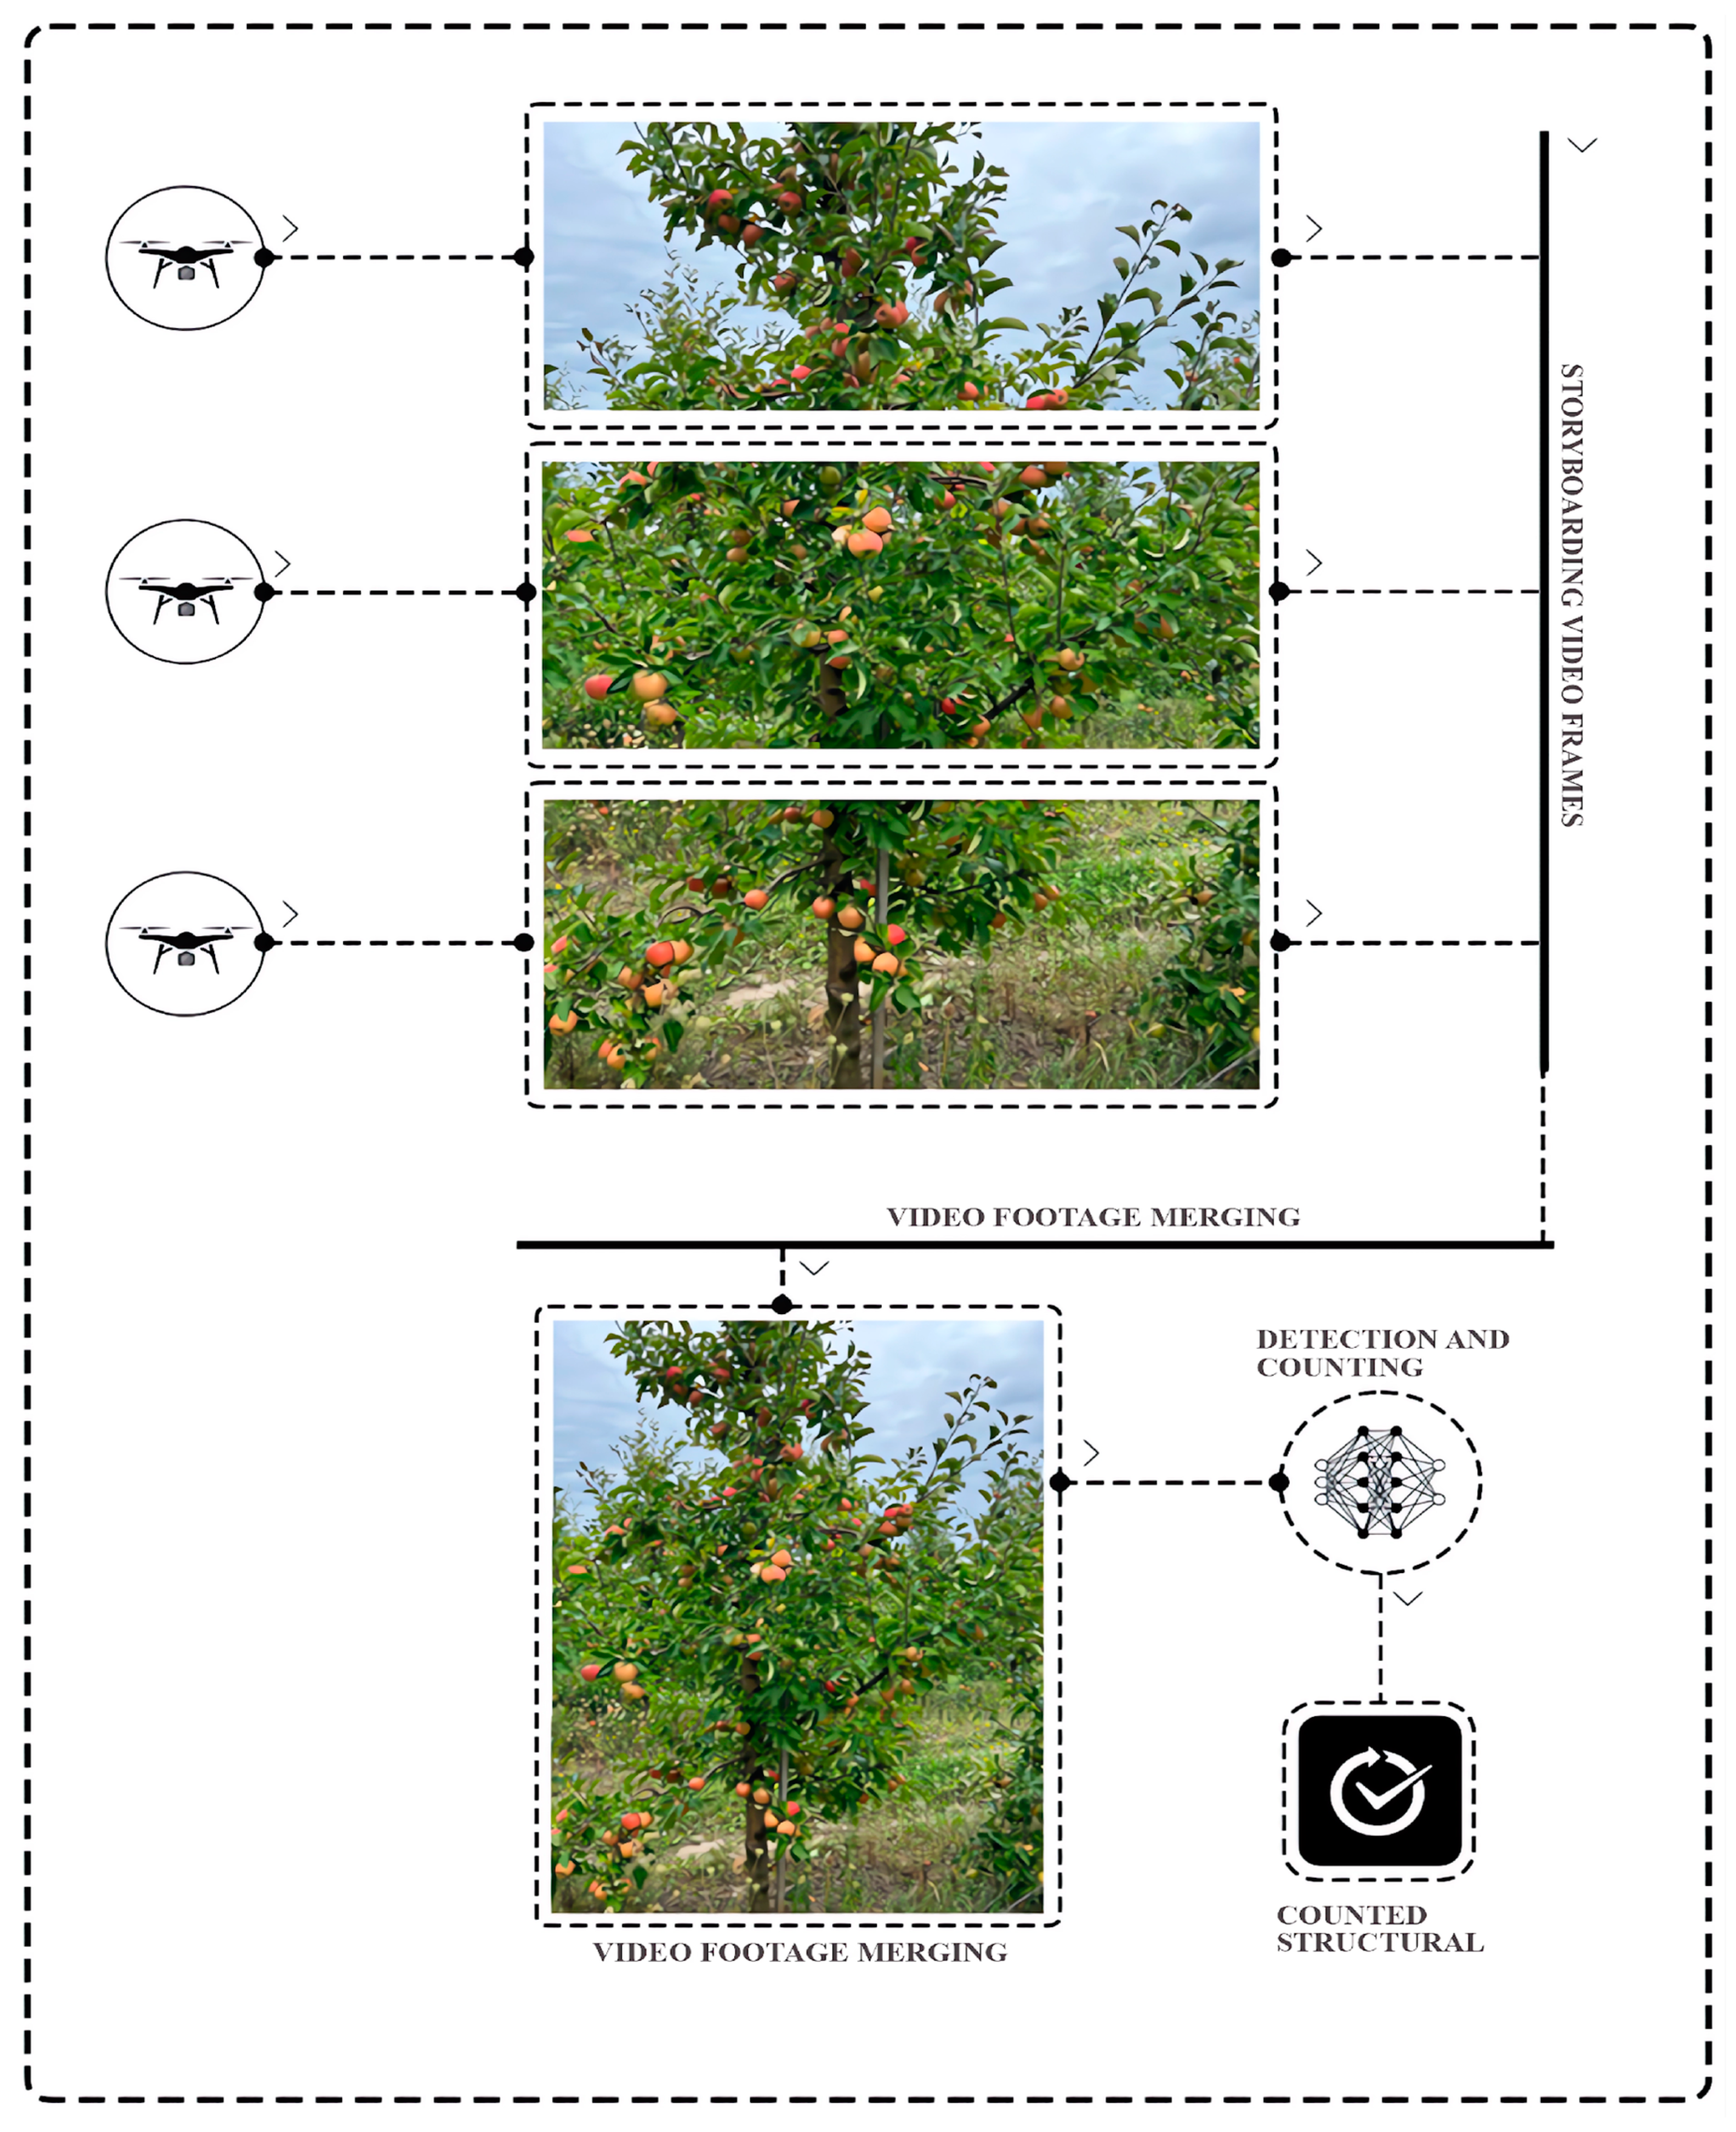
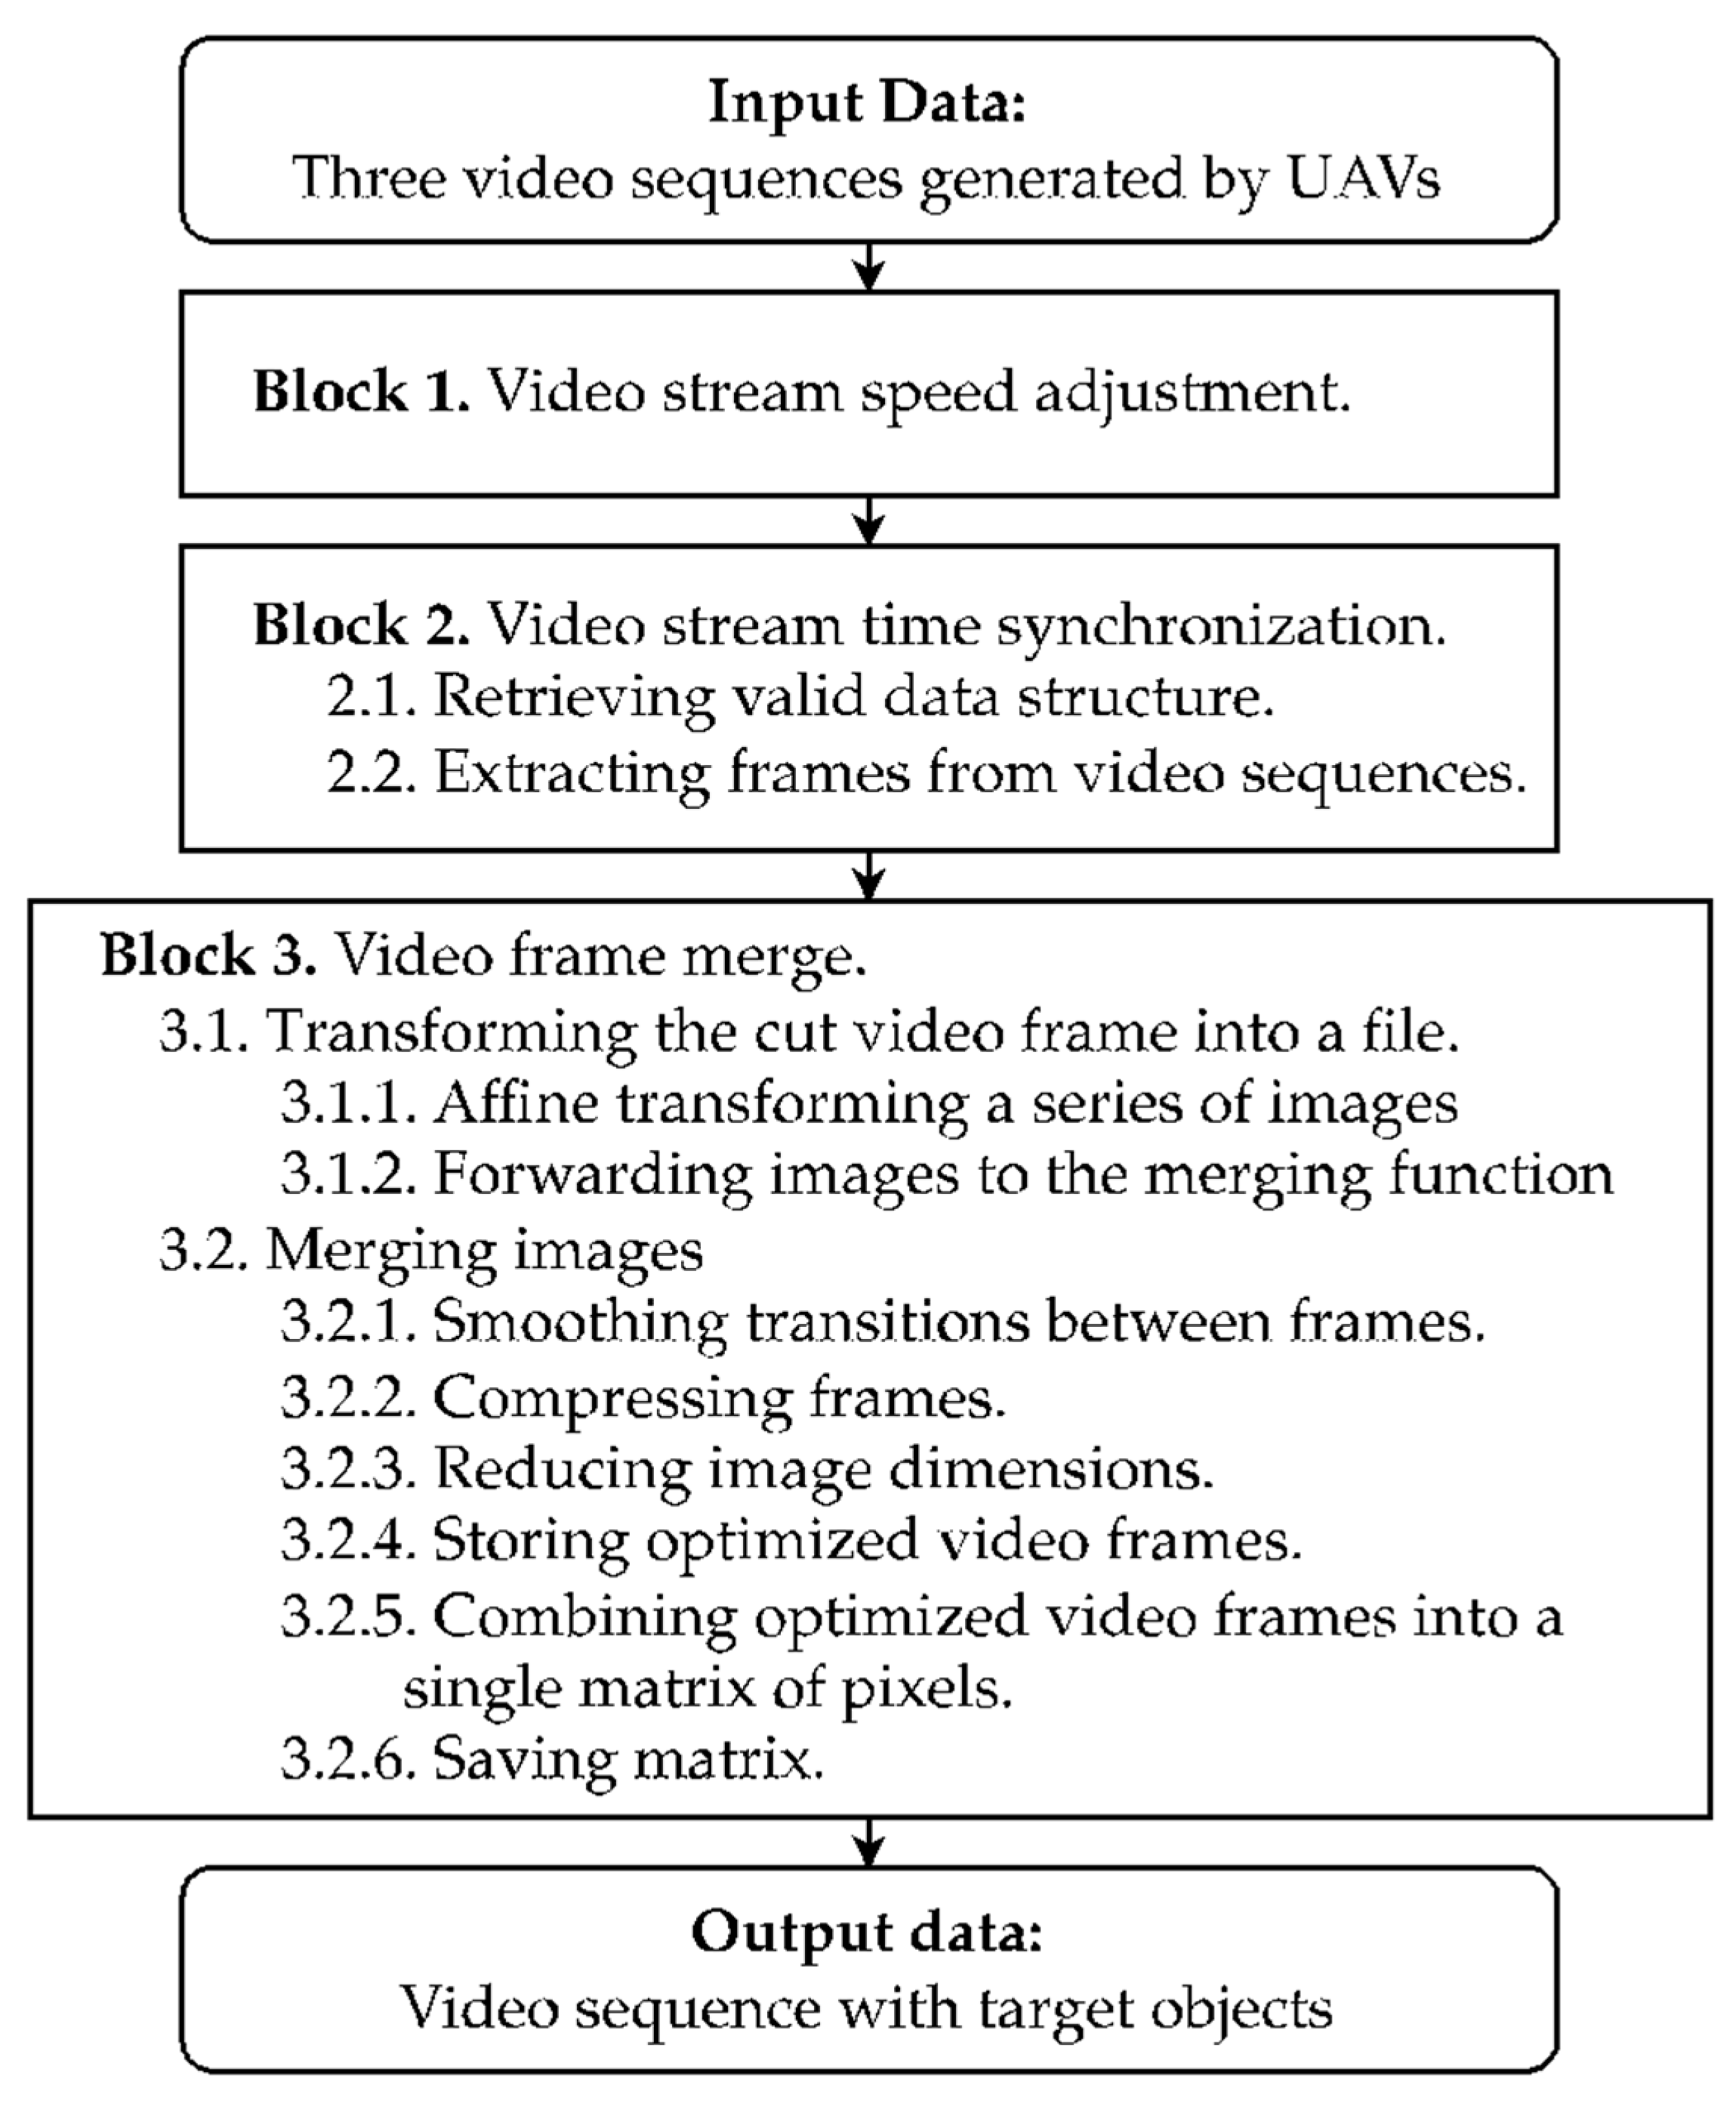
2.2. Method for Synchronizing Video Streams in Real Time
2.3. Methods and Means for Detecting, Tracking, and Counting the Specified Structural Objects
2.3.1. Method for Detecting the Specified Structural Objects
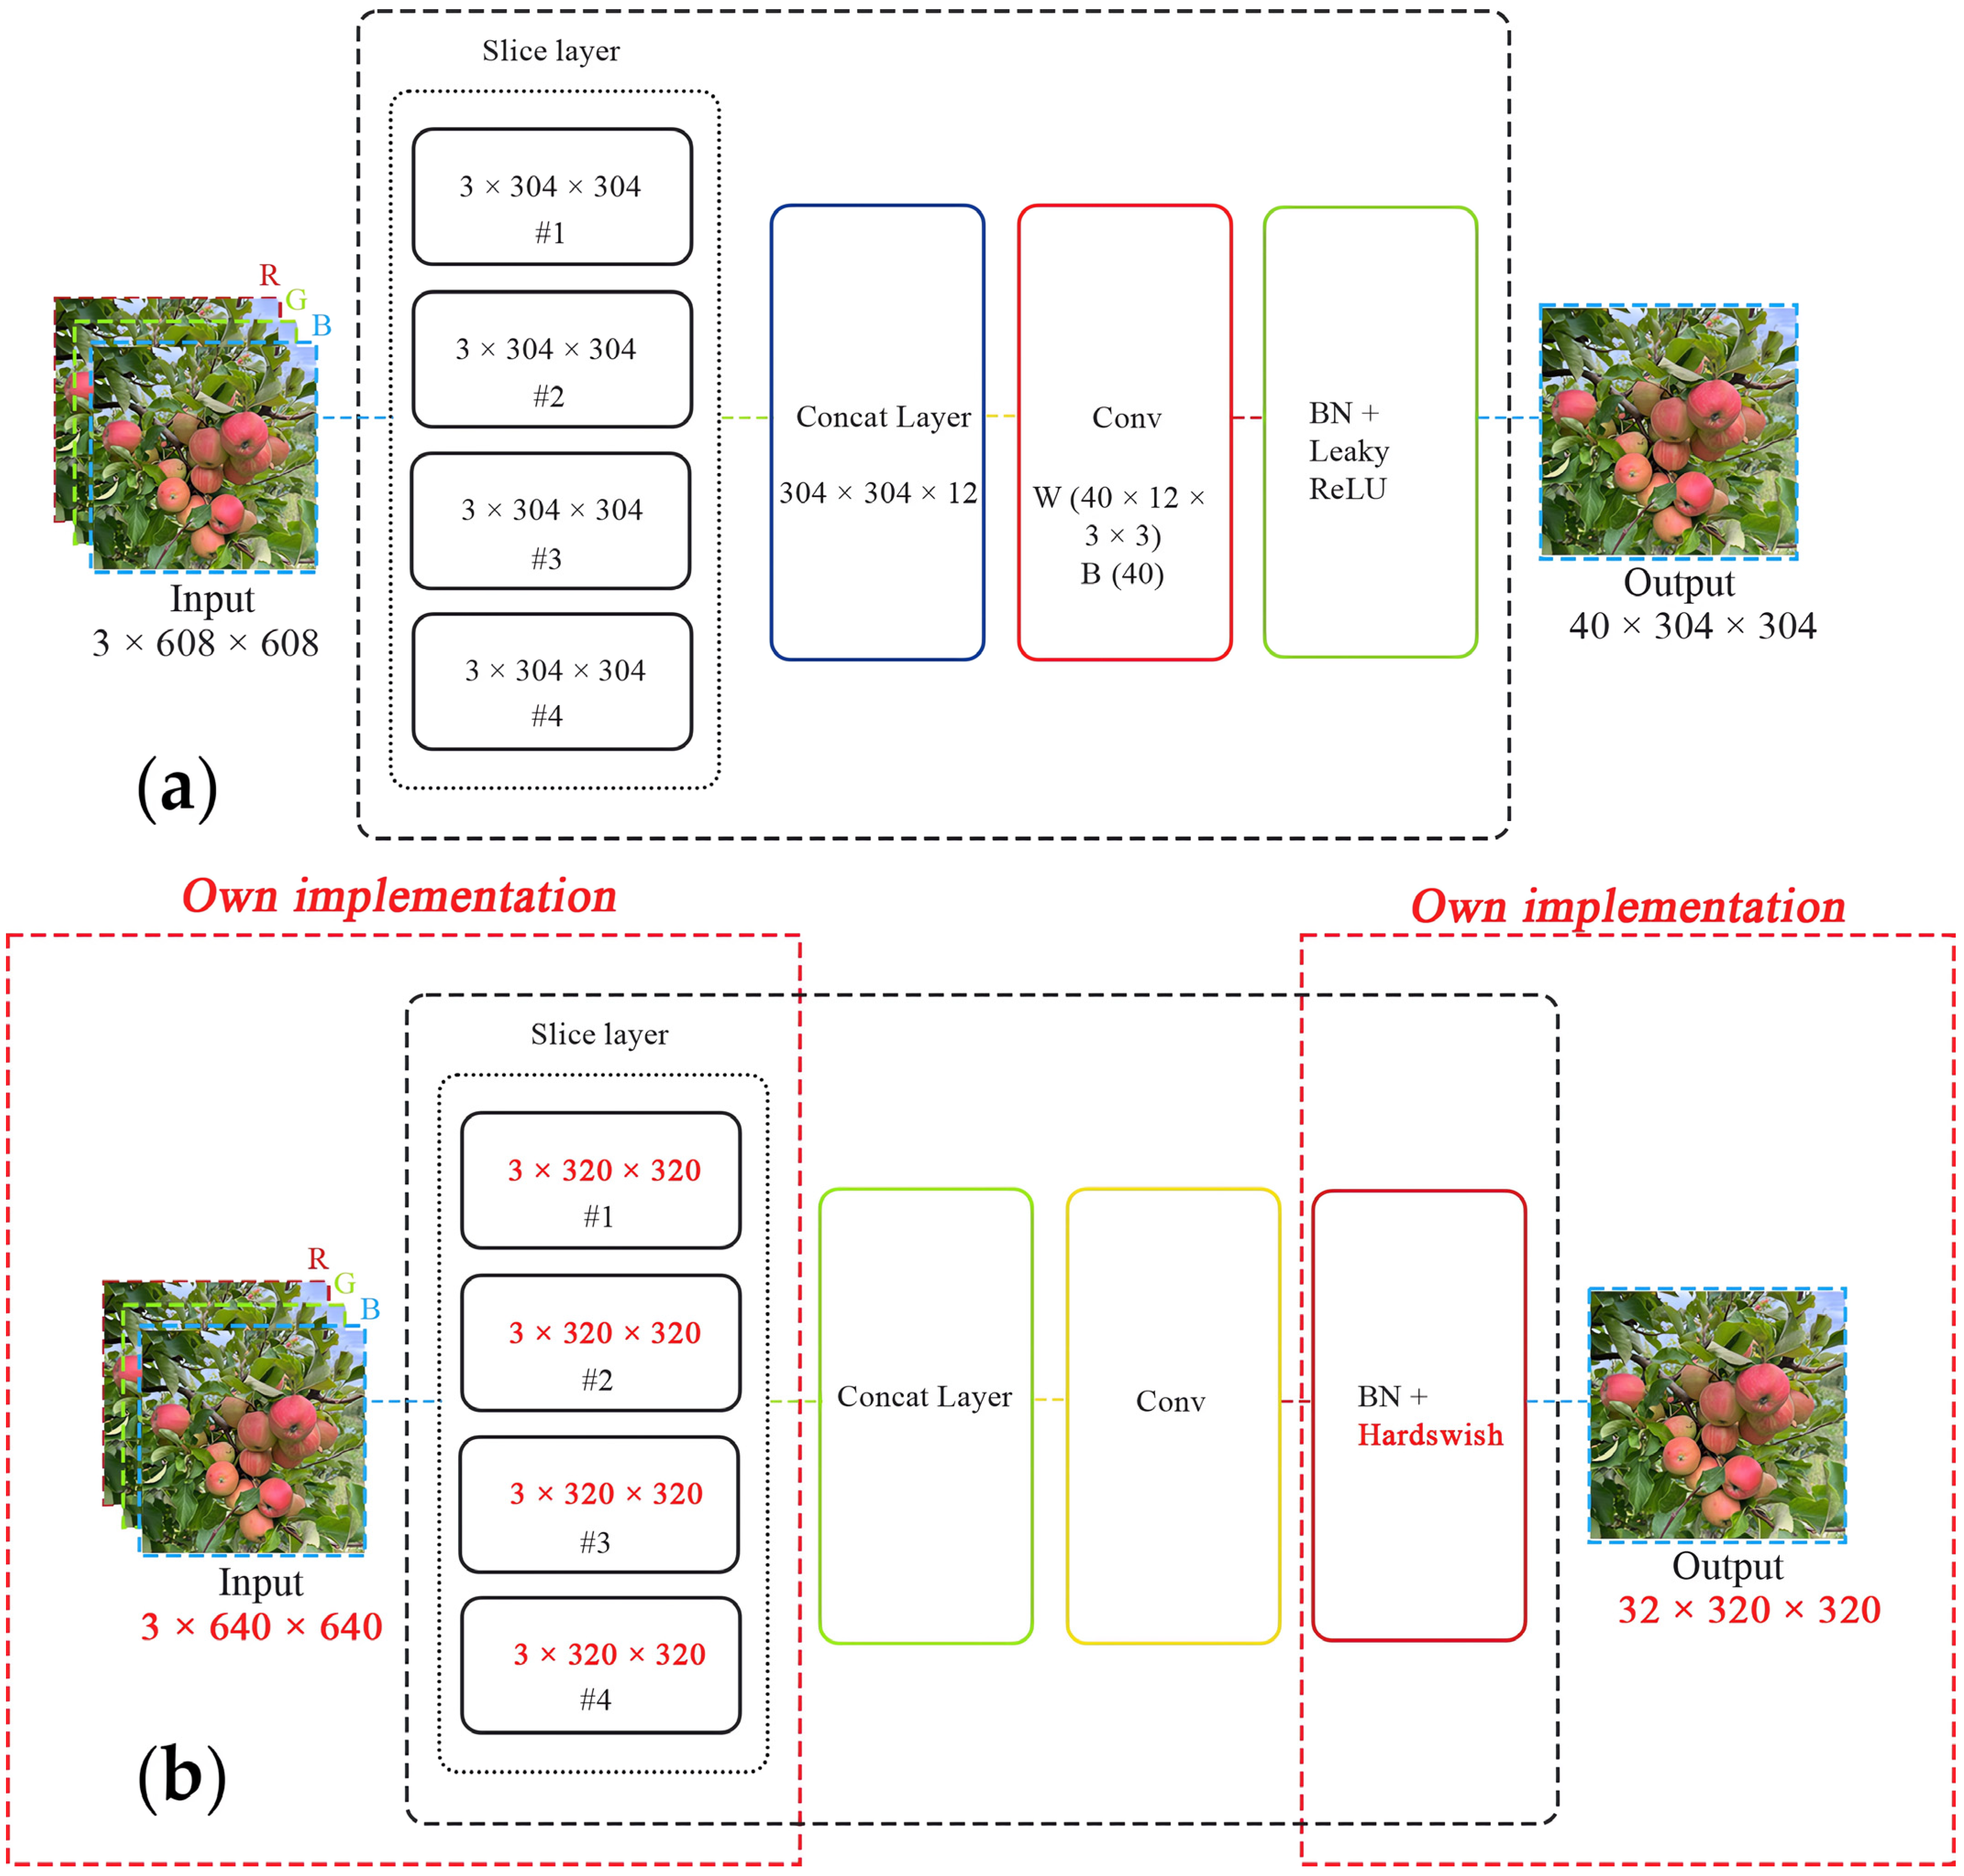
- The focus module of the original YOLOv5 is revamped to expedite the training process, as illustrated in Figure 5. Specifically, the incoming image, presented across three RGB channels with dimensions of 3 × 640 × 640, is segmented into four equal sections, each measuring 3 × 320 × 320. These quartered image segments are then amalgamated into a singular feature map for each RGB channel, culminating in an output dimension of 12 × 320 × 320. Furthermore, a convolutional operation employing 32 kernels is conducted on the newly formed 12 × 320 × 320 feature map, resulting in a feature map sized 32 × 320 × 320. Finally, batch normalization is subsequently applied to this 32 × 320 × 320 feature map, with the normalized output of the same size being transferred to the next processing phase of the network.
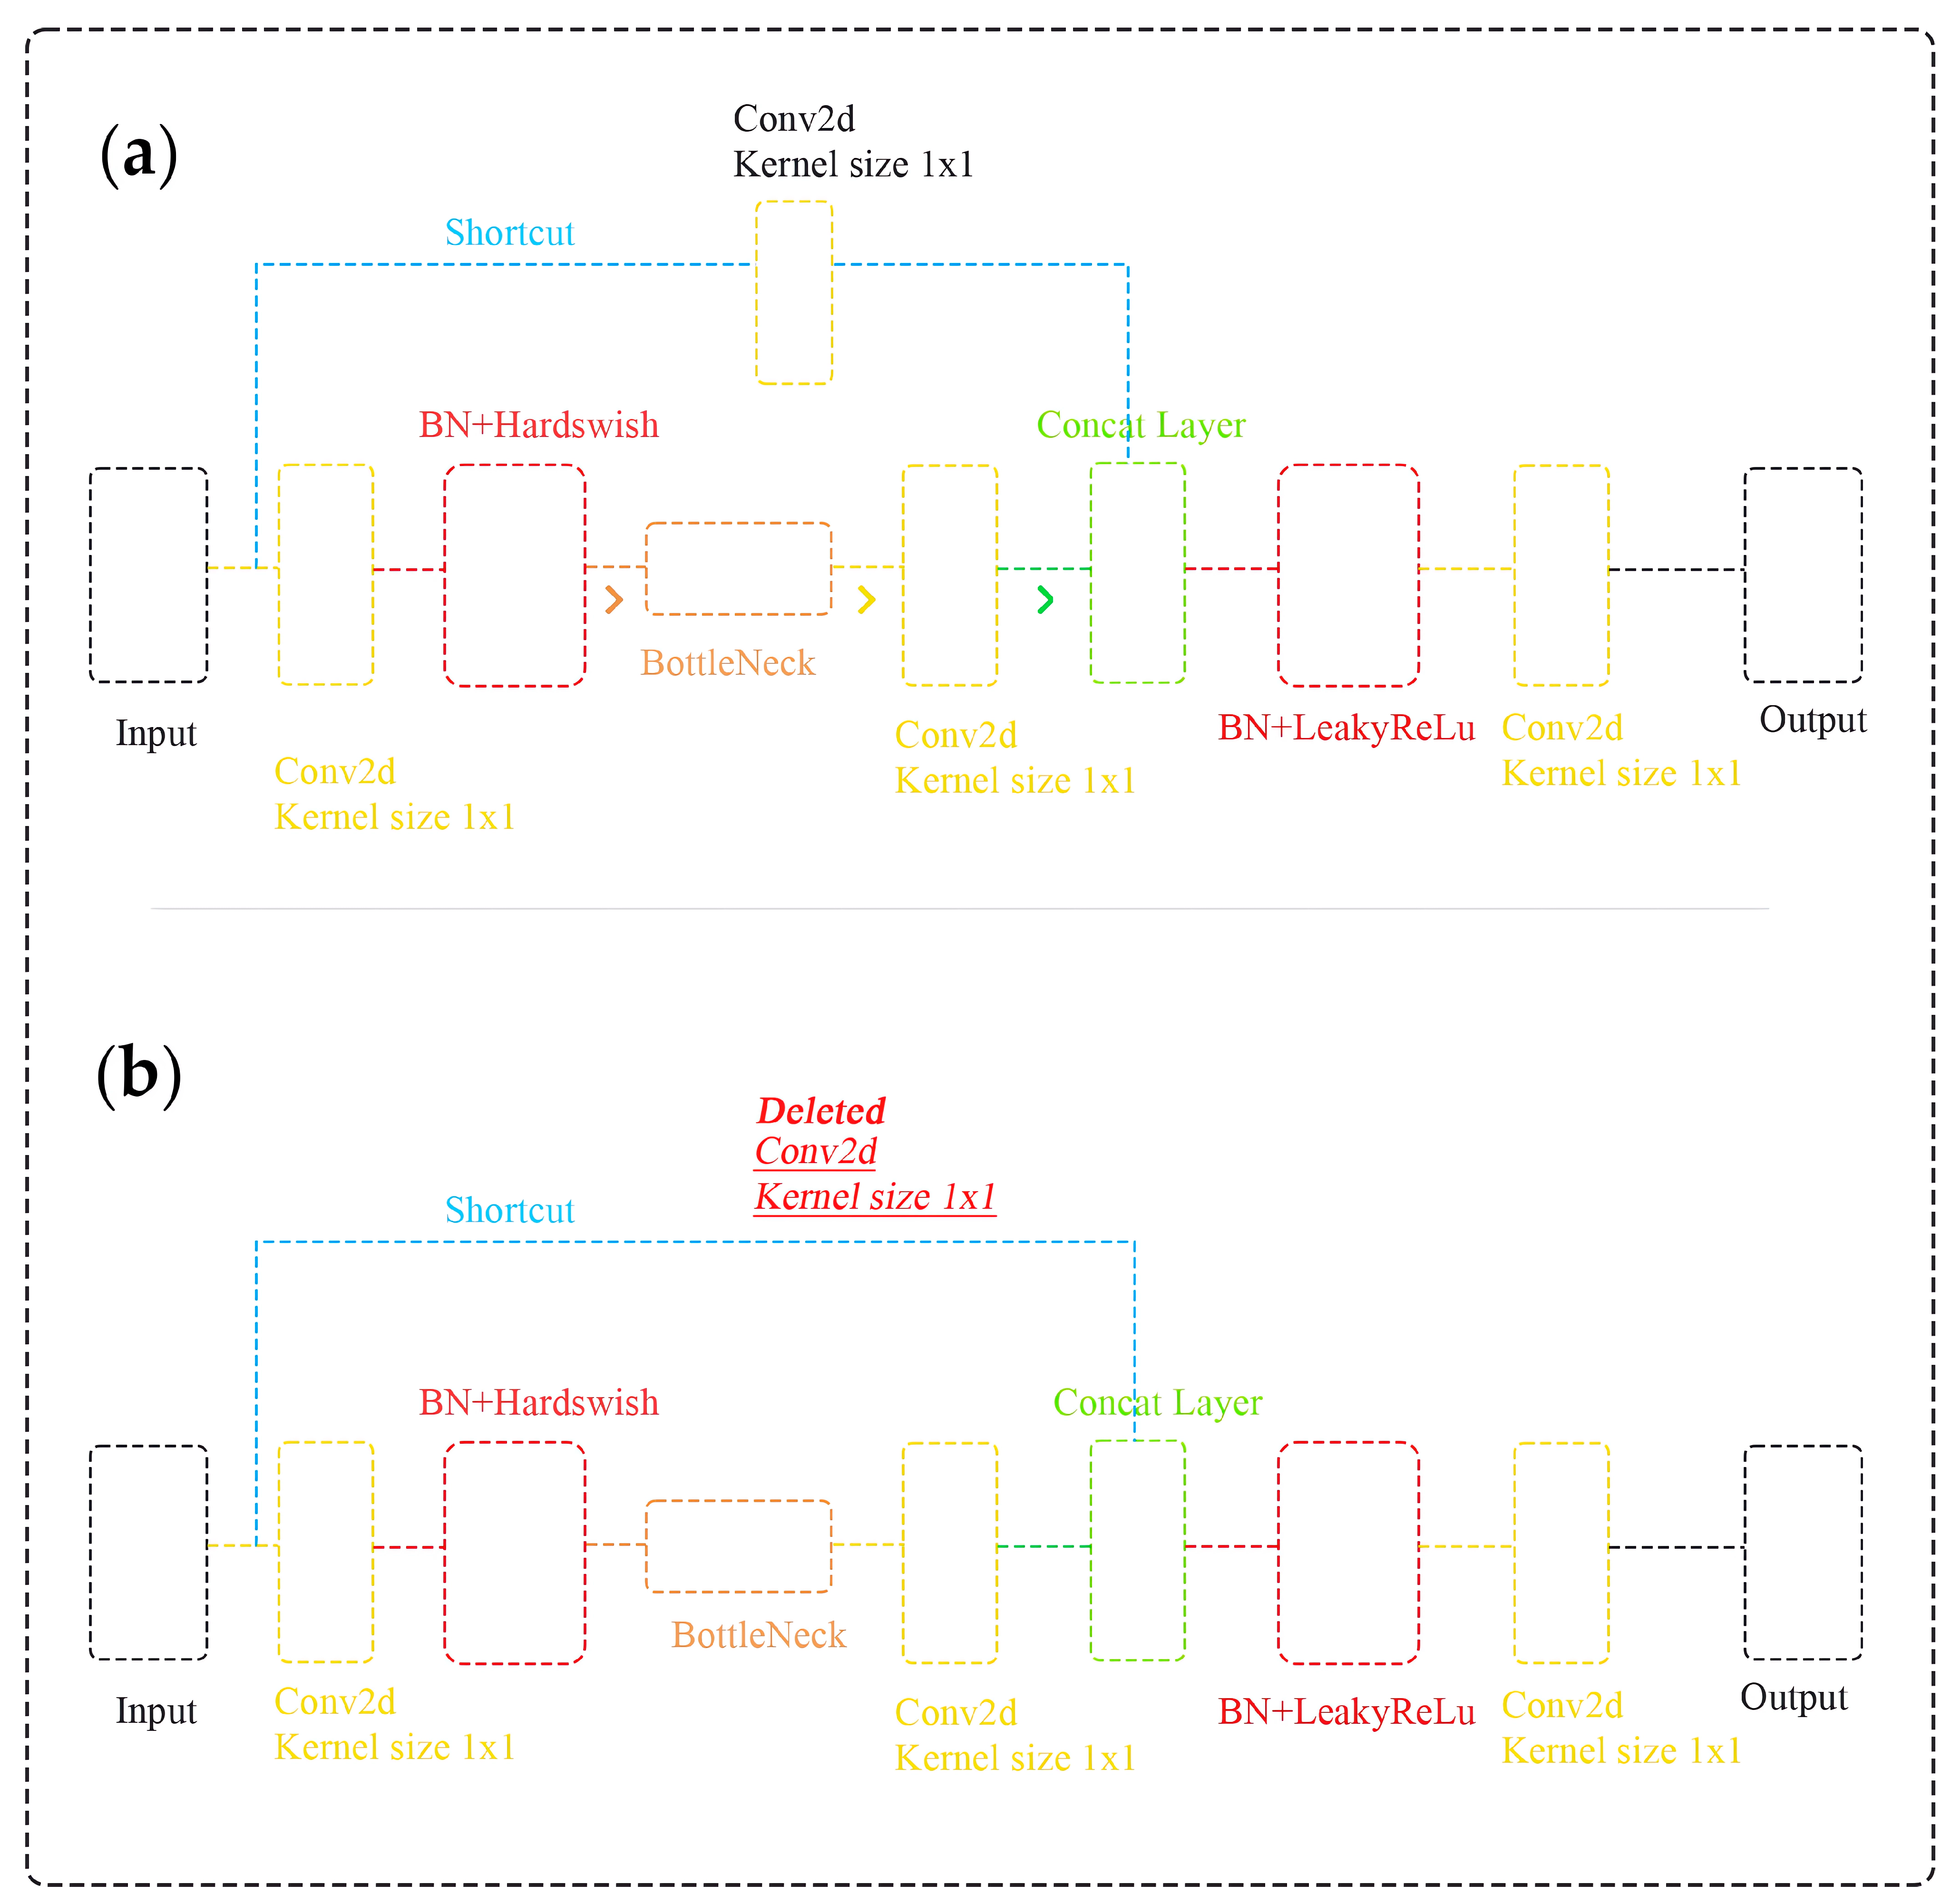
- A bottleneck layer is employed in the cross stage partial (CSP) network. The BottleneckCSP module incorporated into the YOLOv5-v1 architecture, as depicted in Figure 5, entails eliminating the convolutional layer that was previously used in the original BottleneckCSP module to combine the input feature map through a concatenation operation (refer to Figure 6). In the revised BottleneckCSP module, the input feature map is now directly connected to the output feature map depth-wise, leading to fewer parameters in the module.
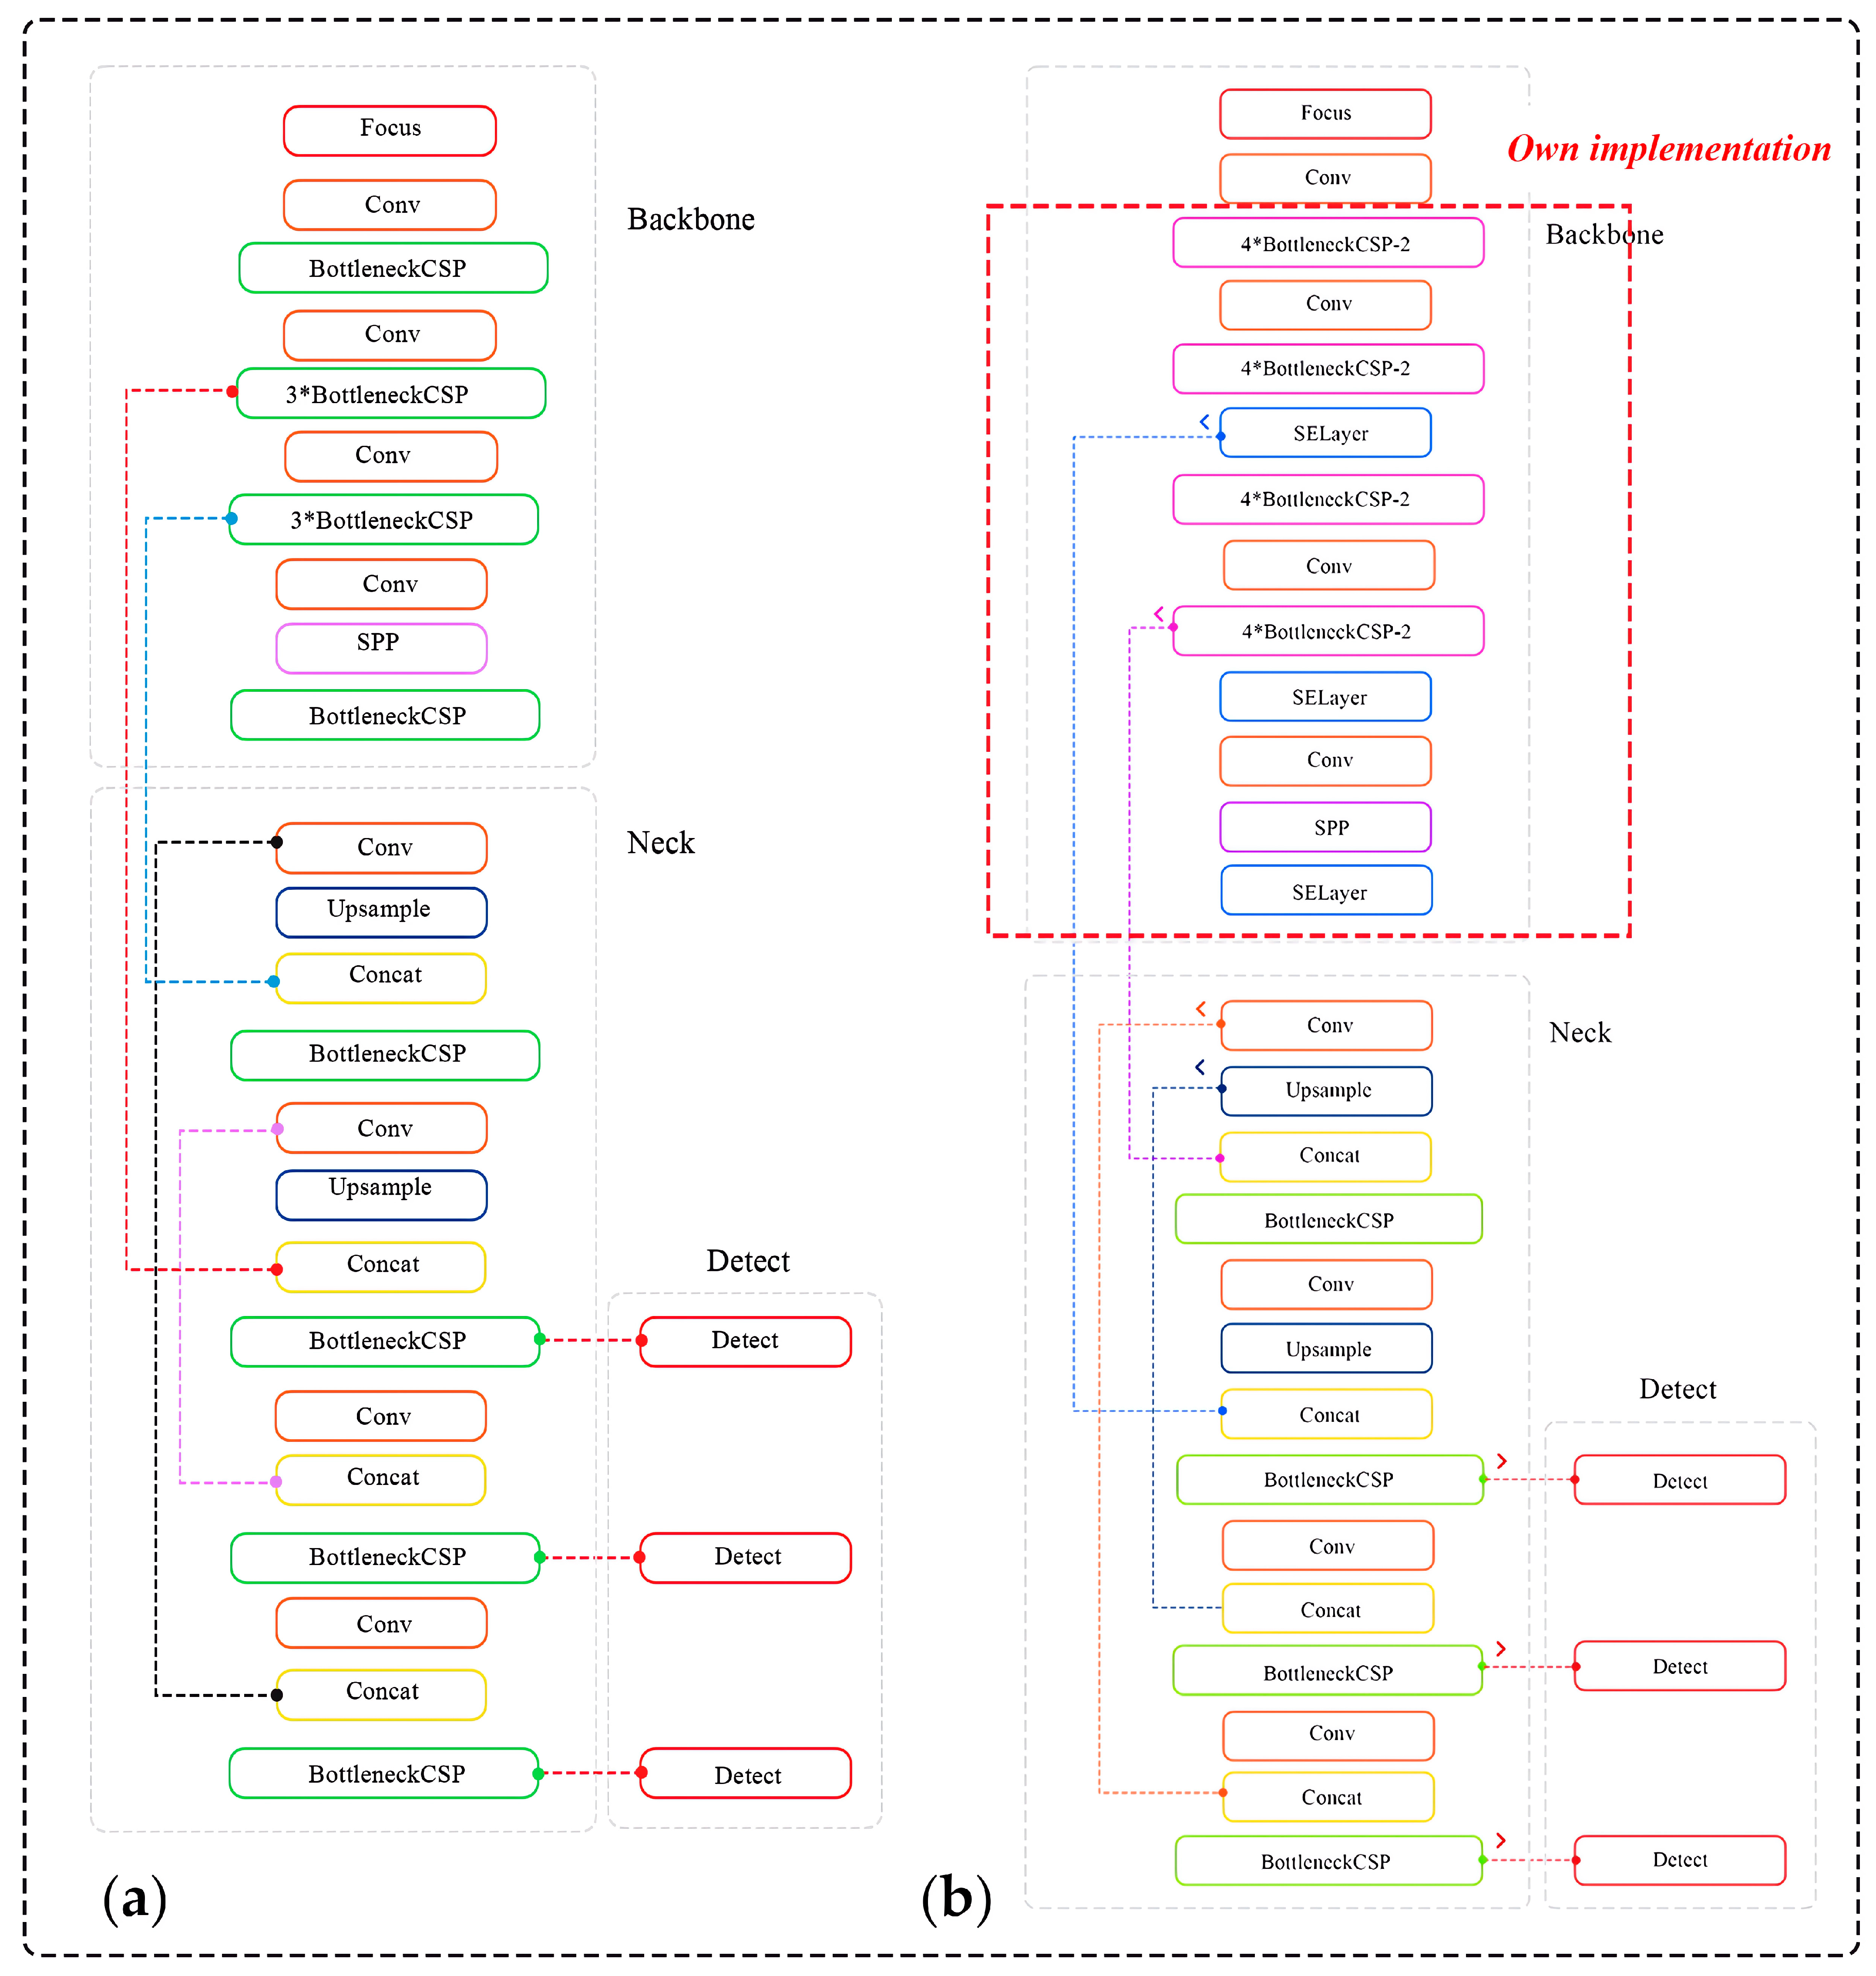
- The feature maps are merged. The proposed YOLOv5-v1 employs a technique to merge variously sized feature maps into a single, more discriminative feature map to improve the detection precision of structural objects in video frames. This improvement considers both the simplified design of the updated BottleneckCSP module and the integration of feature maps from the convolutional layers in YOLOv5-v1. Specifically, the original layer mergers from layers 4 to 15, 6 to 11, and 10 to 21 in the original YOLOv5 architecture have been altered to layers 5 to 18, 8 to 14, and 13 to 24 in the enhanced YOLOv5-v1 architecture.
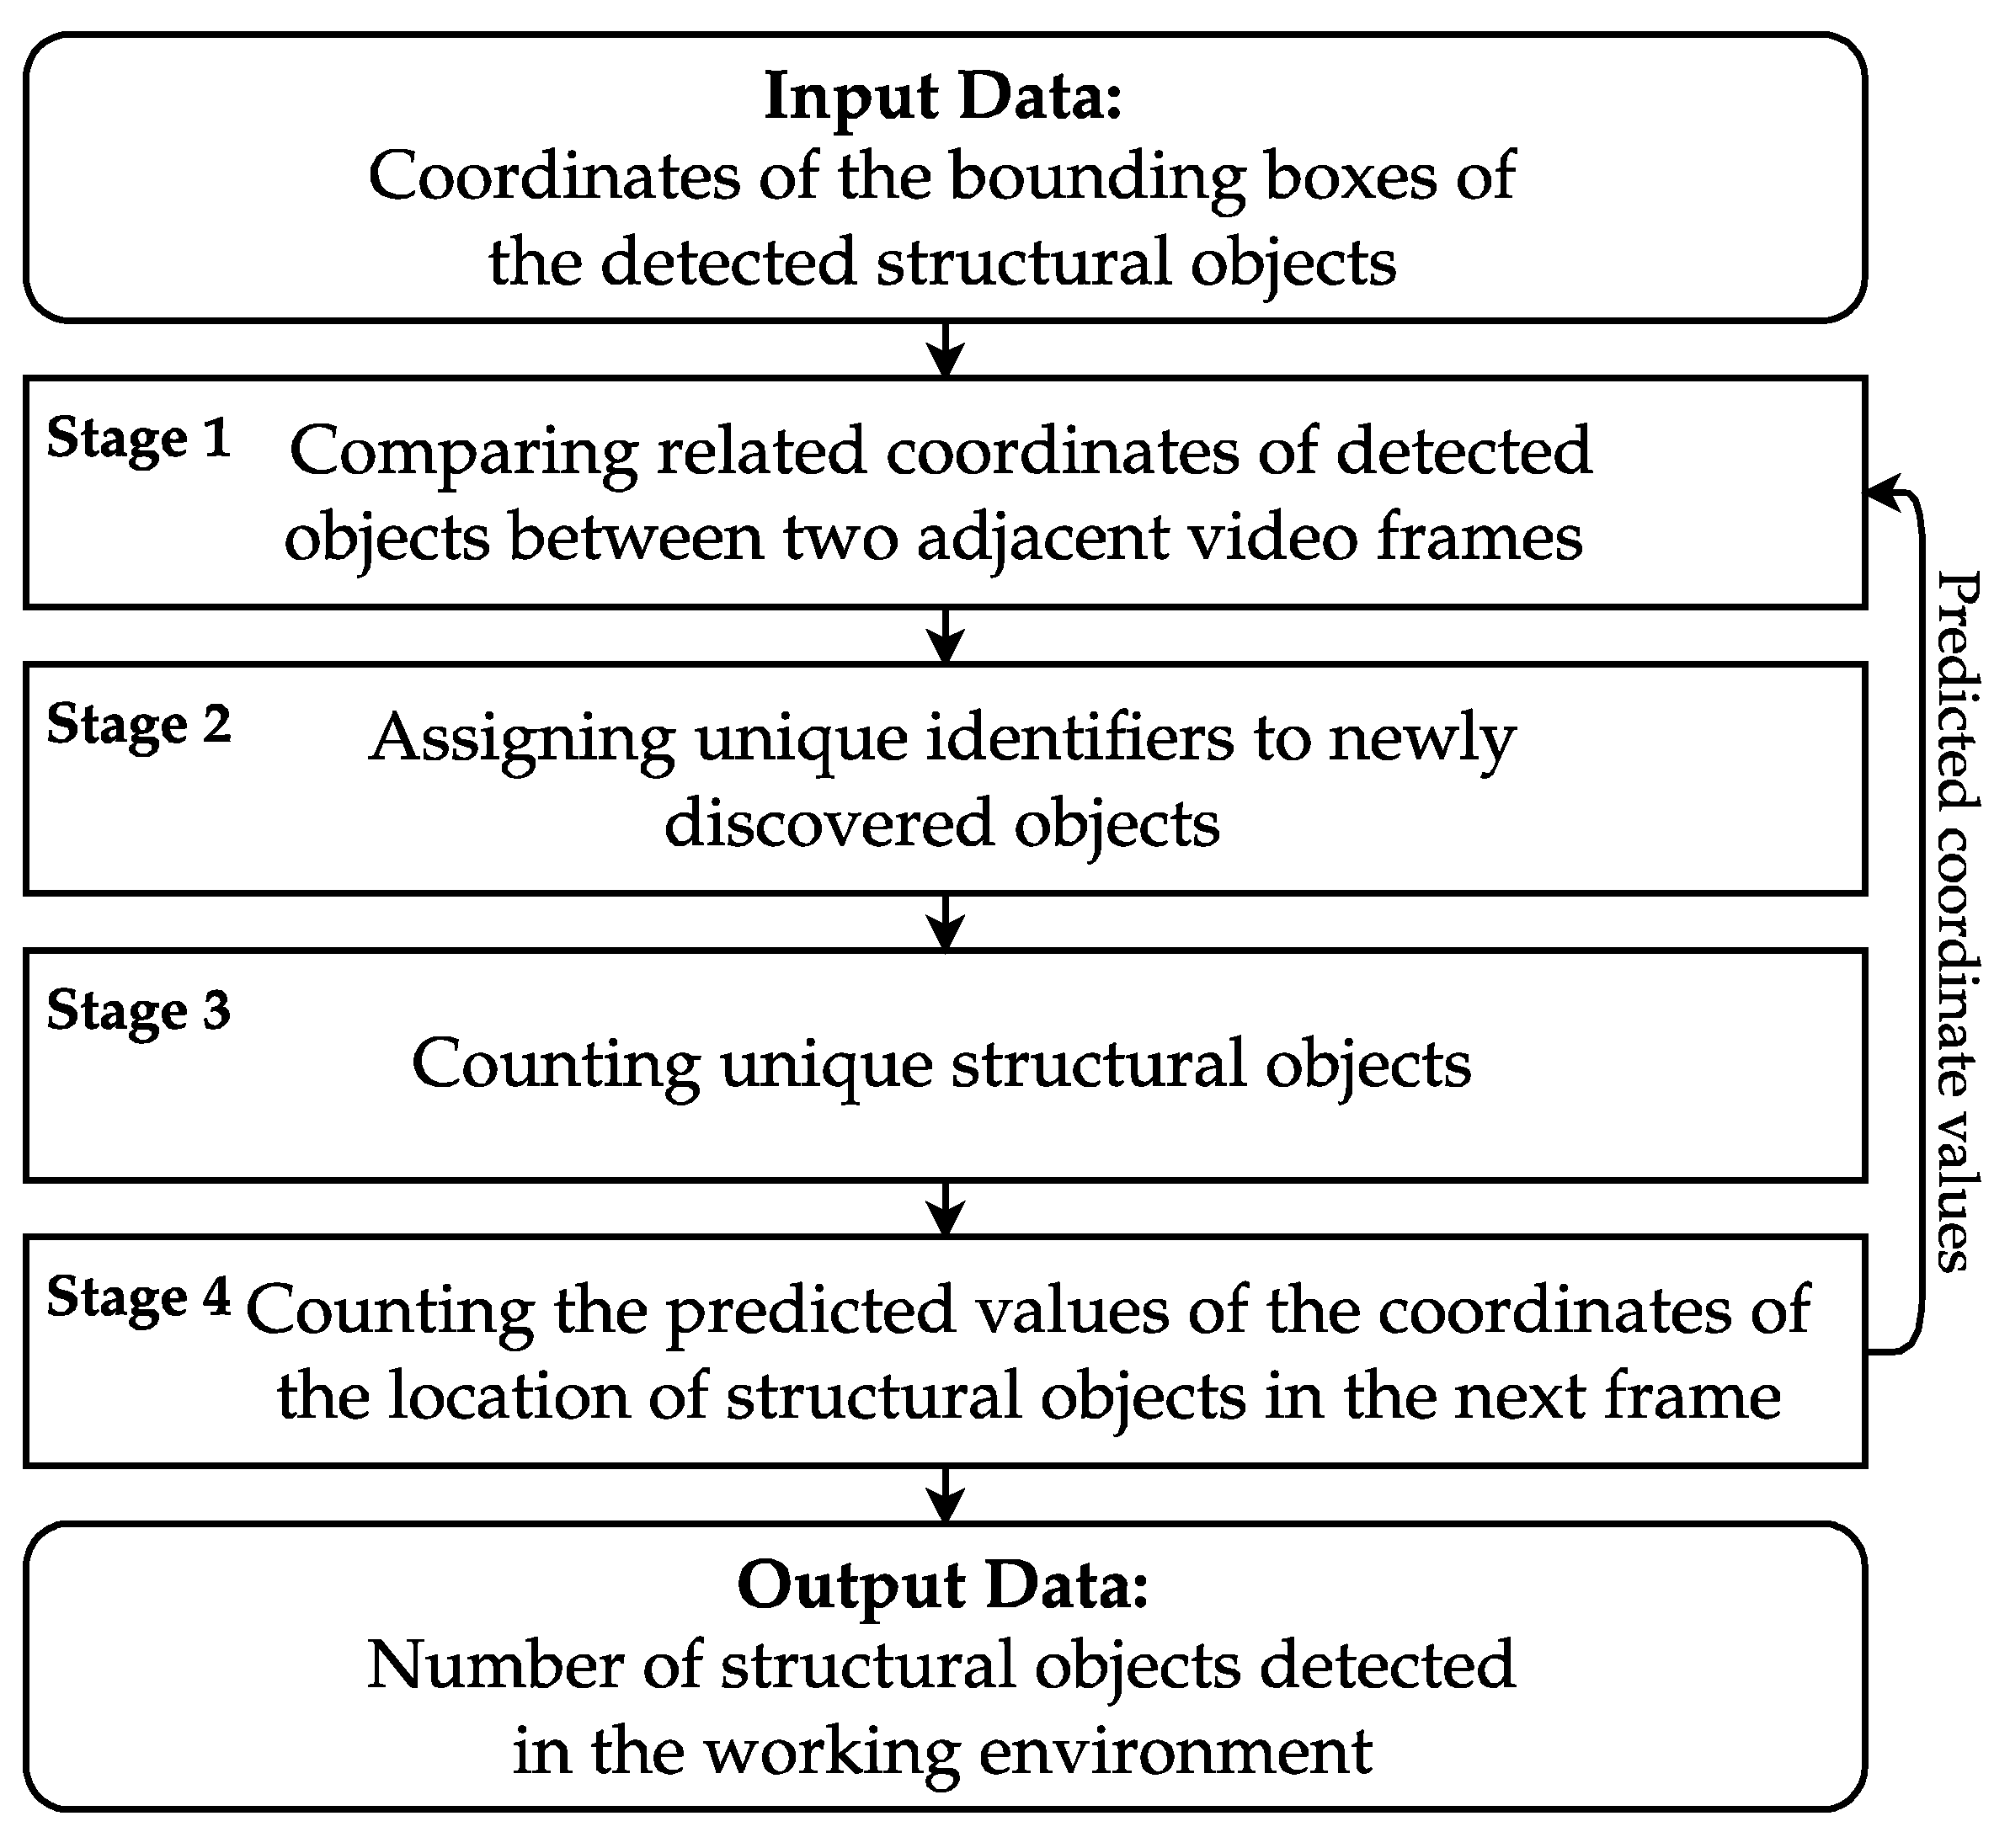
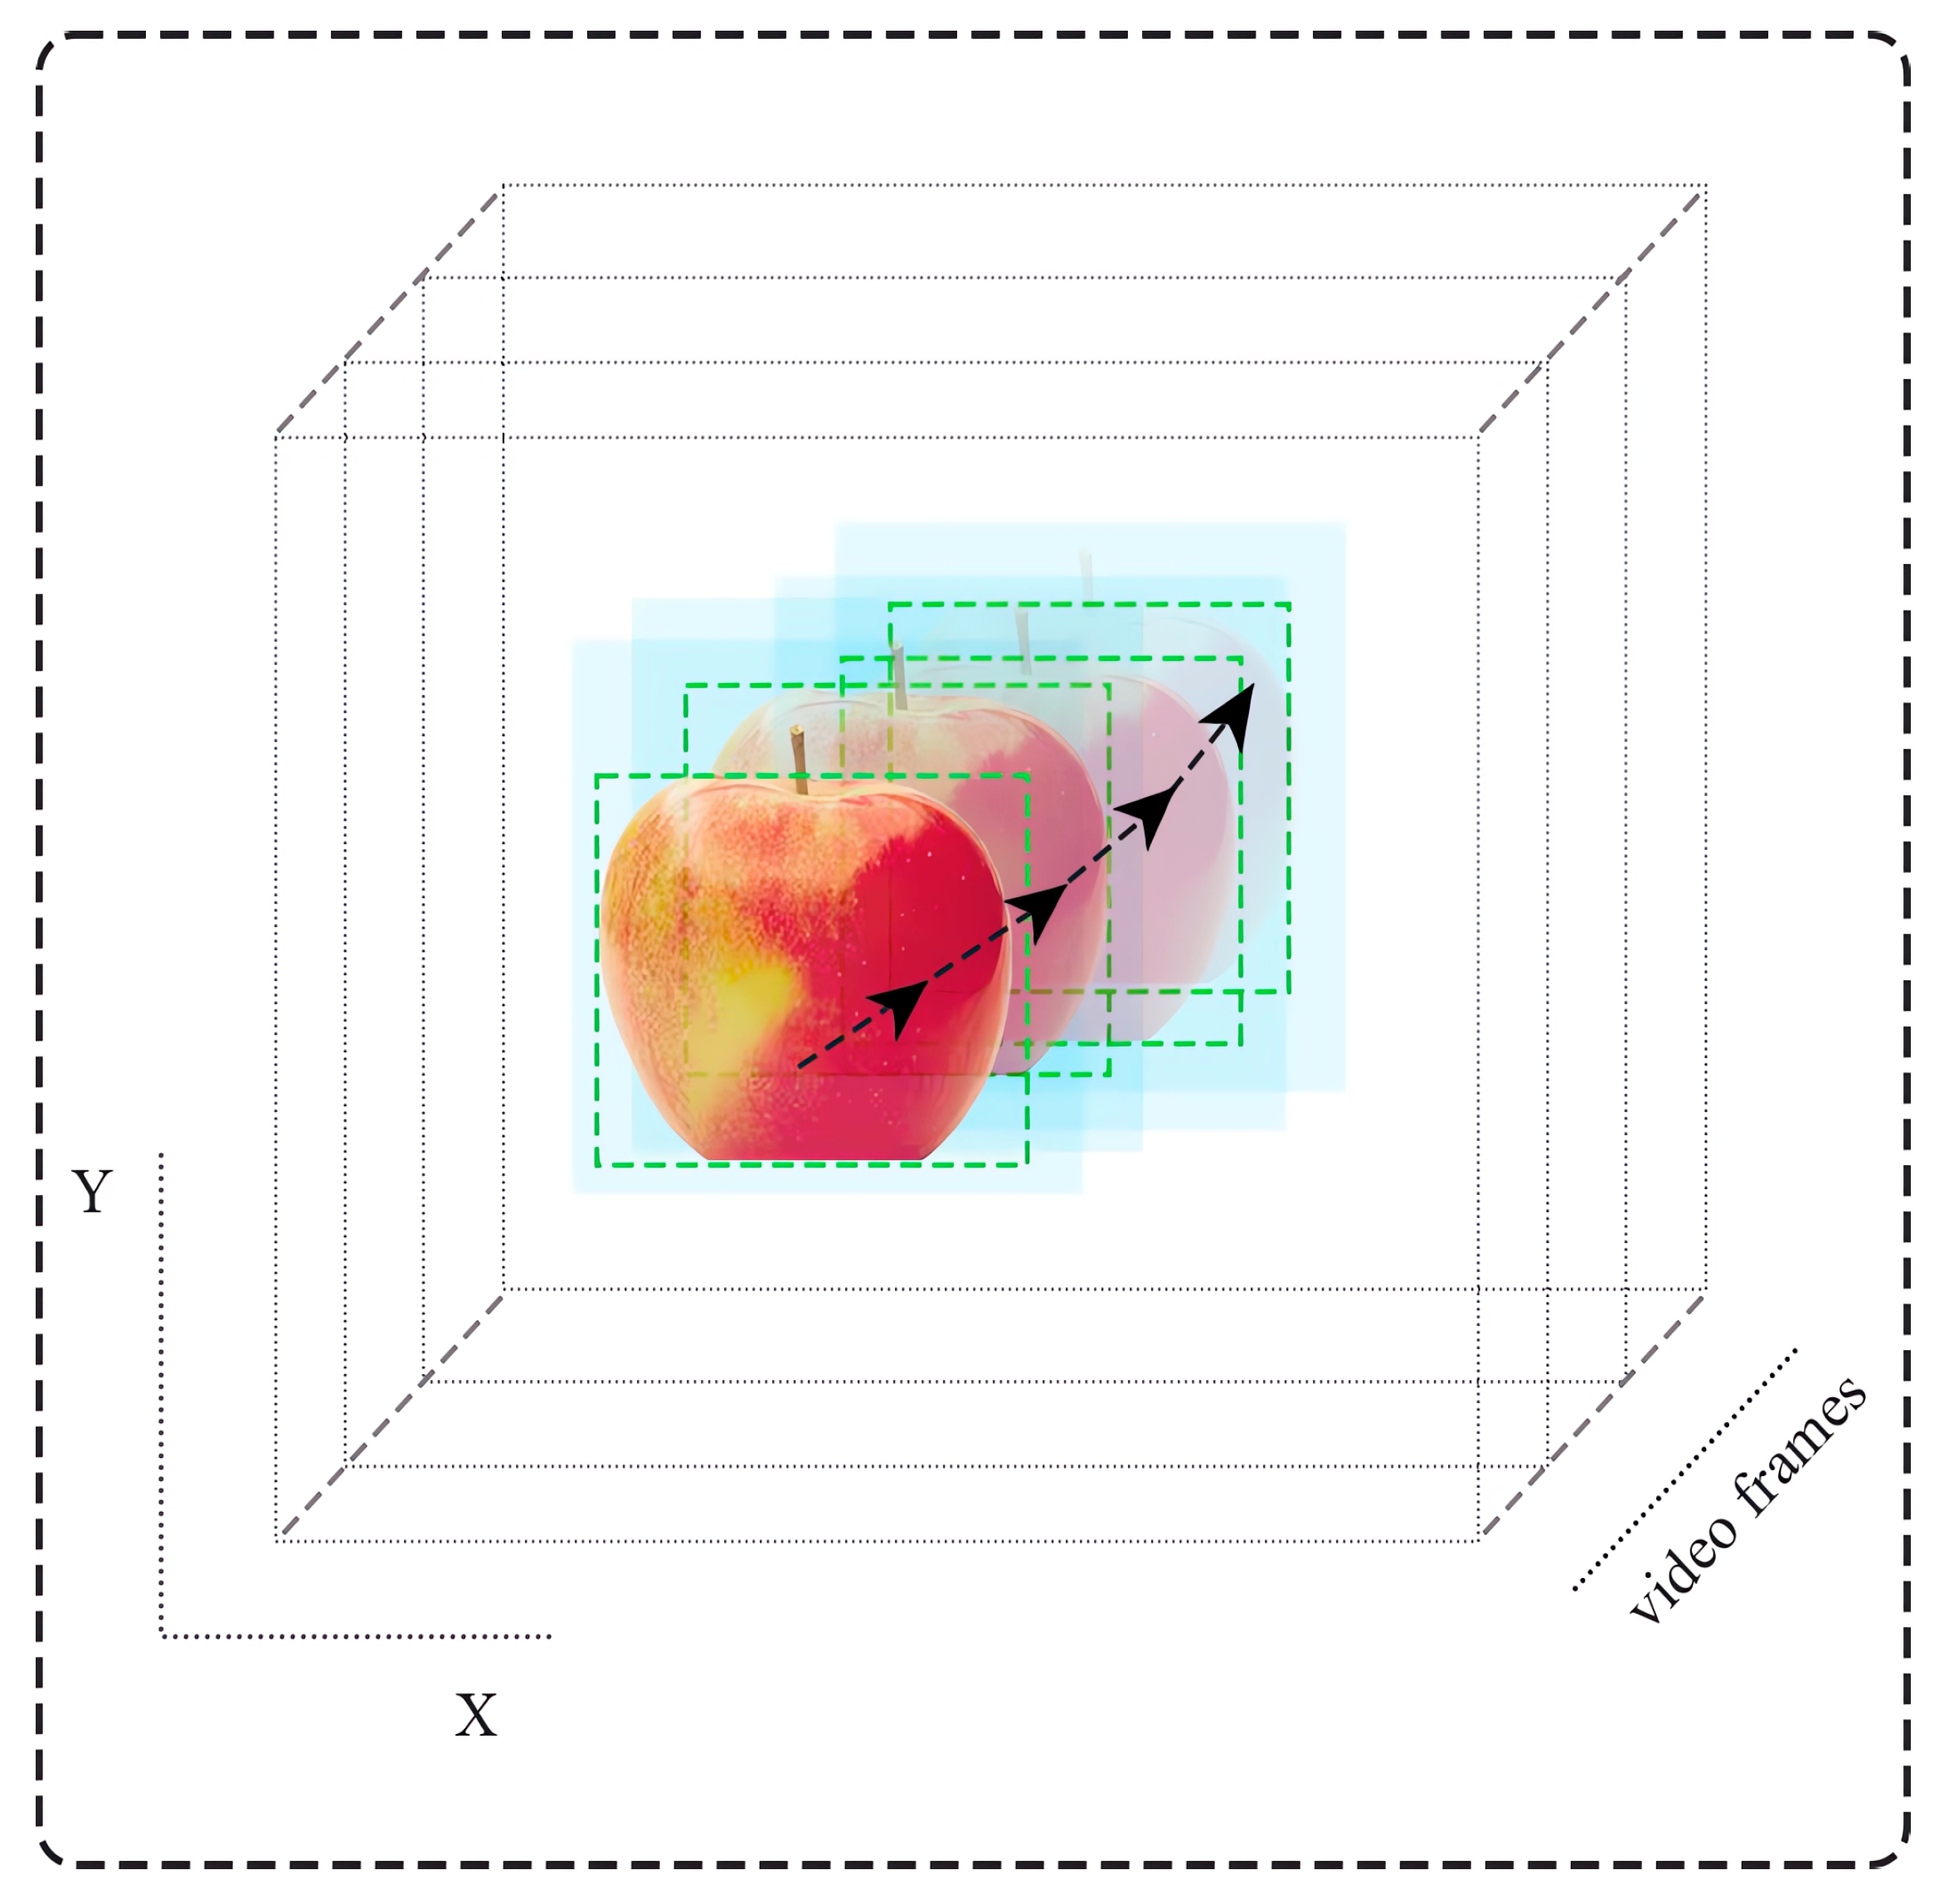
2.3.2. Tracking and Counting the Specified Structural Objects
2.4. Methodology and Experimental Setting
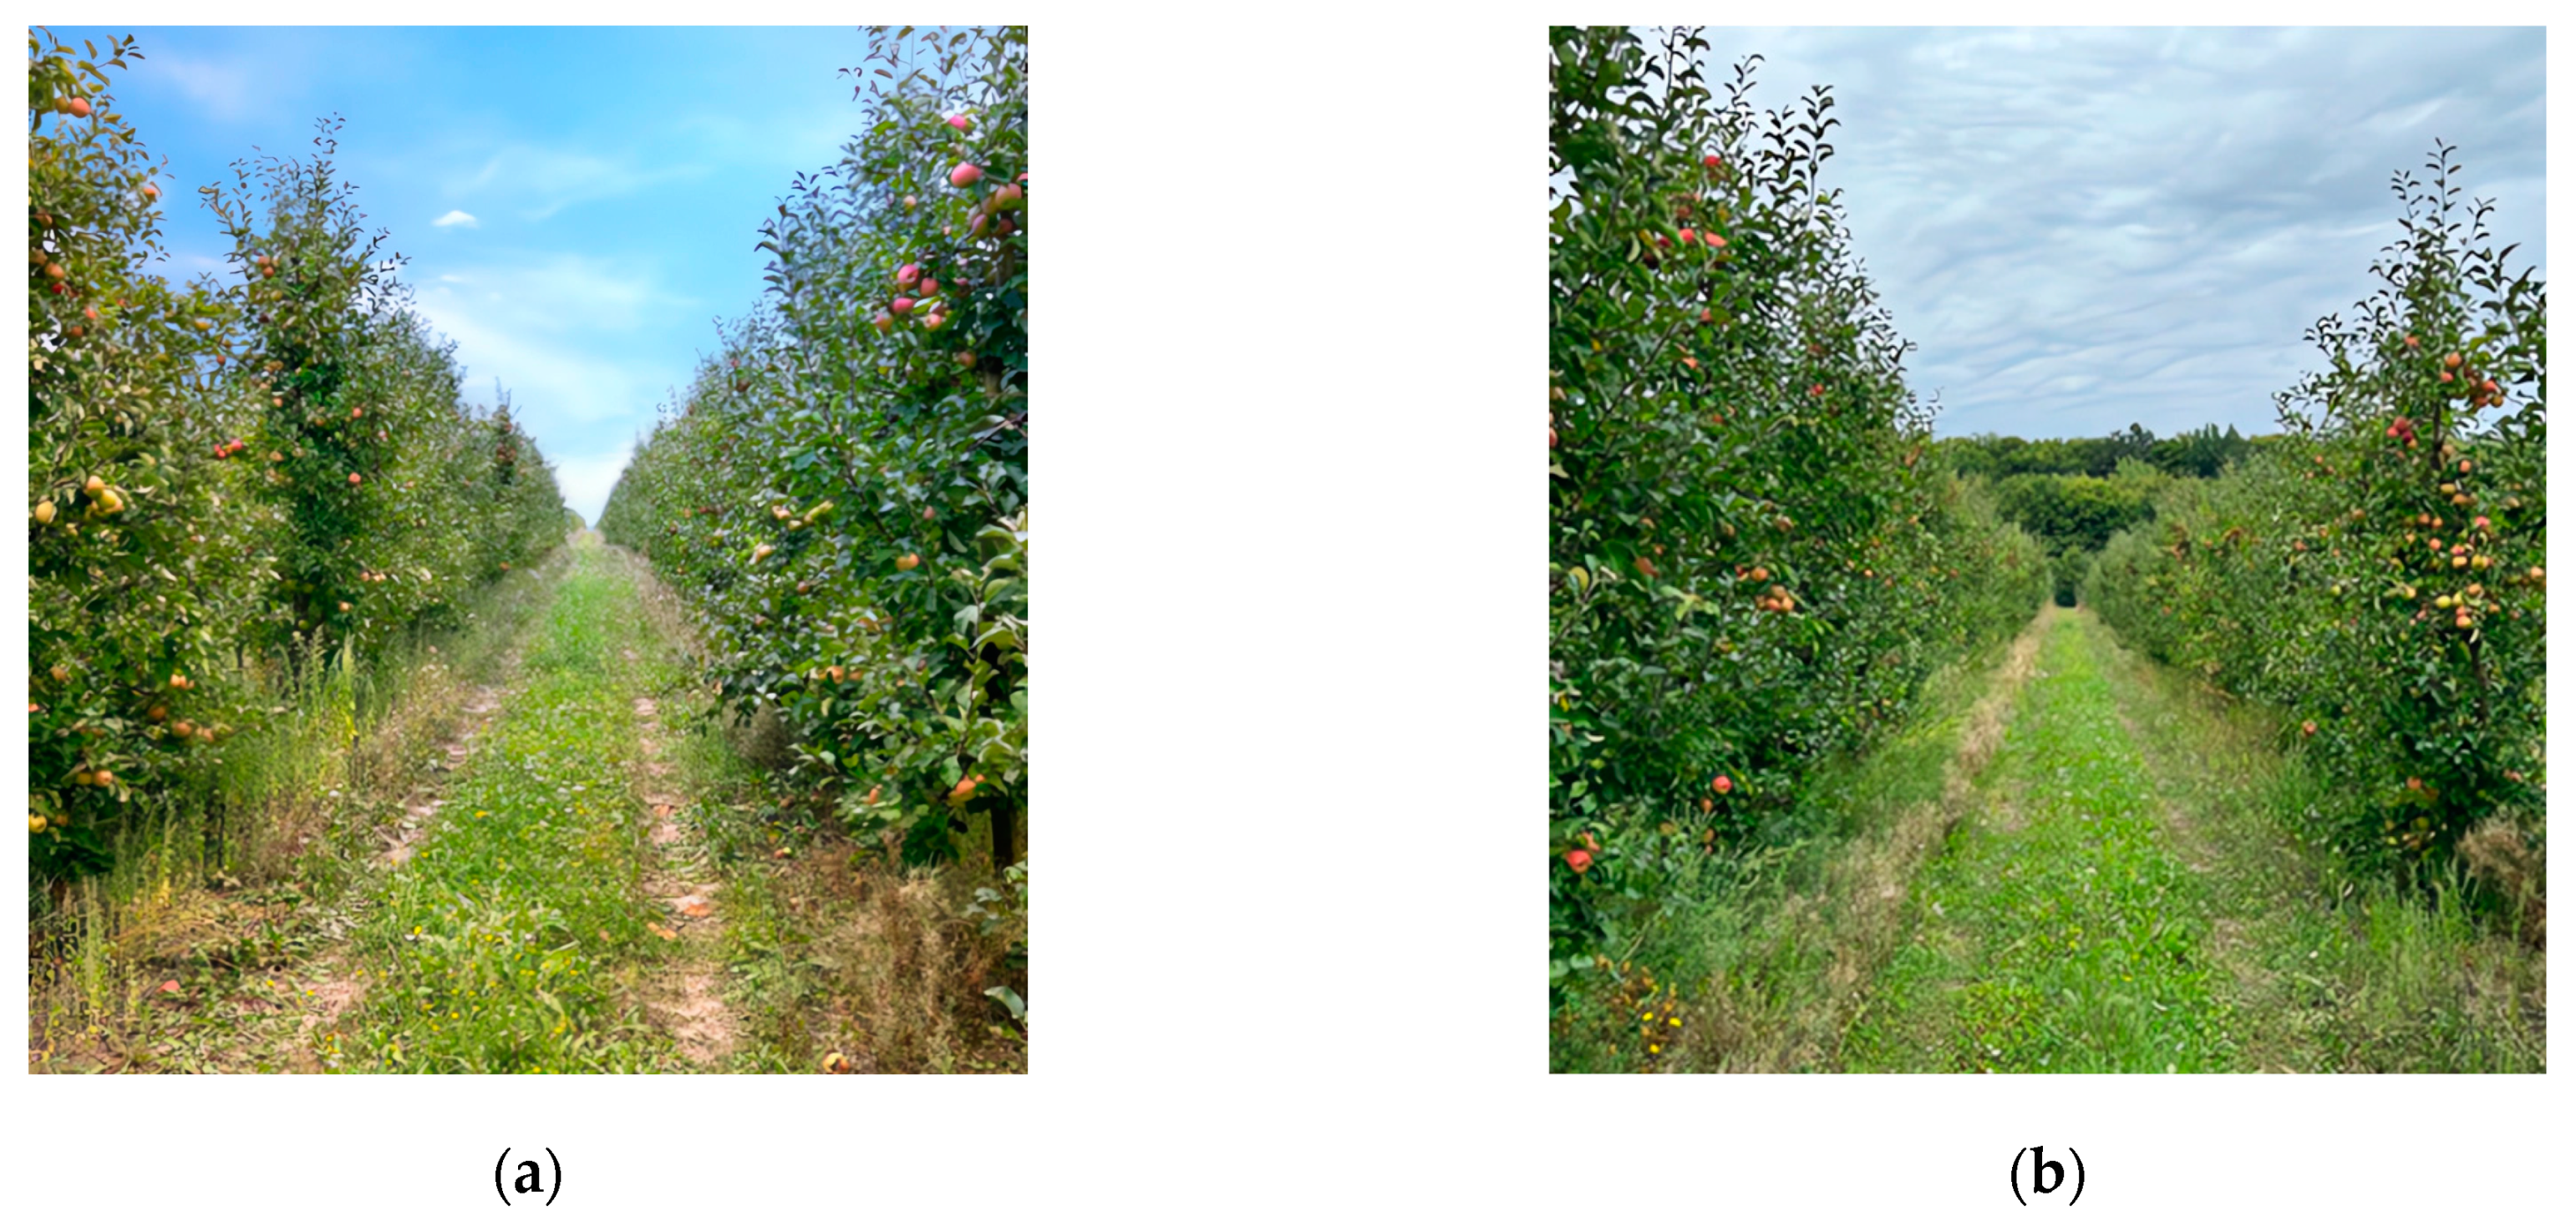
2.4.1. Experimental Area
2.4.2. Equipment Details
2.4.3. Evaluation Criteria
3. Case Study
3.1. Creating a Detector for Tracking Tasks
3.1.1. Training Dataset
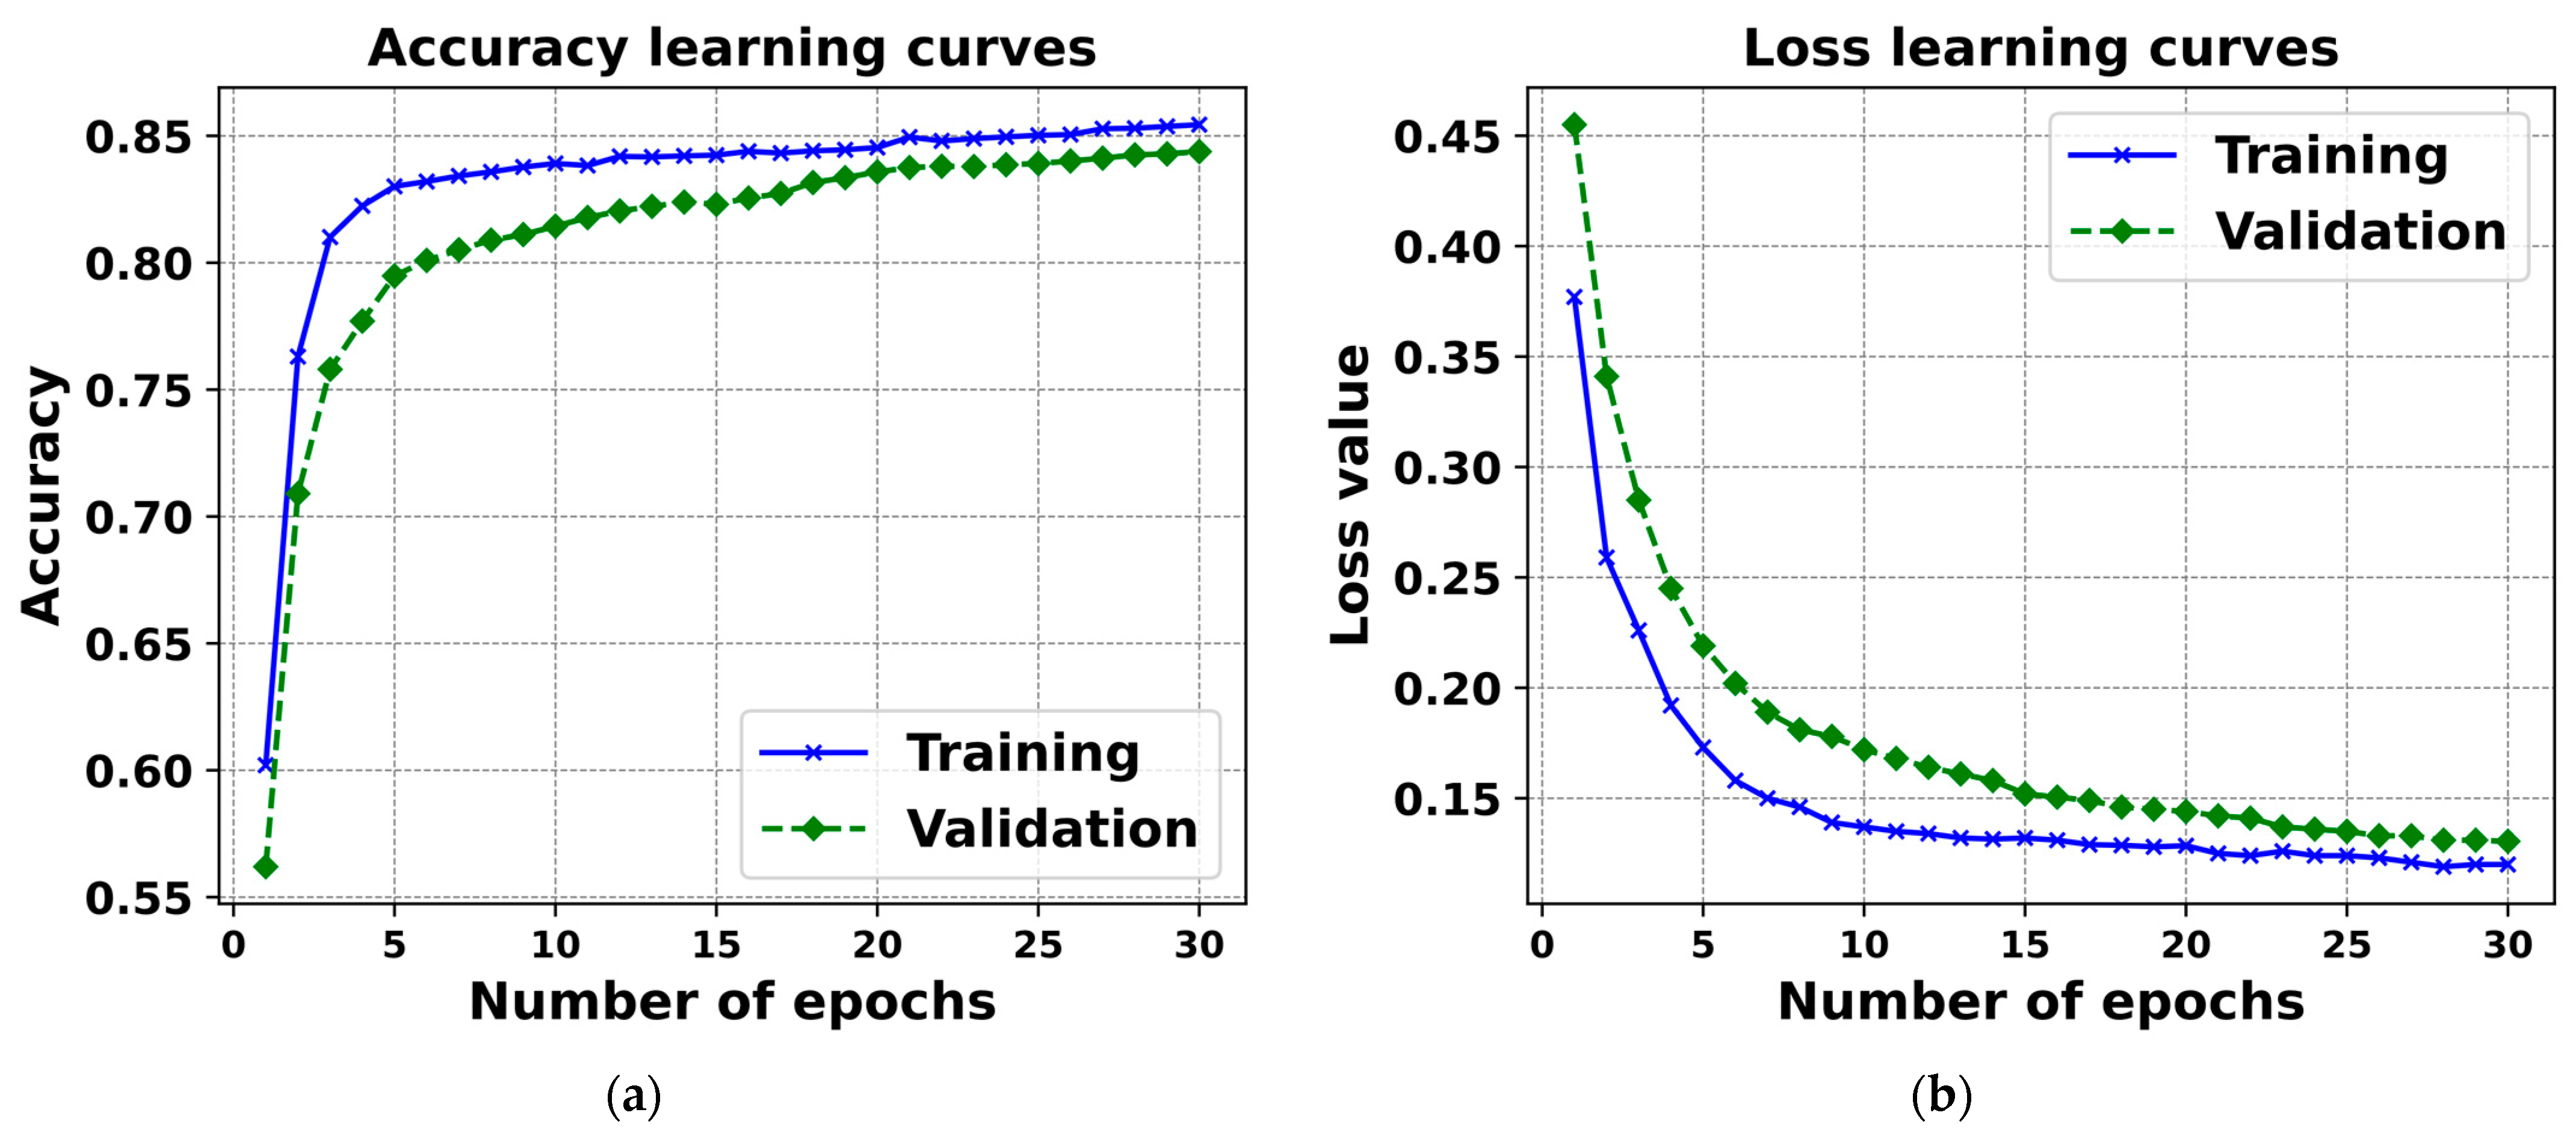
3.1.2. Creating a Detector
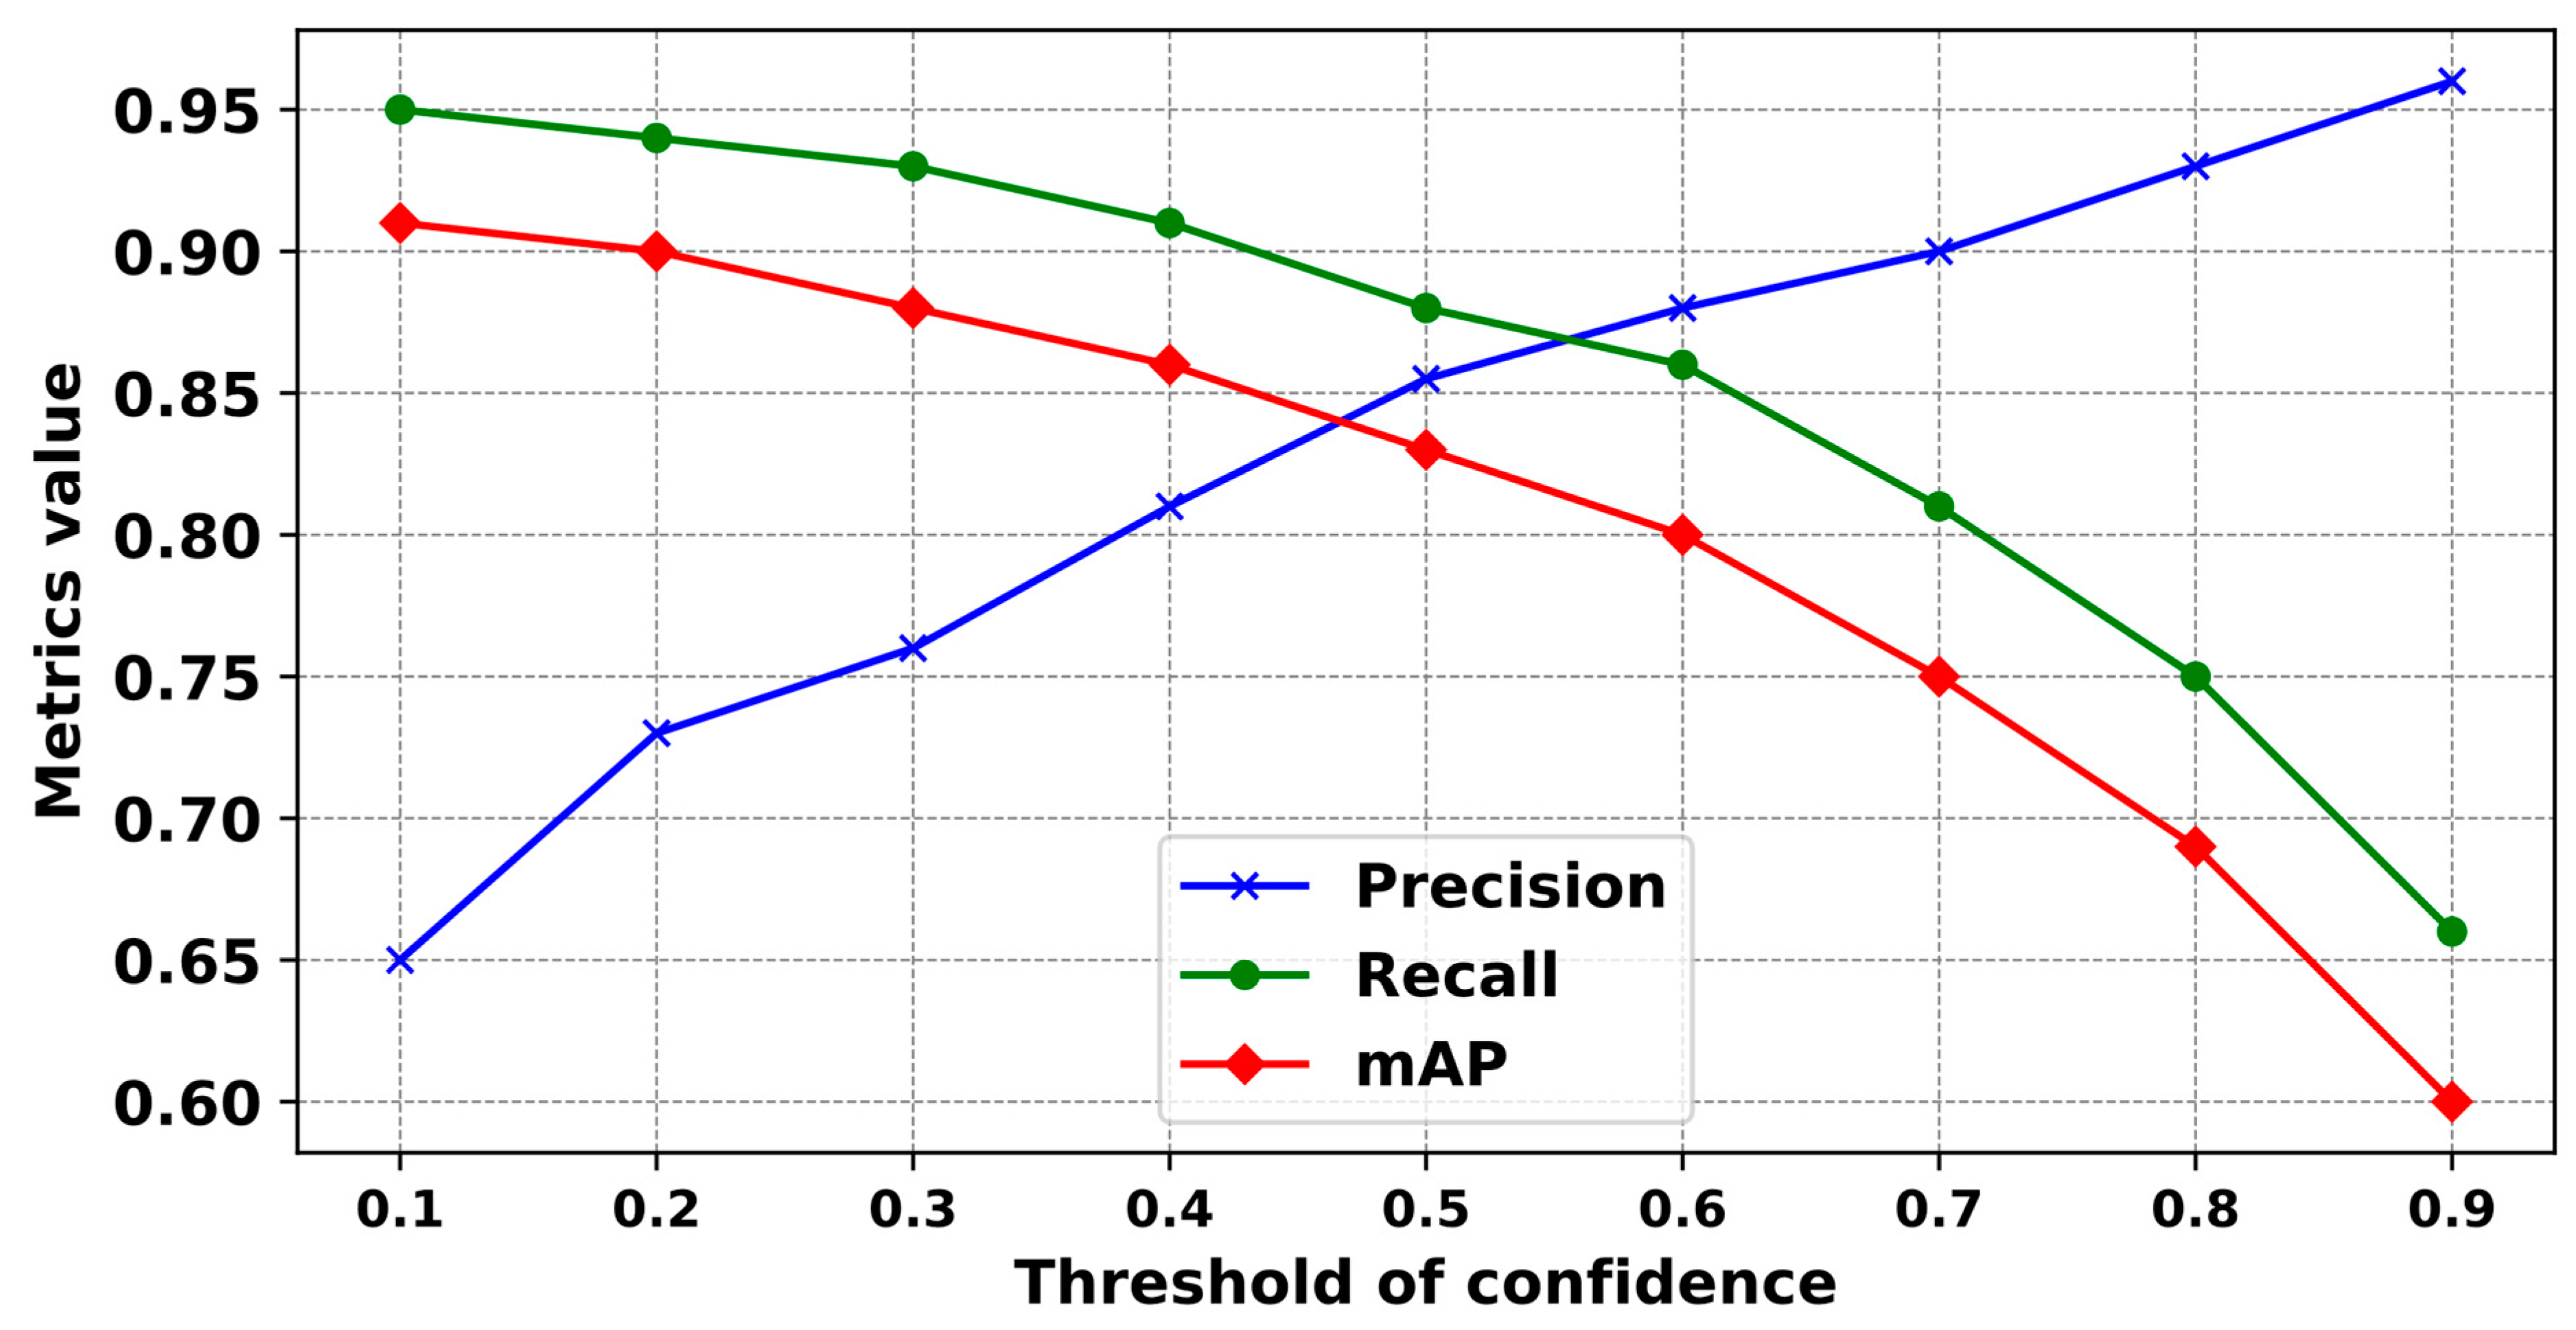
- (1)
- When the confidence threshold was established at below 0.5, YOLOv5-v1 showed suboptimal recognition precision, falling below 80%.
- (2)
- Conversely, setting the confidence threshold above 0.5 led to a gradual decrease in the average precision of the classification.
- (3)
- Optimal efficiency and performance from YOLOv5-v1 were achieved when the probability threshold was precisely set at 0.5. Under this setting, YOLOv5-v1 attained average classification accuracies of 83.8%, 91.5%, and 86.8% for three object categories that correspond to three types of anchor boxes: small, medium, and large (see Section 2.3.1).
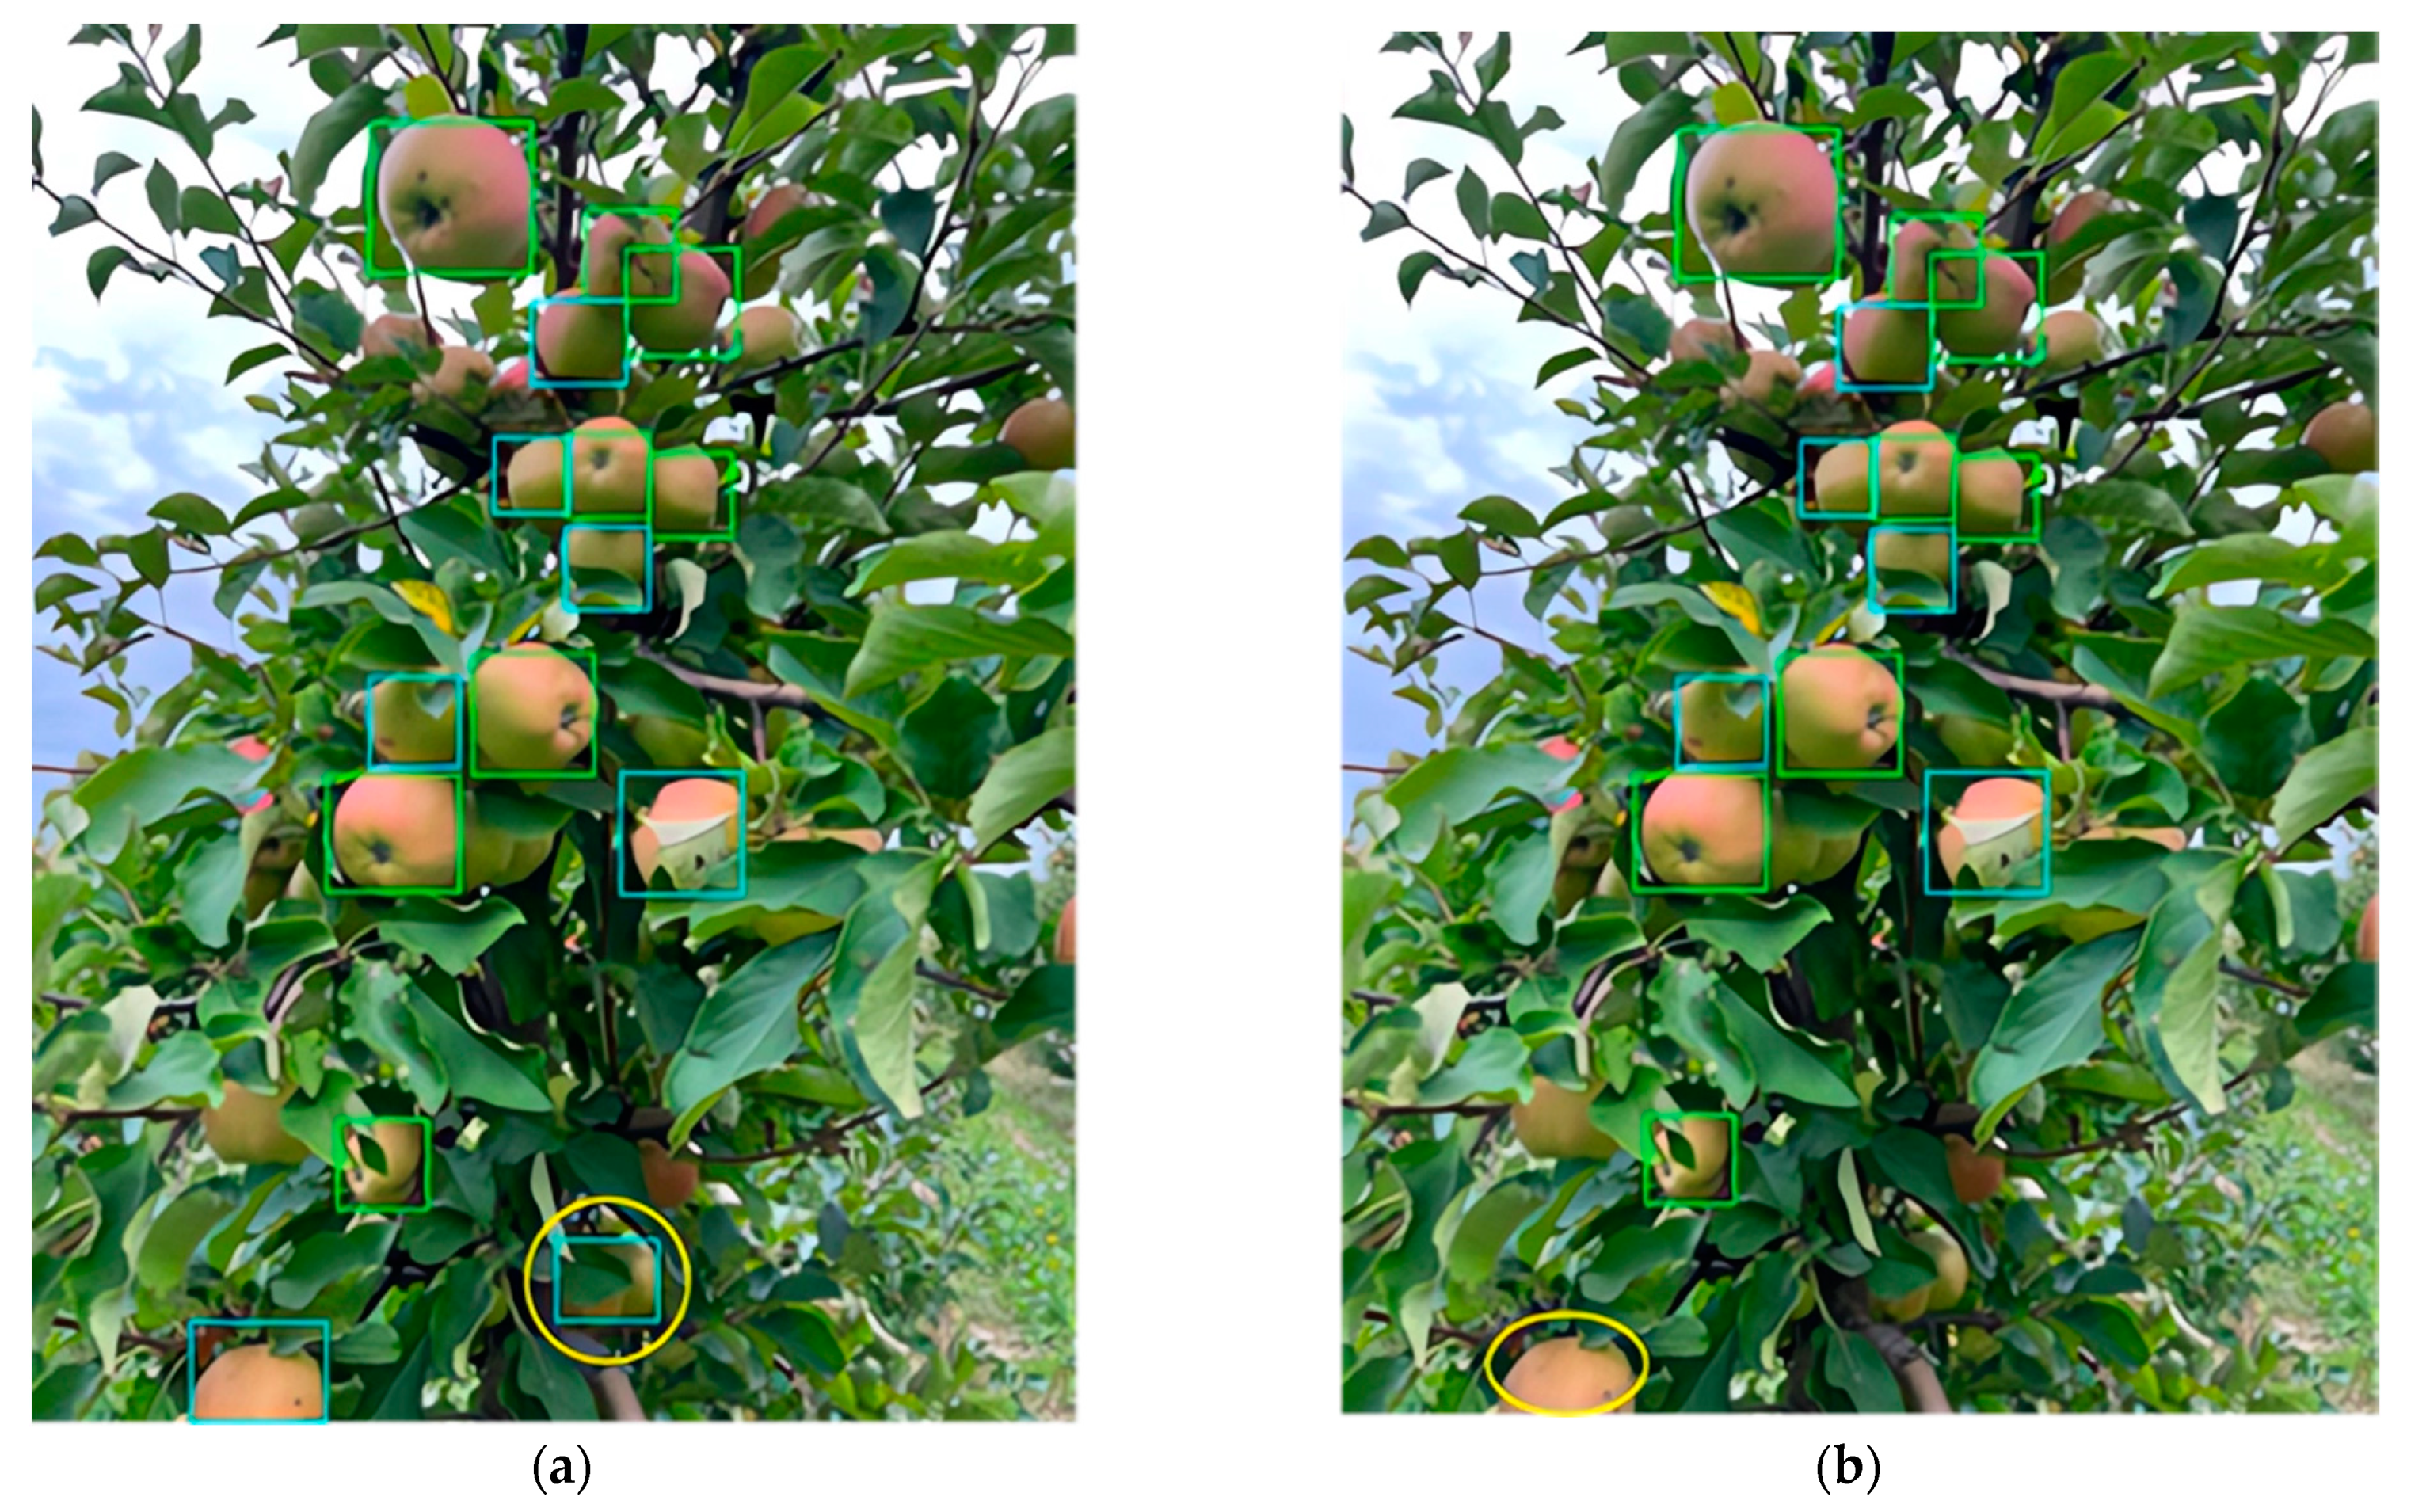
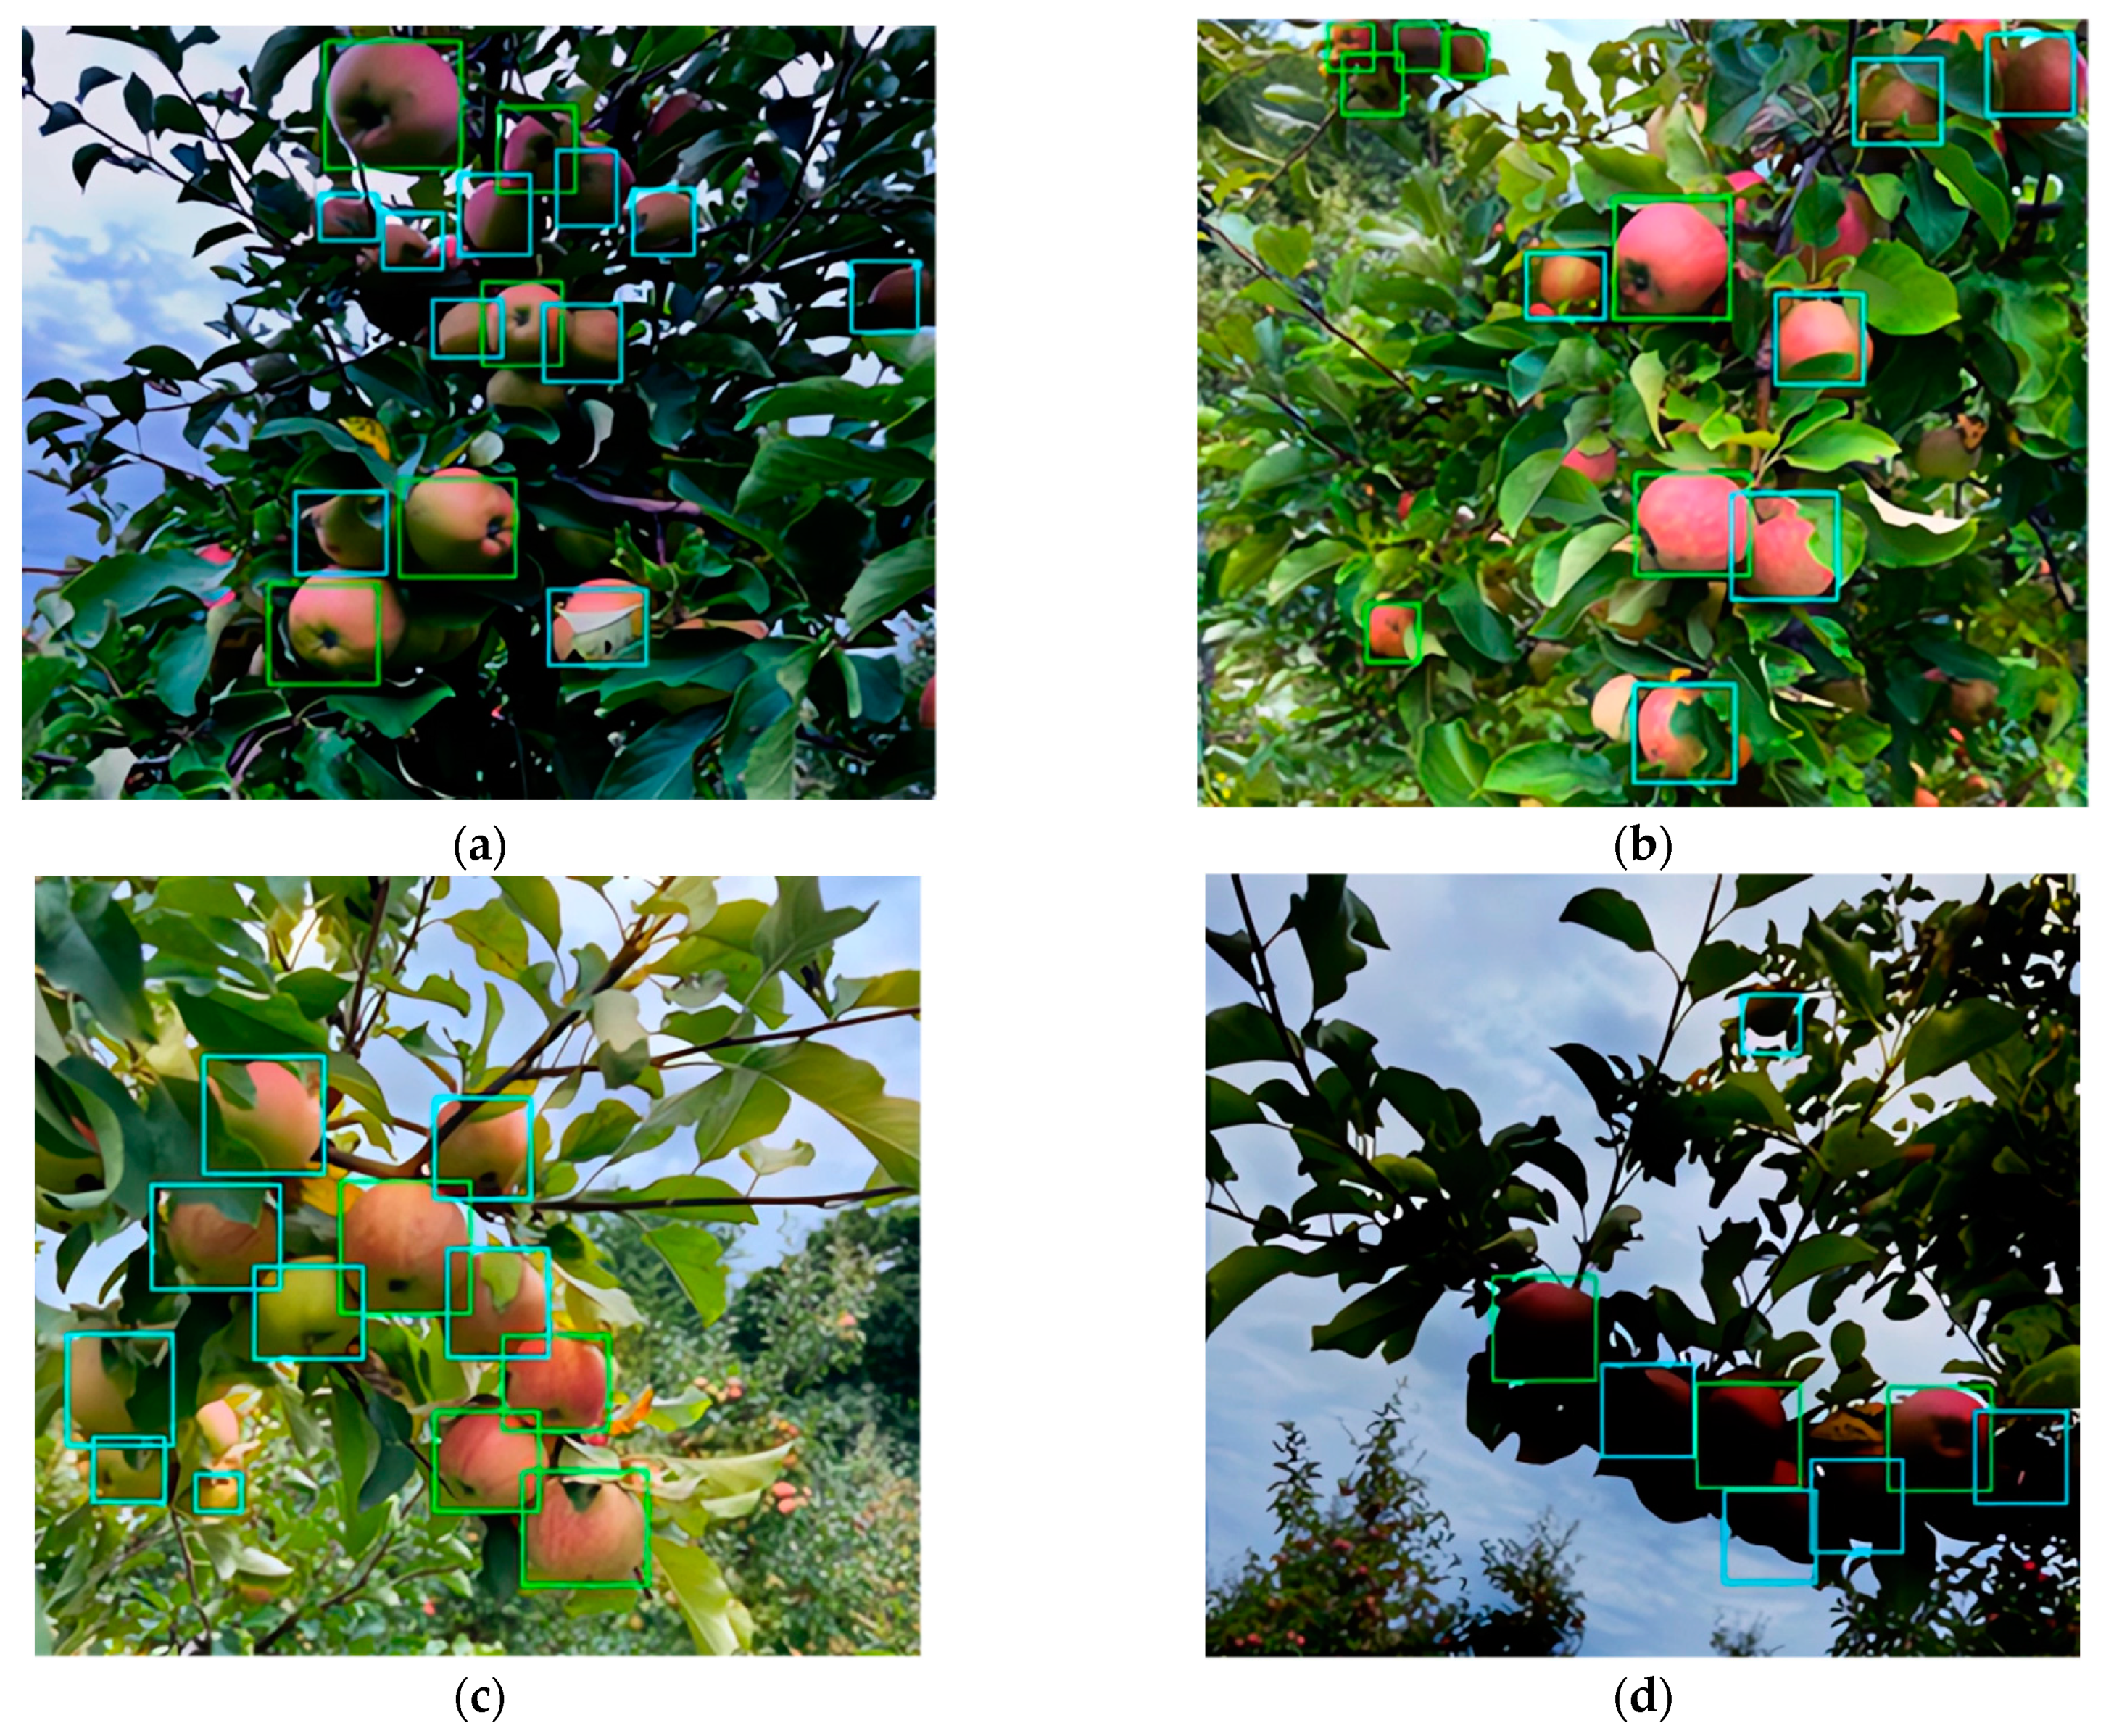
3.2. Test Results of the Created Detector
4. Discussion
5. Conclusions
Author Contributions
Funding
Institutional Review Board Statement
Informed Consent Statement
Data Availability Statement
Conflicts of Interest
Abbreviations
| AI | Artificial Intelligence |
| ATSS | Adaptive Training Sample Selection |
| CNN | Convolutional Neural Network |
| CSP | Cross Stage Partial |
| DCNN | Deep Convolutional Neural Network |
| DL | Deep Learning |
| FN | False Negative |
| FNR | False Negative Rate |
| FP | False Positive |
| FPR | False Positive Rate |
| FPN | Feature Pyramid Network |
| GNSS | Global Navigation Satellite System |
| GPS | Global Positioning System |
| IOU | Intersection Over Union |
| ISO | International Organization for Standardization |
| ML | Machine Learning |
| PSNR | Peak Signal-To-Noise Ratio |
| RGB | Red, Green, Blue |
| RTK | Real-Time Kinematic |
| SSIM | Structural Similarity Index Measure |
| TP | True Positive |
| TN | True Negative |
| UAV | Unmanned Aerial Vehicle |
| YOLO | You Only Look Once |
Appendix A
- Programmatic coordinate values for placement;
- Programmatic coordinate values for starting and ending points;
- Duration at the start and end points;
- Number of detected structural objects;
- Actual number of structural objects;
- Type and characteristics of the video camera forming the video stream.

Appendix B
Appendix C

| Layer Type | Number of Filters | Kernel Size | Stride | Activation Function | Special Parameters | Notes |
|---|---|---|---|---|---|---|
| Focus | 64 | 3 | 1 | Leaky ReLU | - | Initial layer to capture fine details |
| Conv | 128 | 3 | 2 | Leaky ReLU | Batch normalization: True | Standard convolutional layer |
| BottleneckCSP-2 | 128 | 1 for transition layers | - | Leaky ReLU | Number of bottlenecks: 4 | CSP with 2 bottleneck layers |
| BottleneckCSP | - | 1 for transition layers | - | Leaky ReLU | Number of bottlenecks: 4 | Number of bottlenecks: 4 in the first, followed by 2 |
| SELayer | - | - | - | - | Reduction ratio: 16 | Squeeze-and-excitation layer |
| SPP | 256 | - | - | Leaky ReLU | Pool sizes: 5,9,13 | Spatial pyramid pooling to aggregate features |
| Upsample | - | - | - | - | Scale factor: 2 | Upsampling to merge feature maps |
| Concat | - | - | - | - | Axis: -1 | Concatenate feature maps from different scales |
| Detect | - | - | - | - | Anchors: 3 sizes per scale | Detection head with anchors for bounding boxes |
References
- Wijerathna-Yapa, A.; Pathirana, R. Sustainable agro-food systems for addressing climate change and food security. Agriculture 2022, 12, 1554. [Google Scholar] [CrossRef]
- Lee, C.-C.; Zeng, M.; Luo, K. How does climate change affect food security? Evidence from China. Environ. Impact Assess. Rev. 2024, 104, 107324. [Google Scholar] [CrossRef]
- Kanike, U.K. Factors disrupting supply chain management in manufacturing industries. J. Supply Chain. Manag. Sci. 2023, 4, 1–24. [Google Scholar] [CrossRef]
- Buka, S.; Tkachuk, V.; Kondratiuk, V.; Tonkha, O.; Slobodyanyuk, N. Prospects for agribusiness in Ukraine over the next 5 years. Int. J. Environ. Stud. 2023, 80, 291–298. [Google Scholar] [CrossRef]
- Kalyta, O.; Barmak, O.; Radiuk, P.; Krak, I. Facial emotion recognition for photo and video surveillance based on machine learning and visual analytics. Appl. Sci. 2023, 13, 9890. [Google Scholar] [CrossRef]
- Medvedeva, Y.; Kucher, A.; Lipsa, J.; Hełdak, M. Human health risk assessment on the consumption of apples growing in urbanized areas: Case of Kharkiv, Ukraine. Int. J. Environ. Res. Public Health 2021, 18, 1504. [Google Scholar] [CrossRef] [PubMed]
- Outhwaite, C.L.; McCann, P.; Newbold, T. Agriculture and climate change are reshaping insect biodiversity worldwide. Nature 2022, 605, 97–102. [Google Scholar] [CrossRef]
- Xu, J.; Gu, B.; Tian, G. Review of agricultural IoT technology. Artif. Intell. Agric. 2022, 6, 10–22. [Google Scholar] [CrossRef]
- Reddy Maddikunta, P.K.; Hakak, S.; Alazab, M.; Bhattacharya, S.; Gadekallu, T.R.; Khan, W.Z.; Pham, Q.-V. Unmanned aerial vehicles in smart agriculture: Applications, requirements, and challenges. IEEE Sens. J. 2021, 21, 17608–17619. [Google Scholar] [CrossRef]
- Radiuk, P.; Barmak, O.; Krak, I. An approach to early diagnosis of pneumonia on individual radiographs based on the CNN information technology. Open Bioinform. J. 2021, 14, 92–105. [Google Scholar] [CrossRef]
- Sardar, P.; Ema, R.R.; Kabir, S.S.; Adnan, M.N.; Galib, S.M. Severity stage identification and pest detection of tomato disease using deep learning. Int. J. Comput. 2023, 191–201. [Google Scholar] [CrossRef]
- Villacrés, J.; Viscaino, M.; Delpiano, J.; Vougioukas, S.; Auat Cheein, F. Apple orchard production estimation using deep learning strategies: A comparison of tracking-by-detection algorithms. Comput. Electron. Agric. 2023, 204, 107513. [Google Scholar] [CrossRef]
- Tsouros, D.C.; Triantafyllou, A.; Bibi, S.; Sarigannidis, P.G. Data acquisition and analysis methods in UAV-based applications for precision agriculture. In Proceedings of the 2019 15th International Conference on Distributed Computing in Sensor Systems (DCOSS), Santorini, Greece, 29–31 May 2019. [Google Scholar] [CrossRef]
- Popescu, D.; Stoican, F.; Stamatescu, G.; Ichim, L.; Dragana, C. Advanced UAV–WSN system for intelligent monitoring in precision agriculture. Sensors 2020, 20, 817. [Google Scholar] [CrossRef]
- Degieter, M.; De Steur, H.; Tran, D.; Gellynck, X.; Schouteten, J.J. Farmers’ acceptance of robotics and unmanned aerial vehicles: A systematic review. Agron. J. 2023, 115, 2159–2173. [Google Scholar] [CrossRef]
- Sachenko, A.; Kochan, V.; Turchenko, V. Instrumentation for gathering data [DAQ Systems]. IEEE Instrum. Meas. Mag. 2003, 6, 34–40. [Google Scholar] [CrossRef]
- Zhang, C.; Valente, J.; Kooistra, L.; Guo, L.; Wang, W. Orchard management with small unmanned aerial vehicles: A survey of sensing and analysis approaches. Precis. Agric. 2021, 22, 2007–2052. [Google Scholar] [CrossRef]
- Rizzo, M.; Marcuzzo, M.; Zangari, A.; Gasparetto, A.; Albarelli, A. Fruit ripeness classification: A survey. Artif. Intell. Agric. 2023, 7, 44–57. [Google Scholar] [CrossRef]
- Naranjo-Torres, J.; Mora, M.; Hernández-García, R.; Barrientos, R.J.; Fredes, C.; Valenzuela, A. A review of convolutional neural network applied to fruit image processing. Appl. Sci. 2020, 10, 3443. [Google Scholar] [CrossRef]
- Sun, Y.; Fesenko, H.; Kharchenko, V.; Zhong, L.; Kliushnikov, I.; Illiashenko, O.; Morozova, O.; Sachenko, A. UAV and IoT-based systems for the monitoring of industrial facilities using digital twins: Methodology, reliability models, and application. Sensors 2022, 22, 6444. [Google Scholar] [CrossRef] [PubMed]
- Awais, M.; Li, W.; Cheema, M.J.M.; Zaman, Q.U.; Shaheen, A.; Aslam, B.; Zhu, W.; Ajmal, M.; Faheem, M.; Hussain, S.; et al. UAV-based remote sensing in plant stress imagine using high-resolution thermal sensor for digital agriculture practices: A meta-review. Int. J. Environ. Sci. Technol. 2023, 20, 1135–1152. [Google Scholar] [CrossRef]
- Lambertini, A.; Mandanici, E.; Tini, M.A.; Vittuari, L. Technical challenges for multi-temporal and multi-sensor image processing surveyed by UAV for mapping and monitoring in precision agriculture. Remote Sens. 2022, 14, 4954. [Google Scholar] [CrossRef]
- Skorobogatov, G.; Barrado, C.; Salamí, E. Multiple UAV systems: A survey. Un. Sys. 2020, 8, 149–169. [Google Scholar] [CrossRef]
- Shi, K.; Zhang, X.; Xia, S. Multiple swarm fruit fly optimization algorithm based path planning method for multi-UAVs. Appl. Sci. 2020, 10, 2822. [Google Scholar] [CrossRef]
- Khan, S.; Tufail, M.; Khan, M.T.; Khan, Z.A.; Iqbal, J.; Wasim, A. A novel framework for multiple ground target detection, recognition and inspection in precision agriculture applications using a UAV. Un. Sys. 2022, 10, 45–56. [Google Scholar] [CrossRef]
- Su, J.; Zhu, X.; Li, S.; Chen, W.-H. AI meets UAVs: A survey on AI empowered UAV perception systems for precision agriculture. Neurocomputing 2023, 518, 242–270. [Google Scholar] [CrossRef]
- Li, H.; Xie, X.; Du, P.; Xi, J. Cooperative object recognition method of multi-UAVs based on decision fusion. In Proceedings of the 2021 33rd Chinese Control and Decision Conference (CCDC), Kunming, China, 22–24 May 2021. [Google Scholar] [CrossRef]
- Chen, R.; Zhang, C.; Xu, B.; Zhu, Y.; Zhao, F.; Han, S.; Yang, G.; Yang, H. Predicting individual apple tree yield using UAV multi-source remote sensing data and ensemble learning. Comput. Electron. Agric. 2022, 201, 107275. [Google Scholar] [CrossRef]
- Bate, J.R.R.T. Applying Deep Learning to Estimate Fruit Yield in Agriculture 4.0 Systems. Master’s Thesis, NOVA University Lisbon, Lisbon, Portugal, 2022. [Google Scholar]
- Wang, C.; Liu, S.; Wang, Y.; Xiong, J.; Zhang, Z.; Zhao, B.; Luo, L.; Lin, G.; He, P. Application of convolutional neural network-based detection methods in fresh fruit production: A comprehensive review. Front. Plant Sci. 2022, 13, 868745. [Google Scholar] [CrossRef]
- Mao, D.; Sun, H.; Li, X.; Yu, X.; Wu, J.; Zhang, Q. Real-time fruit detection using deep neural networks on CPU (RTFD): An edge AI application. Comput. Electron. Agric. 2023, 204, 107517. [Google Scholar] [CrossRef]
- Bodyanskiy, Y.; Deineko, A.; Skorik, V.; Brodetskyi, F. Deep neural network with adaptive parametric rectified linear units and its fast learning. Int. J. Comput. 2022, 21, 11–18. [Google Scholar] [CrossRef]
- Tu, S.; Pang, J.; Liu, H.; Zhuang, N.; Chen, Y.; Zheng, C.; Wan, H.; Xue, Y. Passion fruit detection and counting based on multiple scale Faster R-CNN using RGB-D Images. Precis. Agric. 2020, 21, 1072–1091. [Google Scholar] [CrossRef]
- Mai, X.; Zhang, H.; Jia, X.; Meng, M.Q.-H. Faster R-CNN with classifier fusion for automatic detection of small fruits. IEEE Trans. Autom. Sci. Eng. 2020, 17, 1555–1569. [Google Scholar] [CrossRef]
- Chu, P.; Li, Z.; Lammers, K.; Lu, R.; Liu, X. Deep learning-based apple detection using a suppression Mask R-CNN. Pattern Recognit. Lett. 2021, 147, 206–211. [Google Scholar] [CrossRef]
- Biffi, L.J.; Mitishita, E.; Liesenberg, V.; dos Santos, A.A.; Gonçalves, D.N.; Estrabis, N.V.; de Silva, J.A.; Osco, L.P.; Ramos, A.P.M.; Centeno, J.A.S.; et al. ATSS deep learning-based approach to detect apple fruits. Remote Sens. 2021, 13, 54. [Google Scholar] [CrossRef]
- Sun, Y.; Zhang, D.; Guo, X.; Yang, H. Lightweight algorithm for apple detection based on an improved YOLOv5 model. Plants 2023, 12, 3032. [Google Scholar] [CrossRef]
- Zheng, Z.; Xiong, J.; Wang, X.; Li, Z.; Huang, Q.; Chen, H.; Han, Y. An efficient online citrus counting system for large-scale unstructured orchards based on the unmanned aerial vehicle. J. Field Robot. 2023, 40, 552–573. [Google Scholar] [CrossRef]
- Welch, G.F. Kalman filter. In Computer Vision: A Reference Guide; Springer International Publishing: Cham, Switzerland, 2020; pp. 1–3. [Google Scholar] [CrossRef]
- Gabrovšek, B.; Novak, T.; Povh, J.; Rupnik Poklukar, D.; Žerovnik, J. Multiple Hungarian method for K-assignment problem. Mathematics 2020, 8, 2050. [Google Scholar] [CrossRef]
- Ghorbani, H. Mahalanobis distance and its application for detecting multivariate outliers. Facta Univ. Ser. Math. Inform. 2019, 34, 583–595. [Google Scholar] [CrossRef]
- Technical Committee: ISO/TC 42. ISO 12232:2019; Photography—Digital still Cameras—Determination of Exposure Index, ISO Speed Ratings, Standard Output Sensitivity, and Recommended Exposure Index. International Organization for Standardization: Geneva, Switzerland, 2019.
- Grandini, M.; Bagli, E.; Visani, G. Metrics for multi-class classification: An overview. arXiv 2020, arXiv:2008.05756. [Google Scholar] [CrossRef]
- Dempsey, P. Reviews consumer technology: The teardown: Apple IPhone Pro 13 smartphone. Eng. Technol. 2021, 16, 68–69. [Google Scholar] [CrossRef]
- Langer, P.; Fleisch, E.; Barata, F. CLAID: Closing the loop on AI & data collection—A cross-platform transparent computing middleware framework for smart edge-cloud and digital biomarker applications. arXiv 2023, arXiv:2310.05643. [Google Scholar] [CrossRef]
- Mishra, A. Amazon Sagemaker. In Machine Learning in the AWS Cloud: Add Intelligence to Applications with Amazon Sagemaker and Amazon Rekognition; John Wiley & Sons: Hoboken, NJ, USA, 2019; pp. 353–385. ISBN 978-1-119-55671-8. [Google Scholar]
- Paszke, A.; Gross, S.; Massa, F.; Lerer, A.; Bradbury, J.; Chanan, G.; Killeen, T.; Lin, Z.; Gimelshein, N.; Antiga, L.; et al. PyTorch: An imperative style, high-performance deep learning library. In Proceedings of the Advances in Neural Information Processing Systems (NeurIPS 2019), Vancouver, BC, Canada, 8–14 December 2019; Wallach, H., Larochelle, H., Beygelzimer, A., Alché-Buc, F., Fox, E., Garnett, R., Eds.; Curran Associates, Inc.: Red Hook, NY, USA; 2019; Volume 32, pp. 8024–8035. [Google Scholar]
- Al Ghadani, A.K.A.; Mateen, W.; Ramaswamy, R.G. Tensor-based CUDA optimization for ANN inferencing using parallel acceleration on embedded GPU. In Artificial Intelligence Applications and Innovations; Maglogiannis, I., Iliadis, L., Pimenidis, E., Eds.; Springer International Publishing: Cham, Switzerland, 2020; Volume 583, pp. 291–302. [Google Scholar]
- Gollapudi, S. OpenCV with Python. In Learn Computer Vision Using OpenCV: With Deep Learning CNNs and RNNs; Gollapudi, S., Ed.; Apress: Berkeley, CA, USA, 2019; pp. 31–50. [Google Scholar] [CrossRef]
- Horé, A.; Ziou, D. Image quality metrics: PSNR vs. SSIM. In Proceedings of the 2010 20th International Conference on Pattern Recognition (ICPR-2010), Istanbul, Turkey, 23–26 August 2010. [Google Scholar] [CrossRef]
- Melnychenko, O.; Savenko, O.; Radiuk, P. Apple detection with occlusions using modified YOLOv5-v1. In Proceedings of the 12th IEEE International Conference on Intelligent Data Acquisition and Advanced Computing Systems: Technology and Applications (IDAACS’2023), Dortmund, Germany, 7–9 September 2023. [Google Scholar] [CrossRef]


| UAV Position | Flight Height, Meters | Observation Angle, Degrees | ISO Setting of the Camera |
|---|---|---|---|
| Bottom | 1.2 | 25 upward | (1) 400 on a sunny day; (2) 800 on a cloudy day; (3) 1600 during late evening |
| Middle | 2.2 | 0 | |
| Top | 3.2 | 20 downward |
| Category | Equipment | Details | Relevance to Mission |
|---|---|---|---|
| Base Station | D-RTK 2 High Precision GNSS Mobile Station |
|
|
| TK Modules | Multi-layer GNSS antennas, Radio modems |
|
|
| Power Supply | External batteries for UAVs |
|
|
| UAV Group | DJI Phantom 4 RTK UAVs |
|
|
| Data | Sunny | Cloudy | Total |
|---|---|---|---|
| Number of images | 100 | 100 | 200 |
| Images with clearly visible fruits | 482 | 525 | 1007 |
| Images with mixed occlusion | 766 | 563 | 1329 |
| Data | Number of Objects | Precision (%) | Recall (%) | F1-Score (%) | mAP (%) |
|---|---|---|---|---|---|
| The amount that can be captured | 1007 | 85.5 | 94.3 | 89.7 | 89.2 |
| The amount that cannot be captured | 1329 | 82.6 | 89.3 | 85.8 | 84.9 |
| Total | 2336 | 83.8 | 91.5 | 87.5 | 86.8 |
| # | Weather Conditions | Detected and Counted (Number) | Detected and Not Counted (Number) | Detected by Many Cameras, but Counted Once (Number) | Total (Number) |
|---|---|---|---|---|---|
| 1 | Sunny (sun at the zenith) | 147,382 | 72,143 | 5743 | ~160,000 |
| 2 | Cloudy | 145,223 | 69,944 | 6611 | ~160,000 |
| 3 | Sunny (strong shade) | 132,304 | 69,336 | 8442 | ~160,000 |
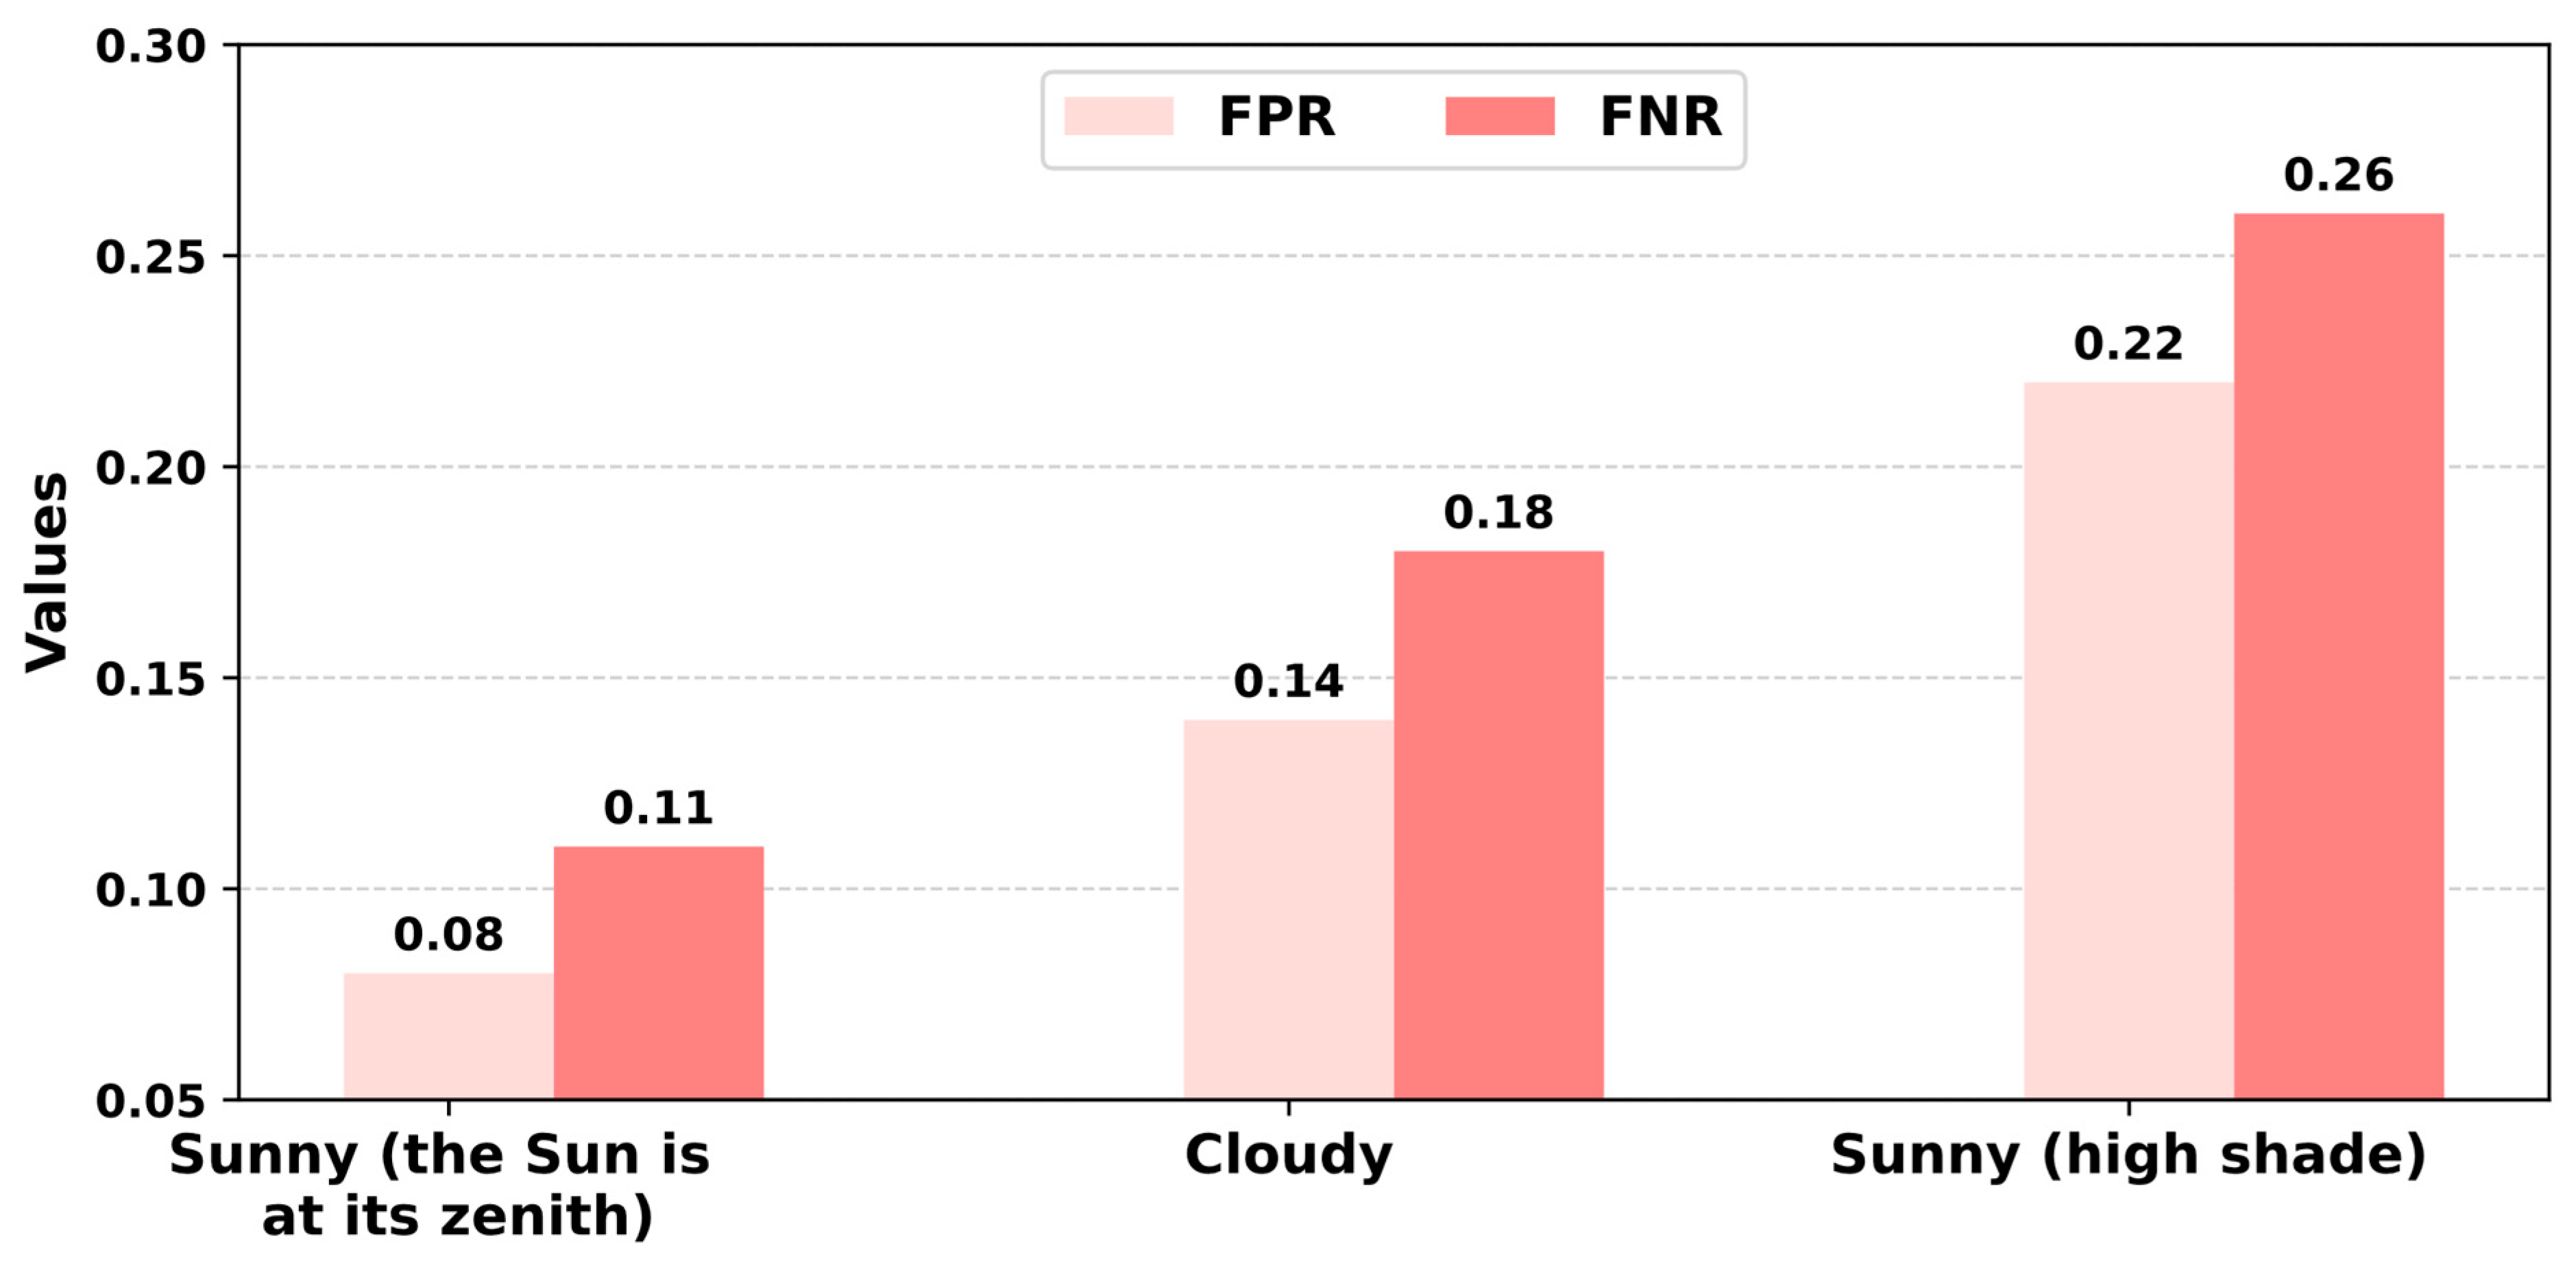
| # | Weather Conditions | Precision (%) | Recall (%) | F1-Score (%) | FPR (%) | FNR (%) |
|---|---|---|---|---|---|---|
| 1 | Sun (sun at the zenith) | 92.1 | 89.3 | 90.5 | 8 | 11.5 |
| 2 | Cloudy | 86.1 | 82.1 | 84 | 14.7 | 18.3 |
| 3 | Sun (strong shade) | 78.1 | 74.2 | 72.4 | 22.2 | 26.2 |
| The Index of Combined Image (#) | SSIM | PSNR | The Index of Combined Image (#) | SSIM | PSNR |
|---|---|---|---|---|---|
| 01 | 0.90 | 35.2 | 07 | 0.86 | 31.4 |
| 02 | 0.45 | 27.2 | 08 | 0.47 | 27.9 |
| 03 | 0.72 | 37.5 | 09 | 0.90 | 30.1 |
| 04 | 0.85 | 29.1 | 10 | 0.83 | 31.5 |
| 05 | 0.87 | 36.9 | 11 | 0.52 | 28.9 |
| 06 | 0.91 | 39.1 | 12 | 0.86 | 30.4 |
| Object Detection Models | mAP (%) | Average Detection Speed (s/pic) | Number of Parameters | Model Size (MB) |
|---|---|---|---|---|
| Mai et al. [34] | 71.8 | 0.053 | 6.15 × 10⁷ | 235.00 |
| Chu et al. [35] | 82.0 | 0.017 | 6.39 × 10⁷ | 244.00 |
| Biffi et al. [36] | 80.0 | 0.038 | 3.83 × 10⁶ | 15.00 |
| Sun et al. [37] | 81.7 | 0.013 | 7.25 × 10⁶ | 14.00 |
| The proposed YOLOv5-v1 | 86.8 | 0.015 | 6.52 × 10⁶ | 12.70 |
Disclaimer/Publisher’s Note: The statements, opinions and data contained in all publications are solely those of the individual author(s) and contributor(s) and not of MDPI and/or the editor(s). MDPI and/or the editor(s) disclaim responsibility for any injury to people or property resulting from any ideas, methods, instructions or products referred to in the content. |
© 2024 by the authors. Licensee MDPI, Basel, Switzerland. This article is an open access article distributed under the terms and conditions of the Creative Commons Attribution (CC BY) license (https://creativecommons.org/licenses/by/4.0/).
Share and Cite
Melnychenko, O.; Scislo, L.; Savenko, O.; Sachenko, A.; Radiuk, P. Intelligent Integrated System for Fruit Detection Using Multi-UAV Imaging and Deep Learning. Sensors 2024, 24, 1913. https://doi.org/10.3390/s24061913
Melnychenko O, Scislo L, Savenko O, Sachenko A, Radiuk P. Intelligent Integrated System for Fruit Detection Using Multi-UAV Imaging and Deep Learning. Sensors. 2024; 24(6):1913. https://doi.org/10.3390/s24061913
Chicago/Turabian StyleMelnychenko, Oleksandr, Lukasz Scislo, Oleg Savenko, Anatoliy Sachenko, and Pavlo Radiuk. 2024. "Intelligent Integrated System for Fruit Detection Using Multi-UAV Imaging and Deep Learning" Sensors 24, no. 6: 1913. https://doi.org/10.3390/s24061913
APA StyleMelnychenko, O., Scislo, L., Savenko, O., Sachenko, A., & Radiuk, P. (2024). Intelligent Integrated System for Fruit Detection Using Multi-UAV Imaging and Deep Learning. Sensors, 24(6), 1913. https://doi.org/10.3390/s24061913