
Investigation of Using Hyperspectral Vegetation Indices to Assess Brassica Downy Mildew


Abstract
1. Introduction
2. Materials and Methods
2.1. Experimental Design
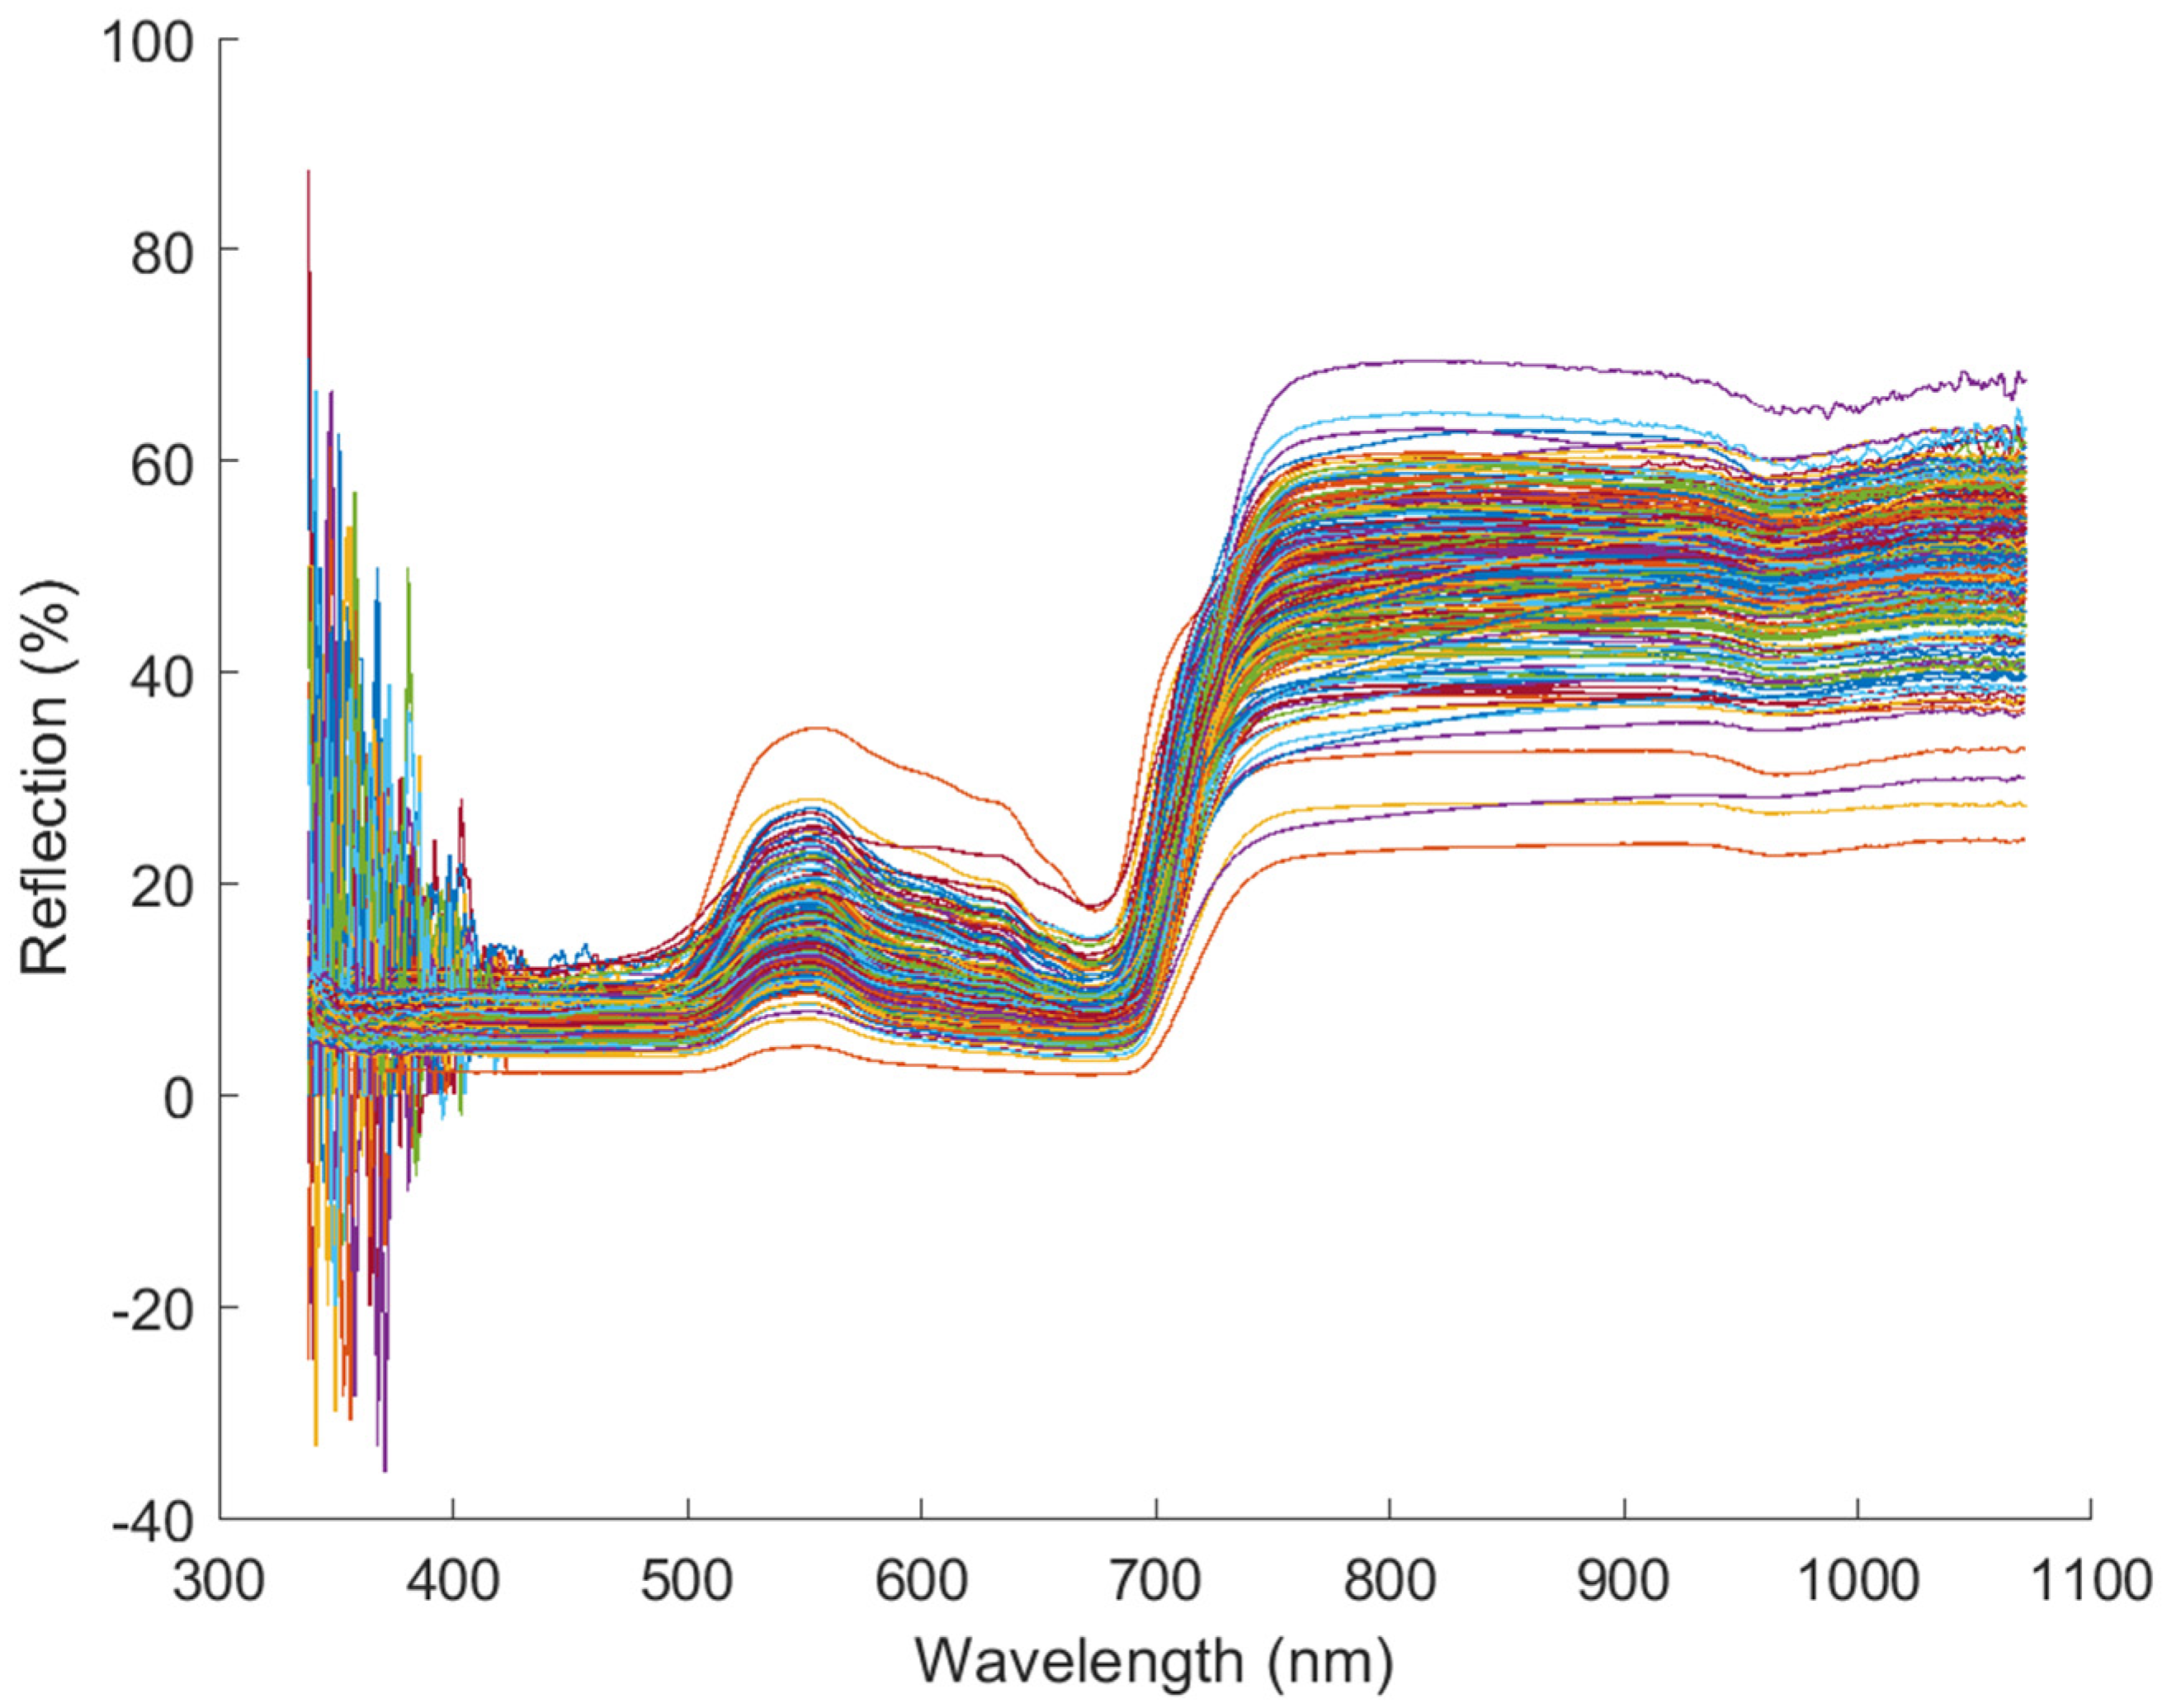
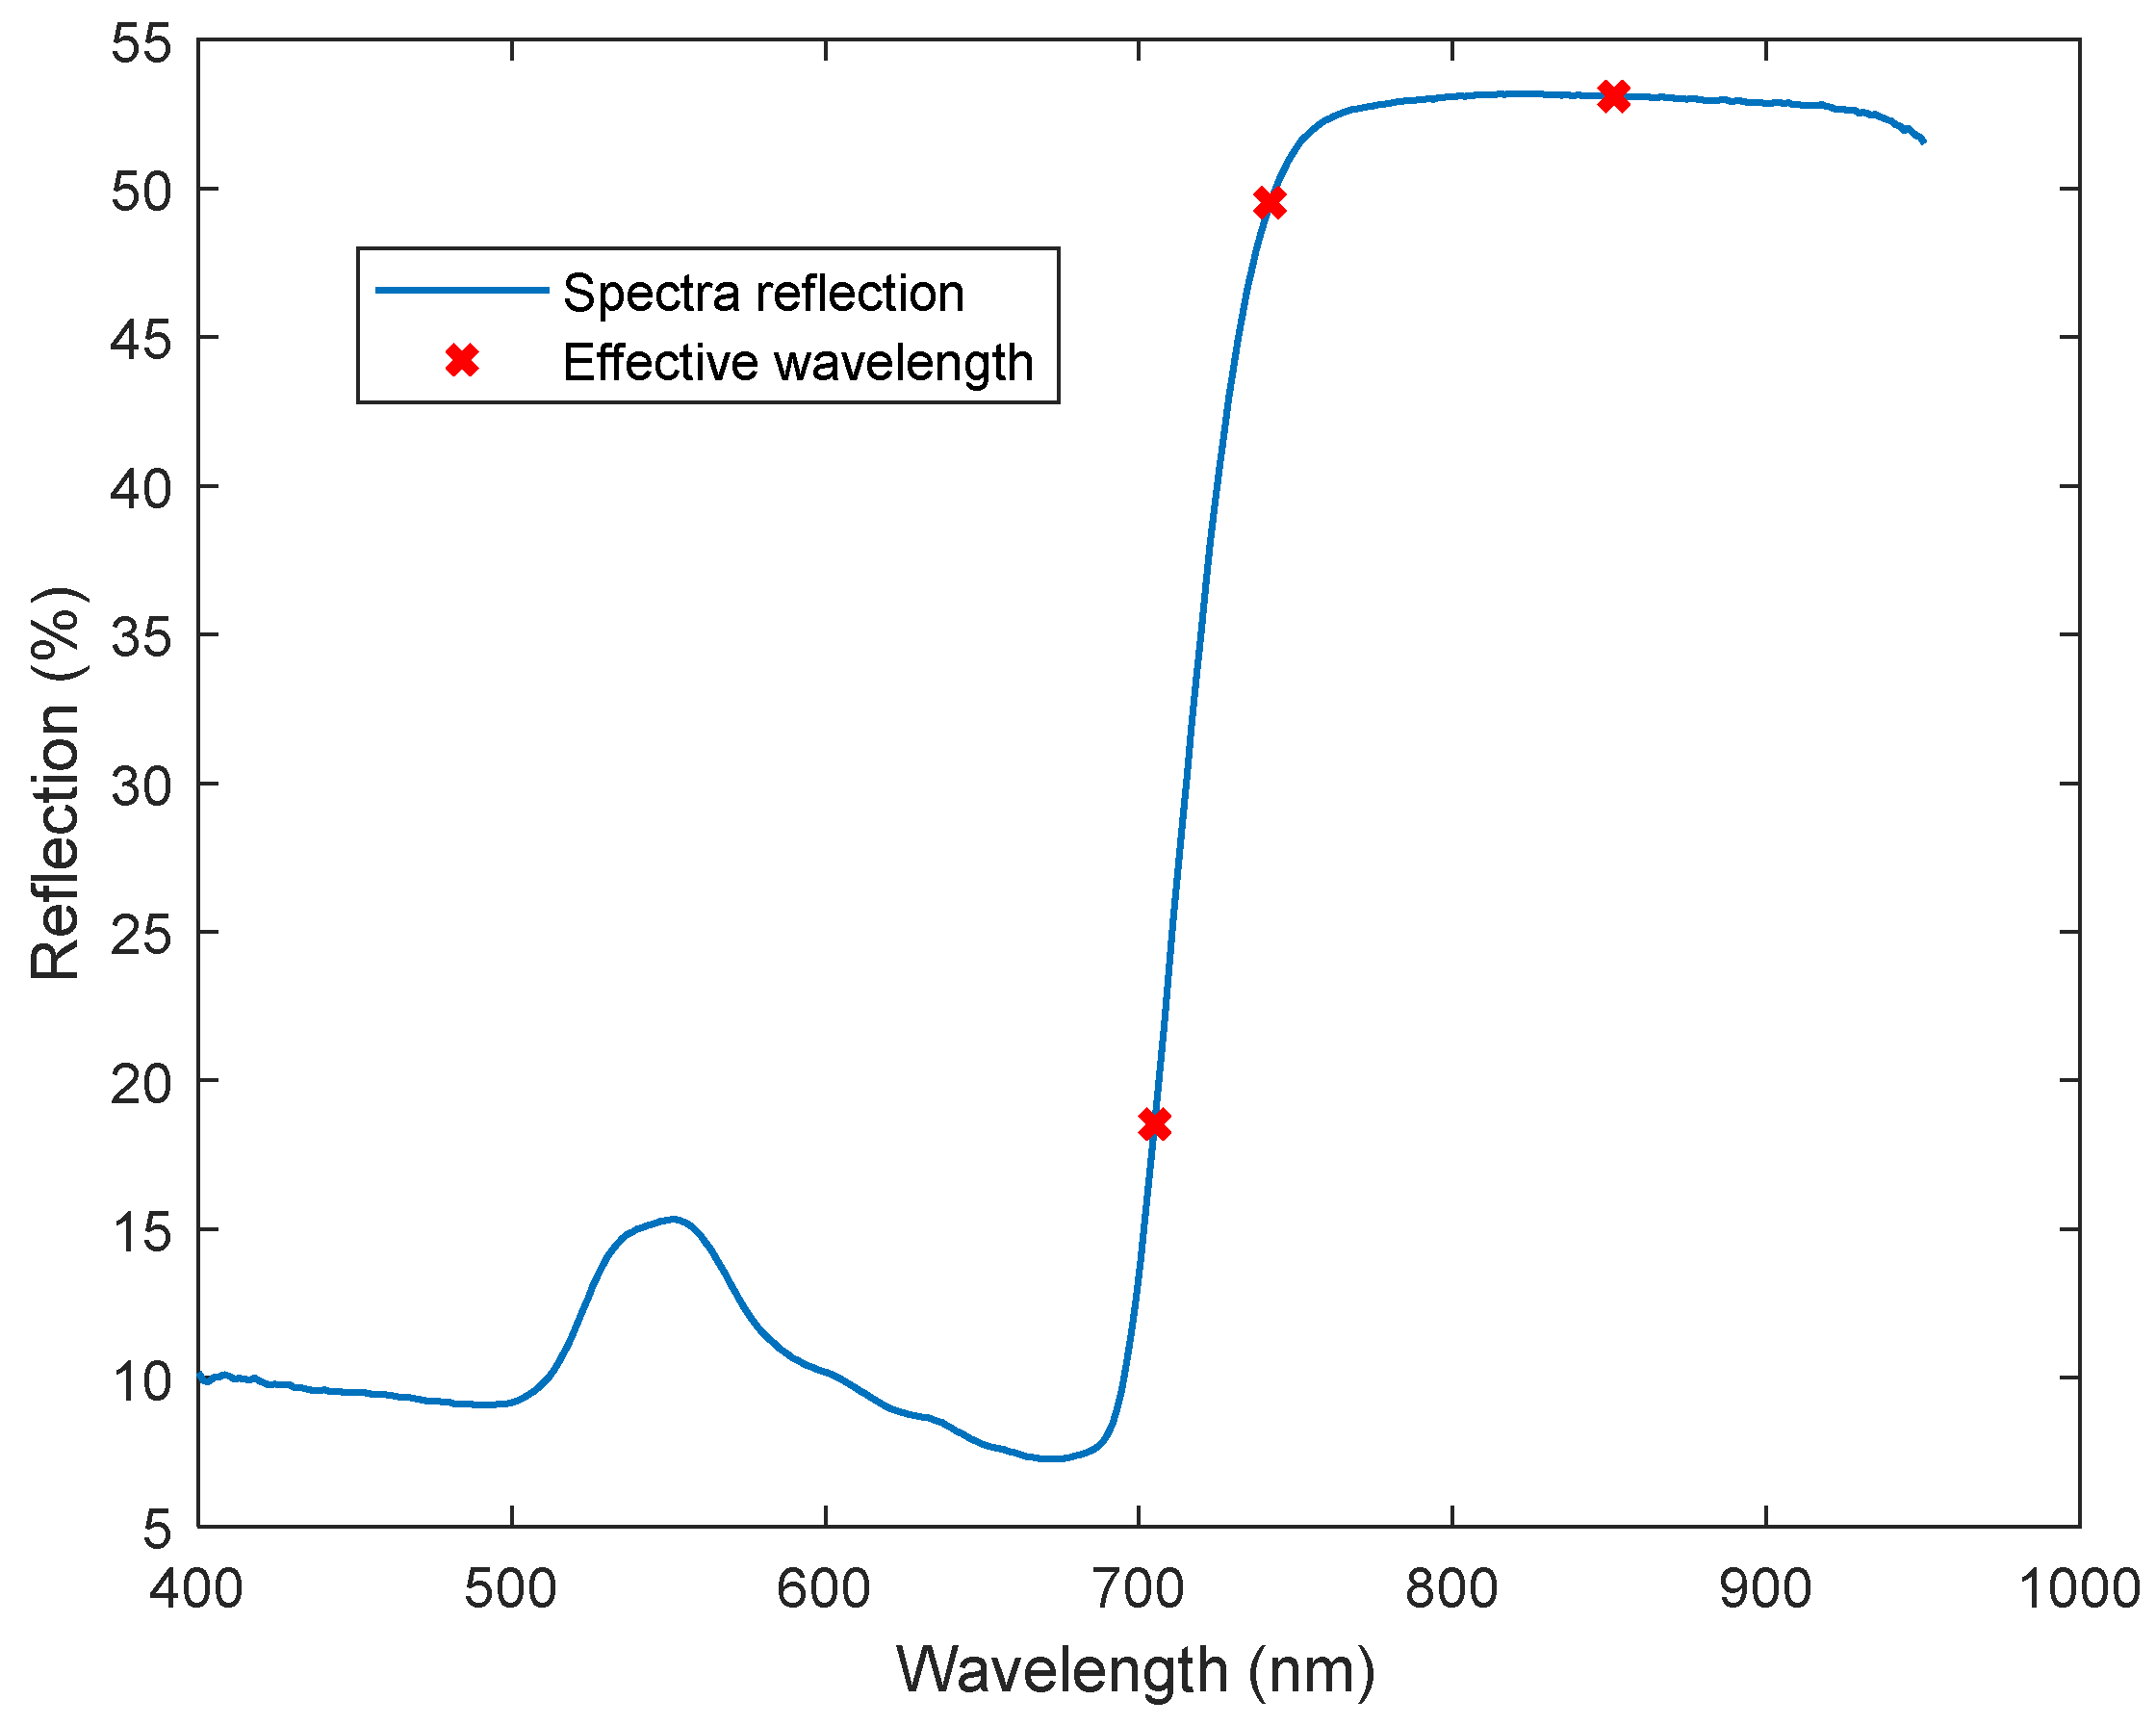
2.2. Leaf Spectra Acquisition
2.3. Spectral Data Processing
2.4. Vegetation Indices
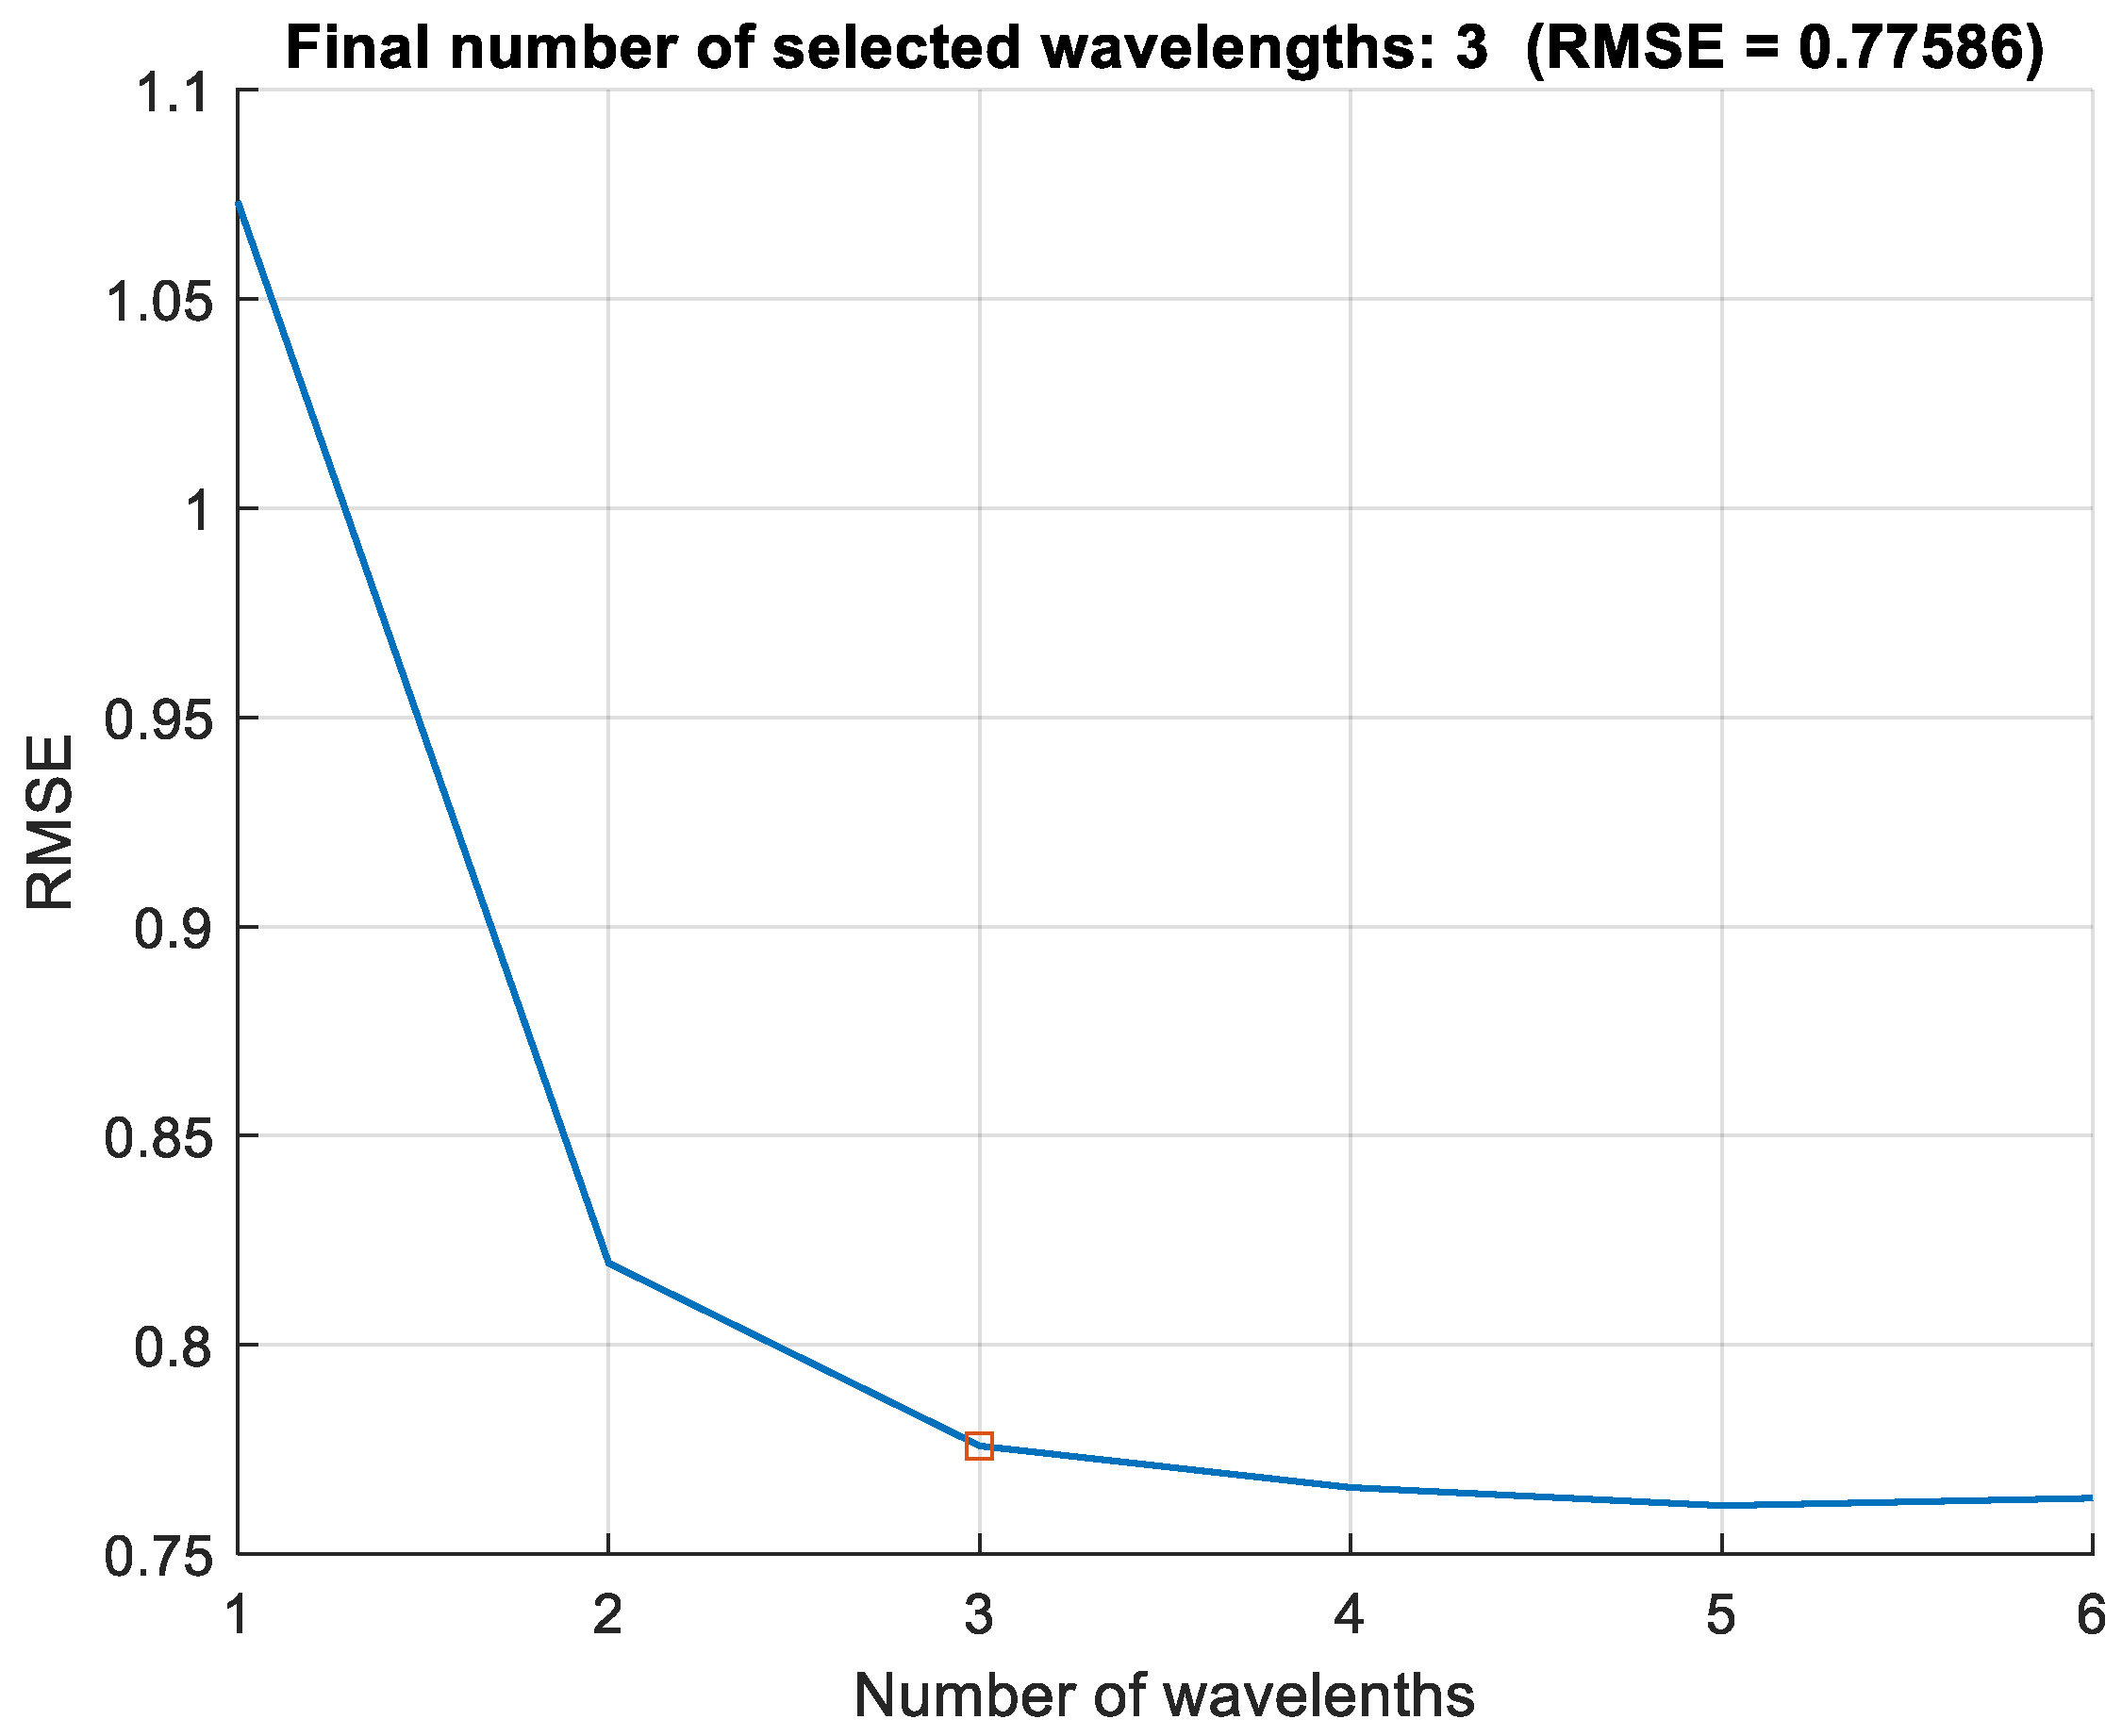
2.4.1. VI selection
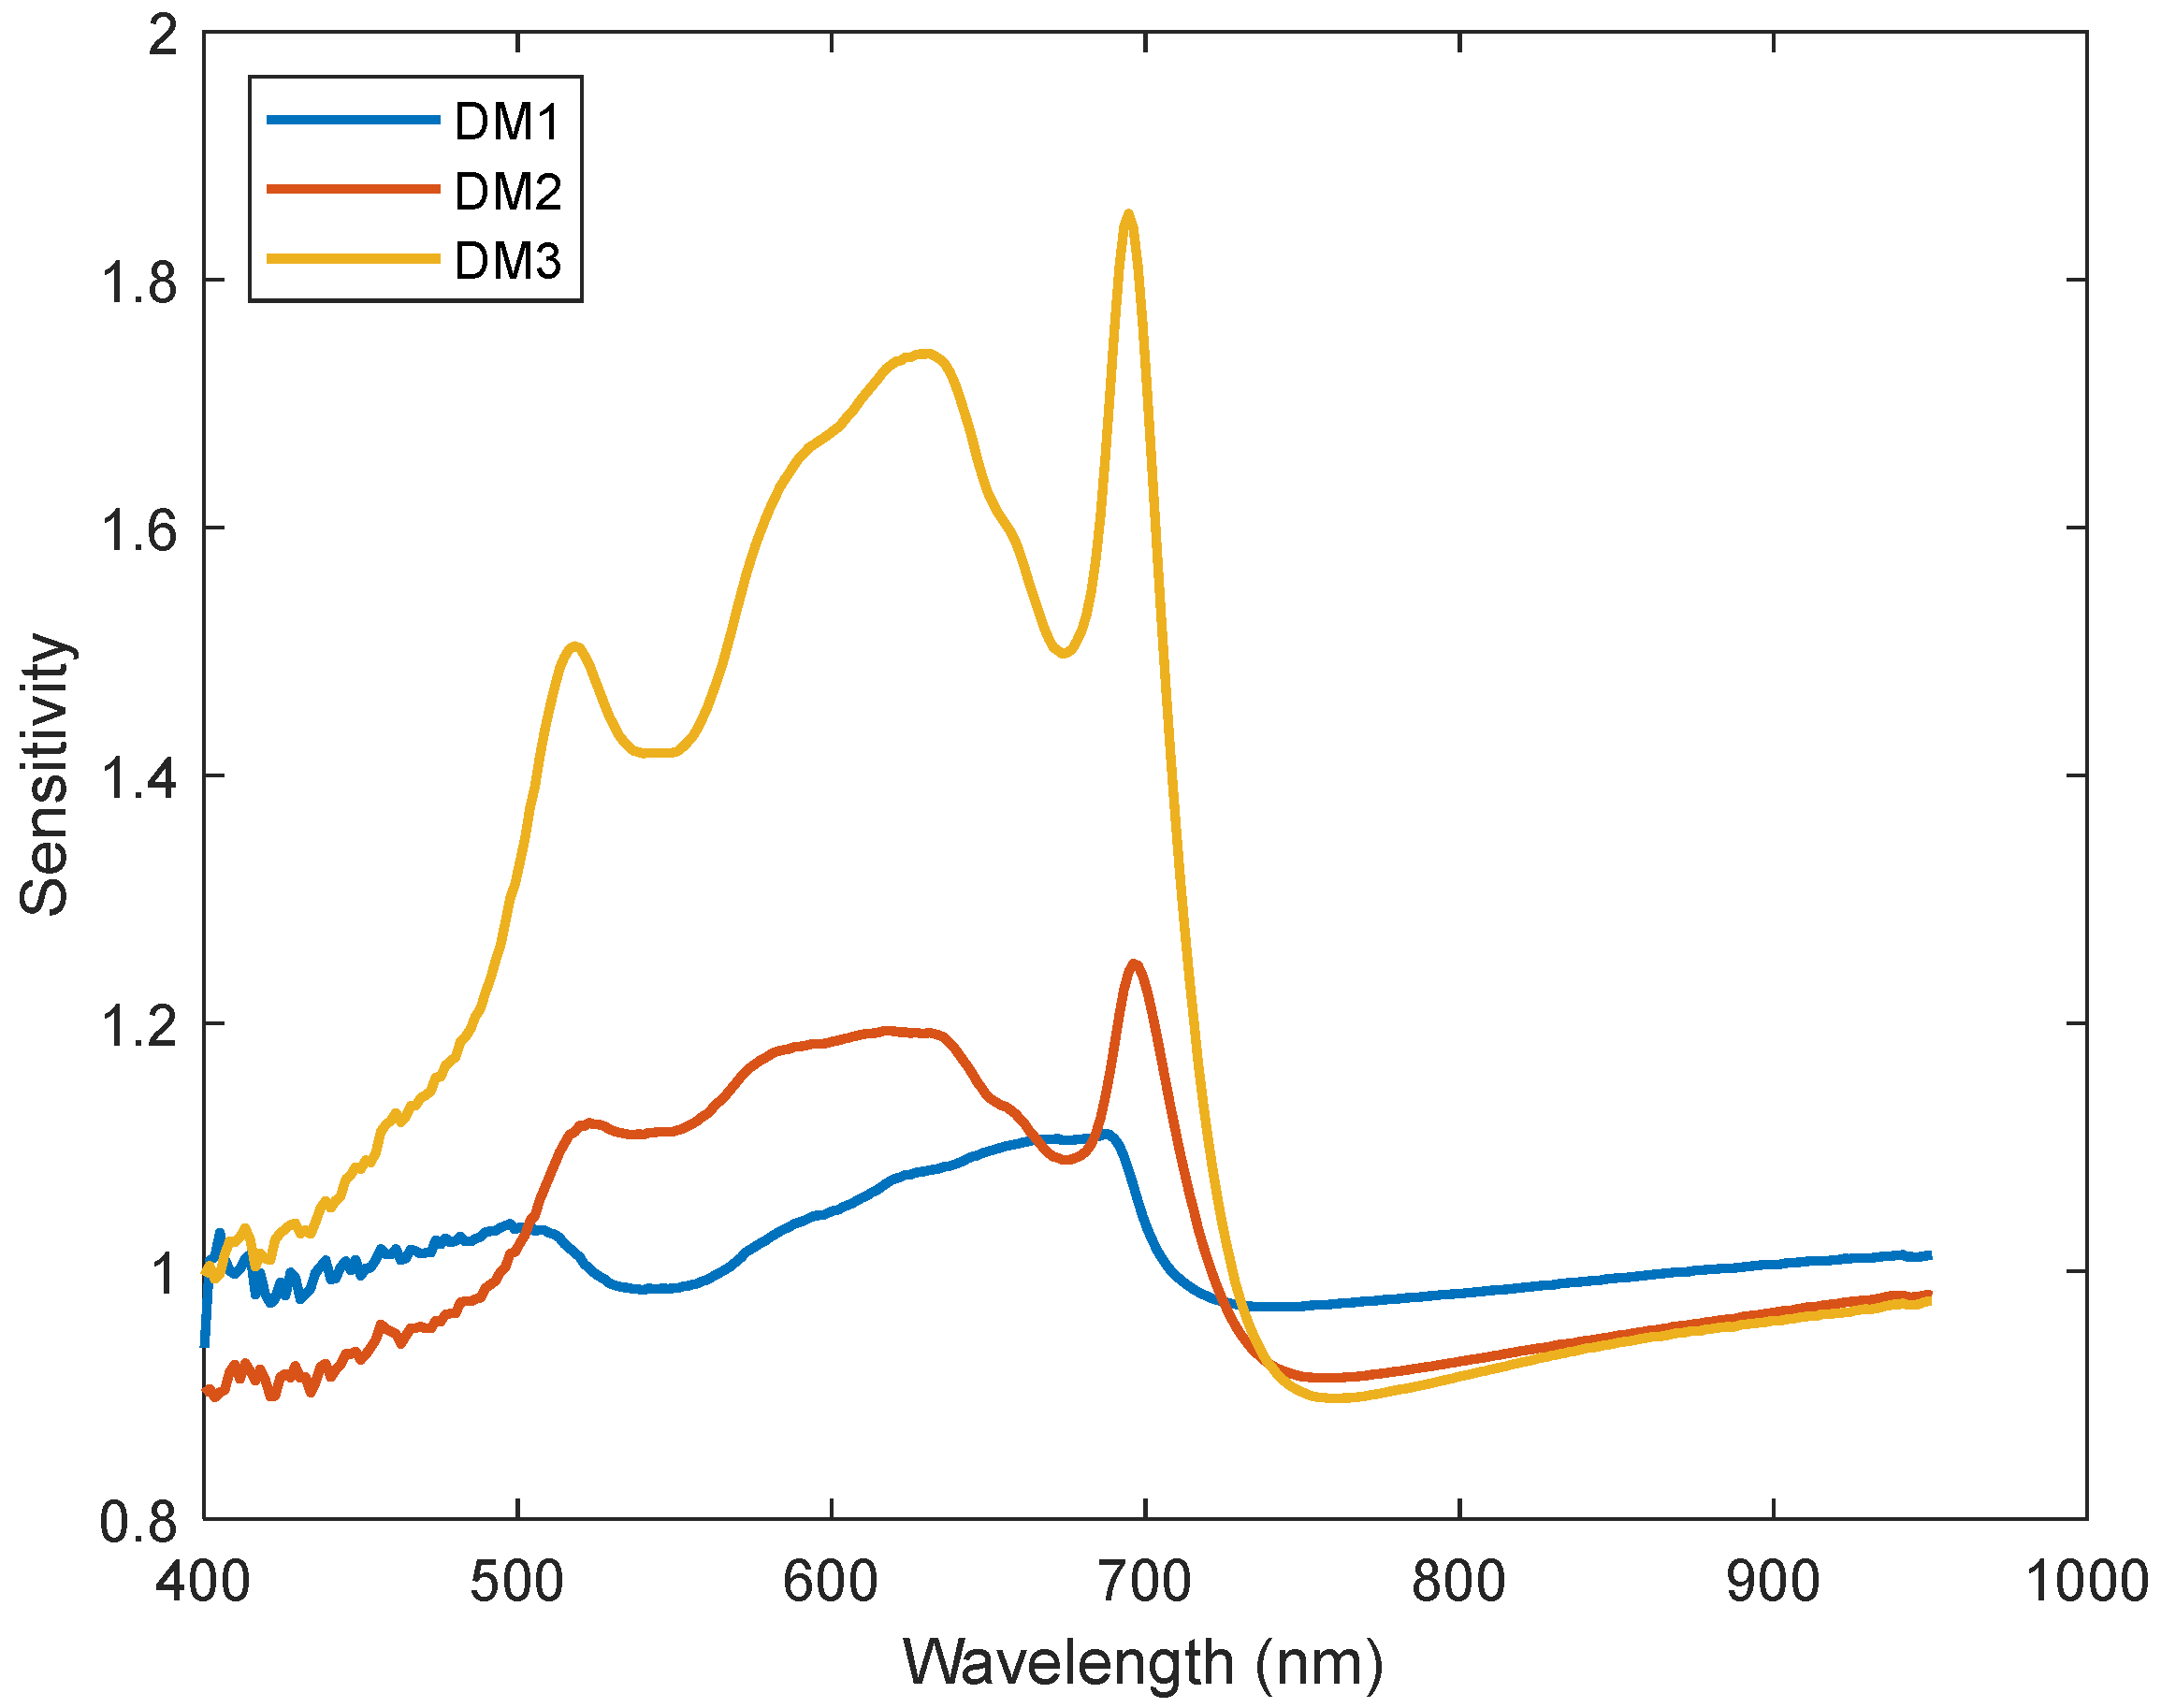
2.4.2. DM Indices Investigation
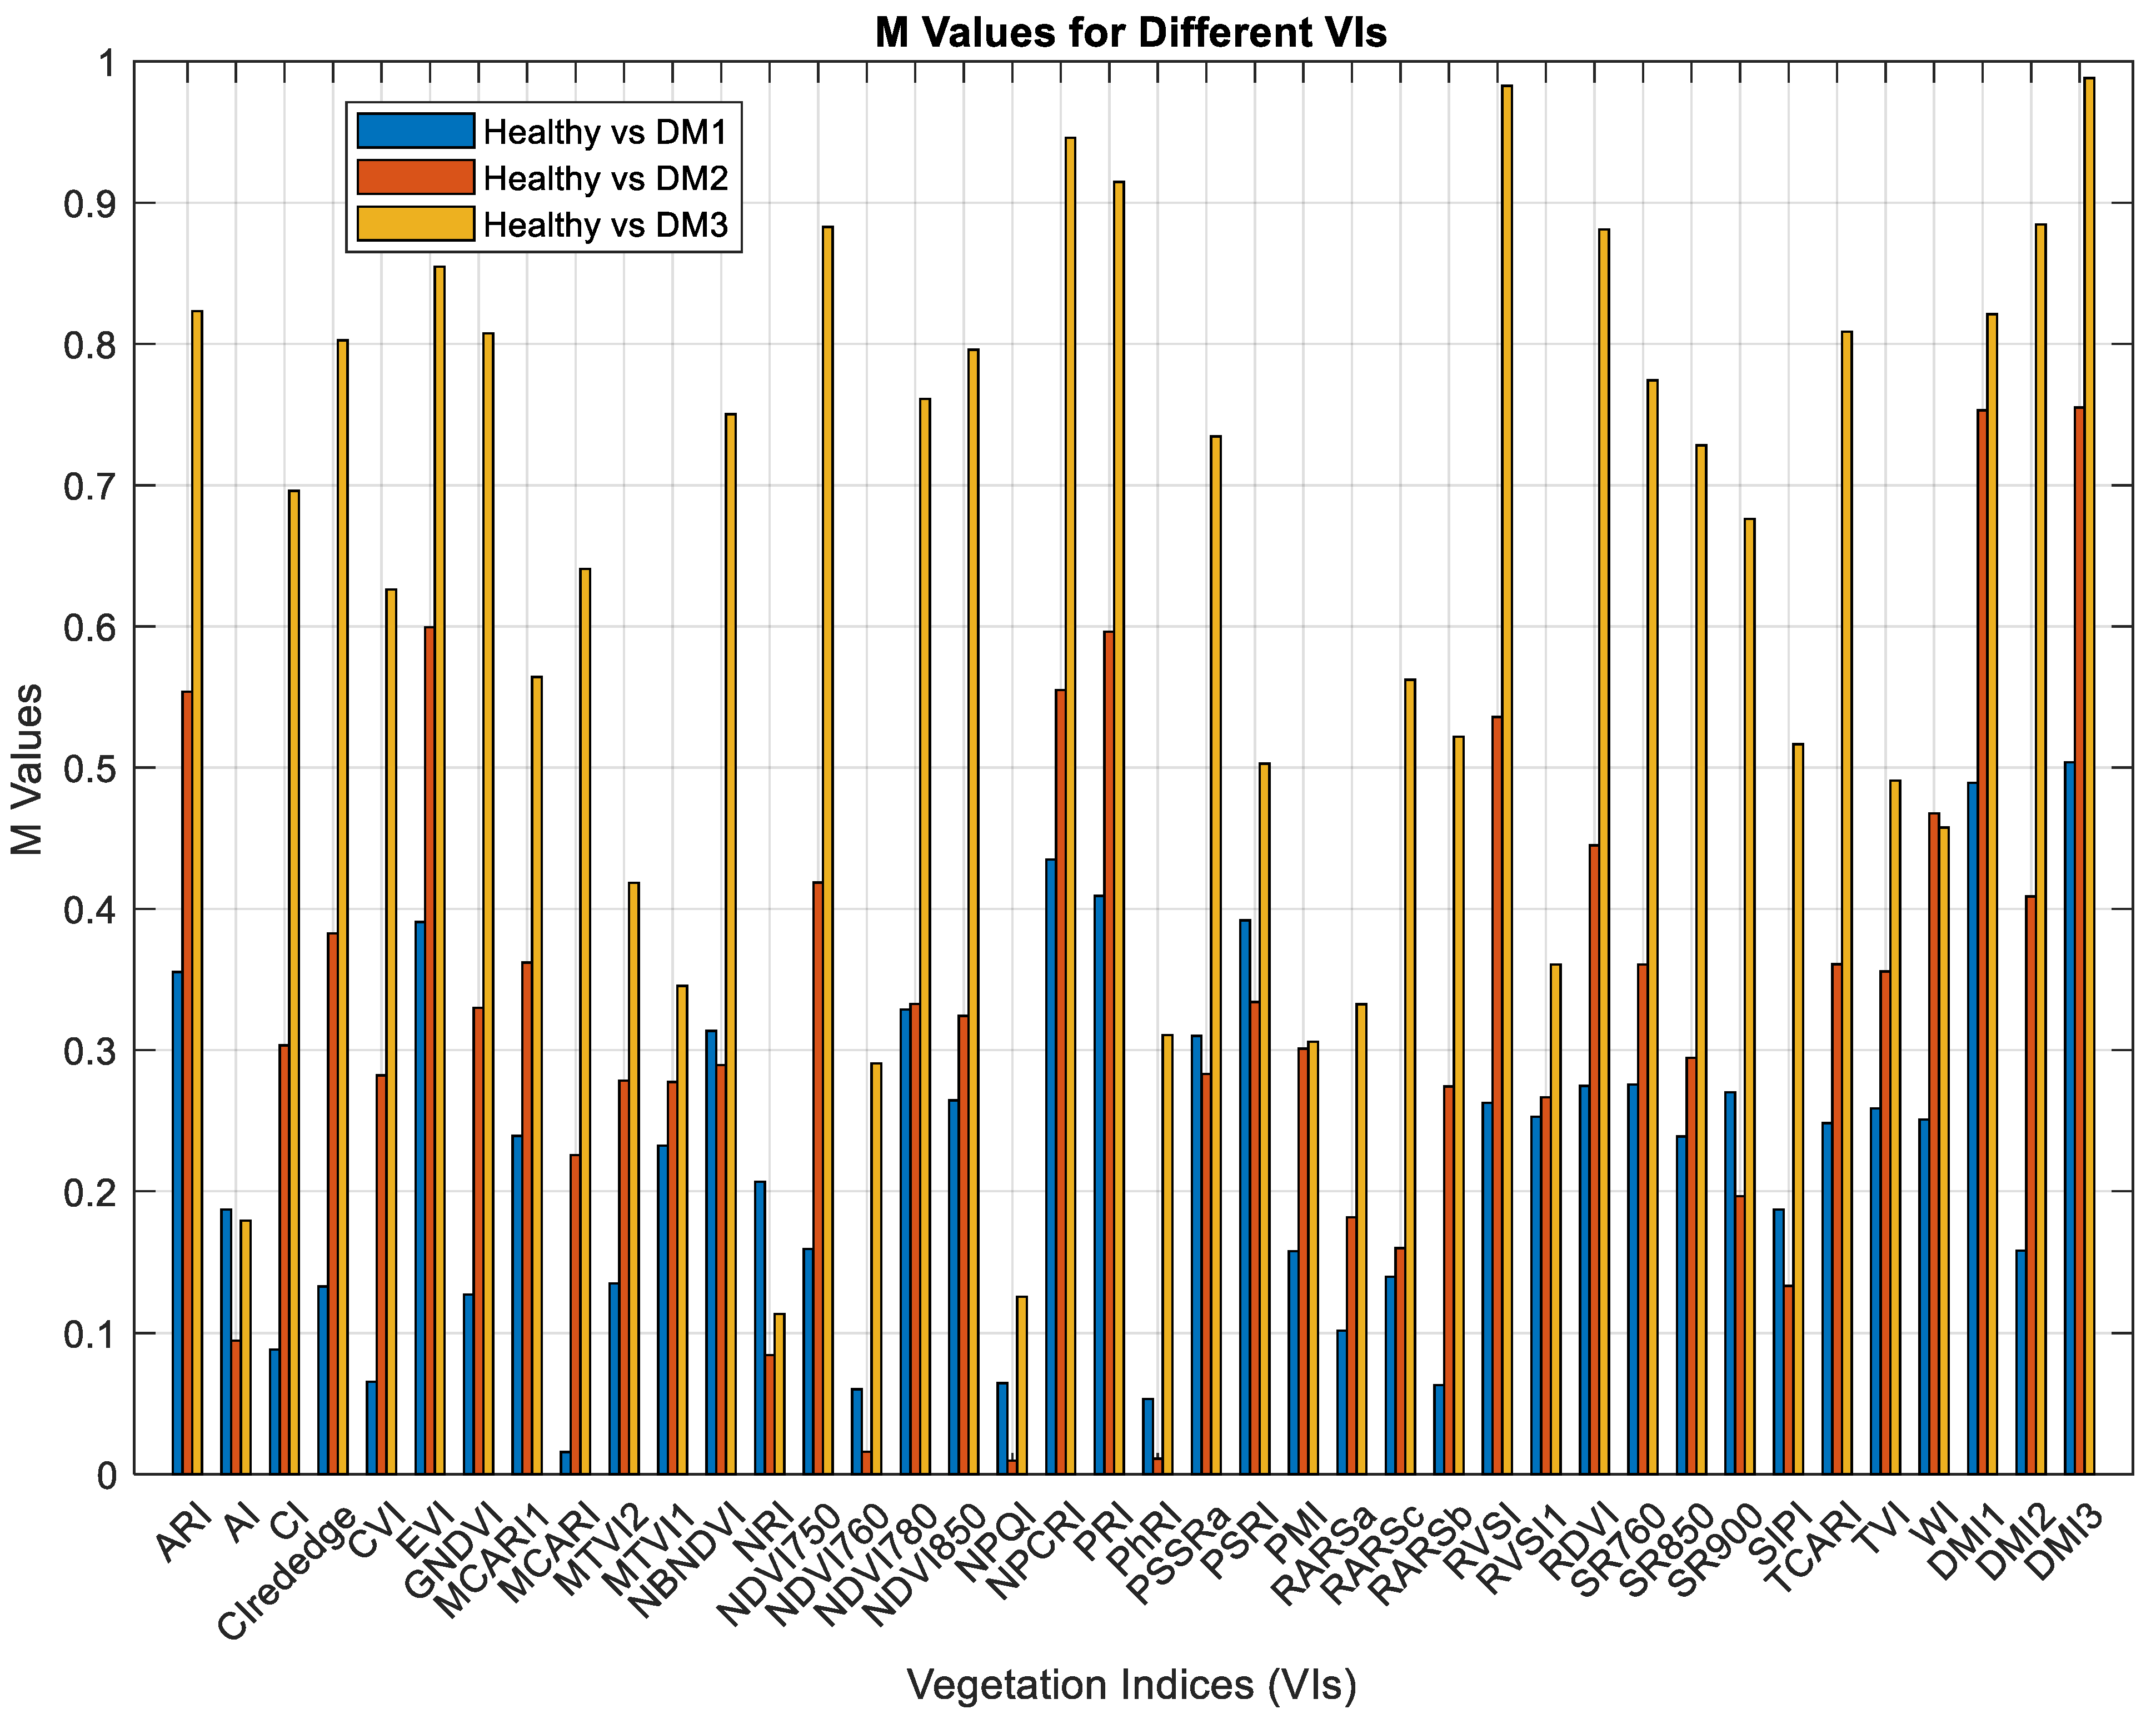
2.5. Statistical Analysis and VI Evaluation
3. Results
4. Discussion
Author Contributions
Funding
Institutional Review Board Statement
Informed Consent Statement
Data Availability Statement
Acknowledgments
Conflicts of Interest
References
- Tör, M.; Wood, T.; Webb, A.; Göl, D.; McDowell, J.M. Recent developments in plant-downy mildew interactions. Semin. Cell Dev. Biol. 2023, 148–149, 42–50. [Google Scholar] [CrossRef] [PubMed]
- Ali, A.; Imran, M. Evaluating the potential of red edge position (REP) of hyperspectral remote sensing data for real time estimation of LAI & chlorophyll content of kinnow mandarin (Citrus reticulata) fruit orchards. Sci. Hortic. 2020, 267, 109326. [Google Scholar] [CrossRef]
- Amsden, B.; Kwiatkowski, K.; Dixon, E.; Thompson, T.; Williams, M.; Beale, J.; Pfeufer, E. First Report of Downy Mildew Caused by Hyaloperonospora parasitica on Siberian Kale in Kentucky. Plant Dis. 2017, 101, 1057. [Google Scholar] [CrossRef]
- Choi, Y.-J.; Kruse, J.; Thines, M. Hyaloperonospora erucae sp. nov. (Peronosporaceae; Oomycota), the downy mildew pathogen of arugula (Eruca sativa). Eur. J. Plant Pathol. 2018, 151, 549–555. [Google Scholar] [CrossRef]
- Aylor, D.E. Spread of plant disease on a continental scale: Role of aerial dispersal of pathogens. Ecology 2003, 84, 1989–1997. [Google Scholar] [CrossRef]
- Bello, J.C.; Sakalidis, M.L.; Perla, D.E.; Hausbeck, M.K. Detection of Airborne Sporangia of Pseudoperonospora cubensis and P. humuli in Michigan Using Burkard Spore Traps Coupled to Quantitative PCR. Plant Dis. 2021, 105, 1373–1381. [Google Scholar] [CrossRef]
- Dhaka, V.S.; Meena, S.V.; Rani, G.; Sinwar, D.; Kavita; Ijaz, M.F.; Woźniak, M. A Survey of Deep Convolutional Neural Networks Applied for Prediction of Plant Leaf Diseases. Sensors 2021, 21, 4749. [Google Scholar] [CrossRef]
- Kanna, G.P.; Kumar, S.J.K.J.; Kumar, Y.; Changela, A.; Woźniak, M.; Shafi, J.; Ijaz, M.F. Advanced deep learning techniques for early disease prediction in cauliflower plants. Sci. Rep. 2023, 13, 18475. [Google Scholar] [CrossRef]
- Calderón, R.; Montes-Borrego, M.; Landa, B.; Navas-Cortés, J.; Zarco-Tejada, P. Detection of downy mildew of opium poppy using high-resolution multi-spectral and thermal imagery acquired with an unmanned aerial vehicle. Precis. Agric. 2014, 15, 639–661. [Google Scholar] [CrossRef]
- Kundu, N.; Rani, G.; Dhaka, V.S.; Gupta, K.; Nayak, S.C.; Verma, S.; Ijaz, M.F.; Woźniak, M. IoT and Interpretable Machine Learning Based Framework for Disease Prediction in Pearl Millet. Sensors 2021, 21, 5386. [Google Scholar] [CrossRef]
- Nguyen, C.; Sagan, V.; Maimaitiyiming, M.; Maimaitijiang, M.; Bhadra, S.; Kwasniewski, M.T. Early Detection of Plant Viral Disease Using Hyperspectral Imaging and Deep Learning. Sensors 2021, 21, 742. [Google Scholar] [CrossRef] [PubMed]
- Golhani, K.; Balasundram, S.K.; Vadamalai, G.; Pradhan, B. A review of neural networks in plant disease detection using hyperspectral data. Inf. Process. Agric. 2018, 5, 354–371. [Google Scholar] [CrossRef]
- Zubler, A.V.; Yoon, J.Y. Proximal Methods for Plant Stress Detection Using Optical Sensors and Machine Learning. Biosensors 2020, 10, 193. [Google Scholar] [CrossRef] [PubMed]
- Mohd Asaari, M.S.; Mishra, P.; Mertens, S.; Dhondt, S.; Inzé, D.; Wuyts, N.; Scheunders, P. Close-range hyperspectral image analysis for the early detection of stress responses in individual plants in a high-throughput phenotyping platform. ISPRS J. Photogramm. Remote Sens. 2018, 138, 121–138. [Google Scholar] [CrossRef]
- Rouse, J.W.; Haas, R.H.; Schell, J.A.; Deering, D.W. Monitoring vegetation systems in the great plains with ERTS. In Proceedings of the Goddard Space Flight Center 3d ERTS-1 Symposium, Washington, DC, USA, 10–14 December 1973; pp. 309–317. [Google Scholar]
- Wang, K.; Franklin, S.E.; Guo, X.; Cattet, M. Remote sensing of ecology, biodiversity and conservation: A review from the perspective of remote sensing specialists. Sensors 2010, 10, 9647–9667. [Google Scholar] [CrossRef] [PubMed]
- Lausch, A.; Erasmi, S.; King, D.J.; Magdon, P.; Heurich, M. Understanding forest health with remote sensing-part I—A review of spectral traits, processes and remote-sensing characteristics. Remote Sens. 2016, 8, 1029. [Google Scholar] [CrossRef]
- Abdulridha, J.; Ampatzidis, Y.; Qureshi, J.; Roberts, P. Identification and classification of downy mildew severity stages in watermelon utilizing aerial and ground remote sensing and machine learning. Front. Plant Sci. 2022, 13, 791018. [Google Scholar] [CrossRef]
- Hernández, I.; Gutiérrez, S.; Ceballos, S.; Iñíguez, R.; Barrio, I.; Tardaguila, J. Artificial intelligence and novel sensing technologies for assessing downy mildew in grapevine. Horticulturae 2021, 7, 103. [Google Scholar] [CrossRef]
- Pithan, P.A.; Ducati, J.R.; Garrido, L.R.; Arruda, D.C.; Thum, A.B.; Hoff, R. Spectral characterization of fungal diseases downy mildew, powdery mildew, black-foot and Petri disease on Vitis vinifera leaves. Int. J. Remote Sens. 2021, 42, 5680–5697. [Google Scholar] [CrossRef]
- Kuswidiyanto, L.W.; Wang, P.; Noh, H.-H.; Jung, H.-Y.; Jung, D.-H.; Han, X. Airborne hyperspectral imaging for early diagnosis of kimchi cabbage downy mildew using 3D-ResNet and leaf segmentation. Comput. Electron. Agric. 2023, 214, 108312. [Google Scholar] [CrossRef]
- Savitzky, A.; Golay, M.J.E. Smoothing and Differentiation of Data by Simplified Least Squares Procedures. Anal. Chem. 1964, 36, 1627–1639. [Google Scholar] [CrossRef]
- Huete, A. Vegetation Indices. In Encyclopedia of Remote Sensing; Njoku, E.G., Ed.; Springer: New York, NY, USA, 2014; pp. 883–886. [Google Scholar]
- Kumar, S.; Meena, R.S.; Sheoran, S.; Jangir, C.K.; Jhariya, M.K.; Banerjee, A.; Raj, A. Chapter 5-Remote sensing for agriculture and resource management. In Natural Resources Conservation and Advances for Sustainability; Jhariya, M.K., Meena, R.S., Banerjee, A., Meena, S.N., Eds.; Elsevier: Amsterdam, The Netherlands, 2022; pp. 91–135. [Google Scholar]
- Dorigo, W.A.; Zurita-Milla, R.; de Wit, A.J.W.; Brazile, J.; Singh, R.; Schaepman, M.E. A review on reflective remote sensing and data assimilation techniques for enhanced agroecosystem modeling. Int. J. Appl. Earth Observ. Geoinform. 2007, 9, 165–193. [Google Scholar] [CrossRef]
- Gitelson, A.A.; Merzlyak, M.N.; Chivkunova, O.B. Optical properties and nondestructive estimation of anthocyanin content in plant leaves. Photochem. Photobiol. 2001, 74, 38–45. [Google Scholar] [CrossRef]
- Mirik, M.; Michels, G.J.; Kassymzhanova-Mirik, S.; Elliott, N.C.; Catana, V.; Jones, D.B.; Bowling, R. Using digital image analysis and spectral reflectance data to quantify damage by greenbug (Hemitera: Aphididae) in winter wheat. Comput. Electron. Agric. 2006, 51, 86–98. [Google Scholar] [CrossRef]
- Gitelson, A.A.; Gritz, Y.; Merzlyak, M.N. Relationships between leaf chlorophyll content and spectral reflectance and algorithms for non-destructive chlorophyll assessment in higher plant leaves. J. Plant Physiol. 2003, 160, 271–282. [Google Scholar] [CrossRef] [PubMed]
- Vincini, M.; Frazzi, E. Comparing narrow and broad-band vegetation indices to estimate leaf chlorophyll content in planophile crop canopies. Precis. Agric. 2010, 12, 334–344. [Google Scholar] [CrossRef]
- Huete, A.; Didan, K.; Miura, T.; Rodriguez, E.P.; Gao, X.; Ferreira, L.G. Overview of the radiometric and biophysical performance of the MODIS vegetation indices. Remote Sens. Environ. 2002, 83, 195–213. [Google Scholar] [CrossRef]
- Gitelson, A.A.; Merzlyak, M.N. Signature Analysis of Leaf Reflectance Spectra: Algorithm Development for Remote Sensing of Chlorophyll. J. Plant Physiol. 1996, 148, 494–500. [Google Scholar] [CrossRef]
- Haboudane, D.; Miller, J.R.; Pattey, E.; Zarco-Tejada, P.J.; Strachan, I.B. Hyperspectral vegetation indices and novel algorithms for predicting green LAI of crop canopies: Modeling and validation in the context of precision agriculture. Remote Sens. Environ. 2004, 90, 337–352. [Google Scholar] [CrossRef]
- Daughtry, C.S.T.; Walthall, C.L.; Kim, M.S.; de Colstoun, E.B.; McMurtrey, J.E. Estimating Corn Leaf Chlorophyll Concentration from Leaf and Canopy Reflectance. Remote Sens. Environ. 2000, 74, 229–239. [Google Scholar] [CrossRef]
- Thenkabail, P.S.; Smith, R.B.; De Pauw, E. Hyperspectral Vegetation Indices and Their Relationships with Agricultural Crop Characteristics. Remote Sens. Environ. 2000, 71, 158–182. [Google Scholar] [CrossRef]
- Filella, I.; Serrano, L.; Serra, J.; Peñuelas, J. Evaluating Wheat Nitrogen Status with Canopy Reflectance Indices and Discriminant Analysis. Crop Sci. 1995, 35, 1400–1405. [Google Scholar] [CrossRef]
- Raun, W.R.; Solie, J.B.; Johnson, G.V.; Stone, M.L.; Lukina, E.V.; Thomason, W.E.; Schepers, J.S. In-Season Prediction of Potential Grain Yield in Winter Wheat Using Canopy Reflectance. Agron. J. 2001, 93, 131–138. [Google Scholar] [CrossRef]
- Barnes, J.D.; Balaguer, L.; Manrique, E.; Elvira, S.; Davison, A.W. A reappraisal of the use of DMSO for the extraction and determination of chlorophylls a and b in lichens and higher plants. Environ. Exp. Bot. 1992, 32, 85–100. [Google Scholar] [CrossRef]
- Penuelas, J.; Frederic, B.; Filella, I. Semi-Empirical Indices to Assess Carotenoids/Chlorophyll-a Ratio from Leaf Spectral Reflectance. Photosynthetica 1995, 31, 221–230. [Google Scholar]
- Penuelas, J.; Llusia, J.; Pinol, J.; Filella, I. Photochemical reflectance index and leaf photosynthetic radiation-use-efficiency assessment in Mediterranean trees. Int. J. Remote Sens. 1997, 18, 2863–2868. [Google Scholar] [CrossRef]
- Gamon, J.A.; Peñuelas, J.; Field, C.B. A narrow-waveband spectral index that tracks diurnal changes in photosynthetic efficiency. Remote Sens. Environ. 1992, 41, 35–44. [Google Scholar] [CrossRef]
- Blackburn, G.A. Quantifying Chlorophylls and Caroteniods at Leaf and Canopy Scales: An Evaluation of Some Hyperspectral Approaches. Remote Sens. Environ. 1998, 66, 273–285. [Google Scholar] [CrossRef]
- Merzlyak, M.N.; Gitelson, A.A.; Chivkunova, O.B.; Rakitin, V.Y.U. Non-destructive optical detection of pigment changes during leaf senescence and fruit ripening. Physiol. Plant. 1999, 106, 135–141. [Google Scholar] [CrossRef]
- Huang, W.; Guan, Q.; Luo, J.; Zhang, J.; Zhao, J.; Liang, D.; Huang, L.; Zhang, D. New Optimized Spectral Indices for Identifying and Monitoring Winter Wheat Diseases. IEEE J. Sel. Top. Appl. Earth Obs. Remote Sens. 2014, 7, 2516–2524. [Google Scholar] [CrossRef]
- Chappelle, E.W.; Kim, M.S.; McMurtrey, J.E. Ratio analysis of reflectance spectra (RARS): An algorithm for the remote estimation of the concentrations of chlorophyll A, chlorophyll B, and carotenoids in soybean leaves. Remote Sens. Environ. 1992, 39, 239–247. [Google Scholar] [CrossRef]
- Merton, R.; Huntington, J. Early simulation results of the ARIES-1 satellite sensor for multi-temporal vegetation research derived from AVIRIS. In Proceedings of the Eighth Annual JPL Airborne Earth Science Workshop; NASA, Jet Propulsion Laboratory: Pasadena, CA, USA, 1999. [Google Scholar]
- Merton, R.N. Monitoring community hysteresis using spectral shift analysis and the red-edge vegetation stress index. In Proceedings of the Seventh Annual JPL Airborne Earth Science Workshop, Pasadena, CA, USA, 12–16 January 1998; NASA, Jet Propulsion Laboratory: Pasadena, CA, USA, 1998. [Google Scholar]
- Roujean, J.-L.; Breon, F.-M. Estimating PAR Absorbed by Vegetation from Bidirectional Reflectance Measurements. Remote Sens. Environ. 1995, 51, 375–384. [Google Scholar] [CrossRef]
- Jordan, C.F. Derivation of Leaf-Area Index from Quality of Light on the Forest Floor. Ecology 1969, 50, 663–666. [Google Scholar] [CrossRef]
- Haboudane, D.; Miller, J.R.; Tremblay, N.; Zarco-Tejada, P.J.; Dextraze, L. Integrated narrow-band vegetation indices for prediction of crop chlorophyll content for application to precision agriculture. Remote Sens. Environ. 2002, 81, 416–426. [Google Scholar] [CrossRef]
- Broge, N.H.; Leblanc, E. Comparing prediction power and stability of broadband and hyperspectral vegetation indices for estimation of green leaf area index and canopy chlorophyll density. Remote Sens. Environ. 2001, 76, 156–172. [Google Scholar] [CrossRef]
- Penuelas, J.; Pinol, J.; Ogaya, R.; Filella, I. Estimation of plant water concentration by the reflectance Water Index WI (R900/R970). Int. J. Remote Sens. 1997, 18, 2869–2875. [Google Scholar] [CrossRef]
- Paiva, H.M.; Soares, S.F.C.; Galvão, R.K.H.; Araújo, M.C.U. A graphical user interface for variable selection employing the Successive Projections Algorithm. Chemom. Intell. Lab. Syst. 2012, 118, 260–266. [Google Scholar] [CrossRef]
- Kaufman, Y.J.; Remer, L.A. Detection of forests using mid-IR reflectance: An application for aerosol studies. IEEE Trans. Geosci. Remote Sens. 1994, 32, 672–683. [Google Scholar] [CrossRef]
- Gazala, I.F.; Sahoo, R.N.; Pandey, R.; Mandal, B.; Gupta, V.K.; Singh, R.; Sinha, P. Spectral reflectance pattern in soybean for assessing yellow mosaic disease. Indian J. Virol. 2013, 24, 242–249. [Google Scholar] [CrossRef] [PubMed]
- Abdulridha, J.; Ampatzidis, Y.; Kakarla, S.C.; Roberts, P. Detection of target spot and bacterial spot diseases in tomato using UAV-based and benchtop-based hyperspectral imaging techniques. Precis. Agric. 2020, 21, 955–978. [Google Scholar] [CrossRef]


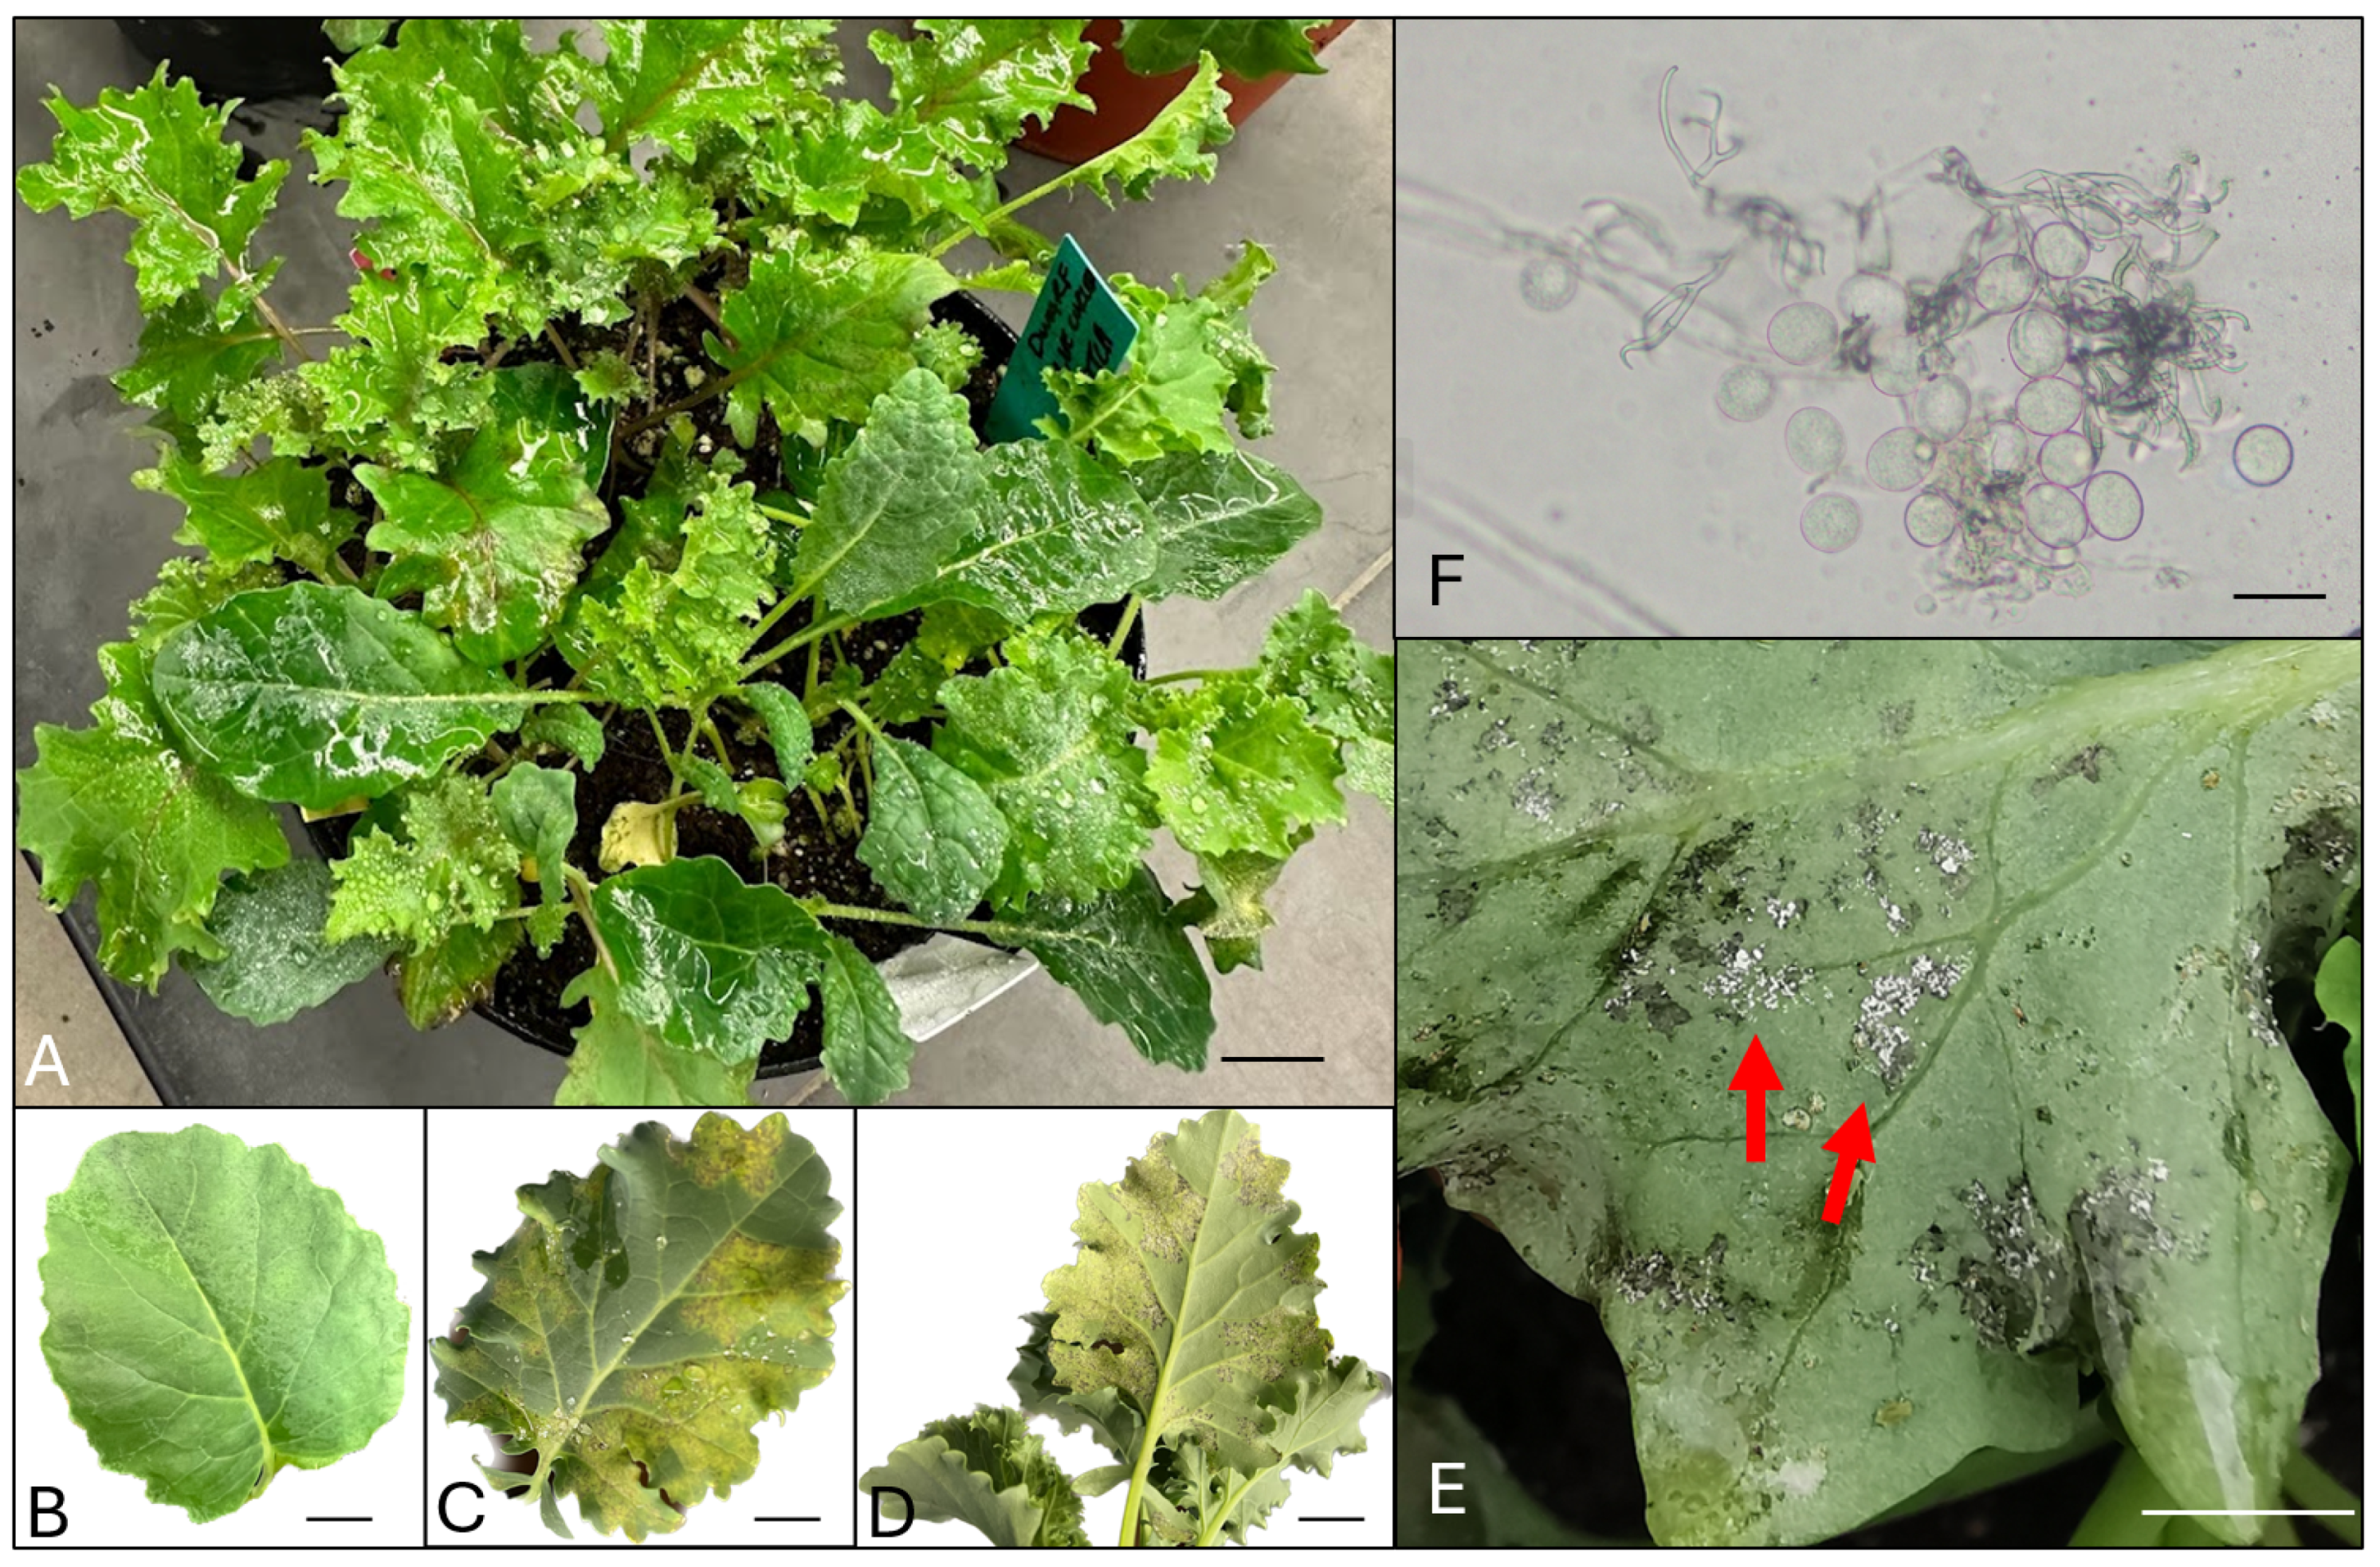
| Downy Mildew Disease Development Level | Description of Each Level |
|---|---|
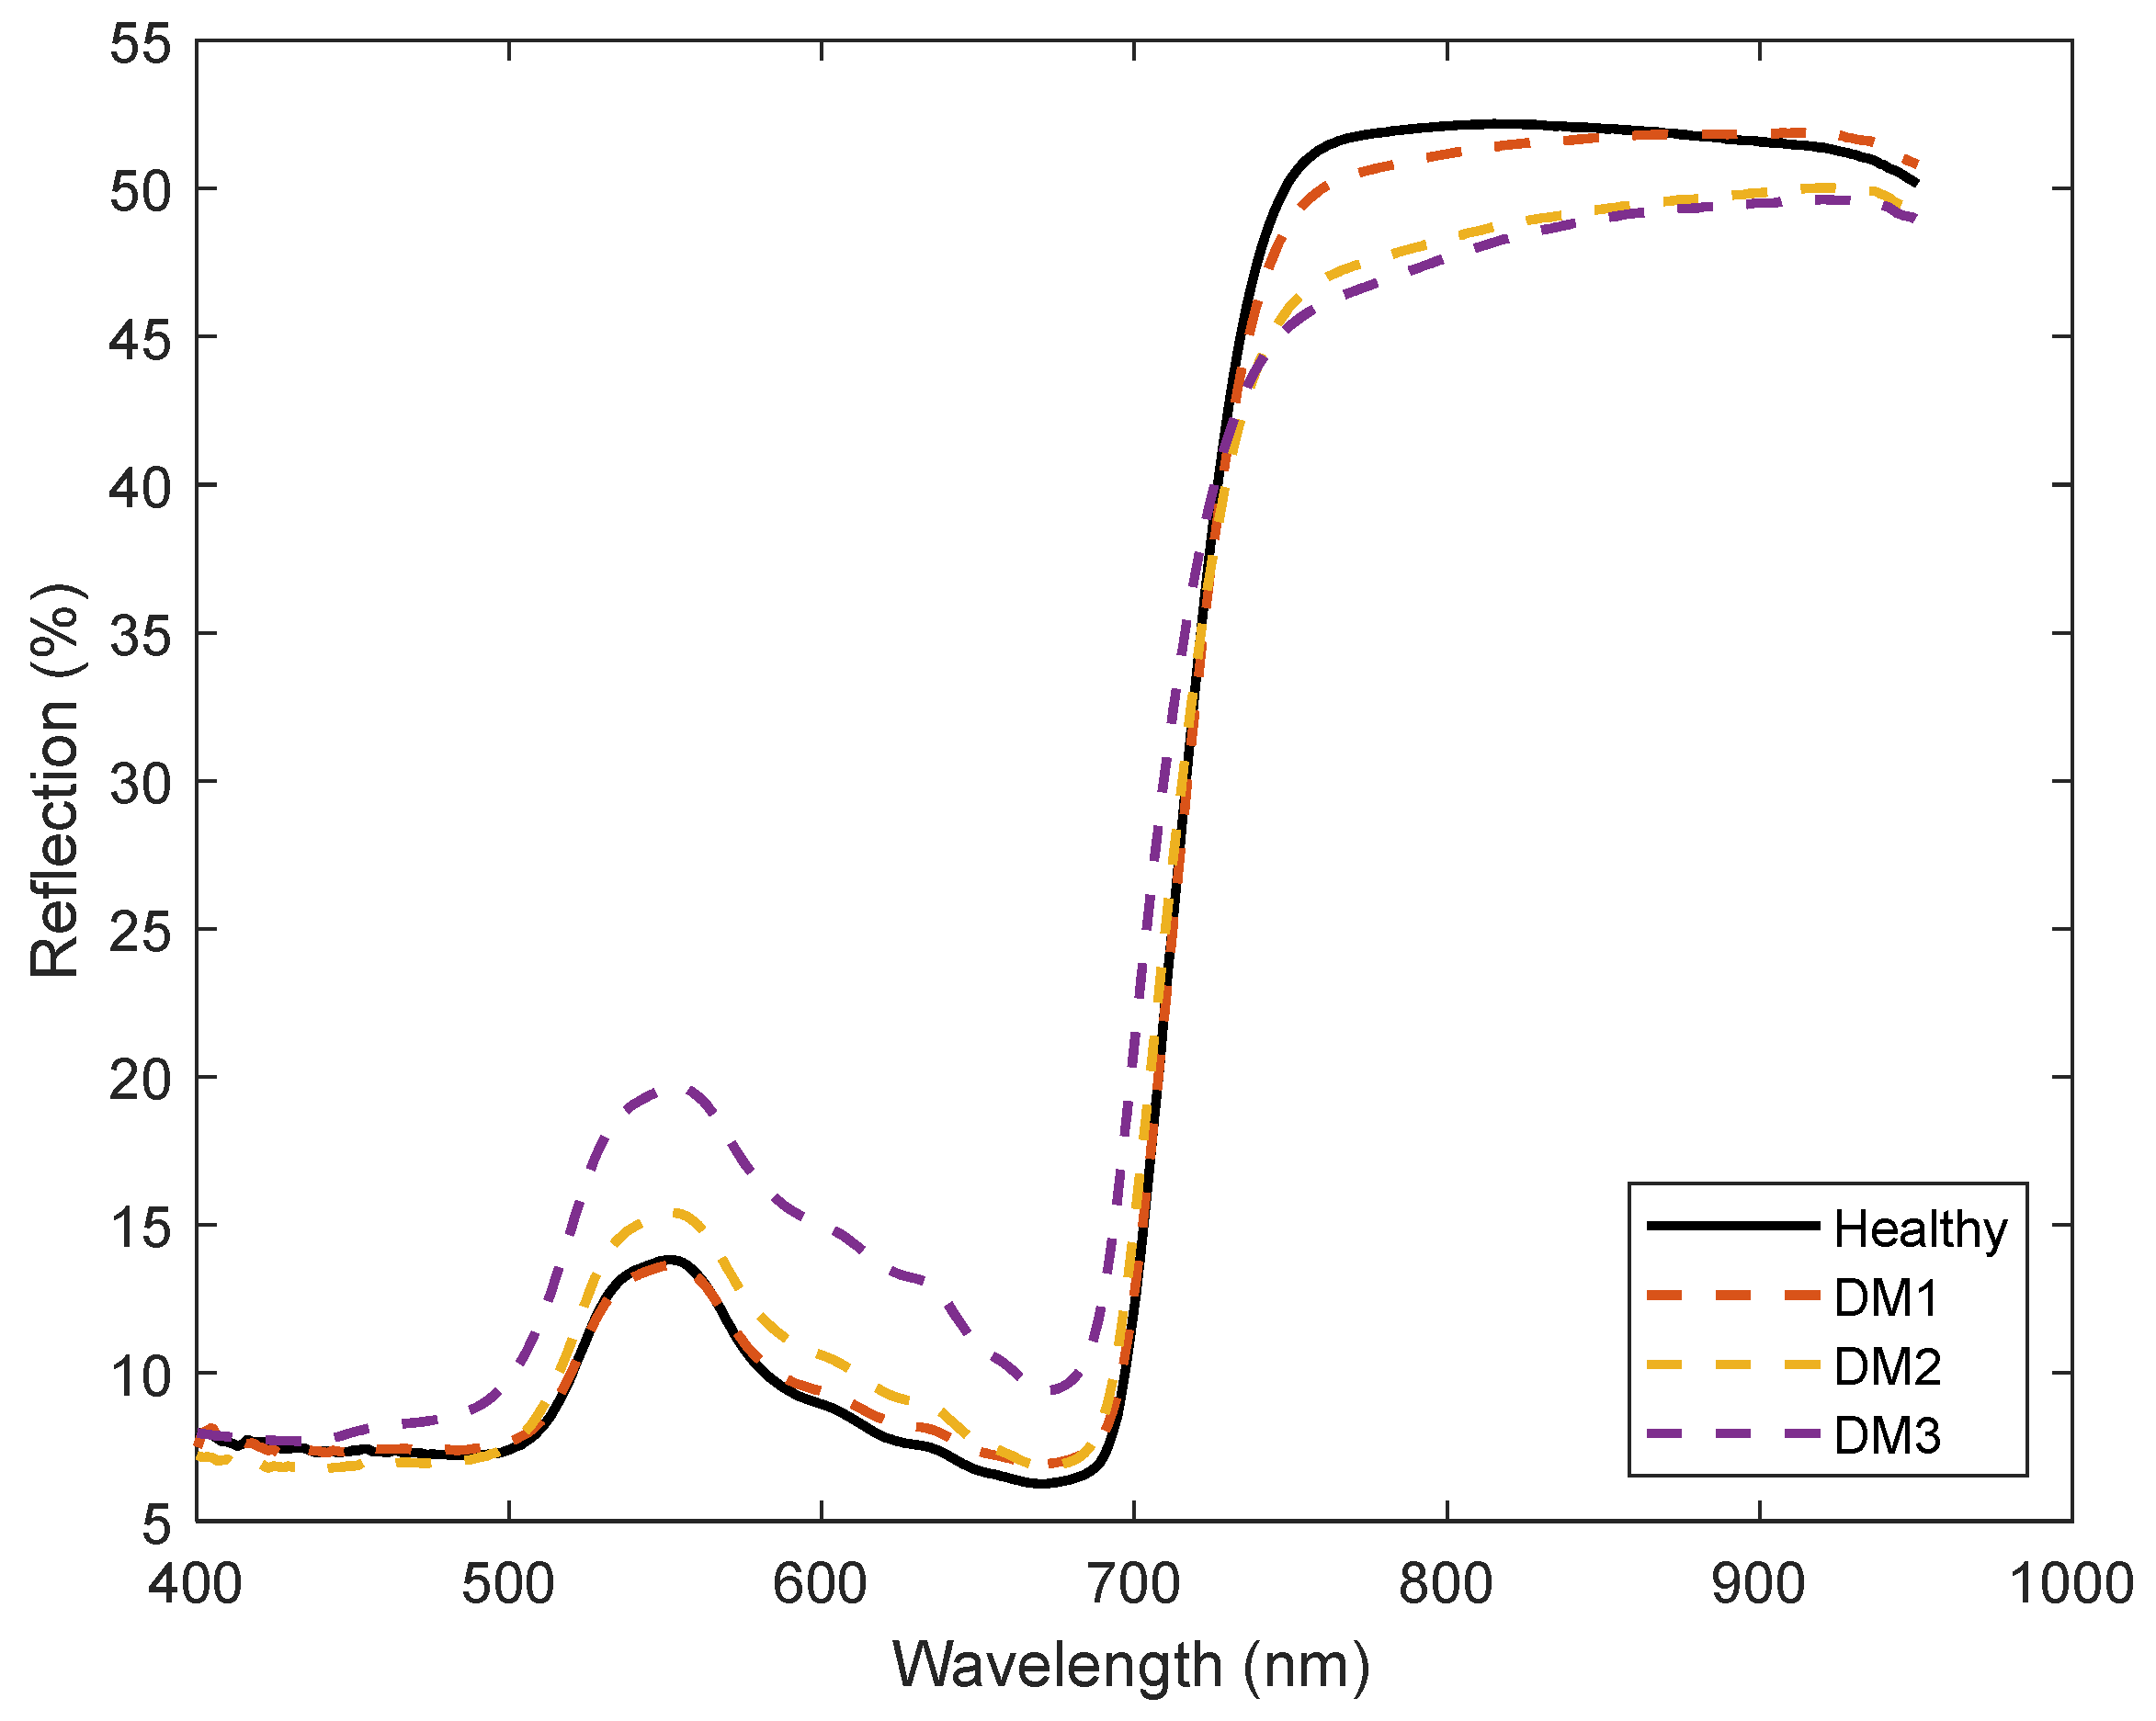
| Healthy | No visual indication of infection on the leaves. |
| DM1 | Pitted spots can be observed on the lower side of the leaves. The spots have not shown any chlorosis yet. |
| DM2 | Pitted spots can be observed on both sides of the leaves. Chlorosis can be observed. |
| DM3 | Lesions can be observed on the leaves. |
| Vegetation Indices | Expressions | References |
|---|---|---|
| Anthocyanin Reflectance Index (ARI) | 1/R550 − 1/R700 | Gitelson, Merzlyak [26] |
| Aphid Index (AI) | (R740 − R887)/(R691 − R698) | Mirik, Michels [27] |
| Chlorohyll Index (CI green) | R840/R570 − 1 | Gitelson, Gritz [28] |
| Chlorophyll Index Rededge (CIrededge) | R780/R705 − 1 | Gitelson, Gritz [28] |
| Chlorophyll Vegetation Index (CVI) | R840 × R760/R5502 | Vincini and Frazzi [29] |
| Enhanced Vegetation Index (EVI) | 2.5 × ((R900 − R650)/(R900 + 6 × R650 − 7.5 × R500 + 1)) | Huete, Didan [30] |
| Green NDVI (GNDVI) | (R850 − R580)/(R850 + R580) | Gitelson and Merzlyak [31] |
| Modified Chlorophyll Absorption in Reflectance Index (mCARI1) | 1.2 × (2.5 × (R761 − R651) − 1.3 × (R761 − R580)) | Haboudane, Miller [32] |
| Modified Chlorophyll Absorption Ratio Index (mCARI) | (R700 − R670) − 0.2 × (R700 − R550) × ((R700/R670) − 1) | Daughtry, Walthall [33] |
| Modified Triangle Vegetation Index 2 (MTVI2) | 1.5 × (1.2 × (R800 − R550) − 2.5 × (R670 − R550)) × (2 × R800 + 1)2 − (6 × R800 – 5 × R670) − 0.5 | Haboudane, Miller [32] |
| Modified Triangle Vegetation Index 1 (MTVI1) | 1.2 × (1.2 × (R800 − R550) − 2.5 × (R670 − R550)) | Haboudane, Miller [32] |
| Narrow Band Normalized Difference Vegetation Index (NBNDVI) | (R850 − R680)/(R850 + R680) | Thenkabail, Smith [34] |
| Nitrogen Reflectance Index (NRI) | (R570 − R670)/(R570 + R670) | Filella, Serrano [35] |
| Normalized Difference Vegetation Index 750 (NDVI 750) | (R750 − R705)/(R750 + R705) | Raun, Solie [36] |
| Normalized Difference Vegetation Index 760 (NDVI 760) | (R761 − R450)/(R761 + R450) | Raun, Solie [36] |
| Normalized Difference Vegetation Index 780 (NDVI 780) | (R780 − R670)/(R780 + R670) | Raun, Solie [36] |
| Normalized Difference Vegetation Index 850 (NDVI 850) | (R850 − R651)/(R850 + R651) | Raun, Solie [36] |
| Normalized Phaeophytization Index (NPQI) | (R415 − R435)/(R415 + R435) | Barnes, Balaguer [37] |
| Normalized Pigment Chlorophyll Ratio Index (NPCRI) | (R680 − R430)/(R680 + R430) | Penuelas, Frederic [38] |
| Photochemical Reflectance Index (PRI) | (R570 − R531)/(R570 + R531) | Penuelas, Llusia [39] |
| Photosynthetic Radiation (PhRI) | (R550 − R531)/(R550 + R531) | Gamon, Peñuelas [40] |
| Pigment Specific Simple Ratio (PSSRa) | R800/R680 | Blackburn [41] |
| Plant Senescence Reflectance Index (PSRI) | (R680 − R500)/R750 | Merzlyak, Gitelson [42] |
| Powdery Mildew Index (PMI) | (R515 − R698)/(R515 + R698) − 0.5 × R738 | Huang, Guan [43] |
| Ratio Analysis of Reflectance Spectral Chlorophyll-a (RARSa) | R675/R700 | Chappelle, Kim [44] |
| Ratio Analysis of Reflectance Spectra (RARSc) | R760/R500 | Chappelle, Kim [44] |
| Ratio Analysis of Reflectance Spectral Chlorophyll-b (RARSb) | R675/(R700 × R650) | Chappelle, Kim [44] |
| Red Edge Vegetation Stress Index (RVSI) | (R712 + R752)/2 − R732 | Merton and Huntington [45] |
| Red-Edge Vegetation Stress Index1 (RVSI1) | (R650 + R750)/2 − R733 | Merton [46] |
| Renormalized Difference Vegetation Index (RDVI) | Roujean and Breon [47] | |
| Simple Ratio Index (SR760) | R761/R650 | Jordan [48] |
| Simple Ratio Index (SR850) | R850/R650 | Jordan [48] |
| Simple Ratio Index (SR900) | R900/R680 | Jordan [48] |
| Structure Insensitive Pigment Index (SIPI) | (R800 − R445)/(R800 + R680) | Penuelas, Frederic [38] |
| Transform chlorophyll absorption in reflectance index (TCARI) | 3 × ((R740 − R651) − 0.2 × (R740 − R580) × (R740/R651)) | Haboudane, Miller [49] |
| Triangle Vegetation Index (TVI) | 0.5 × (120 × (R750 − R550) – 200 × (R670 − R550)) | Broge and Leblanc [50] |
| Water Index (WI) | R900/R970 | Penuelas, Pinol [51] |
| Accuracy | Model Hyperparameters | |||
|---|---|---|---|---|
| Healthy vs. DM1 | Healthy vs. DM2 | Healthy vs. DM3 | ||
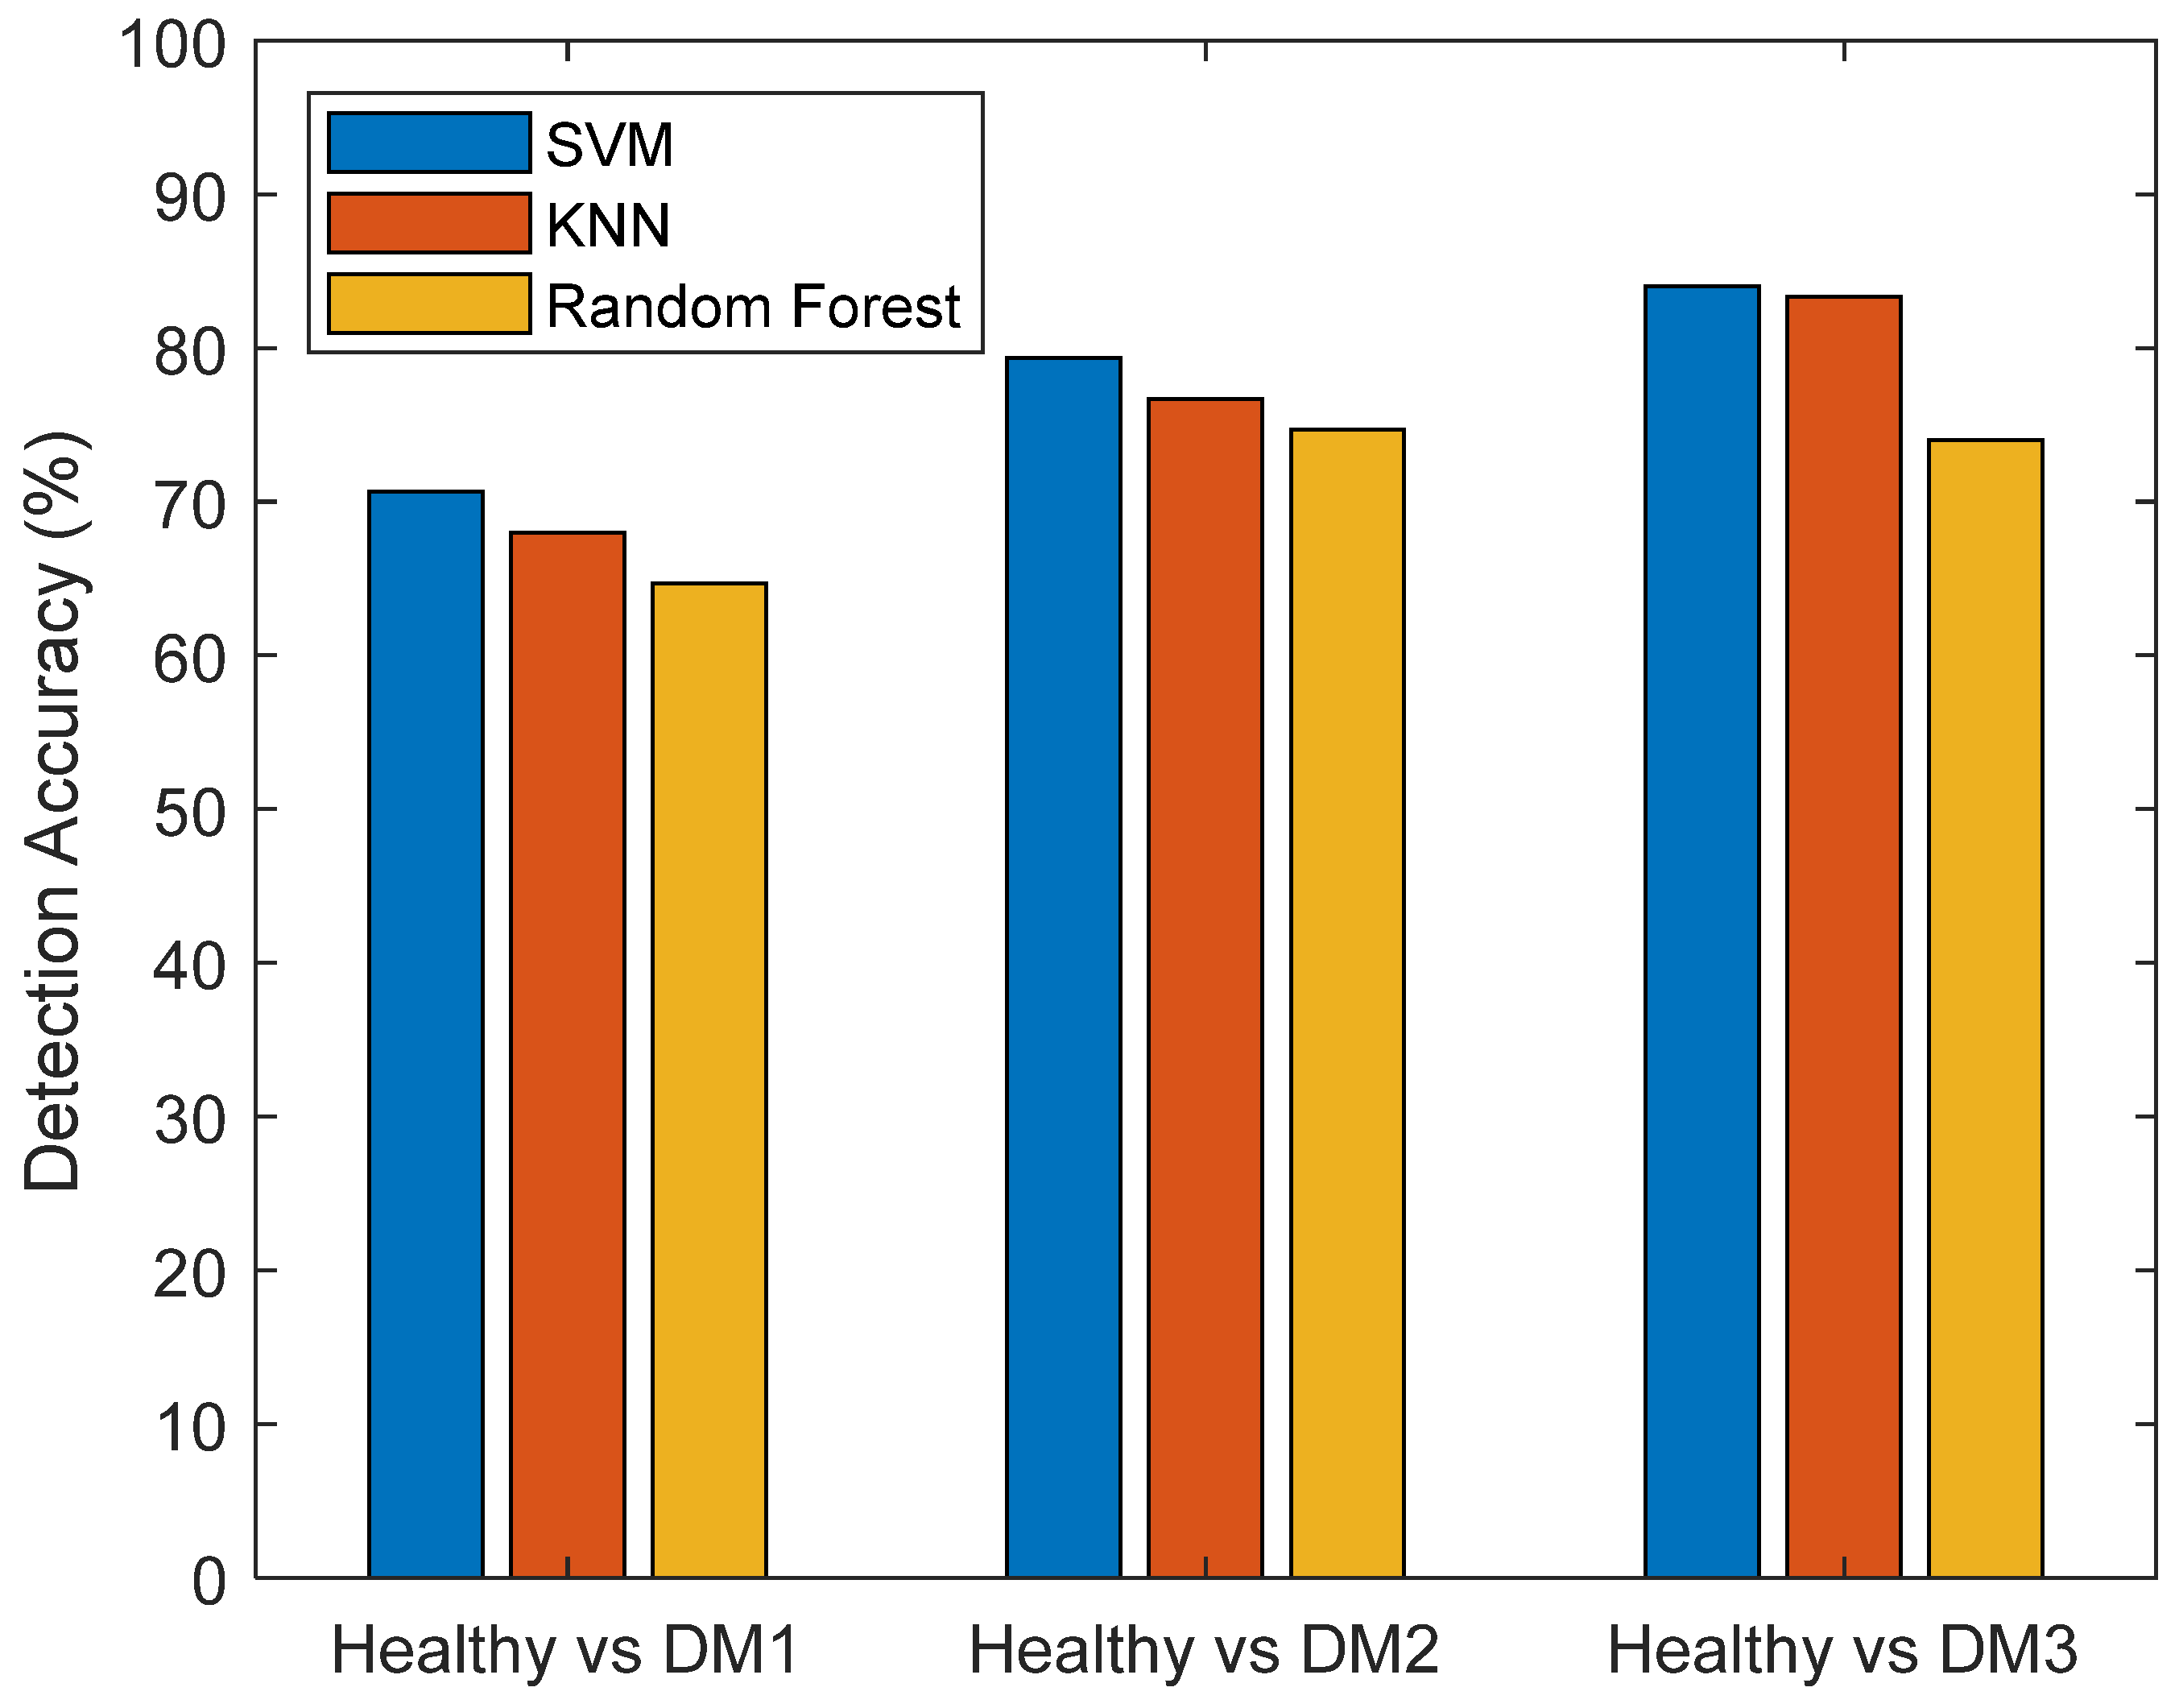
| SVM | 71.3% | 80.7% | 85.3% | Kerna function: Gaussian Kernel scale: 0.25 Box constraint: 1 Standardized data |
| KNN | 67.3% | 78.7% | 84.1% | Number of neighbors: 10 Distance metric: Euclidean Standardized data |
| Random Forest | 64.1% | 74.2% | 74.6% | Number of decision trees: 100 Number of predictors to sample: 2 Min. leaf size: 1 |
Disclaimer/Publisher’s Note: The statements, opinions and data contained in all publications are solely those of the individual author(s) and contributor(s) and not of MDPI and/or the editor(s). MDPI and/or the editor(s) disclaim responsibility for any injury to people or property resulting from any ideas, methods, instructions or products referred to in the content. |
© 2024 by the authors. Licensee MDPI, Basel, Switzerland. This article is an open access article distributed under the terms and conditions of the Creative Commons Attribution (CC BY) license (https://creativecommons.org/licenses/by/4.0/).
Share and Cite
Liu, B.; Fernandez, M.A.; Liu, T.M.; Ding, S. Investigation of Using Hyperspectral Vegetation Indices to Assess Brassica Downy Mildew. Sensors 2024, 24, 1916. https://doi.org/10.3390/s24061916
Liu B, Fernandez MA, Liu TM, Ding S. Investigation of Using Hyperspectral Vegetation Indices to Assess Brassica Downy Mildew. Sensors. 2024; 24(6):1916. https://doi.org/10.3390/s24061916
Chicago/Turabian StyleLiu, Bo, Marco Antonio Fernandez, Taryn Michelle Liu, and Shunping Ding. 2024. "Investigation of Using Hyperspectral Vegetation Indices to Assess Brassica Downy Mildew" Sensors 24, no. 6: 1916. https://doi.org/10.3390/s24061916
APA StyleLiu, B., Fernandez, M. A., Liu, T. M., & Ding, S. (2024). Investigation of Using Hyperspectral Vegetation Indices to Assess Brassica Downy Mildew. Sensors, 24(6), 1916. https://doi.org/10.3390/s24061916