
Assessing the Validity of the Ergotex IMU in Joint Angle Measurement: A Comparative Study with Optical Tracking Systems


Abstract
1. Introduction
2. Materials and Methods
2.1. Study Design
2.2. Instrumentation
2.2.1. Ergotex
2.2.2. Optical Tracking System
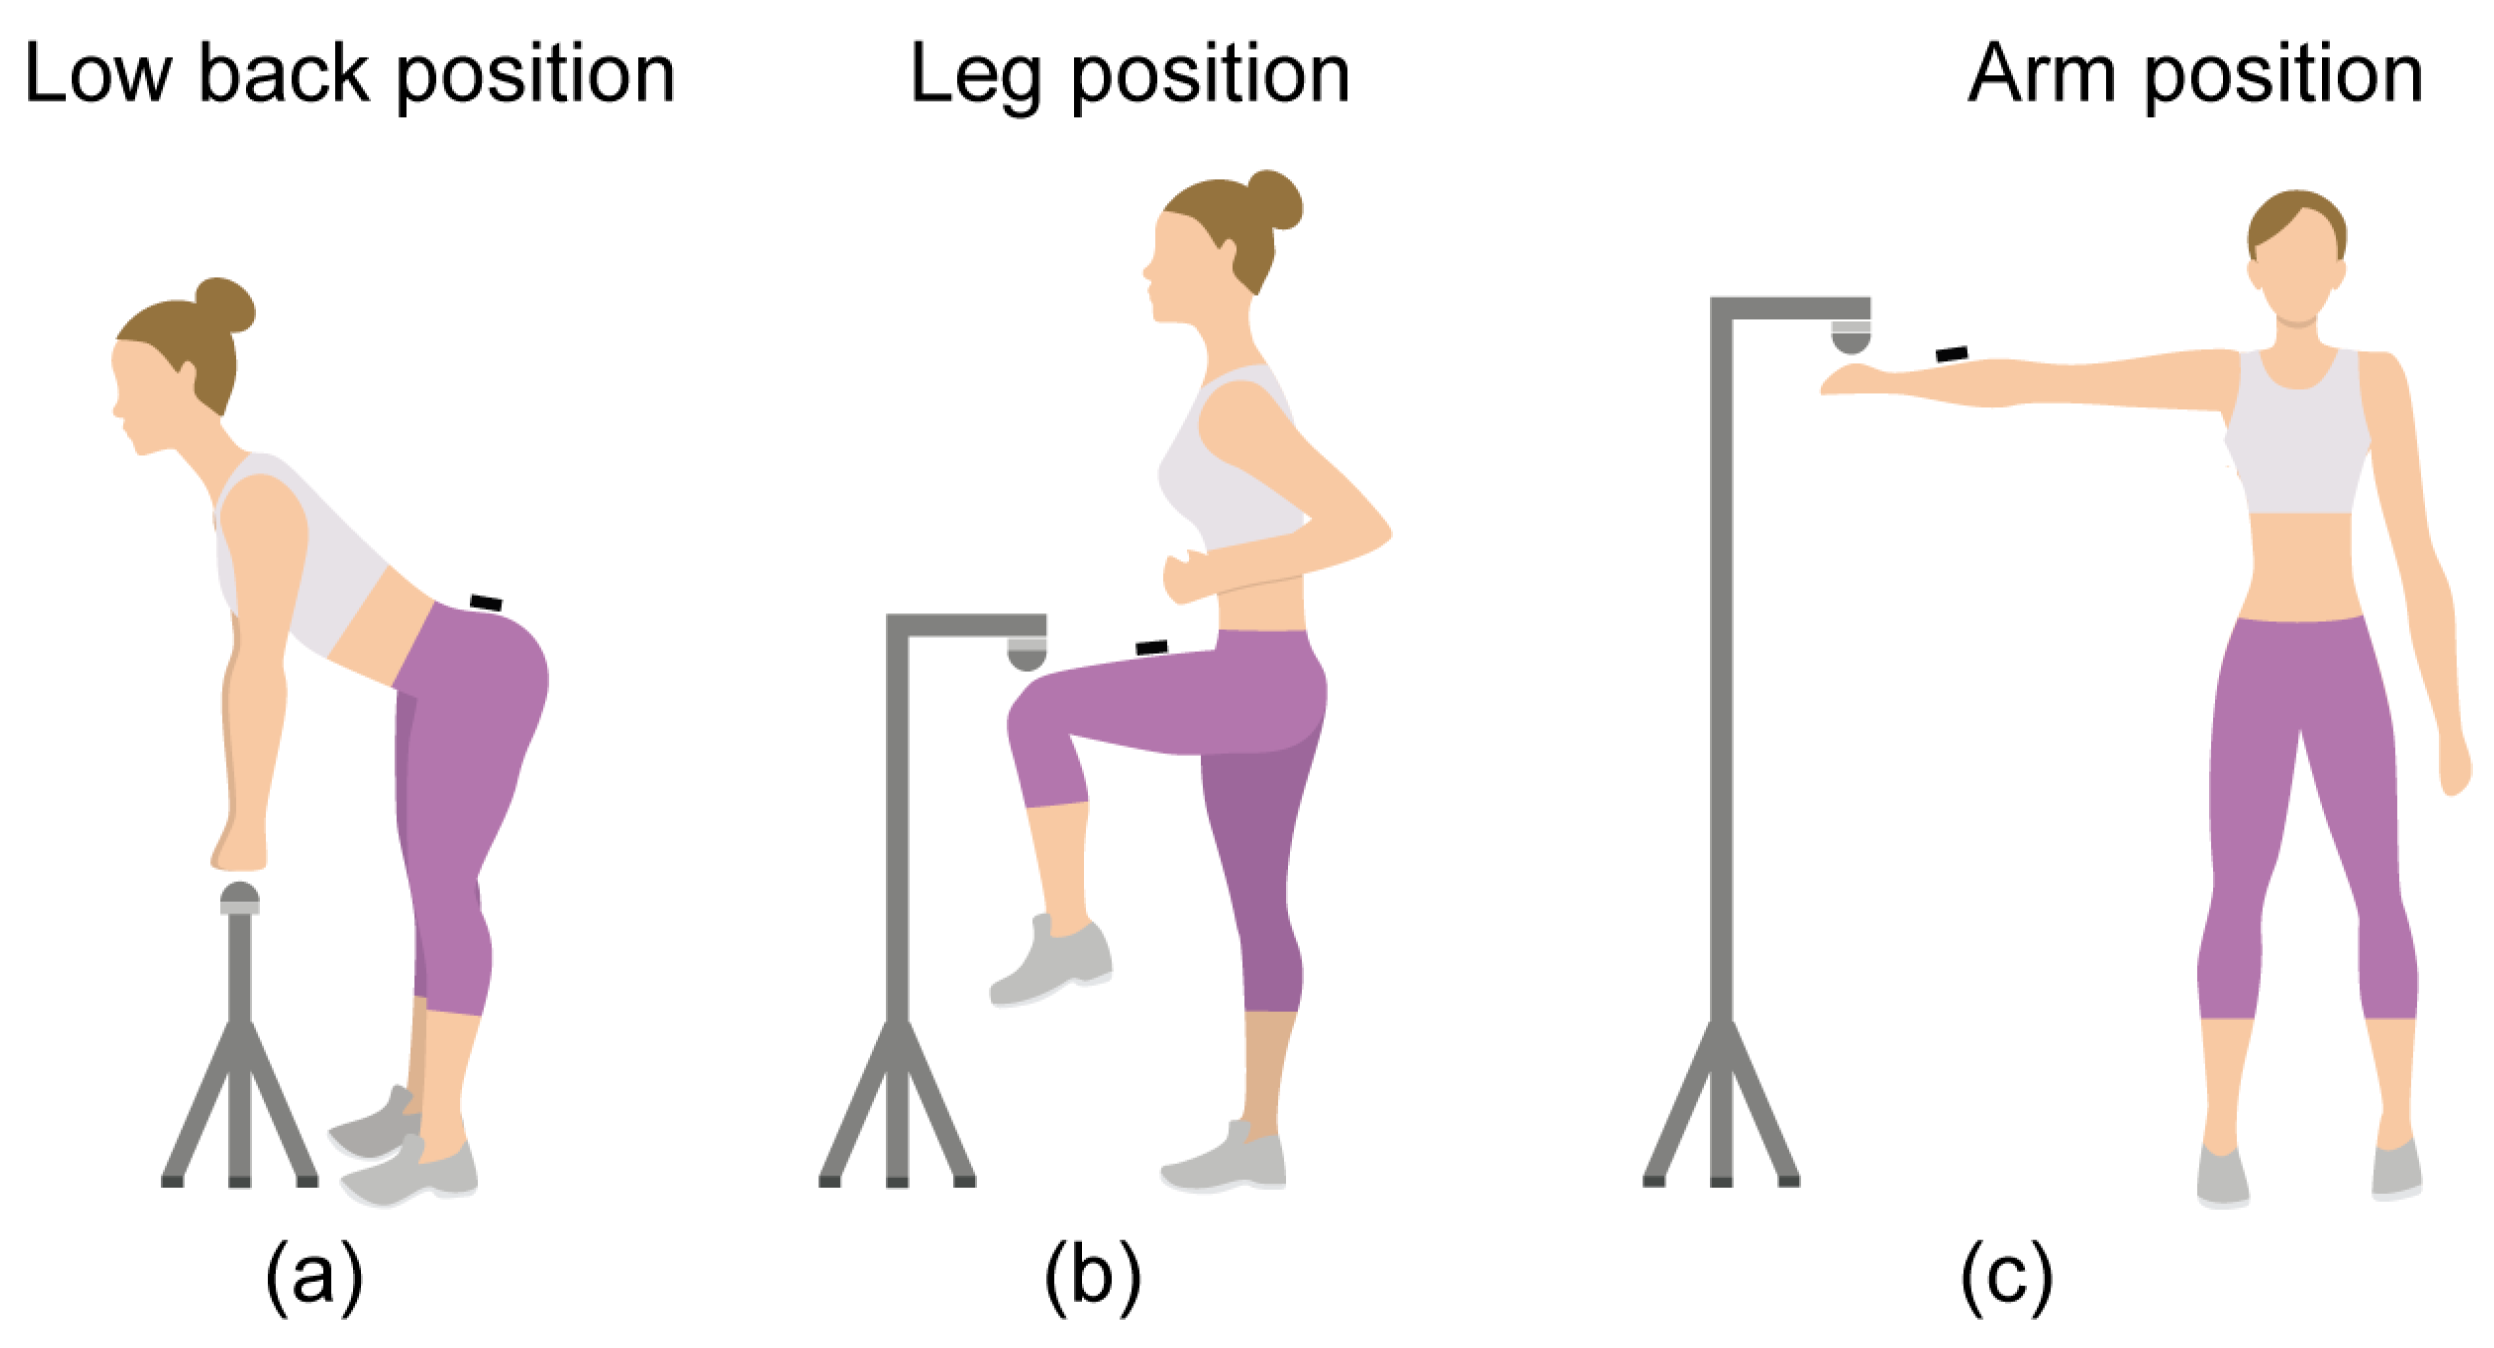
2.3. Procedure
2.4. Participants
2.5. Statistical Analysis
3. Results
4. Discussion
5. Conclusions
Author Contributions
Funding
Institutional Review Board Statement
Informed Consent Statement
Data Availability Statement
Conflicts of Interest
References
- Valevicius, A.M.; Jun, P.Y.; Hebert, J.S.; Vette, A.H. Use of Optical Motion Capture for the Analysis of Normative Upper Body Kinematics during Functional Upper Limb Tasks: A Systematic Review. J. Electromyogr. Kinesiol. 2018, 40, 1–15. [Google Scholar] [CrossRef]
- Poitras, I.; Dupuis, F.; Bielmann, M.; Campeau-Lecours, A.; Mercier, C.; Bouyer, L.J.; Roy, J.S. Validity and Reliability Ofwearable Sensors for Joint Angle Estimation: A Systematic Review. Sensors 2019, 19, 1555. [Google Scholar] [CrossRef] [PubMed]
- Godfrey, A.; Conway, R.; Meagher, D.; Ólaighin, G. Direct Measurement of Human Movement by Accelerometry. Med. Eng. Phys. 2008, 30, 1364–1386. [Google Scholar] [CrossRef] [PubMed]
- Lebel, K.; Boissy, P.; Nguyen, H.; Duval, C. Inertial Measurement Systems for Segments and Joints Kinematics Assessment: Towards an Understanding of the Variations in Sensors Accuracy. Biomed. Eng. Online 2017, 16, 56. [Google Scholar] [CrossRef]
- Fong, D.T.P.; Chan, Y.Y. The Use of Wearable Inertial Motion Sensors in Human Lower Limb Biomechanics Studies: A Systematic Review. Sensors 2010, 10, 11556–11565. [Google Scholar] [CrossRef] [PubMed]
- Reenalda, J.; Maartens, E.; Homan, L.; Buurke, J.H. (Jaap. Continuous Three Dimensional Analysis of Running Mechanics during a Marathon by Means of Inertial Magnetic Measurement Units to Objectify Changes in Running Mechanics. J. Biomech. 2016, 49, 3362–3367. [Google Scholar] [CrossRef] [PubMed]
- Walmsley, C.P.; Williams, S.A.; Grisbrook, T.; Elliott, C.; Imms, C.; Campbell, A. Measurement of Upper Limb Range of Motion Using Wearable Sensors: A Systematic Review. Sport. Med. Open 2018, 4, 53. [Google Scholar] [CrossRef] [PubMed]
- Cuesta-Vargas, A.I.; Galán-Mercant, A.; Williams, J.M. The Use of Inertial Sensors System for Human Motion Analysis. Phys. Ther. Rev. 2010, 15, 462–473. [Google Scholar] [CrossRef]
- Kok, M.; Schon, T.B. Magnetometer Calibration Using Inertial Sensors. IEEE Sens. J. 2016, 16, 5679–5689. [Google Scholar] [CrossRef]
- Saravanan, P.; Yao, J.; Menold, J. Portable Gait Analysis System with an Integration of Kinect Sensor and Inertial Measurement Units. Proc. Int. Symp. Hum. Factors Ergon. Health Care 2020, 9, 73–78. [Google Scholar] [CrossRef]
- Cortell-Tormo, J.M.; Garcia-Jaen, M.; Ruiz-Fernandez, D.; Fuster-Lloret, V. Lumbatex: A Wearable Monitoring System Based on Inertial Sensors to Measure and Control the Lumbar Spine Motion. IEEE Trans. Neural Syst. Rehabil. Eng. 2019, 27, 1644–1653. [Google Scholar] [CrossRef]
- Ramey, L.; Osborne, C.; Kasitinon, D.; Juengst, S. Apps and Mobile Health Technology in Rehabilitation: The Good, the Bad, and the Unknown. Phys. Med. Rehabil. Clin. N. Am. 2019, 30, 485–497. [Google Scholar] [CrossRef]
- Bergamini, E.; Ligorio, G.; Summa, A.; Vannozzi, G.; Cappozzo, A.; Sabatini, A.M. Estimating Orientation Using Magnetic and Inertial Sensors and Different Sensor Fusion Approaches: Accuracy Assessment in Manual and Locomotion Tasks. Sensors 2014, 14, 18625–18649. [Google Scholar] [CrossRef] [PubMed]
- Teufl, W.; Miezal, M.; Taetz, B.; Frohlichi, M.; Bleser, G. Validity of Inertial Sensor Based 3D Joint Kinematics of Static and Dynamic Sport and Physiotherapy Specific Movements. PLoS ONE 2019, 14, e0213064. [Google Scholar] [CrossRef] [PubMed]
- Brice, S.M.; Phillips, E.J.; Millett, E.L.; Hunter, A.; Philippa, B. Comparing Inertial Measurement Units and Marker-Based Biomechanical Models during Dynamic Rotation of the Torso. Eur. J. Sport Sci. 2020, 20, 767–775. [Google Scholar] [CrossRef] [PubMed]
- Cappozzo, A.; Catani, F.; Della Croce, U.; Leardini, A. Position and Orientation in Space of Bones during Movement: Anatomical Frame Definition and Determination. Clin. Biomech. 1995, 10, 171–178. [Google Scholar] [CrossRef] [PubMed]
- Beange, K.H.E.; Chan, A.D.C.; Beaudette, S.M.; Graham, R.B. Concurrent Validity of a Wearable IMU for Objective Assessments of Functional Movement Quality and Control of the Lumbar Spine. J. Biomech. 2019, 97, 109356. [Google Scholar] [CrossRef] [PubMed]
- Wattananon, P.; Ebaugh, D.; Biely, S.A.; Smith, S.S.; Hicks, G.E.; Silfies, S.P. Kinematic Characterization of Clinically Observed Aberrant Movement Patterns in Patients with Non-Specific Low Back Pain: A Cross-Sectional Study. BMC Musculoskelet. Disord. 2017, 18, 455. [Google Scholar] [CrossRef] [PubMed]
- Niswander, W.; Wang, W.; Kontson, K. Optimization of IMU Sensor Placement for the Measurement of Lower Limb Joint Kinematics. Sensors 2020, 20, 5993. [Google Scholar] [CrossRef]
- Chan, L.Y.T.; Chua, C.S.; Chou, S.M.; Seah, R.Y.B.; Huang, Y.; Luo, Y.; Dacy, L.; Bin Abd Razak, H.R. Assessment of Shoulder Range of Motion Using a Commercially Available Wearable Sensor—A Validation Study. mHealth 2022, 8, 30. [Google Scholar] [CrossRef]
- Hopkins, W.G.; Marshall, S.W.; Batterham, A.M.; Hanin, J. Progressive Statistics for Studies in Sports Medicine and Exercise Science. Med. Sci. Sports Exerc. 2009, 41, 3–12. [Google Scholar] [CrossRef] [PubMed]
- Ludbrook, J. Confidence in Altman-Bland Plots: A Critical Review of the Method of Differences. Clin. Exp. Pharmacol. Physiol. 2010, 37, 143–149. [Google Scholar] [CrossRef] [PubMed]
- Hopkins, W.G. A New View of Statistics: A Scale of Magnitudes for Effect Statistics. Sportscience 2018, 8, 1–7. [Google Scholar]
- Pyne, D. Measurement Studies in Sports Science Research. Int. J. Sports Physiol. Perform. 2008, 3, 409–410. [Google Scholar] [CrossRef] [PubMed]
- Hopkins, W. Spreadsheets for Analysis of Validity and Reliability. Sportscience 2015, 19, 36–42. [Google Scholar]
- Ghattas, J.; Jarvis, D.N. Validity of Inertial Measurement Units for Tracking Human Motion: A Systematic Review. Sport. Biomech. 2021, 1–14. [Google Scholar] [CrossRef] [PubMed]
- Fang, Z.; Woodford, S.; Senanayake, D.; Ackland, D. Conversion of Upper-Limb Inertial Measurement Unit Data to Joint Angles: A Systematic Review. Sensors 2023, 23, 6535. [Google Scholar] [CrossRef]
- Barraza Madrigal, J.A.; Cardiel, E.; Rogeli, P.; Leija Salas, L.; Muñoz Guerrero, R. Evaluation of Suitability of a Micro-Processing Unit of Motion Analysis for Upper Limb Tracking. Med. Eng. Phys. 2016, 38, 793–800. [Google Scholar] [CrossRef]
- Cutti, A.G.; Giovanardi, A.; Rocchi, L.; Davalli, A.; Sacchetti, R. Ambulatory Measurement of Shoulder and Elbow Kinematics through Inertial and Magnetic Sensors. Med. Biol. Eng. Comput. 2008, 46, 169–178. [Google Scholar] [CrossRef]
- Mjøsund, H.L.; Boyle, E.; Kjaer, P.; Mieritz, R.M.; Skallgård, T.; Kent, P. Clinically Acceptable Agreement between the ViMove Wireless Motion Sensor System and the Vicon Motion Capture System When Measuring Lumbar Region Inclination Motion in the Sagittal and Coronal Planes. BMC Musculoskelet. Disord. 2017, 18, 124. [Google Scholar] [CrossRef]
- Robert-Lachaine, X.; Mecheri, H.; Larue, C.; Plamondon, A. Validation of Inertial Measurement Units with an Optoelectronic System for Whole-Body Motion Analysis. Med. Biol. Eng. Comput. 2017, 55, 609–619. [Google Scholar] [CrossRef] [PubMed]
- Bauer, C.M.; Rast, F.M.; Ernst, M.J.; Kool, J.; Oetiker, S.; Rissanen, S.M.; Suni, J.H.; Kankaanpää, M. Concurrent Validity and Reliability of a Novel Wireless Inertial Measurement System to Assess Trunk Movement. J. Electromyogr. Kinesiol. 2015, 25, 782–790. [Google Scholar] [CrossRef] [PubMed]
- Bouvier, B.; Duprey, S.; Claudon, L.; Dumas, R.; Savescu, A. Upper Limb Kinematics Using Inertial and Magnetic Sensors: Comparison of Sensor-to-Segment Calibrations. Sensors 2015, 15, 18813–18833. [Google Scholar] [CrossRef] [PubMed]
- Kumar, Y.; Yen, S.C.; Tay, A.; Lee, W.; Gao, F.; Zhao, Z.; Li, J.; Hon, B.; Xu, T.T.M.; Cheong, A.; et al. Wireless Wearable Range-of-Motion Sensor System for Upper and Lower Extremity Joints: A Validation Study. Healthc. Technol. Lett. 2015, 2, 12–17. [Google Scholar] [CrossRef]
- Pérez, R.; Costa, Ú.; Torrent, M.; Solana, J.; Opisso, E.; Cáceres, C.; Tormos, J.M.; Medina, J.; Gómez, E.J. Upper Limb Portable Motion Analysis System Based on Inertial Technology for Neurorehabilitation Purposes. Sensors 2010, 10, 10733–10751. [Google Scholar] [CrossRef]


| Opt | Ergo | Bias | ES | +LoA | −LoA | Int | Slope | r | p | |
|---|---|---|---|---|---|---|---|---|---|---|
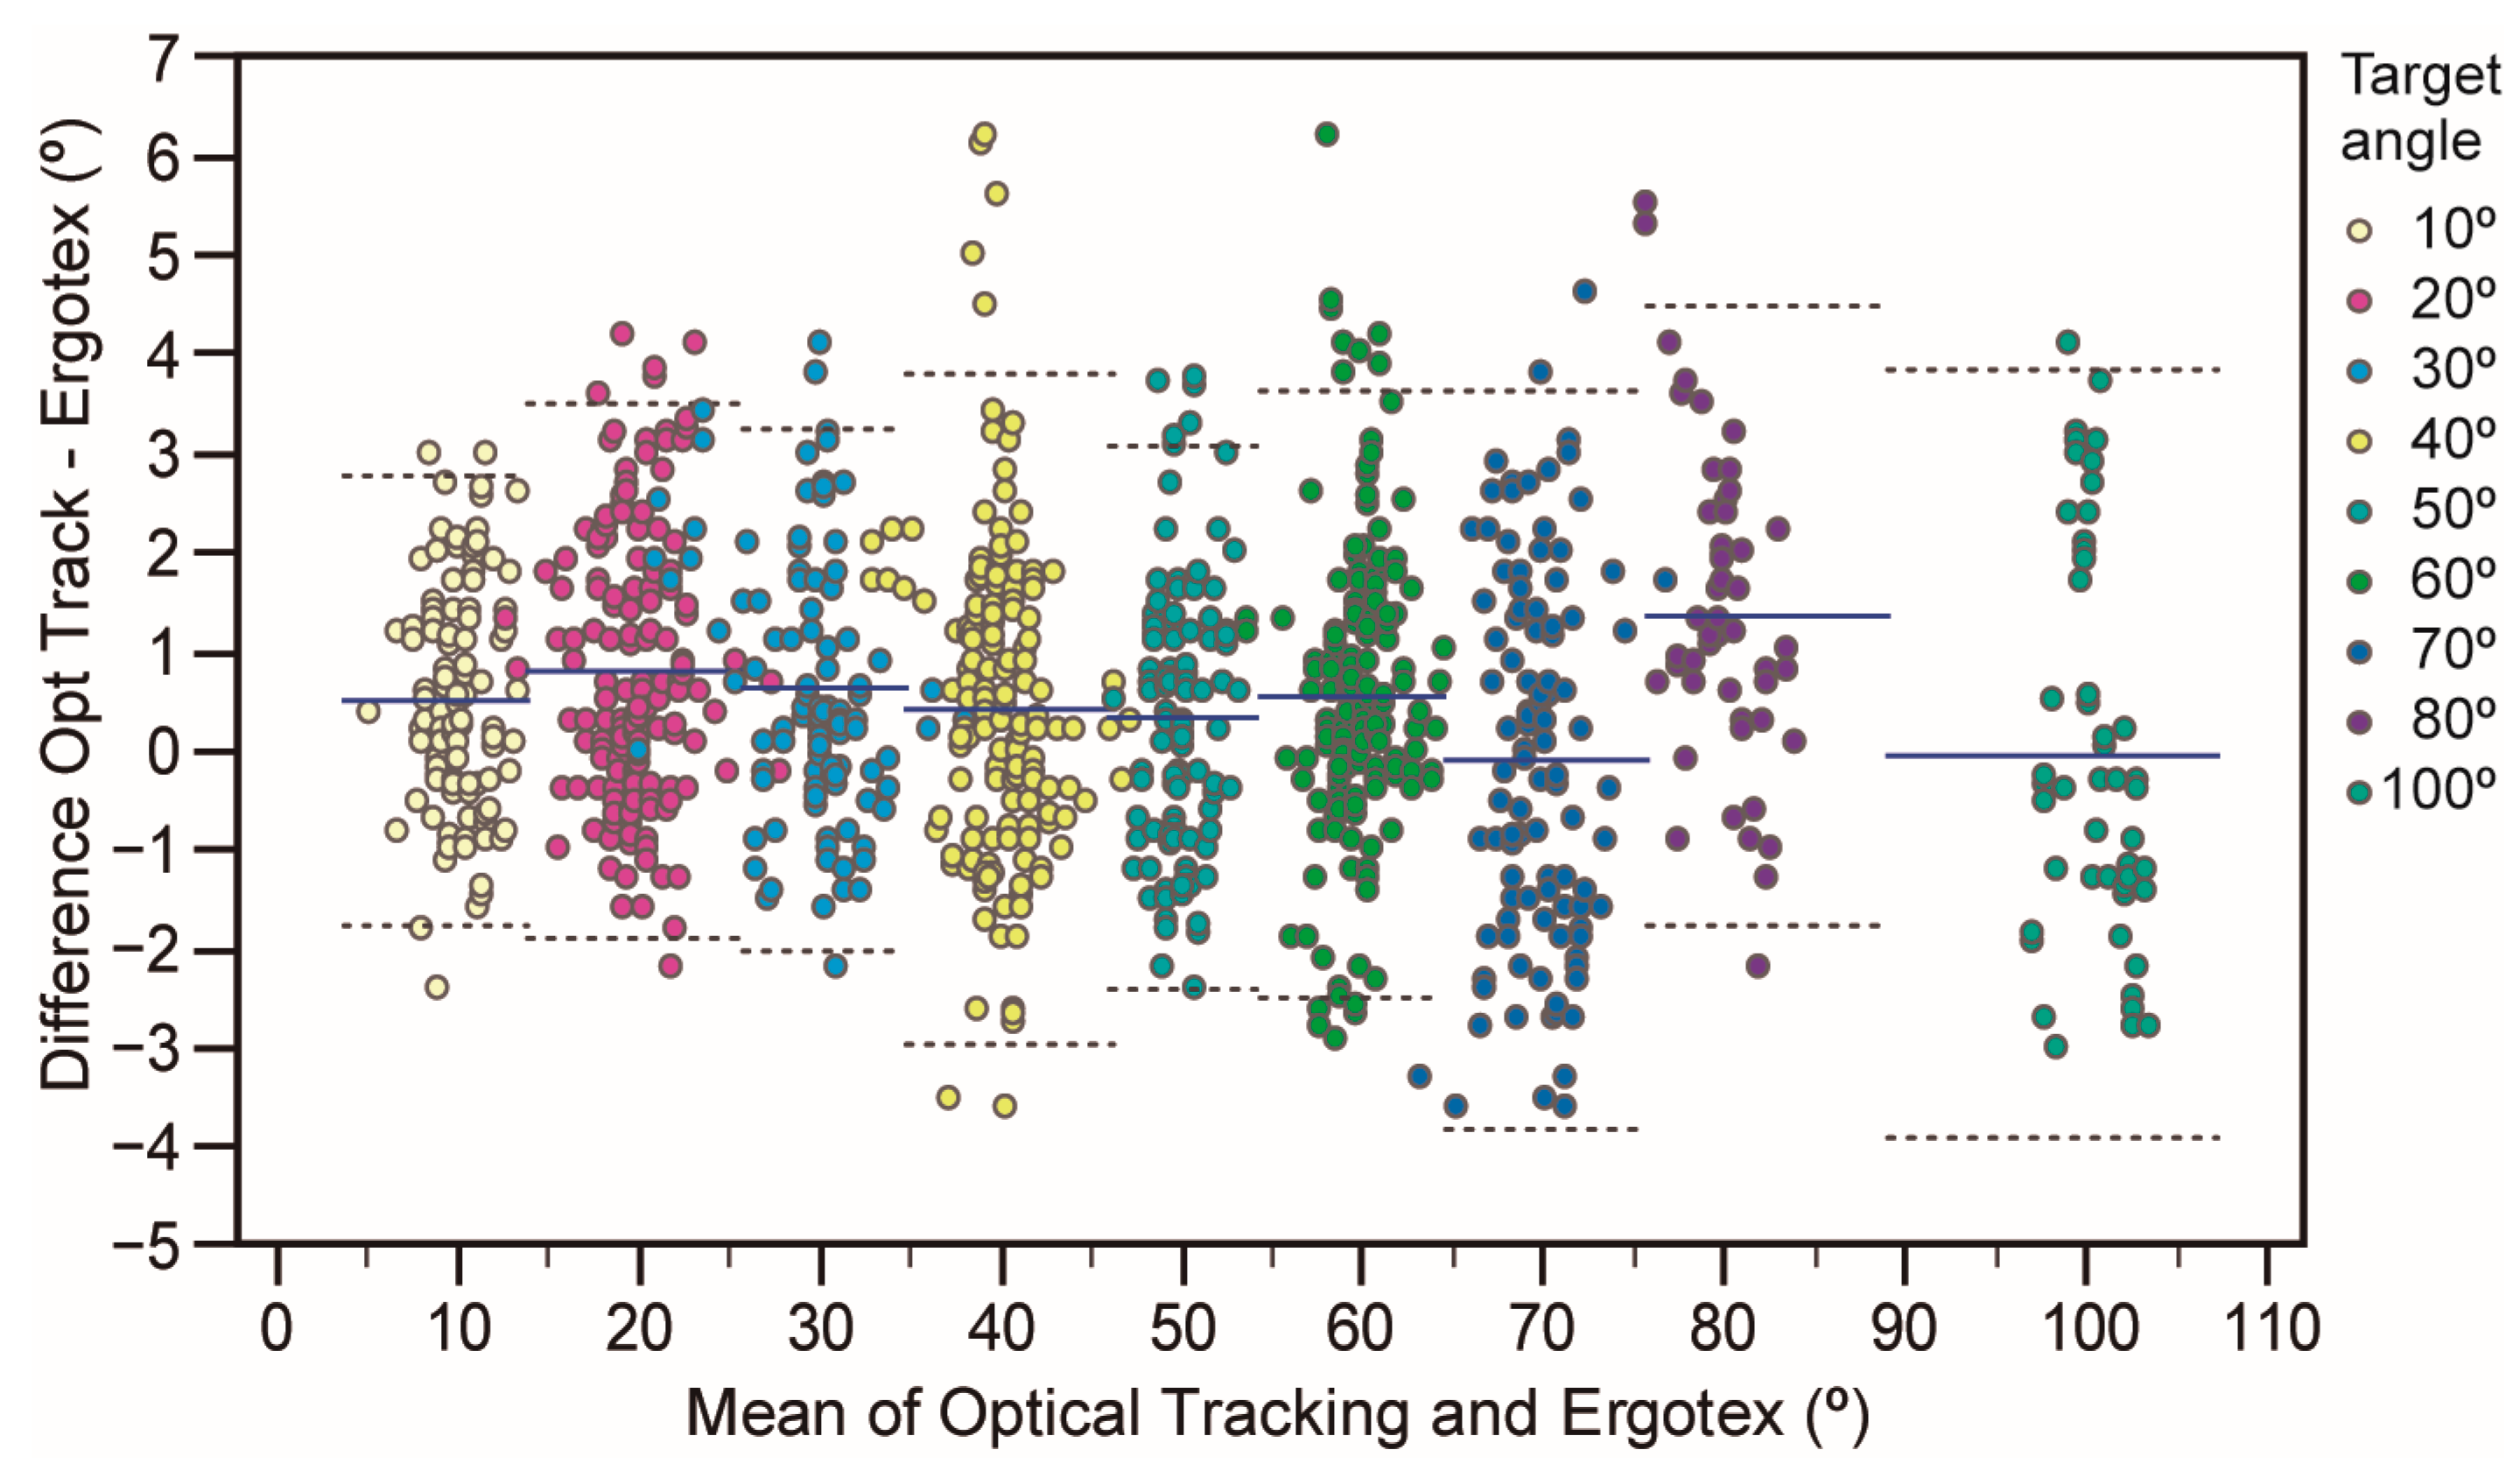
| 10 deg | 10.3 | 9.8 | 0.51 *** | 0.22 S | 2.79 | −1.77 | 0.24 | 0.02 | 0.04 | 0.72 |
| +95%CI | 10.7 | 10.2 | 0.74 | 0.50 S | 3.19 | −1.37 | 3.19 | 1.73 | 0.23 | |
| −95%CI | 10.0 | 9.6 | 0.28 | −0.06 T | 2.40 | −2.16 | 2.40 | −1.25 | −0.16 | |
| 20 deg | 20.3 | 19.6 | 0.79 *** | 0.33 S | 3.49 | −1.90 | 1.07 | −0.01 | −0.02 | 0.78 |
| +95%CI | 20.7 | 19.9 | 0.57 | 0.56 S | 3.88 | −1.53 | 3.00 | 0.08 | 0.14 | |
| −95%CI | 20.0 | 19.1 | 1.01 | 0.10 T | 3.11 | −2.29 | −0.86 | −0.11 | −0.19 | |
| 30 deg | 29.8 | 29.2 | 0.62 *** | 0.19 T | 3.25 | −2.00 | 4.19 | −0.12 | −0.28 | <0.01 |
| +95%CI | 30.4 | 29.9 | 0.89 | 0.47 S | 3.71 | −1.55 | 6.65 | −0.04 | −0.09 | |
| −95%CI | 29.2 | 28.5 | 0.36 | −0.08 T | 2.79 | −2.46 | 1.73 | −0.20 | −0.45 | |
| 40 deg | 40.3 | 39.9 | 0.43 ** | 0.18 T | 3.82 | −2.96 | 7.01 | −0.16 | −0.22 | <0.05 |
| +95%CI | 40.7 | 40.3 | 0.71 | 0.41 S | 4.29 | −2.48 | 11.80 | −0.04 | −0.06 | |
| −95%CI | 39.9 | 39.5 | 0.15 | −0.05 T | 3.34 | −3.44 | 2.23 | −0.28 | −0.37 | |
| 50 deg | 50.2 | 49.8 | 0.34 * | 0.18 T | 3.08 | −2.40 | −6.68 | 0.14 | 0.14 | 0.17 |
| +95%CI | 50.5 | 50.1 | 0.62 | 0.46 S | 3.56 | −1.92 | 3.45 | 0.34 | 0.32 | |
| −95%CI | 49.9 | 49.6 | 0.06 | −0.10 T | 2.61 | −2.87 | −16.81 | −0.06 | −0.01 | |
| 60 deg | 60.1 | 59.6 | 0.56 *** | 0.28 S | 3.62 | −2.50 | −5.16 | 0.09 | 0.11 | 0.17 |
| +95%CI | 60.5 | 59.9 | 0.81 | 0.51 S | 4.06 | −2.07 | 3.07 | 0.23 | 0.27 | |
| −95%CI | 59.8 | 59.3 | 0.31 | 0.05 T | 3.19 | −2.93 | −13.40 | −0.04 | −0.05 | |
| 70 deg | 69.7 | 69.8 | −0.10 | −0.04 T | 3.63 | −3.83 | −3.95 | 0.05 | 0.06 | 0.55 |
| +95%CI | 70.2 | 70.3 | 0.27 | 0.23 S | 4.28 | −3.18 | 8.67 | 0.23 | 0.25 | |
| −95%CI | 69.3 | 69.4 | −0.47 | −0.32 S | 2.98 | −4.48 | −16.57 | −0.12 | −0.14 | |
| 80 deg | 80.7 | 79.3 | 1.37 *** | 0.64 M | 4.50 | −1.74 | 33.91 | −0.41 | −0.51 | <0.01 |
| +95%CI | 81.2 | 80.0 | 1.83 | 1.04 M | 5.28 | −0.97 | 49.93 | −0.21 | −0.27 | |
| −95%CI | 80.2 | 78.6 | 0.92 | 0.23 S | 3.72 | −3.91 | 17.88 | −0.61 | −0.68 | |
| 100 deg | 100.6 | 100.6 | −0.03 | −0.01 T | 3.84 | −2.93 | 29.57 | −0.29 | −0.27 | 0.06 |
| +95%CI | 101.1 | 101.3 | 0.53 | 0.38 S | 4.81 | −4.87 | 60.00 | 0.01 | 0.01 | |
| −95%CI | 100.1 | 99.9 | −0.59 | −0.41 S | 2.88 | −0.00 | −0.86 | −0.59 | −0.51 | |
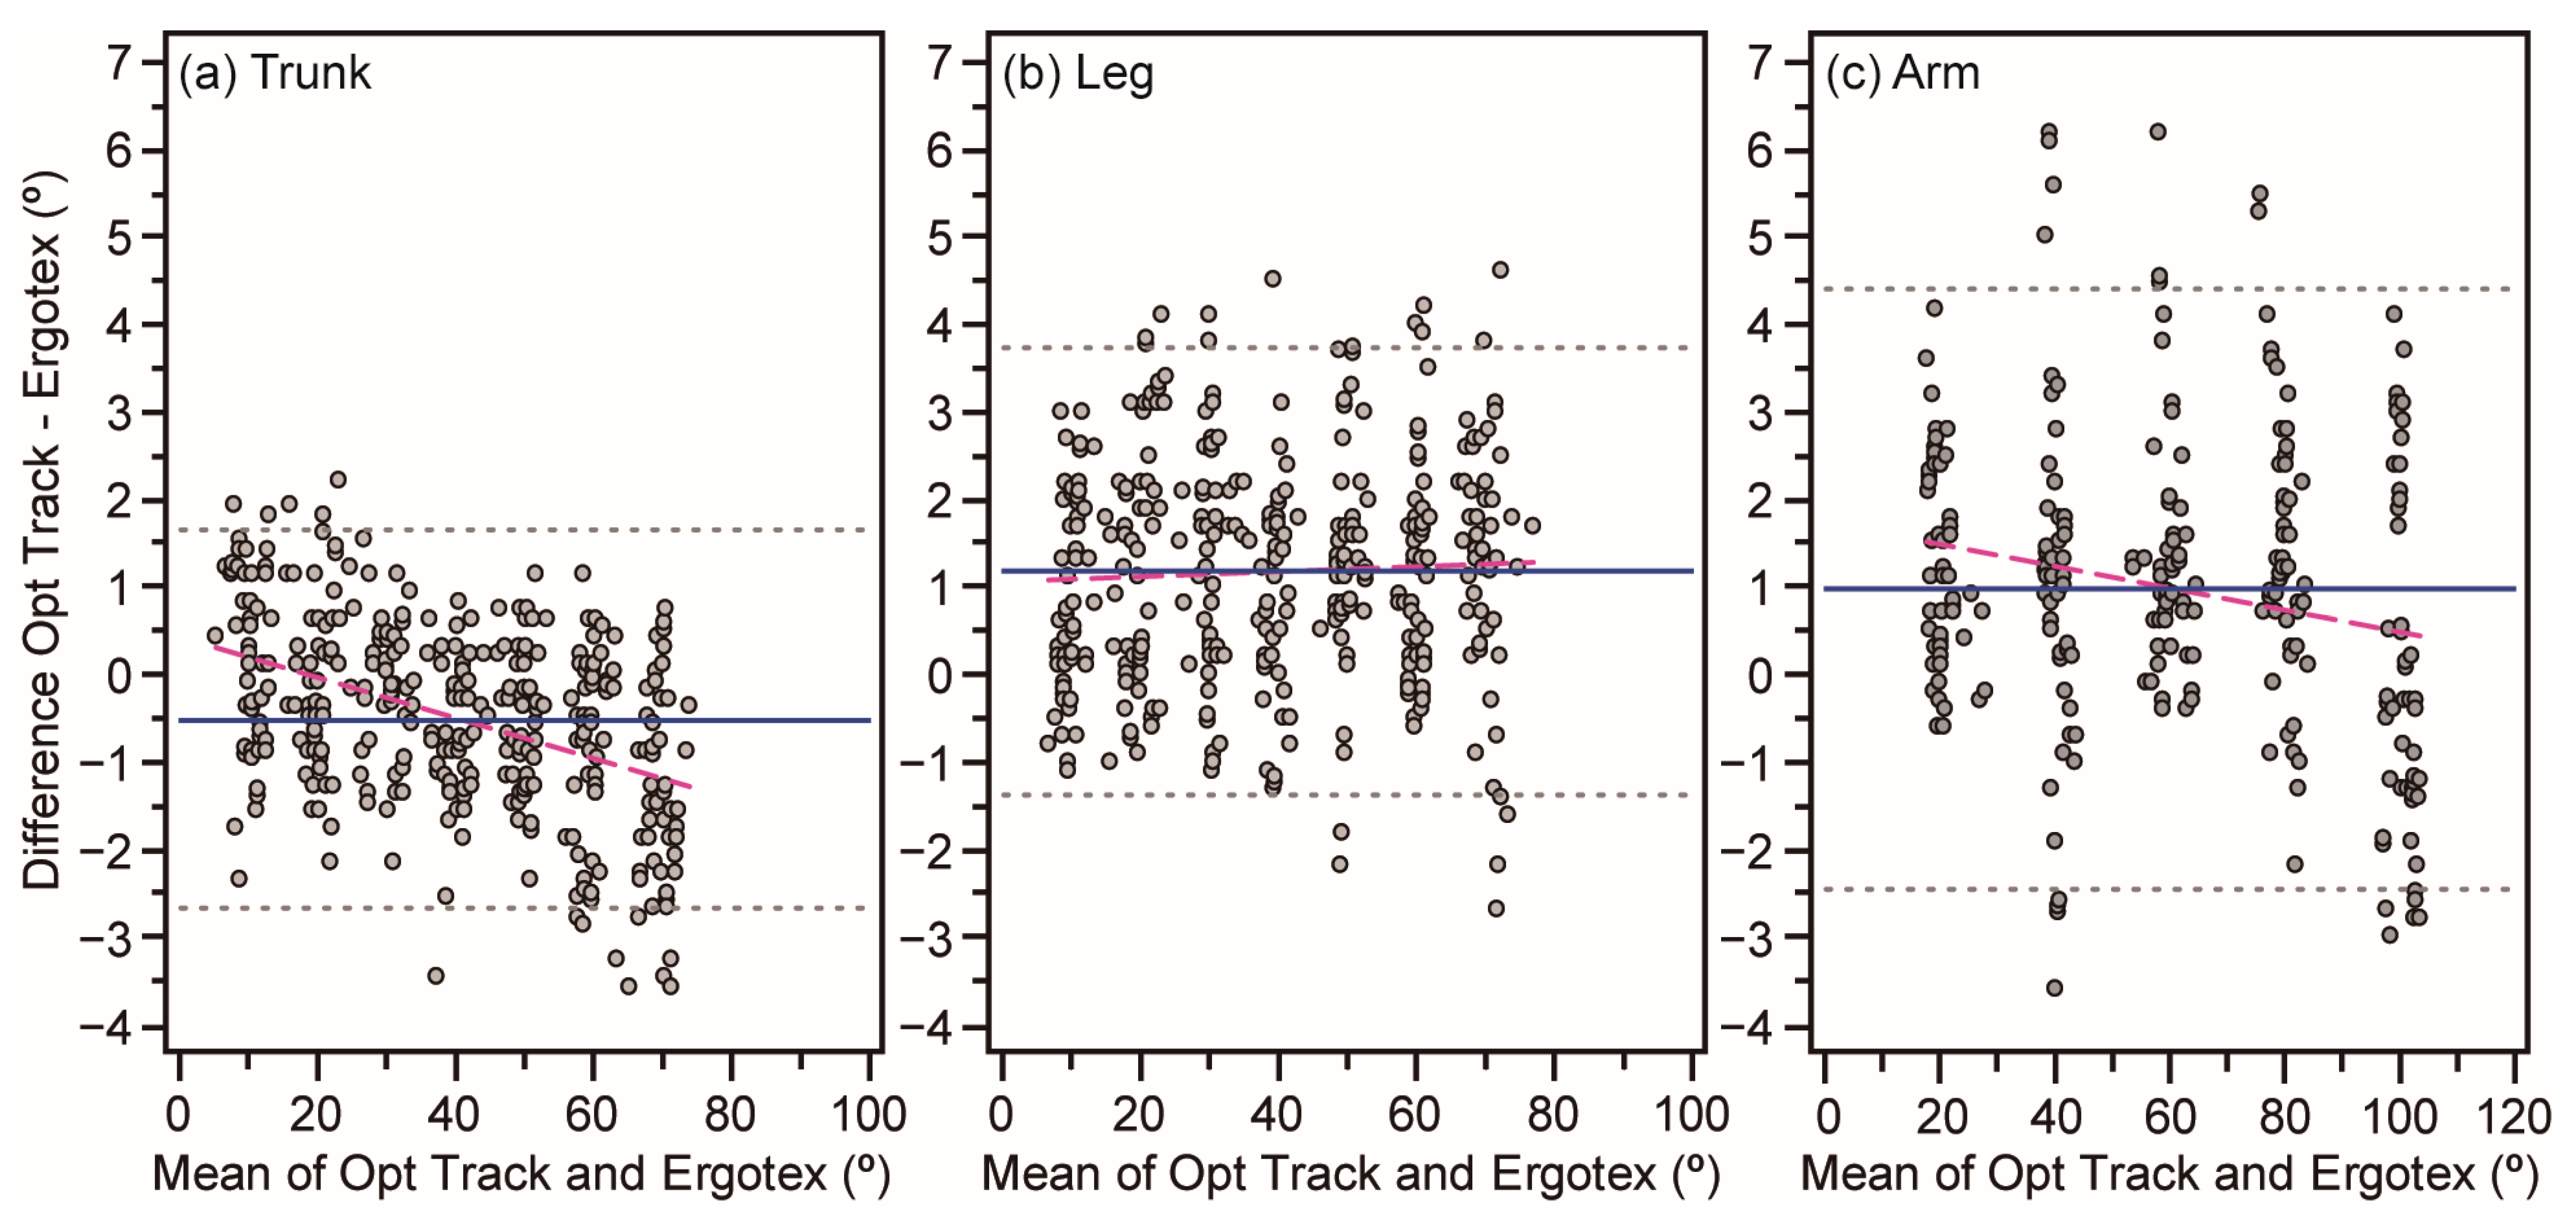
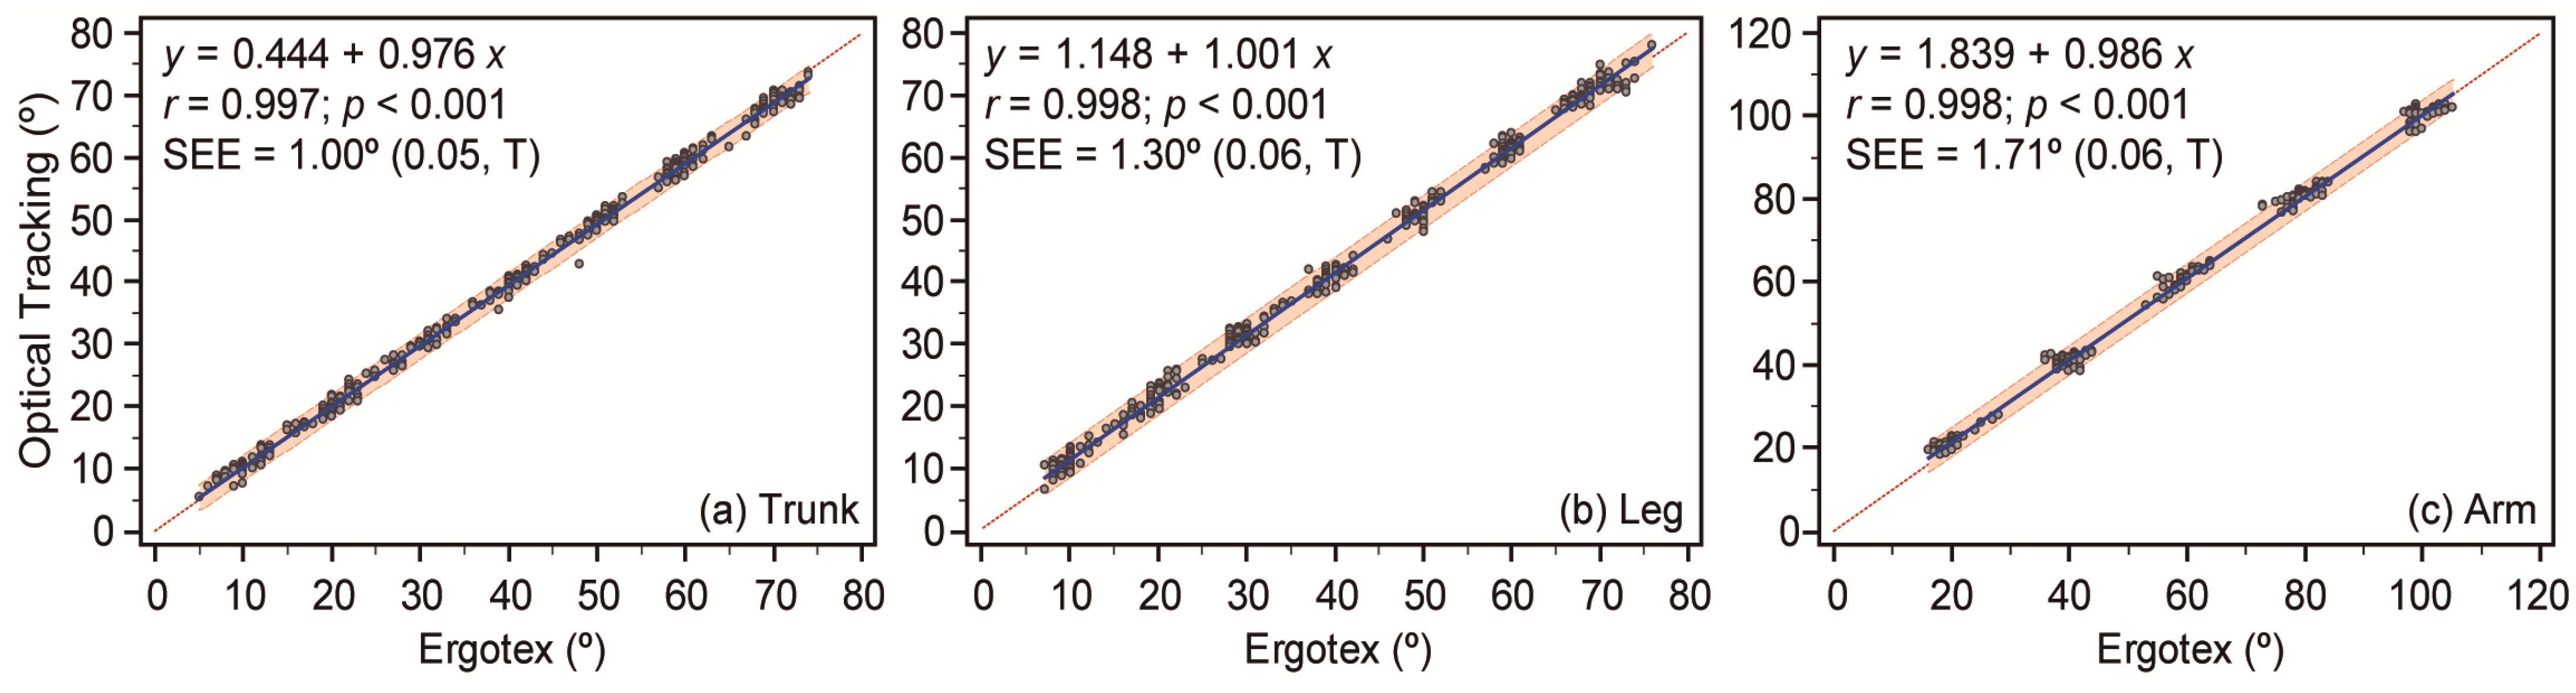
| Trunk | 39.8 | 40.4 | −0.54 *** | −0.02 T | 1.65 | −2.71 | 0.39 | −0.023 | −0.41 | <0.01 |
| +95%CI | 41.9 | 42.5 | −0.42 | 0.13 T | 1.84 | −2.51 | 0.64 | −0.017 | −0.32 | |
| −95%CI | 37.8 | 38.3 | −0.65 | −0.16 T | 1.44 | −2.91 | 0.16 | −0.028 | −0.50 | |
| Leg | 40.1 | 38.9 | 1.17 *** | 0.06 T | 3.73 | −1.38 | 1.06 | 0.003 | 0.05 | 0.41 |
| +95%CI | 42.3 | 41.1 | 1.31 | 0.21 S | 3.96 | −1.14 | 1.36 | 0.009 | 0.15 | |
| −95%CI | 38.0 | 36.8 | 1.04 | −0.14 T | 3.49 | −1.61 | 0.77 | −0.004 | −0.06 | |
| Arm | 60.8 | 59.8 | 0.99 *** | 0.03 T | 4.42 | −2.44 | 1.74 | −0.012 | −0.20 | <0.01 |
| +95%CI | 64.3 | 63.3 | 1.21 | 0.21 S | 4.79 | −2.06 | 2.24 | −0.005 | −0.08 | |
| −95%CI | 57.3 | 56.2 | 0.77 | −0.14 T | 4.05 | −2.81 | 1.24 | −0.020 | −0.32 | |
| Overall | 45.5 | 45.0 | 0.50 *** | 0.02 T | 3.60 | −2.60 | 0.74 | −0.005 | −0.08 | <0.05 |
| +95%CI | 47.0 | 46.5 | 0.59 | 0.11 T | 3.78 | −2.43 | 0.94 | −0.001 | −0.02 | |
| −95%CI | 43.9 | 43.4 | 0.39 | −0.07 T | 3.43 | −2.78 | 0.52 | −0.009 | −0.14 |
Disclaimer/Publisher’s Note: The statements, opinions and data contained in all publications are solely those of the individual author(s) and contributor(s) and not of MDPI and/or the editor(s). MDPI and/or the editor(s) disclaim responsibility for any injury to people or property resulting from any ideas, methods, instructions or products referred to in the content. |
© 2024 by the authors. Licensee MDPI, Basel, Switzerland. This article is an open access article distributed under the terms and conditions of the Creative Commons Attribution (CC BY) license (https://creativecommons.org/licenses/by/4.0/).
Share and Cite
Jimenez-Olmedo, J.M.; Tortosa-Martínez, J.; Cortell-Tormo, J.M.; Pueo, B. Assessing the Validity of the Ergotex IMU in Joint Angle Measurement: A Comparative Study with Optical Tracking Systems. Sensors 2024, 24, 1903. https://doi.org/10.3390/s24061903
Jimenez-Olmedo JM, Tortosa-Martínez J, Cortell-Tormo JM, Pueo B. Assessing the Validity of the Ergotex IMU in Joint Angle Measurement: A Comparative Study with Optical Tracking Systems. Sensors. 2024; 24(6):1903. https://doi.org/10.3390/s24061903
Chicago/Turabian StyleJimenez-Olmedo, Jose M., Juan Tortosa-Martínez, Juan M. Cortell-Tormo, and Basilio Pueo. 2024. "Assessing the Validity of the Ergotex IMU in Joint Angle Measurement: A Comparative Study with Optical Tracking Systems" Sensors 24, no. 6: 1903. https://doi.org/10.3390/s24061903
APA StyleJimenez-Olmedo, J. M., Tortosa-Martínez, J., Cortell-Tormo, J. M., & Pueo, B. (2024). Assessing the Validity of the Ergotex IMU in Joint Angle Measurement: A Comparative Study with Optical Tracking Systems. Sensors, 24(6), 1903. https://doi.org/10.3390/s24061903