
Evaluation of Ground Pressure, Bearing Capacity, and Sinkage in Rigid-Flexible Tracked Vehicles on Characterized Terrain in Laboratory Conditions

Abstract
1. Introduction
2. Materials and Methods
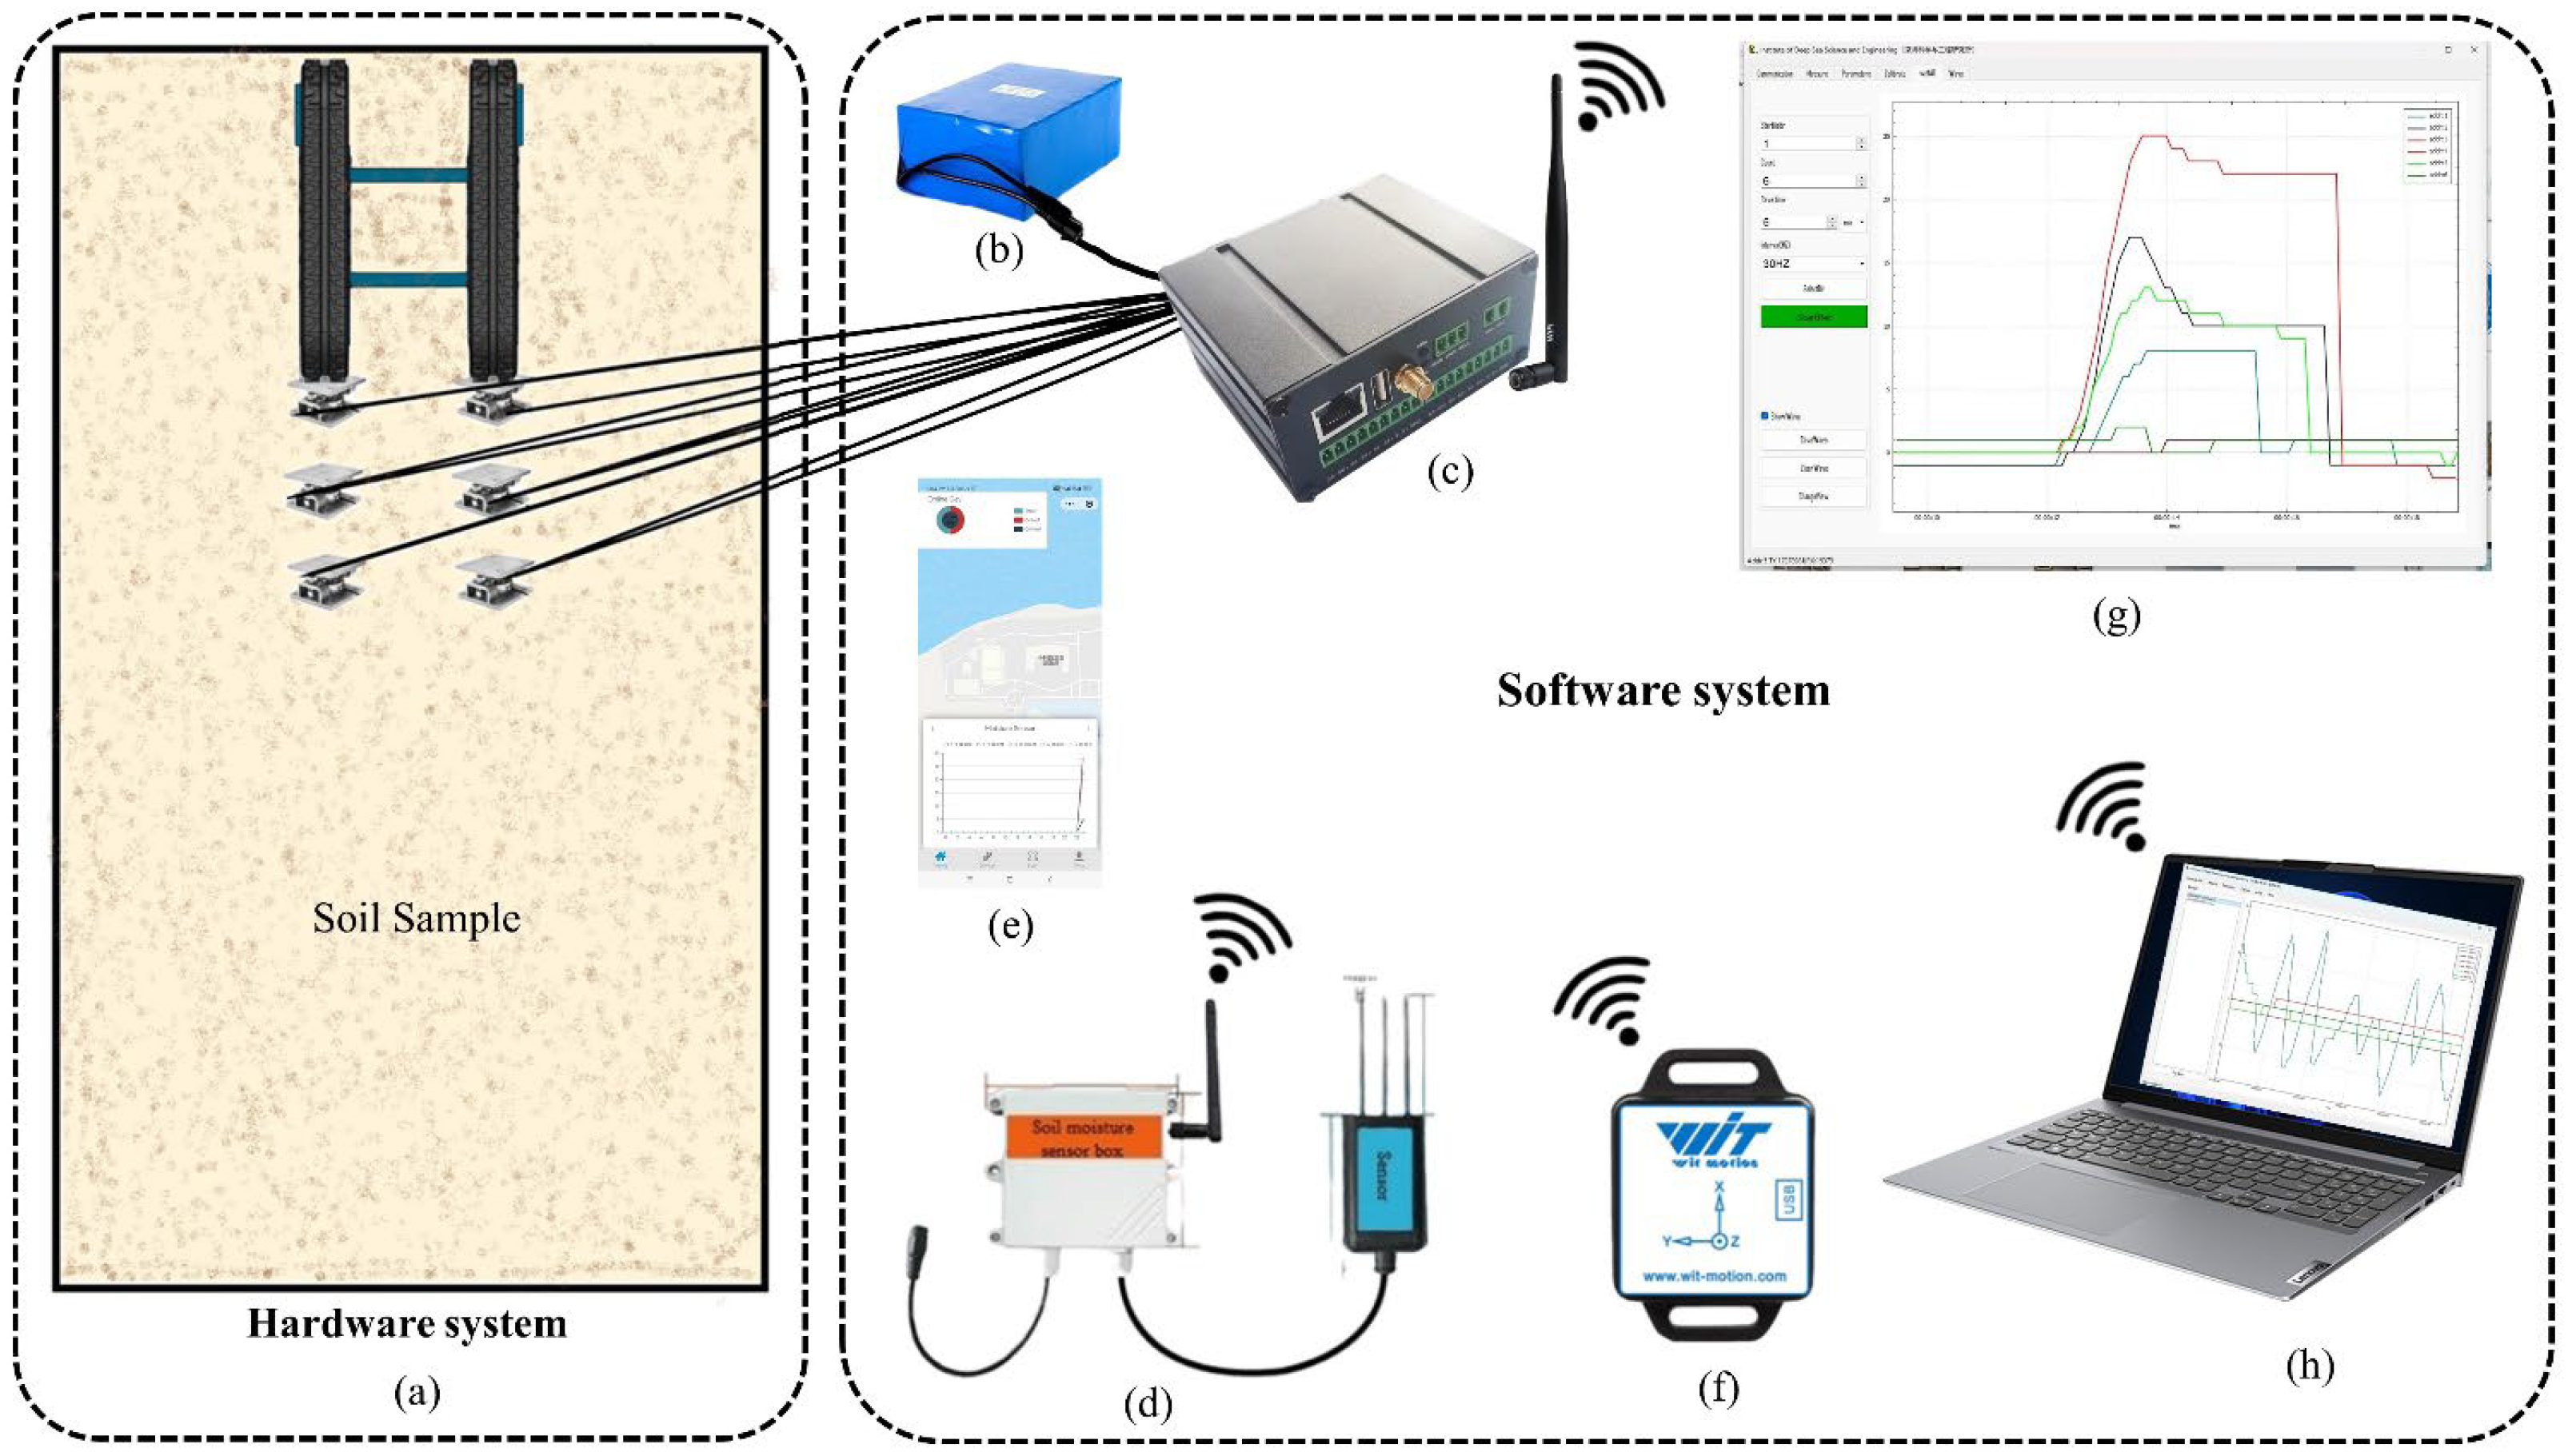
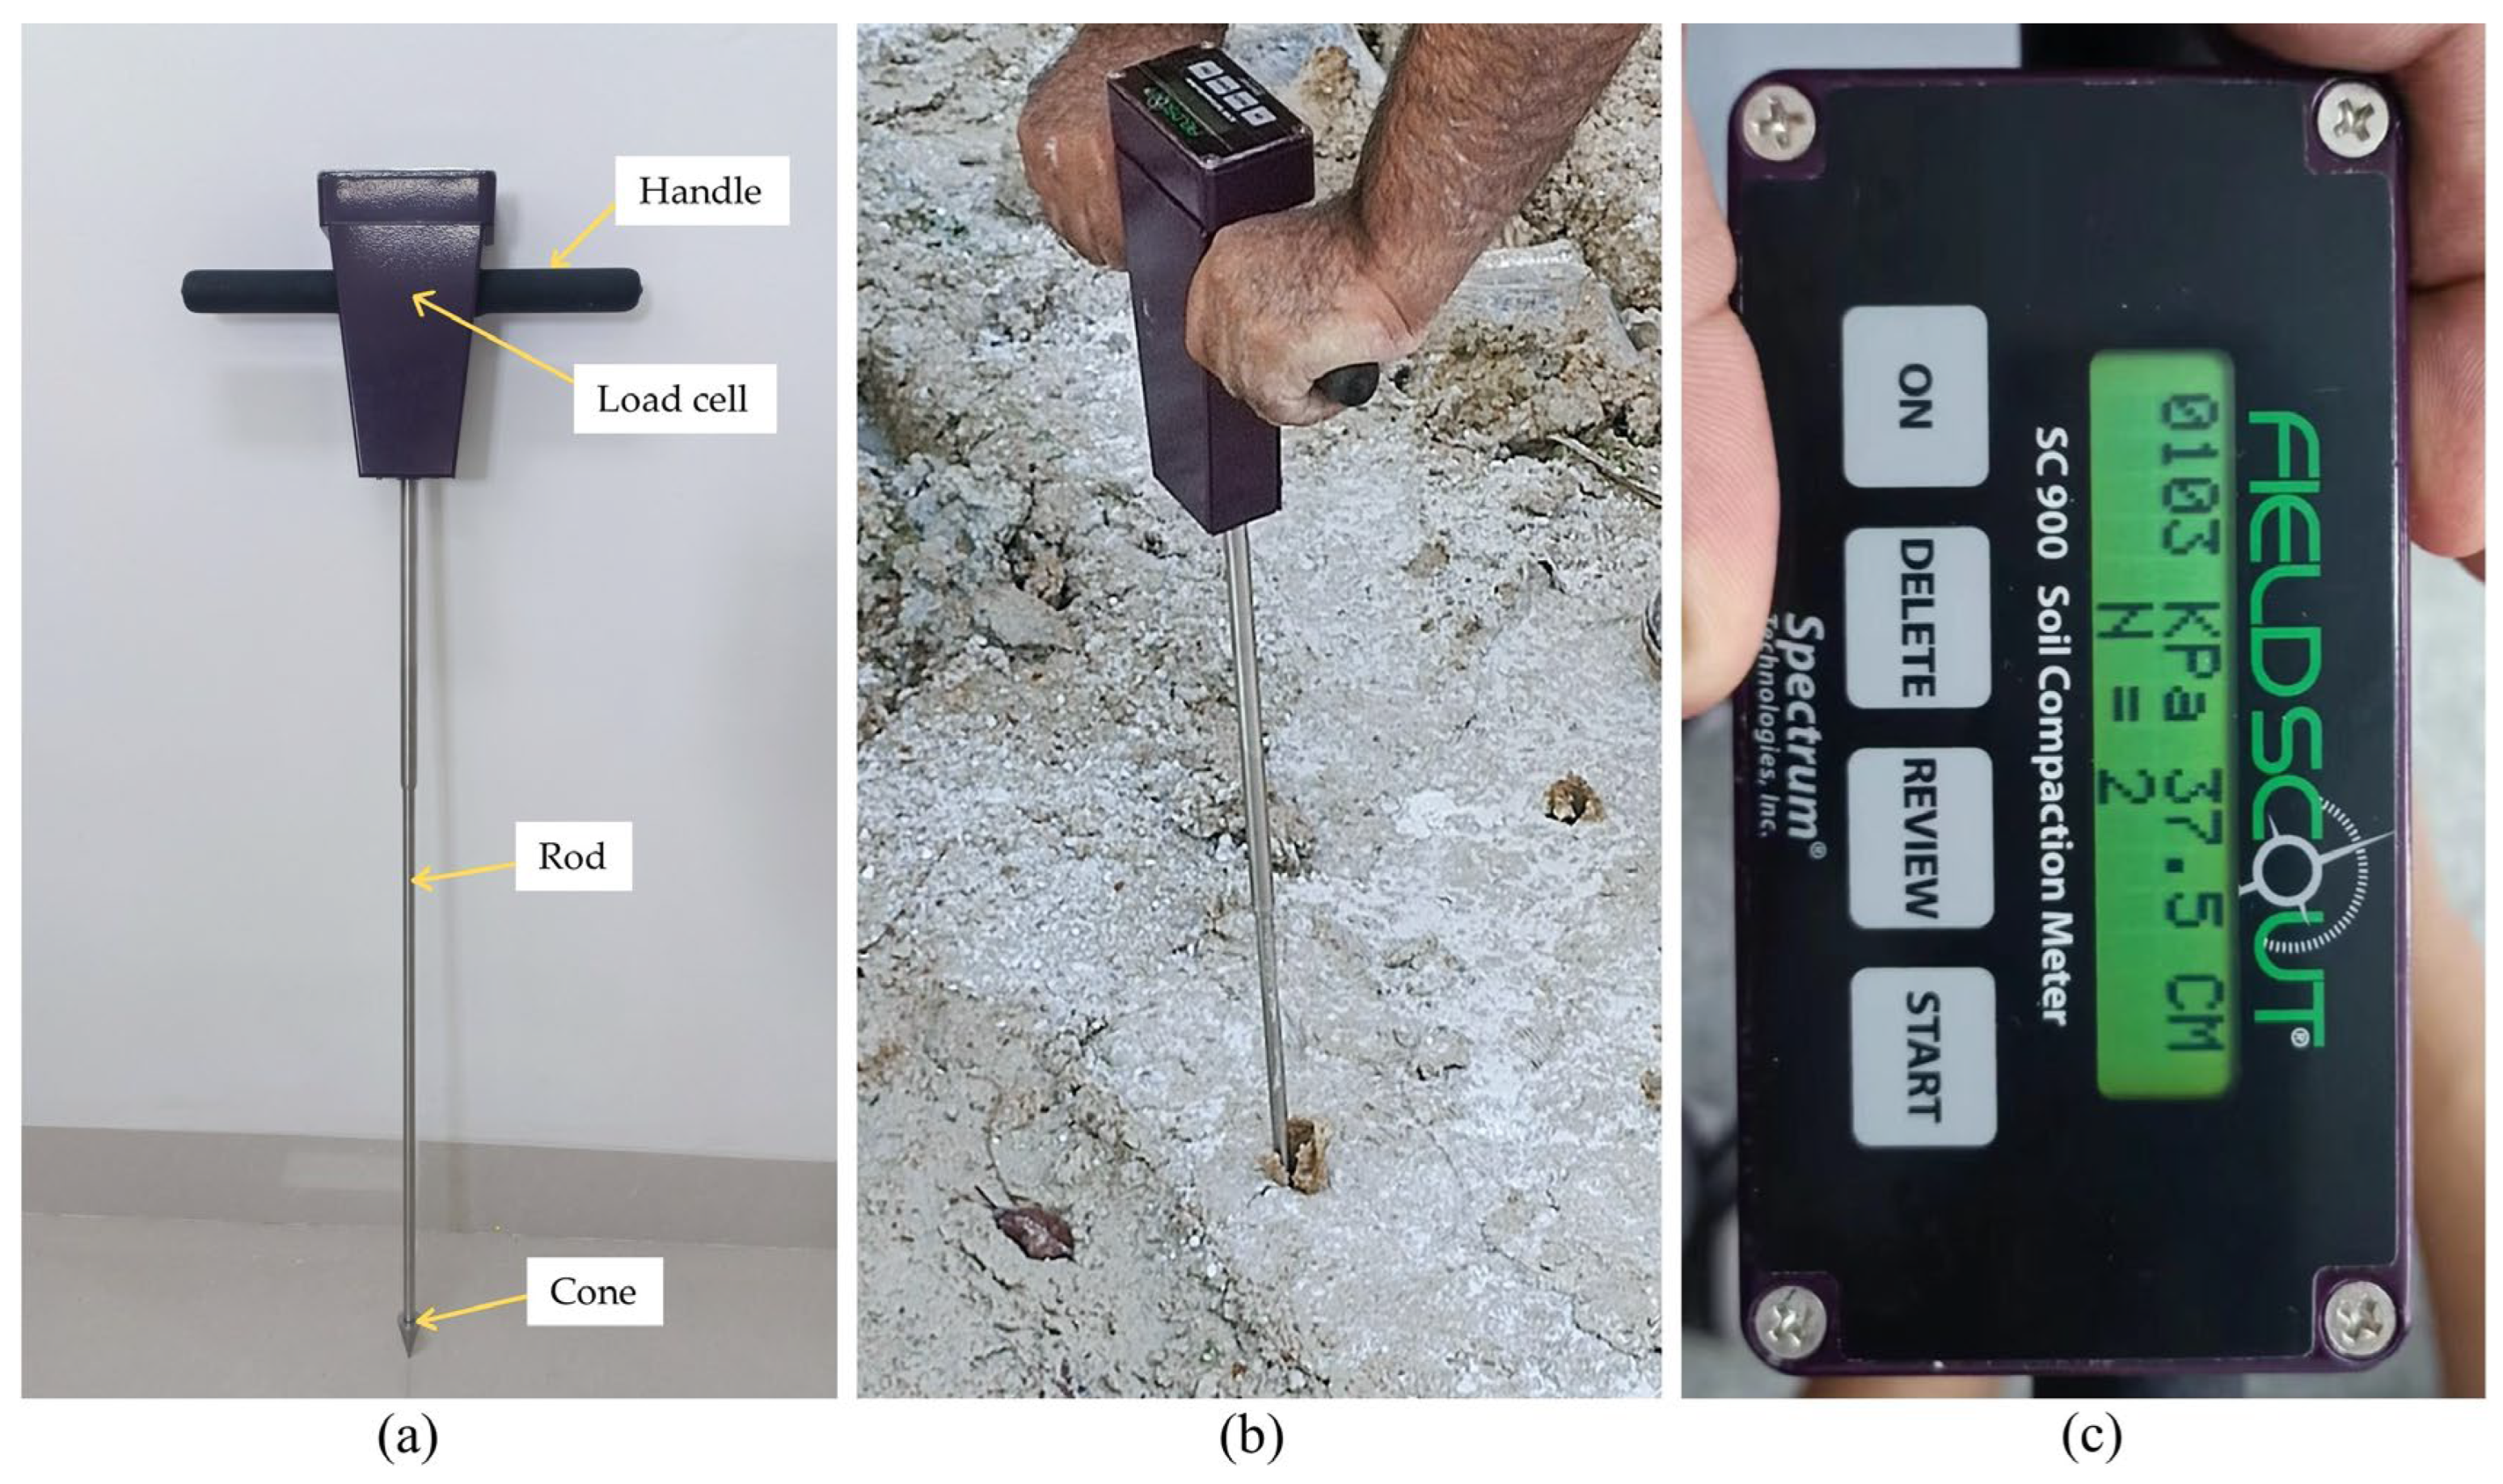
2.1. Tools and Sensors
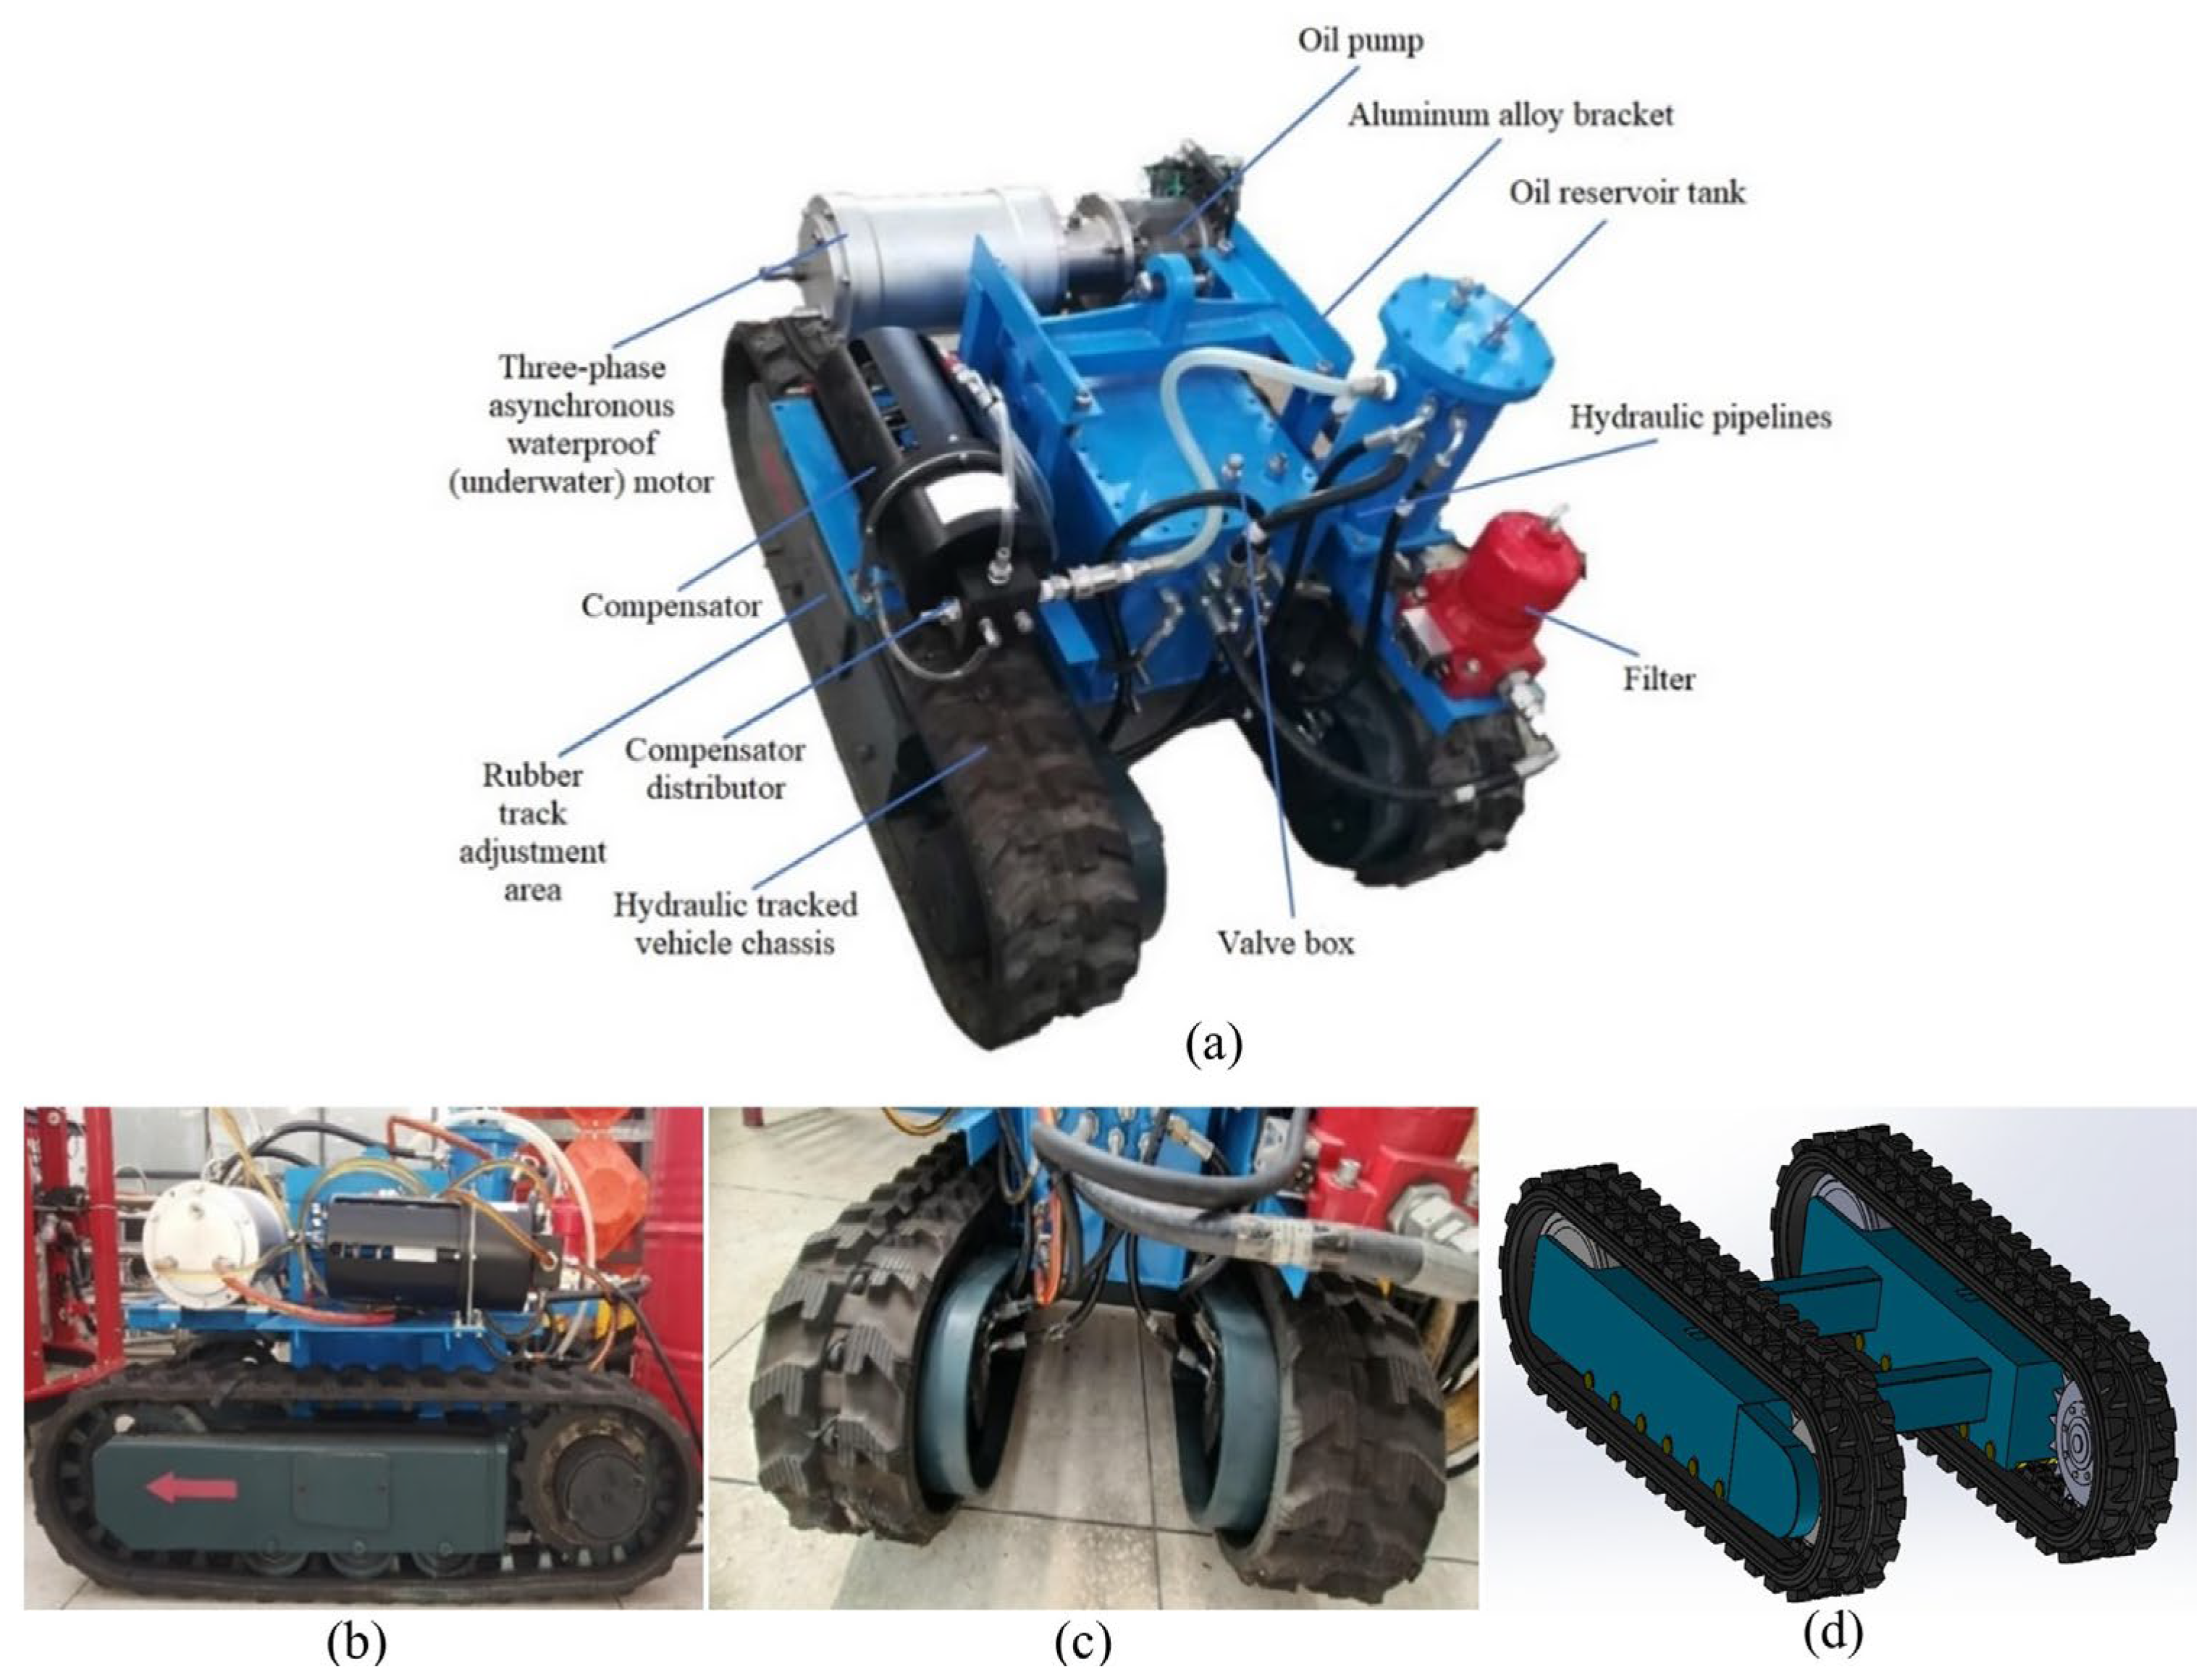
2.2. Track Vehicle and Sinkage Observations
2.3. Experimental Procedure
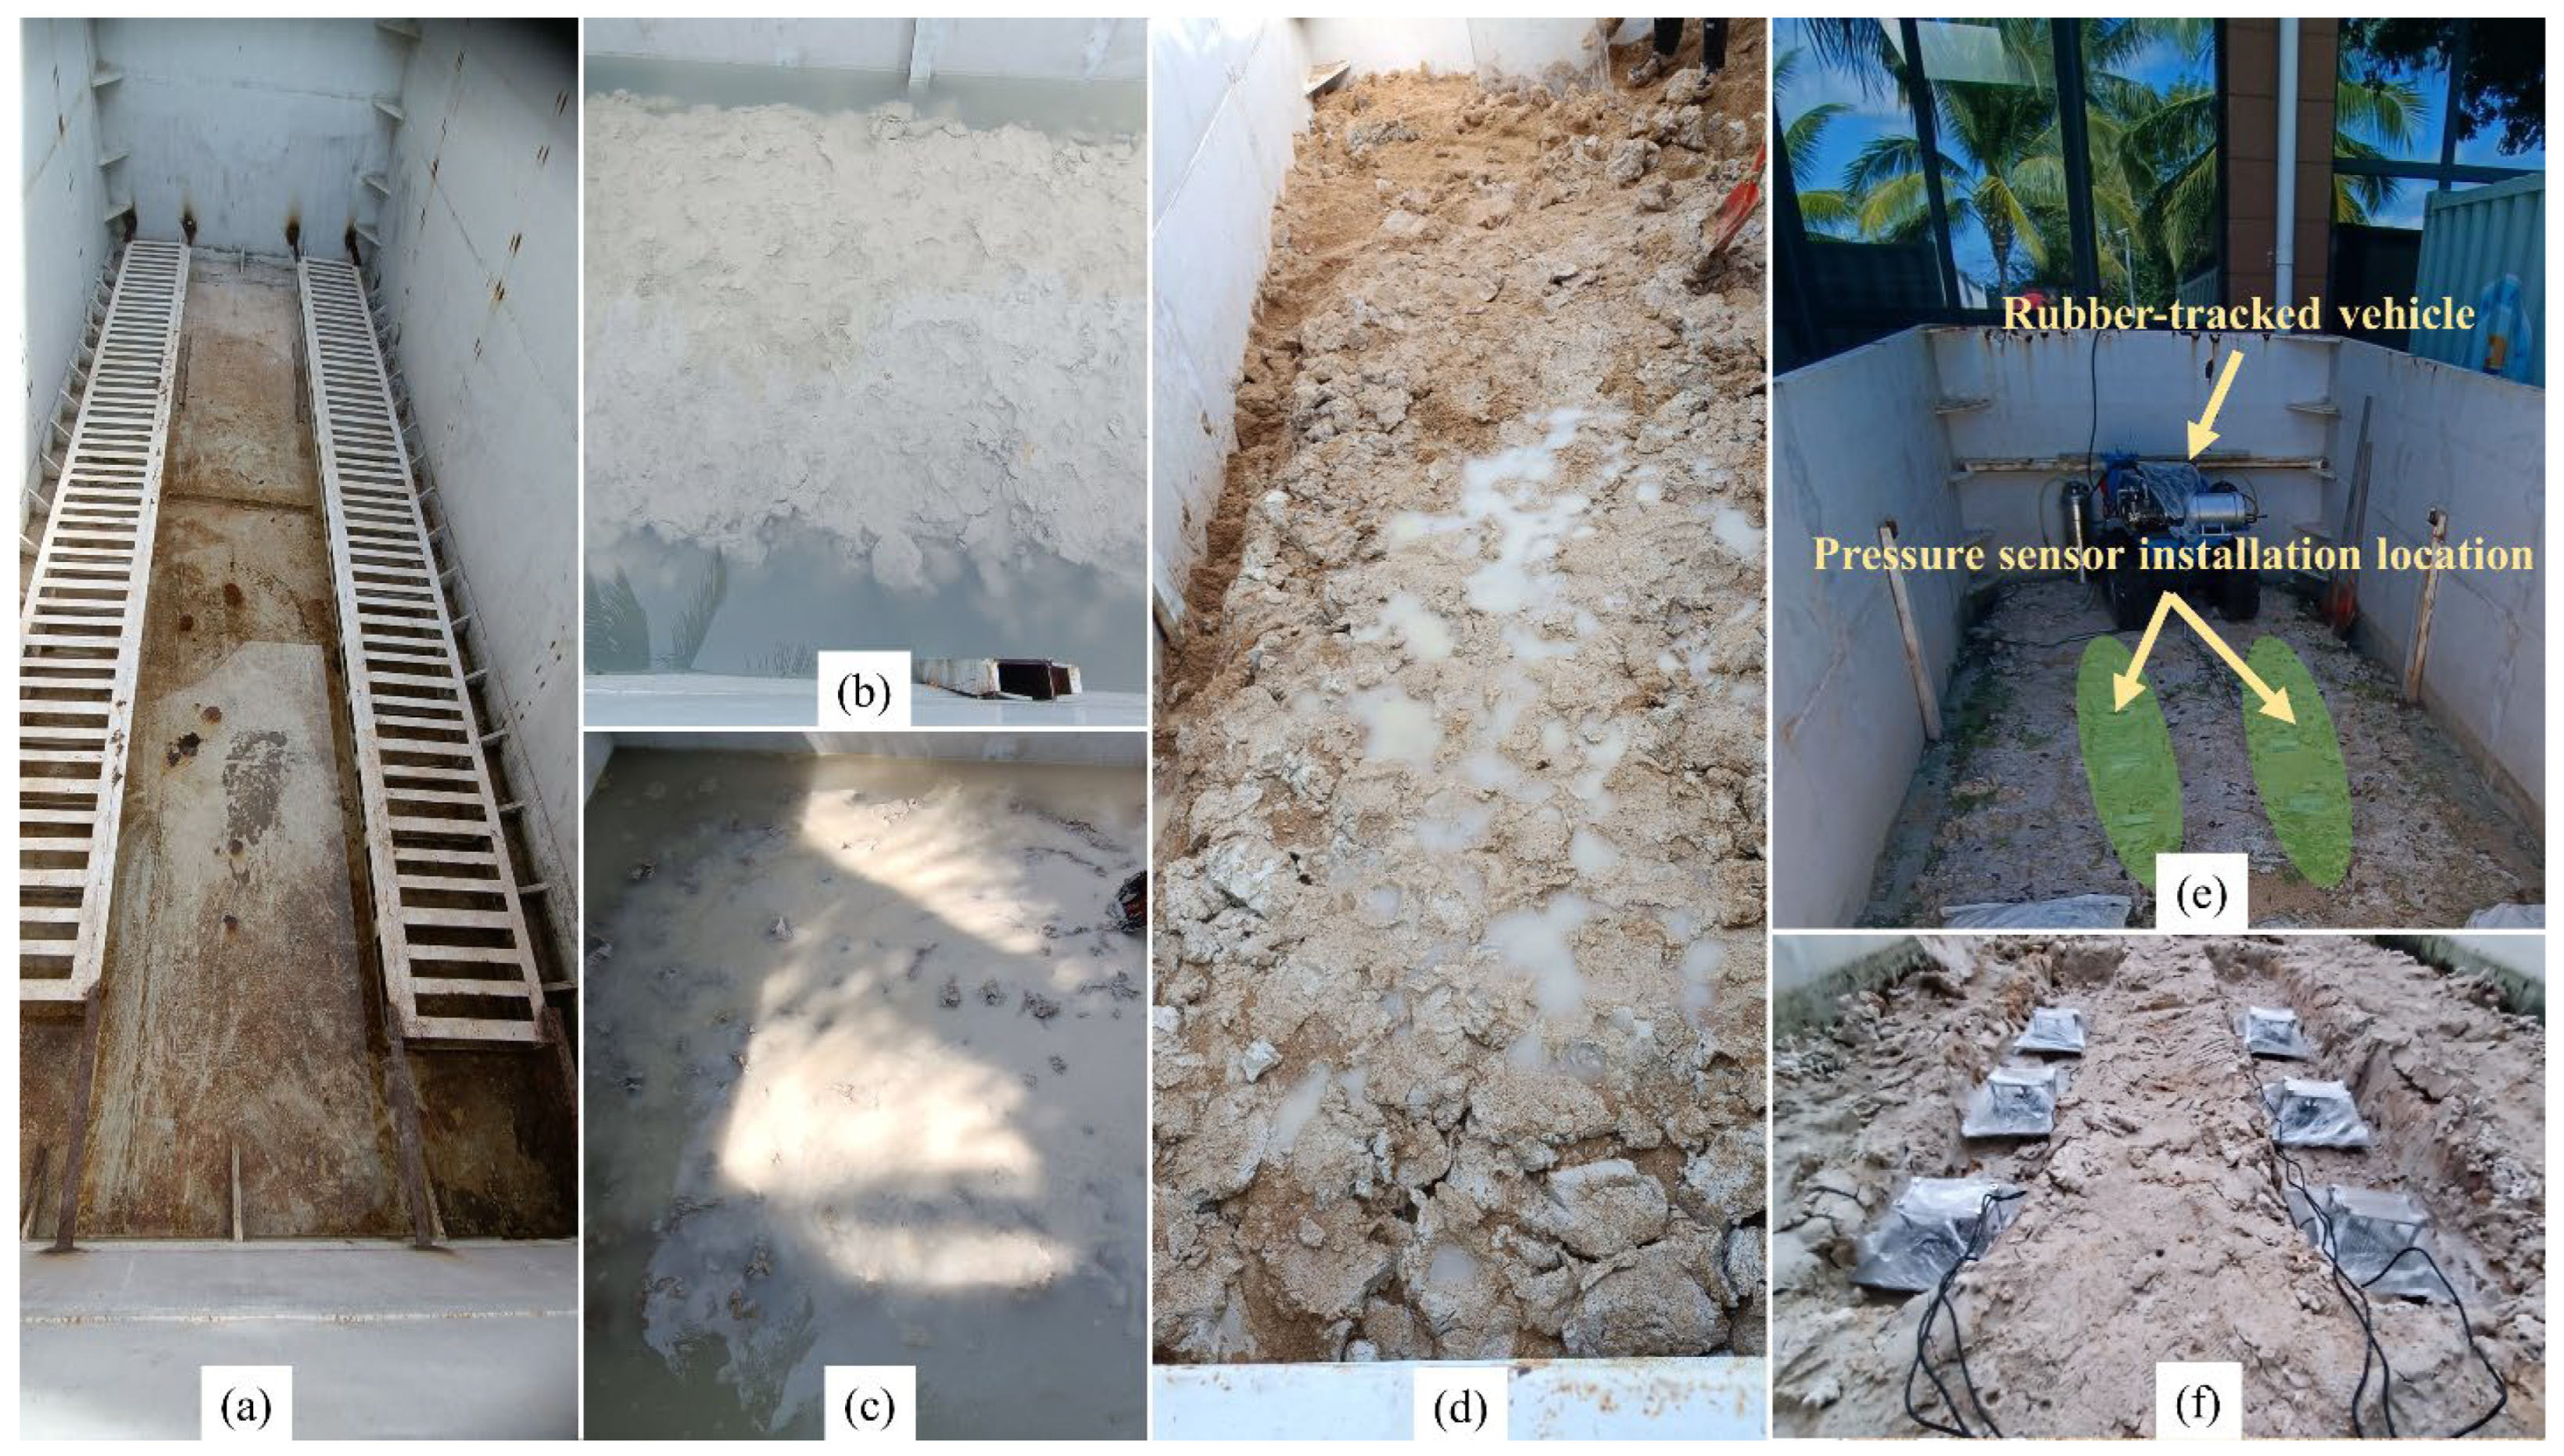
2.4. Soil Path Setup and Experimentation
2.5. Pressure Sinkage and Compaction Resistance
2.6. Multi-Body Dynamic Simulation Model
2.7. Pressure Sensors and Brackets
3. Results and Discussion
3.1. Track Vehicle and Sinkage Observations
3.2. Soil Behavior
3.3. Ground Pressure and Sinkage Test Results
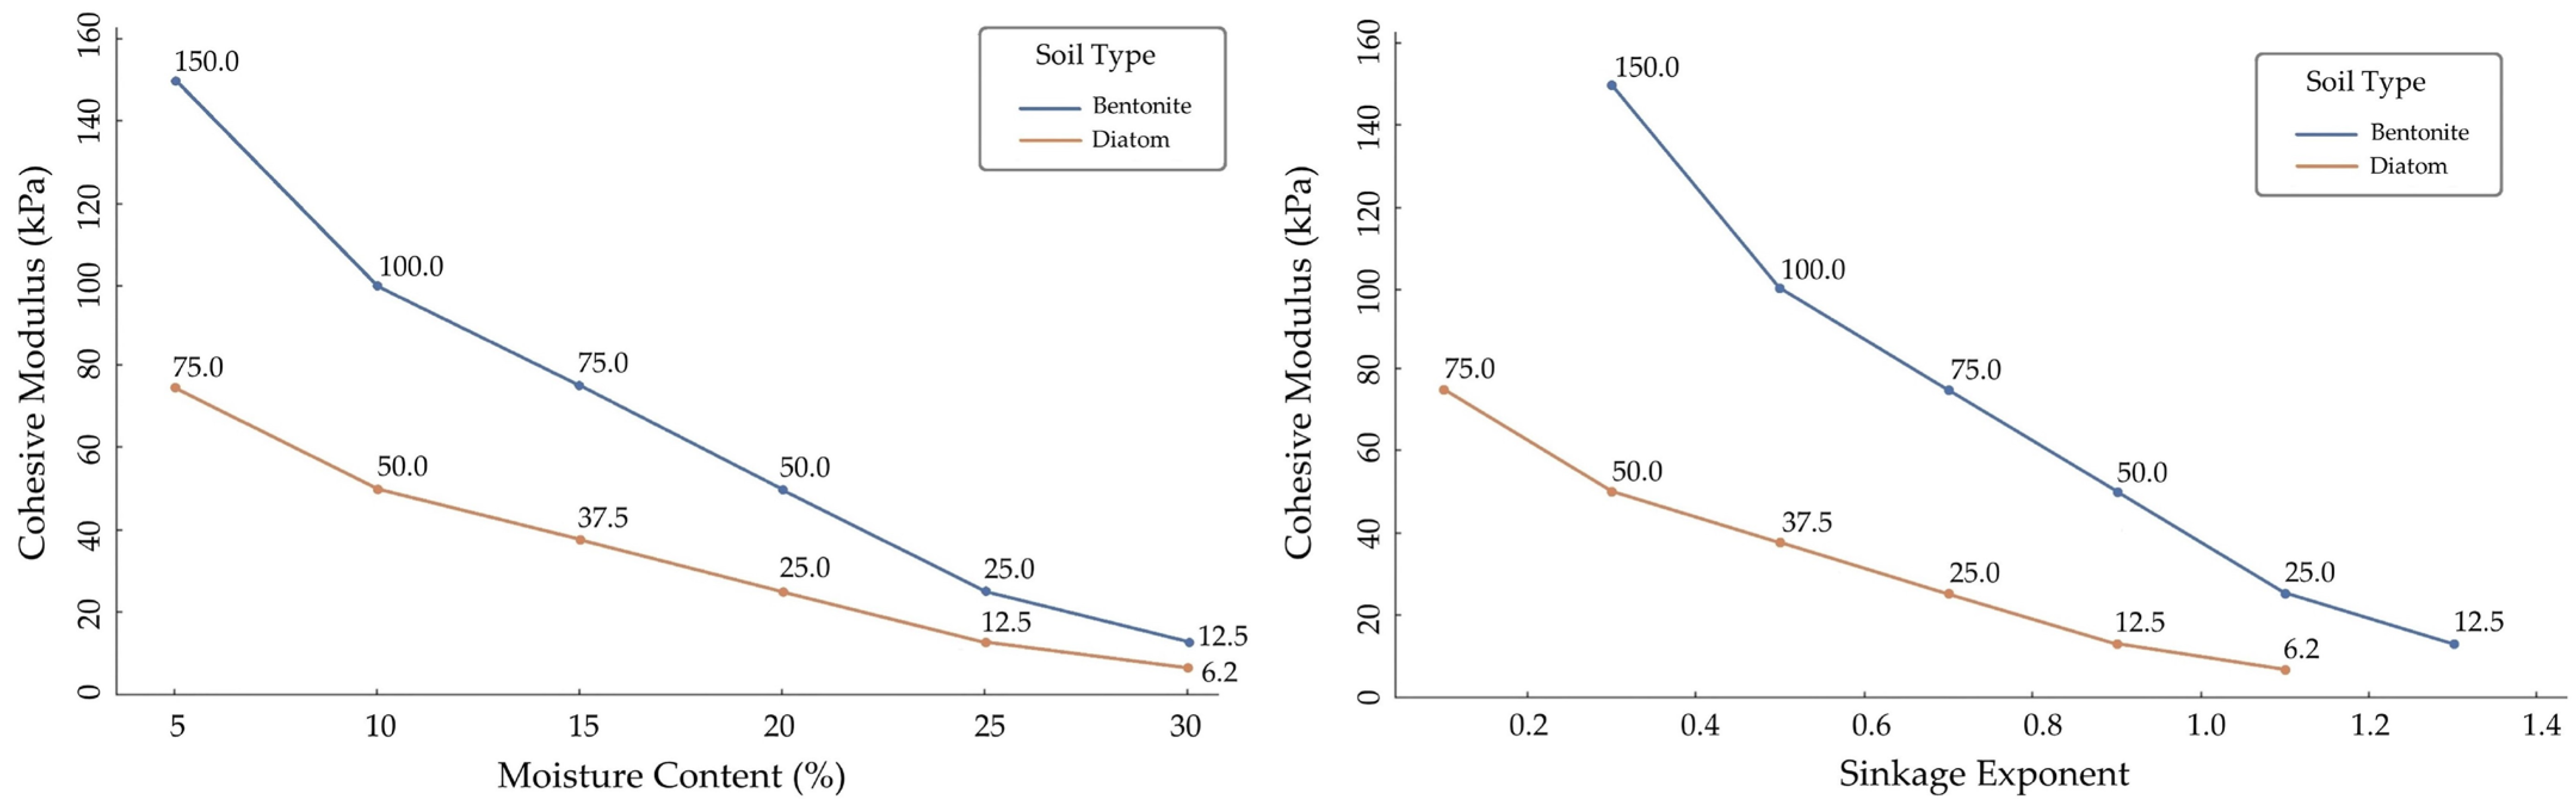
3.4. Impact of Moist Soil Content on Sinkage Exponent
4. Conclusions
Supplementary Materials
Author Contributions
Funding
Institutional Review Board Statement
Informed Consent Statement
Data Availability Statement
Acknowledgments
Conflicts of Interest
References
- Wong, J.Y. Terramechanics and Off-Road Vehicle Engineering: Terrain Behaviour. In Off-Road Vehicle Performance and Design; Butterworth-Heinemann: Oxford, UK, 2010; pp. 129–149. [Google Scholar]
- Zhang, Y.; Qiu, M.; Liu, X.; Li, J.; Song, H.; Zhai, Y.; Hu, H. Research on Characteristics of Tracked Vehicle Steering on Slope. Math. Probl. Eng. 2021, 2021, 3592902. [Google Scholar] [CrossRef]
- Li, J.; Khajepour, A.; Huang, Y.; Wang, H.; Tang, C.; Qin, Y. A New Coordinated Control Strategy for Tracked Vehicle Ride Comfort. Proc. Inst. Mech. Eng. Part. K J. Multi-Body Dyn. 2018, 232, 330–341. [Google Scholar] [CrossRef]
- Bekker, M.G. Introduction to Terrain-Vehicle Systems. Part I: The Terrain. Part II: The Vehicle; University of Michigan Press: Ann Arbor, MI, USA, 1969. [Google Scholar]
- Shibly, H.; Iagnemma, K.; Dubowsky, S. An Equivalent Soil Mechanics Formulation for Rigid Wheels in Deformable Terrain, with Application to Planetary Exploration Rovers. J. Terramech 2005, 42, 1–13. [Google Scholar] [CrossRef]
- Dallas, J.; Jain, K.; Dong, Z.; Sapronov, L.; Cole, M.P.; Jayakumar, P.; Ersal, T. Online Terrain Estimation for Autonomous Vehicles on Deformable Terrains. J. Terramech 2020, 91, 11–22. [Google Scholar] [CrossRef]
- Nampoothiri, M.G.H.; Vinayakumar, B.; Sunny, Y.; Antony, R. Recent Developments in Terrain Identification, Classification, Parameter Estimation for the Navigation of Autonomous Robots. SN Appl. Sci. 2021, 3, 480. [Google Scholar] [CrossRef]
- Schulte, E.; Schwarz, W. Simulation of Tracked Vehicle Performance on Deep Sea Soil Based on Soil Mechanical Laboratory Measurements in Bentonite Soil. In Proceedings of the ISOPE Ocean Mining and Gas Hydrates Symposium, Chennai, India, 20–24 September 2009; ISOPE: Cupertino, CA, USA; p. ISOPE-M-09-010. [Google Scholar]
- Szpaczyńska, D.; Łopatka, M.J.; Krogul, P. Susceptibility Modeling of a Rubber Track for Lightweight Mobile Robots. Appl. Sci. 2023, 13, 10533. [Google Scholar] [CrossRef]
- Wang, Y.; Cui, Y.-J.; Tang, A.M.; Benahmed, N.; Duc, M.; Sun, W.J. Shrinkage Behaviour of a Compacted Lime-Treated Clay. Géotechnique Lett. 2020, 10, 174–178. [Google Scholar] [CrossRef]
- Wong, J.Y. Theory of Ground Vehicles; John Wiley & Sons: Hoboken, NJ, USA, 2022; ISBN 1119719704. [Google Scholar]
- Harnisch, C.; Lach, B.; Jakobs, R.; Troulis, M.; Nehls, O. A New Tyre–Soil Interaction Model for Vehicle Simulation on Deformable Ground. Veh. Syst. Dyn. 2005, 43, 384–394. [Google Scholar] [CrossRef]
- Benoit, O.; Gotteland, P. Modelling of Sinkage Tests in Tilled Soils for Mobility Study. Soil Tillage Res. 2005, 80, 215–231. [Google Scholar] [CrossRef]
- Mohtashami, S.; Eliasson, L.; Jansson, G.; Sonesson, J. Influence of Soil Type, Cartographic Depth-to-Water, Road Reinforcement and Traffic Intensity on Rut Formation in Logging Operations: A Survey Study in Sweden. Silva Fenn. 2017, 51, 2018. [Google Scholar] [CrossRef]
- Liu, K.; Ayers, P.; Howard, H.; Anderson, A. Influence of Soil and Vehicle Parameters on Soil Rut Formation. J. Terramech. 2010, 47, 143–150. [Google Scholar] [CrossRef]
- Diserens, E.; Défossez, P.; Duboisset, A.; Alaoui, A. Prediction of the Contact Area of Agricultural Traction Tyres on Firm Soil. Biosyst. Eng. 2011, 110, 73–82. [Google Scholar] [CrossRef]
- Meirion-Griffith, G.; Spenko, M. A Modified Pressure–Sinkage Model for Small, Rigid Wheels on Deformable Terrains. J. Terramech. 2011, 48, 149–155. [Google Scholar] [CrossRef]
- Solis, J.M.; Longoria, R.G. Modeling Track–Terrain Interaction for Transient Robotic Vehicle Maneuvers. J. Terramech. 2008, 45, 65–78. [Google Scholar] [CrossRef]
- Hu, K.; Cheng, K. Dynamic Modelling and Stability Analysis of the Articulated Tracked Vehicle Considering Transient Track-Terrain Interaction. J. Mech. Sci. Technol. 2021, 35, 1343–1356. [Google Scholar] [CrossRef]
- Beketov, S.A. The Concept of the Controlled Movement of the Tracked Vehicle. Izv. MGTU MAMI 2018, 12, 16–20. [Google Scholar] [CrossRef]
- Schulte, E.; Handschuh, R.; Schwarz, W. Transferability of Soil Mechanical Parameters to Traction Potential Calculation of a Tracked Vehicle. In Proceedings of the ISOPE Ocean Mining and Gas Hydrates Symposium, Tsukuba, Japan, 15–19 September 2003; ISOPE: Cupertino, CA, USA, 2003; p. ISOPE-M-03-021. [Google Scholar]
- Yamazaki, T.; Komine, T.; Kawakami, T. Geotechnical Properties of Deep-Sea Sediments and the in-Situ Measurement Techniques. In Proceedings of the ISOPE Ocean Mining and Gas Hydrates Symposium, Changsha, China, 9–13 October 2005; ISOPE: Cupertino, CA, USA, 2005; p. ISOPE-M-05-010. [Google Scholar]
- Choi, J.-S.; Hong, S.; Chi, S.-B.; Lee, H.-B.; Park, C.-K.; Kim, H.-W.; Yeu, T.-K.; Lee, T.H. Probability Distribution for the Shear Strength of Seafloor Sediment in the KR5 Area for the Development of Manganese Nodule Miner. Ocean. Eng. 2011, 38, 2033–2041. [Google Scholar] [CrossRef]
- Kim, H.-W.; Hong, S.; Choi, J.; Lee, T.H. An Experimental Study on Tractive Performance of Tracked Vehicle on Cohesive Soft Soil. In Proceedings of the ISOPE Ocean Mining and Gas Hydrates Symposium, Tsukuba, Japan, 15–19 September 2003; ISOPE: Cupertino, CA, USA, 2003; p. ISOPE-M-03-023. [Google Scholar]
- Kim, H.-W.; Lee, C.-H.; Hong, S.; Oh, J.-W.; Min, C.-H.; Yeu, T.-K.; Choi, J. Dynamic Analysis of a Tracked Vehicle Based on a Subsystem Synthesis Method. In Proceedings of the ISOPE Ocean Mining and Gas Hydrates Symposium, Szczecin, Poland, 22–26 September 2013; ISOPE: Cupertino, CA, USA; p. ISOPE-M-13-055. [Google Scholar]
- Dai, Y.; Liu, S. An Integrated Dynamic Model of Ocean Mining System and Fast Simulation of Its Longitudinal Reciprocating Motion. China Ocean. Eng. 2013, 27, 231–244. [Google Scholar] [CrossRef]
- Rubinstein, D.; Hitron, R. A Detailed Multi-Body Model for Dynamic Simulation of off-Road Tracked Vehicles. J. Terramech. 2004, 41, 163–173. [Google Scholar] [CrossRef]
- Rubinstein, D.; Coppock, J.L. A Detailed Single-Link Track Model for Multi-Body Dynamic Simulation of Crawlers. J. Terramech. 2007, 44, 355–364. [Google Scholar] [CrossRef]
- Gao, Y.; Wong, J.Y. The Development and Validation of a Computer Aided Method for Design Evaluation of Tracked Vehicles with Rigid Links. Proc. Inst. Mech. Eng. Part. D J. Automob. Eng. 1994, 208, 207–215. [Google Scholar] [CrossRef]
- Wong, J.Y.; Huang, W. Evaluation of the Effects of Design Features on Tracked Vehicle Mobility Using an Advanced Computer Simulation Model. Int. J. Heavy Veh. Syst. 2005, 12, 344–365. [Google Scholar] [CrossRef]
- Wong, J.Y.; Senatore, C.; Jayakumar, P.; Iagnemma, K. Predicting Mobility Performance of a Small, Lightweight Track System Using the Computer-Aided Method NTVPM. J. Terramech. 2015, 61, 23–32. [Google Scholar] [CrossRef]
- Janarthanan, B.; Padmanabhan, C.; Sujatha, C. Longitudinal Dynamics of a Tracked Vehicle: Simulation and Experiment. J. Terramech. 2012, 49, 63–72. [Google Scholar] [CrossRef]
- Ani, O.A.; Uzoejinwa, B.B.; Ezeama, A.O.; Onwualu, A.P.; Ugwu, S.N.; Ohagwu, C.J. Overview of Soil-Machine Interaction Studies in Soil Bins. Soil. Tillage Res. 2018, 175, 13–27. [Google Scholar] [CrossRef]
- Badgujar, C.M.; Flippo, D.; Brokesh, E.; Welch, S. Experimental Investigation on Traction, Mobility, and Energy Usage of a Tracked Autonomous Ground Vehicle on a Sloped Soil Bin. J. ASABE 2022, 65, 835–847. [Google Scholar] [CrossRef]
- Laughery, S.; Gerhart, G.R.; Goetz, R. Bekker’s Terramechanics Model for off-Road Vehicle Research; US Army TARDEC: Hammond, WI, USA, 1990. [Google Scholar]
- Reece, A.R. Principles of Soil-Vehicle Mechanics. Proc. Inst. Mech. Eng. Automob. Div. 1965, 180, 45–66. [Google Scholar] [CrossRef]
- Tang, A.-M.; Cui, Y.-J.; Eslami, J.; Défossez, P. Analyzing the Form of the Confined Uniaxial Compression Curve of Various Soils. Geoderma 2009, 148, 282–290. [Google Scholar] [CrossRef]
- Kochmanov, N.; Tanakai, H. Influence of the Soil Fabric on the Mechanical Properties of Unsaturated Clays. Soils Found. 2011, 51, 275–286. [Google Scholar] [CrossRef]
- Cuisinier, O.; Auriol, J.-C.; Le Borgne, T.; Deneele, D. Microstructure and Hydraulic Conductivity of a Compacted Lime-Treated Soil. Eng. Geol. 2011, 123, 187–193. [Google Scholar] [CrossRef]
- Wang, Q.; Cui, Y.-J.; Tang, A.M.; Barnichon, J.-D.; Saba, S.; Ye, W.-M. Hydraulic Conductivity and Microstructure Changes of Compacted Bentonite/Sand Mixture during Hydration. Eng. Geol. 2013, 164, 67–76. [Google Scholar] [CrossRef]
- Alaoui, A.; Helbling, A. Evaluation of Soil Compaction Using Hydrodynamic Water Content Variation: Comparison between Compacted and Non-Compacted Soil. Geoderma 2006, 134, 97–108. [Google Scholar] [CrossRef]
- Zhang, S.; Grip, H.; Lövdahl, L. Effect of Soil Compaction on Hydraulic Properties of Two Loess Soils in China. Soil. Tillage Res. 2006, 90, 117–125. [Google Scholar] [CrossRef]
- Samuel, T.M.; Ajav, E.A. Optimum Tillage System for Pepper Production in an Alfisol of South-Western Nigeria. Afr. J. Agric. Res. 2010, 5, 2647–2652. [Google Scholar]
- Botta, G.F.; Becerra, A.T.; Tourn, F.B. Effect of the Number of Tractor Passes on Soil Rut Depth and Compaction in Two Tillage Regimes. Soil. Tillage Res. 2009, 103, 381–386. [Google Scholar] [CrossRef]
- Ko, H.-Y.; Scott, R.F. Bearing Capacities by Plasticity Theory. J. Soil. Mech. Found. Div. 1973, 99, 25–43. [Google Scholar] [CrossRef]
- Meyerhof, G.G. The Bearing Capacity of Concrete and Rock. Mag. Concr. Res. 1953, 4, 107–116. [Google Scholar] [CrossRef]
- Zhang, C.; Yan, Q.; Zhao, J.; Wang, J. Formulation of Ultimate Bearing Capacity for Strip Foundations Based on the Meyerhof Theory and Unsaturated Soil Mechanics. Comput. Geotech. 2020, 126, 103734. [Google Scholar] [CrossRef]
- Terzaghi Terzaghi’s Bearing Capacity Equations. 2009. Available online: https://hamidomer.files.wordpress.com/2010/09/terzaghi.pdf (accessed on 30 January 2024).
- Ding, P.; Jia, C.; Di, S.; Wang, L.; Bian, C.; Yang, X. Analysis and Prediction of Land Subsidence along Significant Linear Engineering. Bull. Eng. Geol. Environ. 2020, 79, 5125–5139. [Google Scholar] [CrossRef]
- Schiffman, R.L.; Chen, A.T.F.; Jordan, J.C. An Analysis of Consolidation Theories. J. Soil Mech. Found. Div. 1969, 95, 285–312. [Google Scholar] [CrossRef]
- Handiman, I.; Redana, I.W.; Hidayati, A.M.; Sudarsana, I.K. Implementation of Soil Lateral Pressure Measurement Due to Vehicle Under Constant Speed Based on LabVIEW Software. In Proceeding of International Conference on Sustainable Engineering and Creative Computing; IEEE: Piscataway, NJ, USA, 2022; Volume 1. [Google Scholar]
- Giwangkara, G.G.; Mohamed, A.; Nor, H.M.; Khalid, N.H.A. The Analysis of Stress Distribution on the Physical Model of Road Base Layer. Int. J. Integr. Eng. 2020, 12, 348–355. [Google Scholar]
- Mishra, A.K.; Ohtsubo, M.; Li, L.Y.; Higashi, T. Influence of the Bentonite on the Consolidation Behaviour of Soil–Bentonite Mixtures. Carbonates Evaporites 2010, 25, 43–49. [Google Scholar] [CrossRef]
- Yang, C.; Yang, G.; Liu, Z.; Chen, H.; Zhao, Y. A Method for Deducing Pressure–Sinkage of Tracked Vehicle in Rough Terrain Considering Moisture and Sinkage Speed. J. Terramech. 2018, 79, 99–113. [Google Scholar] [CrossRef]


| Items | Model | Operating Voltage | Measuring Range | Measurement Accuracy |
|---|---|---|---|---|
| Pressure sensor (Bengbu Zhongnuo Sensor Co., Ltd., Bengbu, China) | ZNHM-D1-2T-22121401 | 5–15 V DC | 214.5 kPa −40 to 85 °C | 99.9% ±0.5% FS |
| Moisture sensor (Weihai JXCT Electronics Co., Ltd., Weihai, China) | JXBS-3001-TR_4G | 12–24 V DC | 0–100% −40–80 °C | 3% in the range of 0–53% 5% in the range of 53–100% |
| Cone Penetrometer (Spectrum Technologies, Inc., Aurora, CO, USA) | SC 900 | 4 AAA alkaline batteries | 0–18″ (0–45 cm) 0–1000 PSI (0–7000 kPa) | ±0.5″ (±1.25 cm) ±15 PSI (±103 kPa) |
| Data logger built-in Wireless serial communication module (Arizon Company, Shanghai, China) | FD0843 (6 Channel) | 9~24 V DC, <10 W | 100/200/400/800/1600 | Temp: −30~65 °C Relative humidity: 10~95% A/D Update rate: 1600 Hz Data transfer rate:100 Mb/s |
| Direct Shear Apparatus (Direct Shear Apparatus: GTJ Test Company, Cangzhou, China) | ZJ-1B | 110–240 V AC | Shear Displacement: 0–50 mm Normal Load: 0–400 kN | Shear Displacement: ±0.01 mm Normal Load: ±0.5% of applied load Shear Load: ±0.5% of measured value |
| 9-axis attitude sensor (WIT Motion company, Shenzhen, China) | WT901BLECL5.0 | 3.7 V–260 mAh | TCP: 1~10 Hz UDP: 1~200 Hz | Angular accuracy X, Y axis 0.2°, Z axis 1° |
| Soil | Moisture (±%) | Speed (m/s) | Sinkage (cm) | Track-Soil Observations |
|---|---|---|---|---|
| Bentonite | 5 | 0.1 | 1.10 | Normal wear and tear on tracks |
| Bentonite | 10 | 0.1 | 1.50 | Rutting beginning tracks deforming |
| Bentonite | 15 | 0.1 | 2.40 | Deep rutting, tracks digging in |
| Bentonite | 20 | 0.1 | 2.70 | Severe rutting, tracks stuck |
| Bentonite | 25 | 0.1 | 3.20 | Severe track deformation and sinking |
| Bentonite | 30 | 0.1 | 3.80 | Increased track slippage |
| Diatom | 5 | 0.1 | 0.55 | Normal wear and tear on tracks |
| Diatom | 10 | 0.1 | 0.80 | Minor rutting |
| Diatom | 15 | 0.1 | 0.83 | Rutting |
| Diatom | 20 | 0.1 | 0.90 | Deep Rutting |
| Diatom | 25 | 0.1 | 1.21 | Very soft soil, tracks dug in |
| Diatom | 30 | 0.1 | 1.30 | Severe track deformation and sinking |
| Parameter Name | Symbol | Parameter Content |
|---|---|---|
| Track length × width × Height (cm) | Lx × Ly × Lz | 120 × 90 × 80 |
| Contact length of rubber track | cm | 90 |
| Width of single rubber track | cm | 20 |
| Drive wheel diameter | cm | 26 |
| Front idler diameter | cm | 32 |
| Lugs | cm | 19 |
| Weight of the tracked vehicle | W (kg) | 544 |
| Weight of the vehicle in the water | Ww (kg) | 229.25 |
| Contact Pressure | P (kPa) | 13.889 |
| Contact Pressure in the water | Pw (kPa) | 12.5 |
| Soil | Depth (cm) | Cone Penetration Resistance kPa @ Moisture (±%) | ||
|---|---|---|---|---|
| 10 ± % | 20 ± % | 30 ± % | ||
| Bentonite | 0–5 | 10 kPa | 20 kPa | 40 kPa |
| 5–15 | 15 kPa | 30 kPa | 45 kPa | |
| 15–30 | 20 kPa | 25 kPa | 50 kPa | |
| Diatom | 0–5 | 15 kPa | 18 kPa | 20 kPa |
| 5–15 | 18 kPa | 20 kPa | 22 kPa | |
| 15–30 | 20 kPa | 22 kPa | 25 kPa | |
| Parameter | Unit | Deep Sea Bentonite Sediment | Deep Sea Diatom Sediment |
|---|---|---|---|
| Cohesive deformation modulus | kc | 7.49 | 13.85 |
| Internal friction deformation modulus | kØ | 0.137 | 0.23 |
| Deformation index | N | 0.34 | 0.49 |
| Cohesion | C | 0.021 | 0.007 |
| Internal friction angle | 16 | 31 | |
| Shearing Deformation modulus | k | 8 | 16 |
| Sinkage Ratio | 0.79 | 0.87 |
| Soil Type | Speed (m/s) | Moisture Content (±%) | Ground Pressure (kPa) | Sinkage (cm) |
|---|---|---|---|---|
| Bentonite | 0.1 | 10 | 23 | 1.5 |
| Bentonite | 0.1 | 20 | 25 | 2.7 |
| Bentonite | 0.1 | 30 | 27 | 3.8 |
| Bentonite | 0.2 | 10 | 21 | 2.6 |
| Bentonite | 0.2 | 20 | 23 | 3.7 |
| Bentonite | 0.2 | 30 | 25 | 4.3 |
| Bentonite | 0.3 | 10 | 19 | 3.2 |
| Bentonite | 0.3 | 20 | 21 | 4.4 |
| Bentonite | 0.3 | 30 | 23 | 5.2 |
| Diatom | 0.1 | 10 | 29 | 0.8 |
| Diatom | 0.1 | 20 | 31 | 0.9 |
| Diatom | 0.1 | 30 | 33 | 1.3 |
| Diatom | 0.2 | 10 | 27 | 0.6 |
| Diatom | 0.2 | 20 | 29 | 1.8 |
| Diatom | 0.2 | 30 | 31 | 1.6 |
| Diatom | 0.3 | 10 | 25 | 1.9 |
| Diatom | 0.3 | 20 | 27 | 1.7 |
| Diatom | 0.3 | 30 | 29 | 2.8 |
| Soil Type | Moisture Content (±%) | Sinkage Exponent | Cohesive Modulus (kPa) |
|---|---|---|---|
| Bentonite | 5 | 0.3 | 150 |
| Bentonite | 10 | 0.5 | 100 |
| Bentonite | 15 | 0.7 | 75 |
| Bentonite | 20 | 0.9 | 50 |
| Bentonite | 25 | 1.1 | 25 |
| Bentonite | 30 | 1.3 | 12.5 |
| Diatom | 5 | 0.1 | 75 |
| Diatom | 10 | 0.3 | 50 |
| Diatom | 15 | 0.5 | 37.5 |
| Diatom | 20 | 0.7 | 25 |
| Diatom | 25 | 0.9 | 12.5 |
| Diatom | 30 | 1.1 | 6.25 |
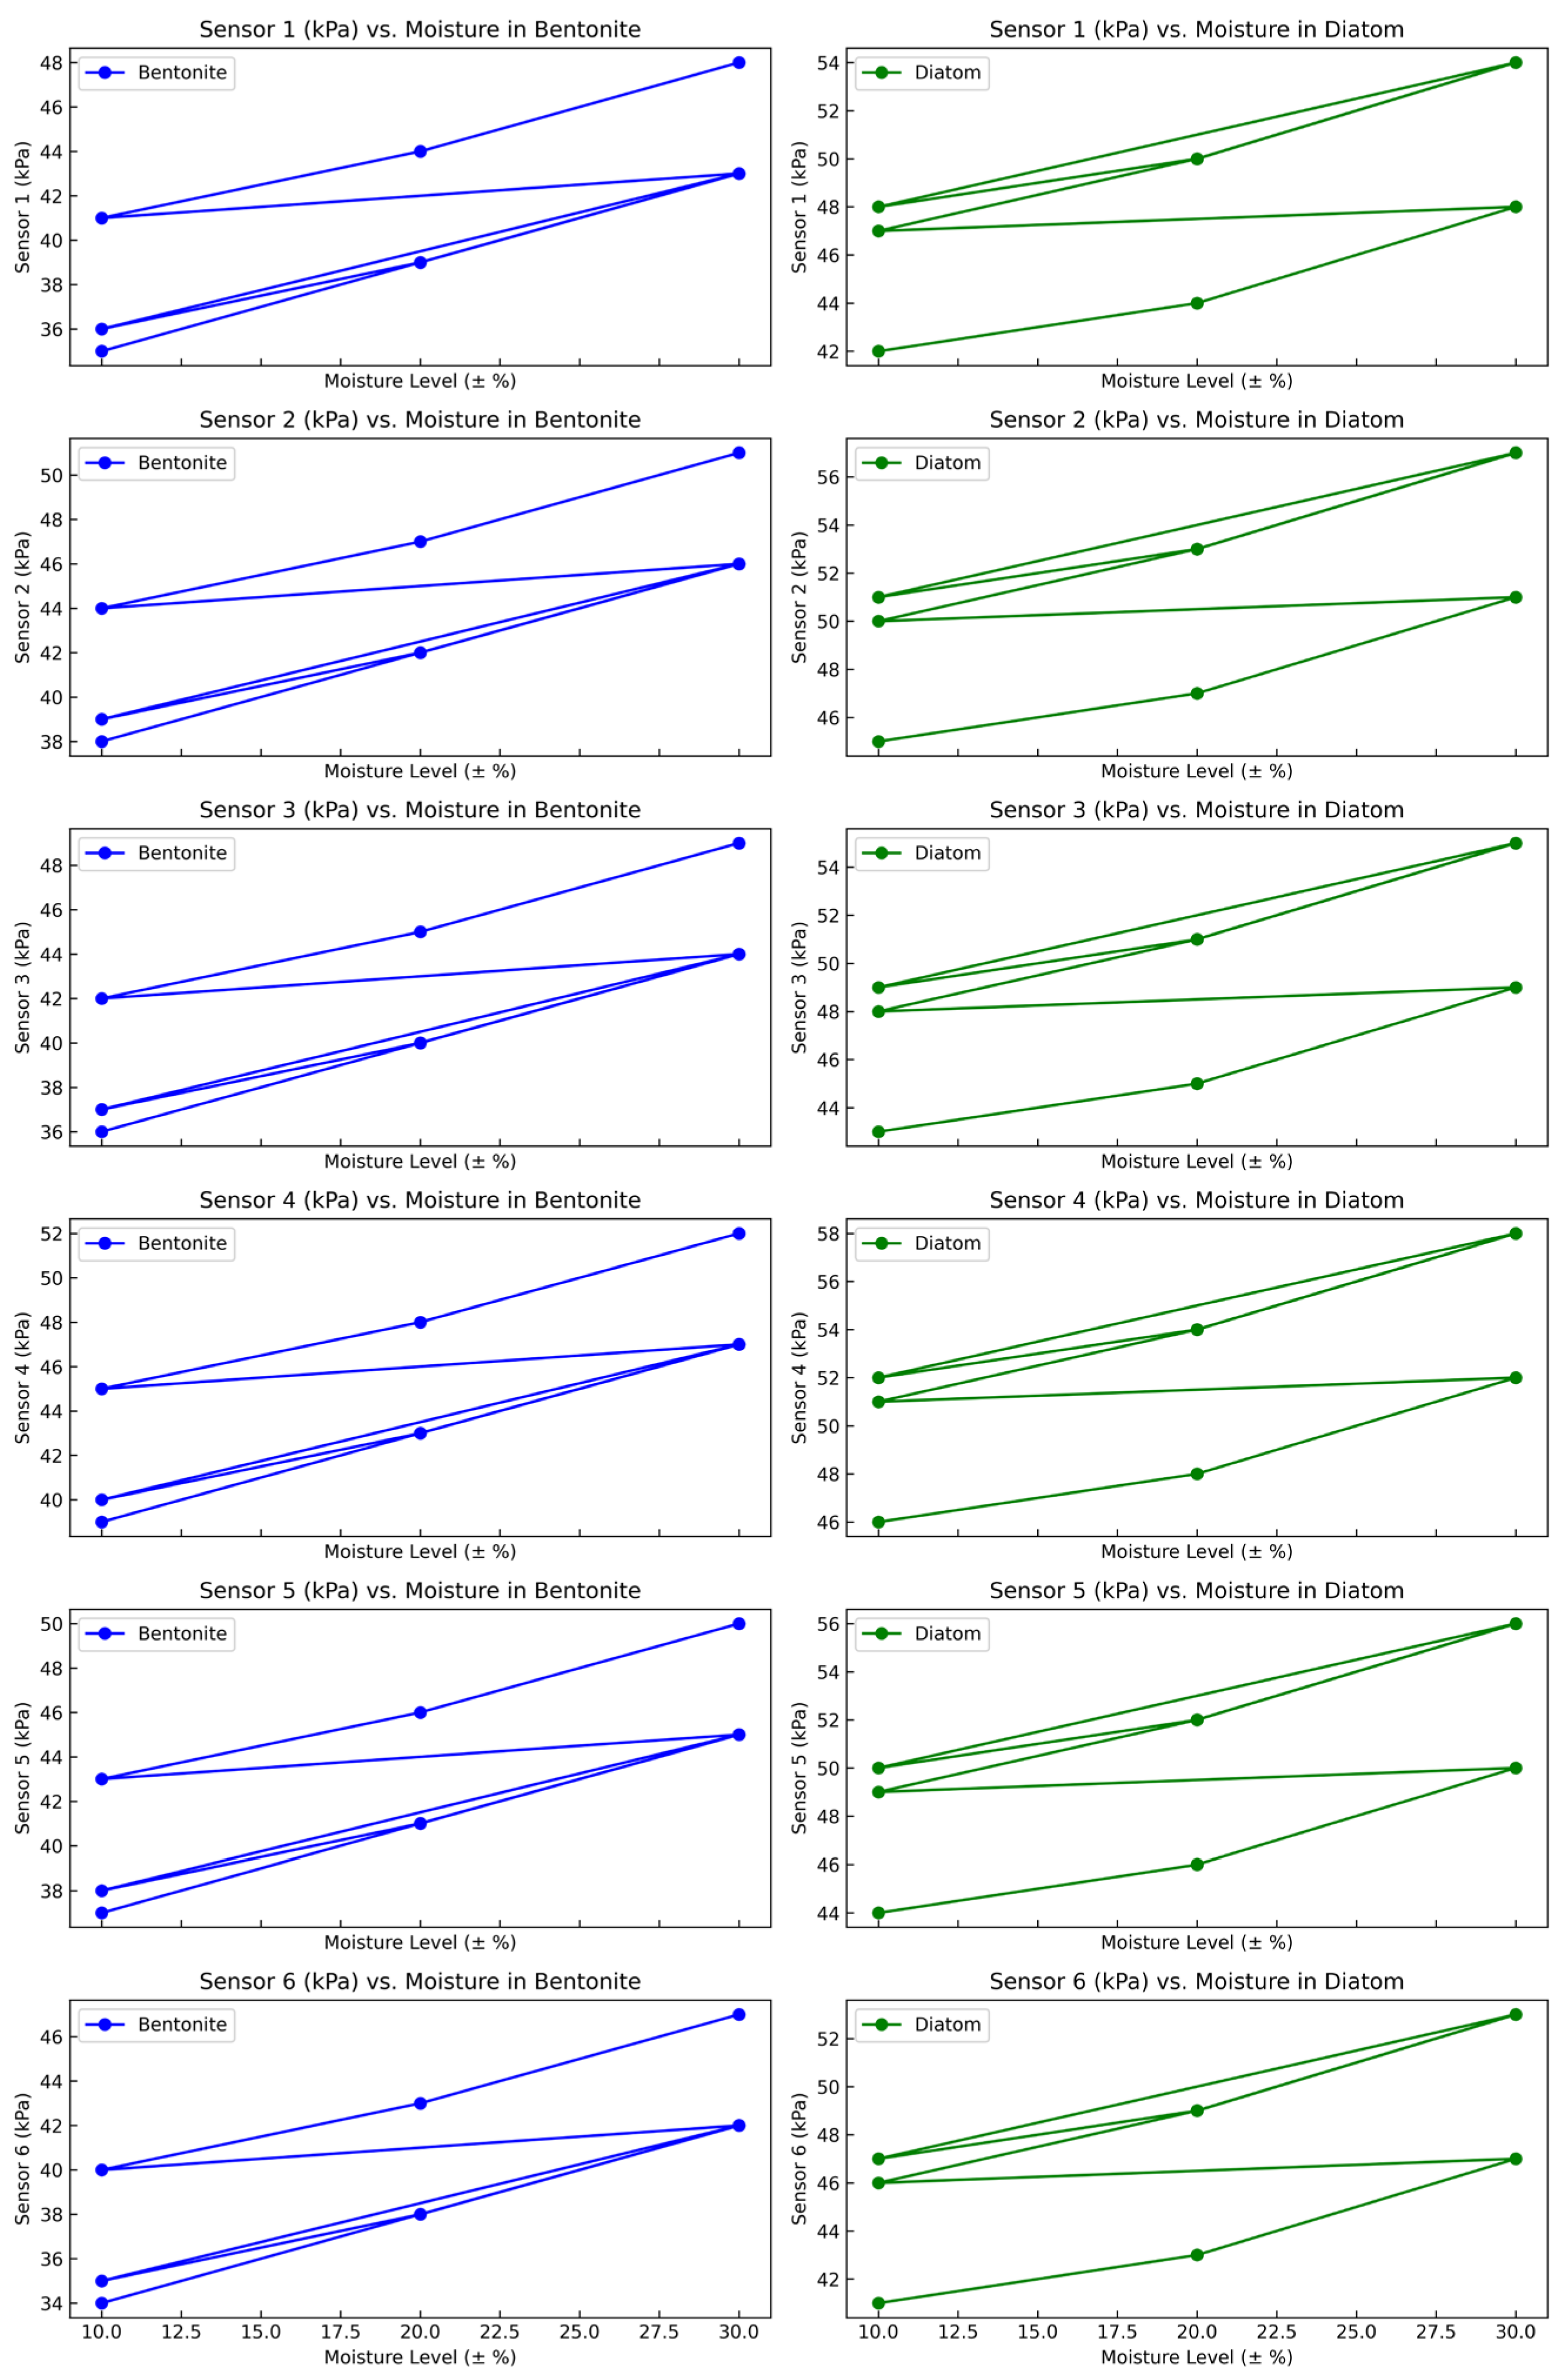
| Soil Type | Moisture Level (±%) | Speed (m/s) | Sensor 1 (kPa) | Sensor 2 (kPa) | Sensor 3 (kPa) | Sensor 4 (kPa) | Sensor 5 (kPa) | Sensor 6 (kPa) |
|---|---|---|---|---|---|---|---|---|
| Bentonite | 10 | 0.1 | 35 | 38 | 36 | 39 | 37 | 34 |
| Bentonite | 20 | 0.1 | 39 | 42 | 40 | 43 | 41 | 38 |
| Bentonite | 30 | 0.1 | 43 | 46 | 44 | 47 | 45 | 42 |
| Diatom | 10 | 0.1 | 36 | 39 | 37 | 40 | 38 | 35 |
| Diatom | 20 | 0.1 | 39 | 42 | 40 | 43 | 41 | 38 |
| Diatom | 30 | 0.1 | 43 | 46 | 44 | 47 | 45 | 42 |
| Bentonite | 10 | 0.2 | 41 | 44 | 42 | 45 | 43 | 40 |
| Bentonite | 20 | 0.2 | 44 | 47 | 45 | 48 | 46 | 43 |
| Bentonite | 30 | 0.2 | 48 | 51 | 49 | 52 | 50 | 47 |
| Diatom | 10 | 0.2 | 42 | 45 | 43 | 46 | 44 | 41 |
| Diatom | 20 | 0.2 | 44 | 47 | 45 | 48 | 46 | 43 |
| Diatom | 30 | 0.2 | 48 | 51 | 49 | 52 | 50 | 47 |
| Bentonite | 10 | 0.3 | 47 | 50 | 48 | 51 | 49 | 46 |
| Bentonite | 20 | 0.3 | 50 | 53 | 51 | 54 | 52 | 49 |
| Bentonite | 30 | 0.3 | 54 | 57 | 55 | 58 | 56 | 53 |
| Diatom | 10 | 0.3 | 48 | 51 | 49 | 52 | 50 | 47 |
| Diatom | 20 | 0.3 | 50 | 53 | 51 | 54 | 52 | 49 |
| Diatom | 30 | 0.3 | 54 | 57 | 55 | 58 | 56 | 53 |
Disclaimer/Publisher’s Note: The statements, opinions and data contained in all publications are solely those of the individual author(s) and contributor(s) and not of MDPI and/or the editor(s). MDPI and/or the editor(s) disclaim responsibility for any injury to people or property resulting from any ideas, methods, instructions or products referred to in the content. |
© 2024 by the authors. Licensee MDPI, Basel, Switzerland. This article is an open access article distributed under the terms and conditions of the Creative Commons Attribution (CC BY) license (https://creativecommons.org/licenses/by/4.0/).
Share and Cite
Rauf, O.; Ning, Y.; Ming, C.; Haoxiang, M. Evaluation of Ground Pressure, Bearing Capacity, and Sinkage in Rigid-Flexible Tracked Vehicles on Characterized Terrain in Laboratory Conditions. Sensors 2024, 24, 1779. https://doi.org/10.3390/s24061779
Rauf O, Ning Y, Ming C, Haoxiang M. Evaluation of Ground Pressure, Bearing Capacity, and Sinkage in Rigid-Flexible Tracked Vehicles on Characterized Terrain in Laboratory Conditions. Sensors. 2024; 24(6):1779. https://doi.org/10.3390/s24061779
Chicago/Turabian StyleRauf, Omer, Yang Ning, Chen Ming, and Ma Haoxiang. 2024. "Evaluation of Ground Pressure, Bearing Capacity, and Sinkage in Rigid-Flexible Tracked Vehicles on Characterized Terrain in Laboratory Conditions" Sensors 24, no. 6: 1779. https://doi.org/10.3390/s24061779
APA StyleRauf, O., Ning, Y., Ming, C., & Haoxiang, M. (2024). Evaluation of Ground Pressure, Bearing Capacity, and Sinkage in Rigid-Flexible Tracked Vehicles on Characterized Terrain in Laboratory Conditions. Sensors, 24(6), 1779. https://doi.org/10.3390/s24061779