
Temperature-Automated Calibration Methods for a Large-Area Blackbody Radiation Source
 , , ,
, , ,
Abstract
1. Introduction
2. Auto-Correction System Calibration Principle for Infrared Thermometers
2.1. Method for Calibrating the Temperature of the Blackbody
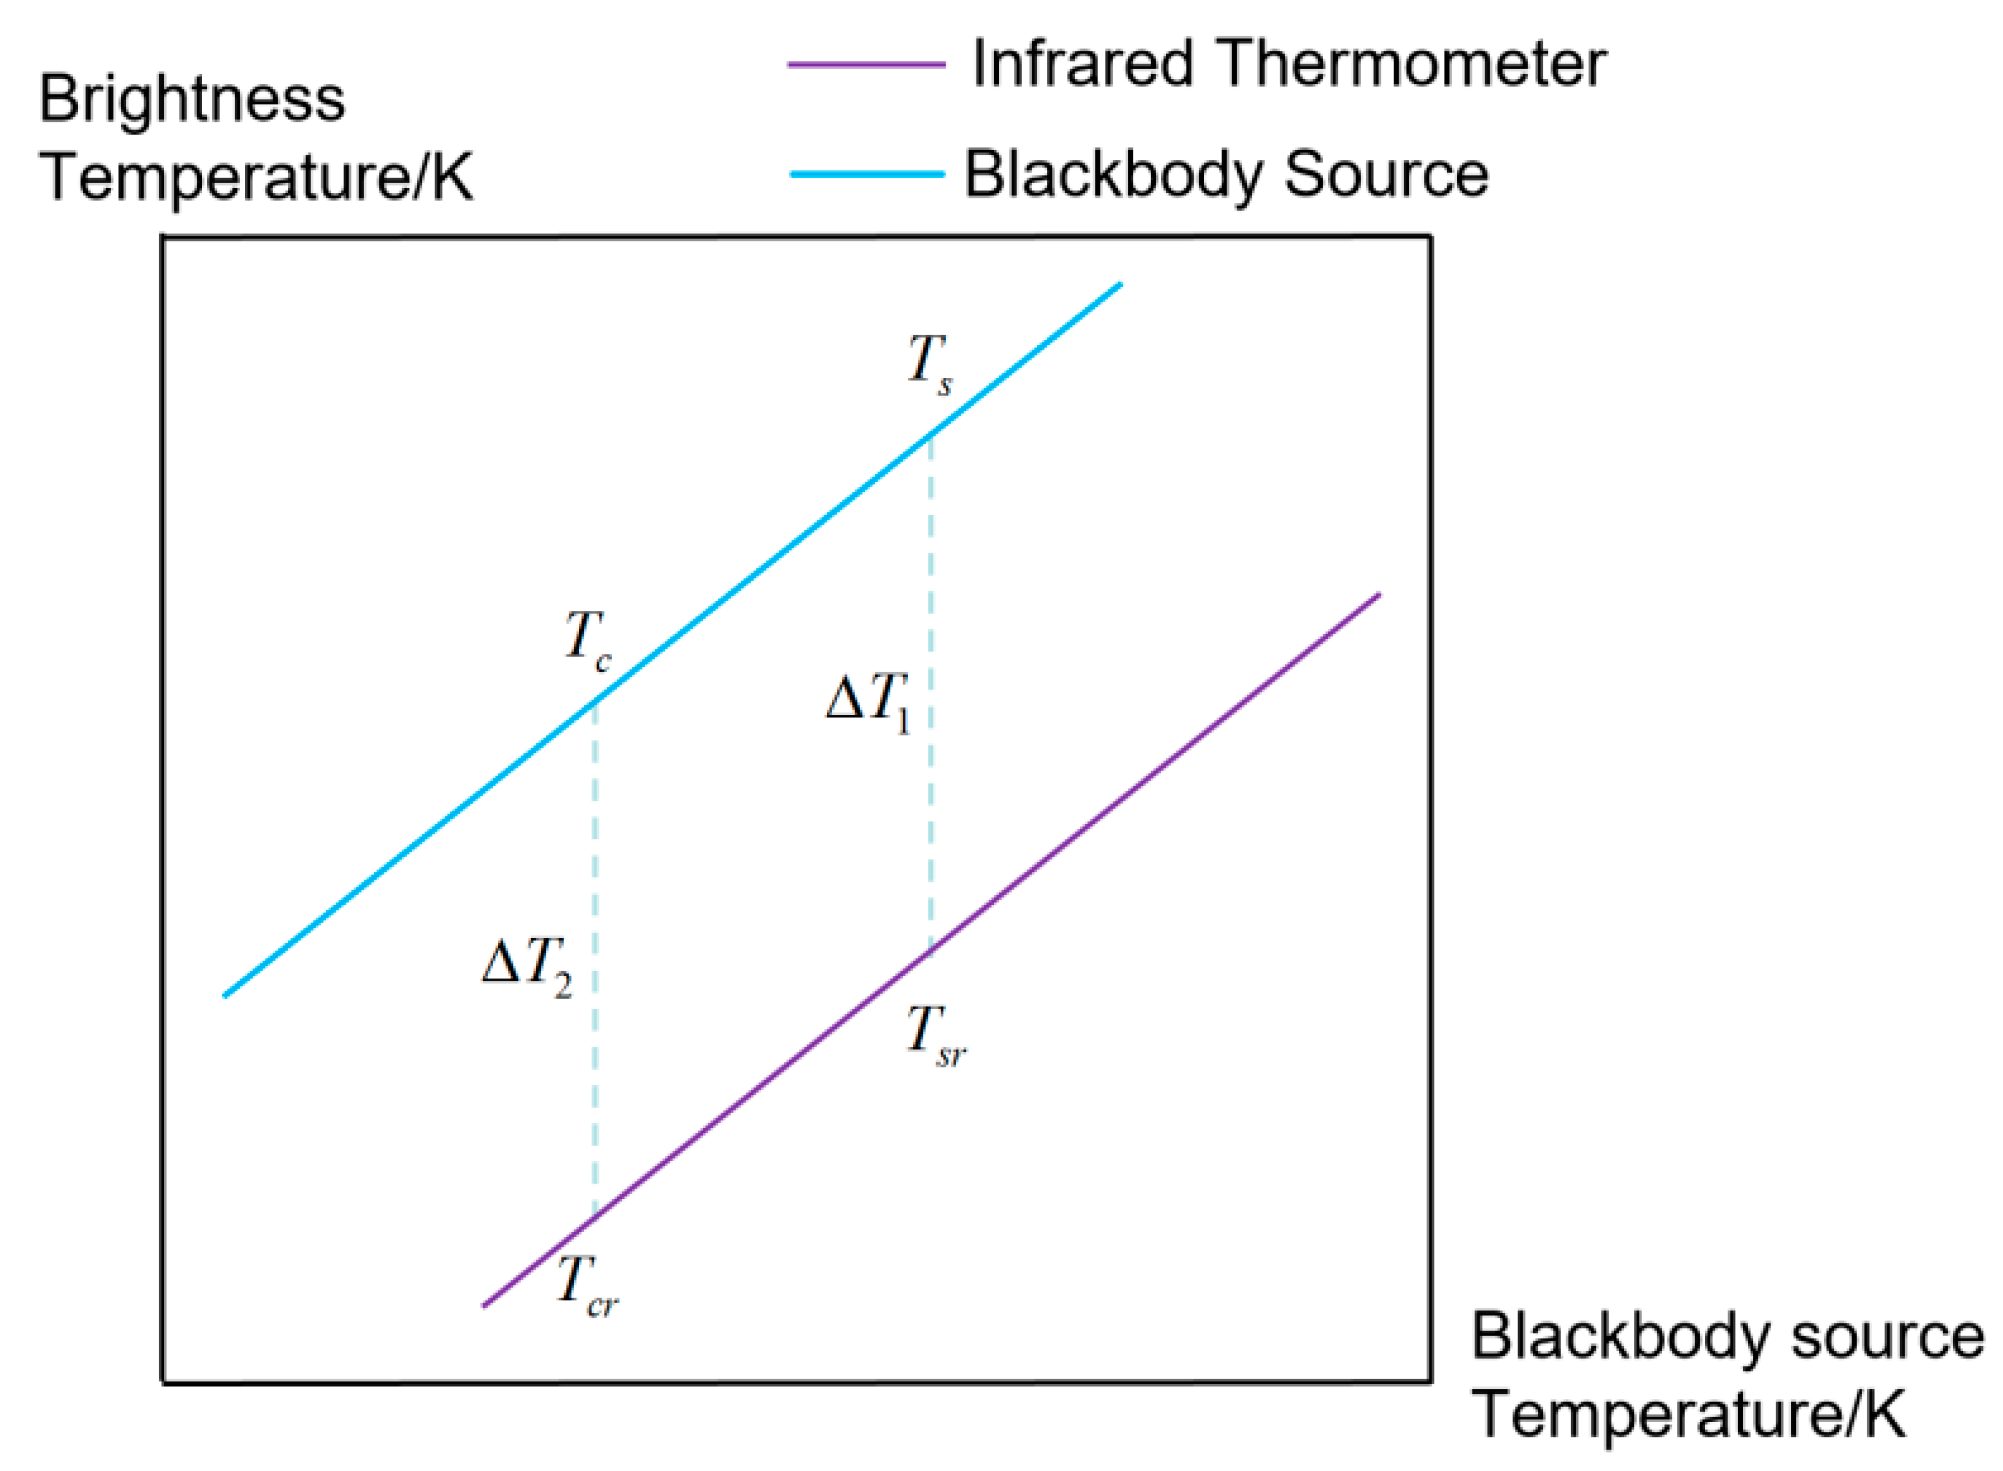
2.2. Temperature Test Deviation
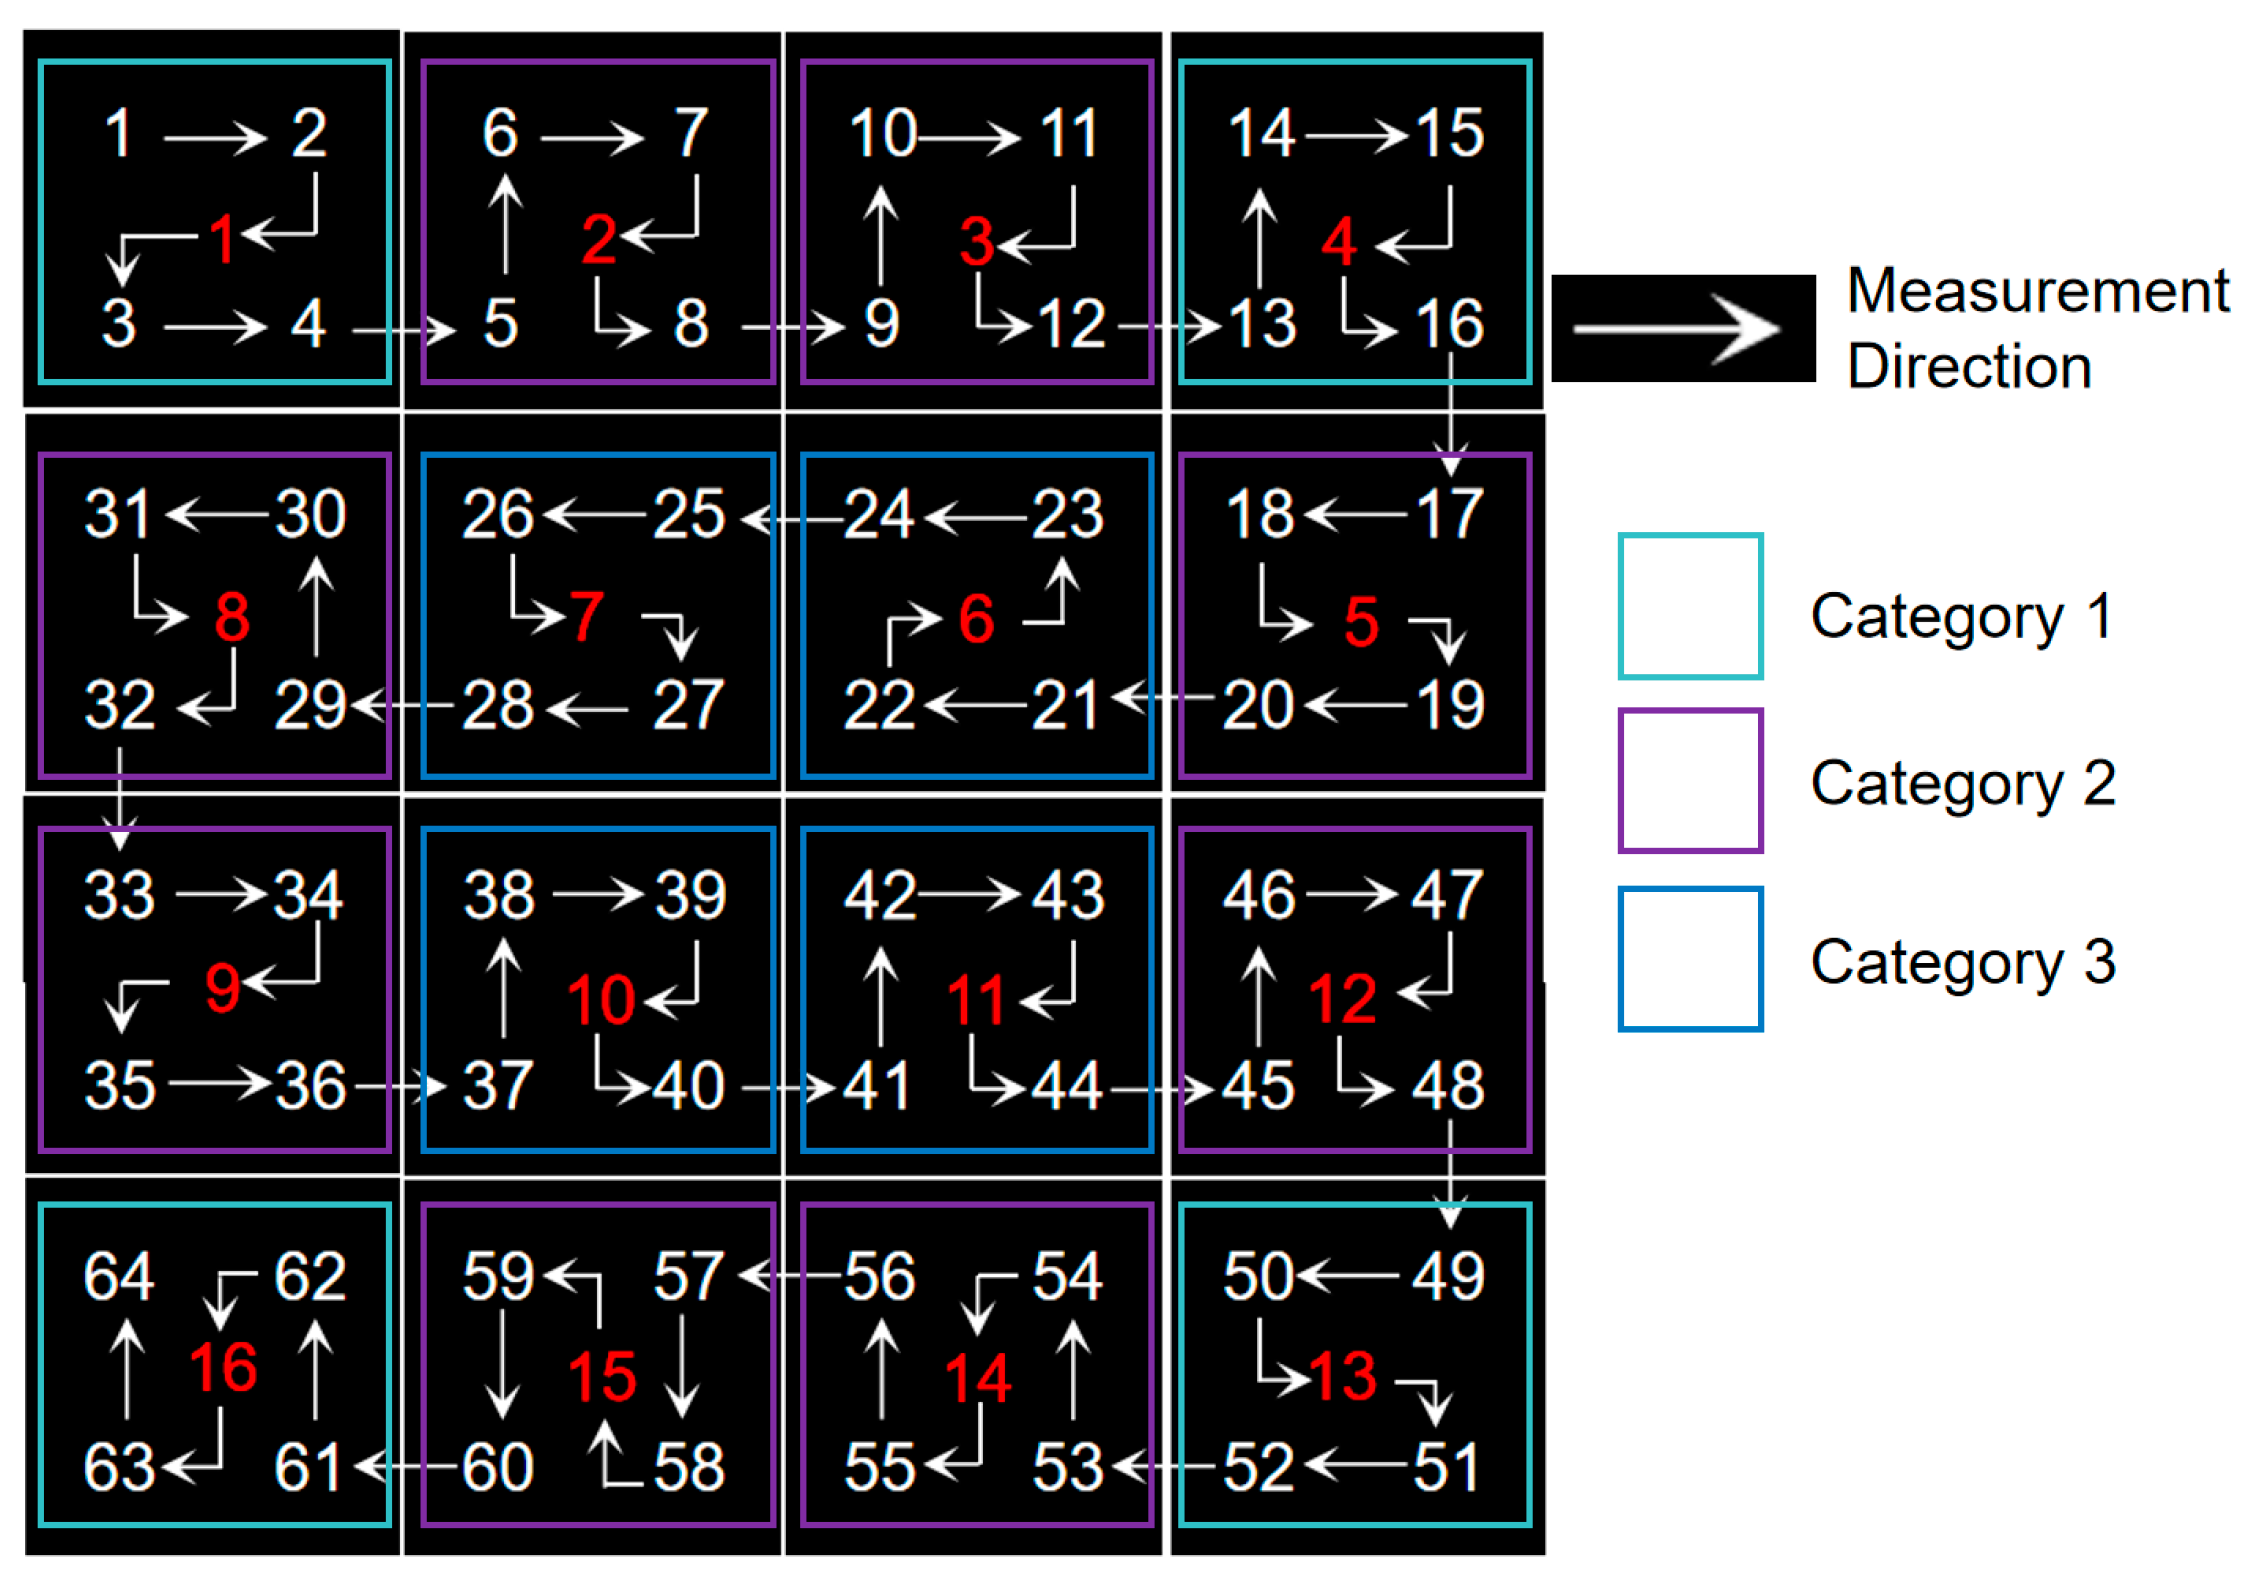
2.3. Uniformity of Temperature Test
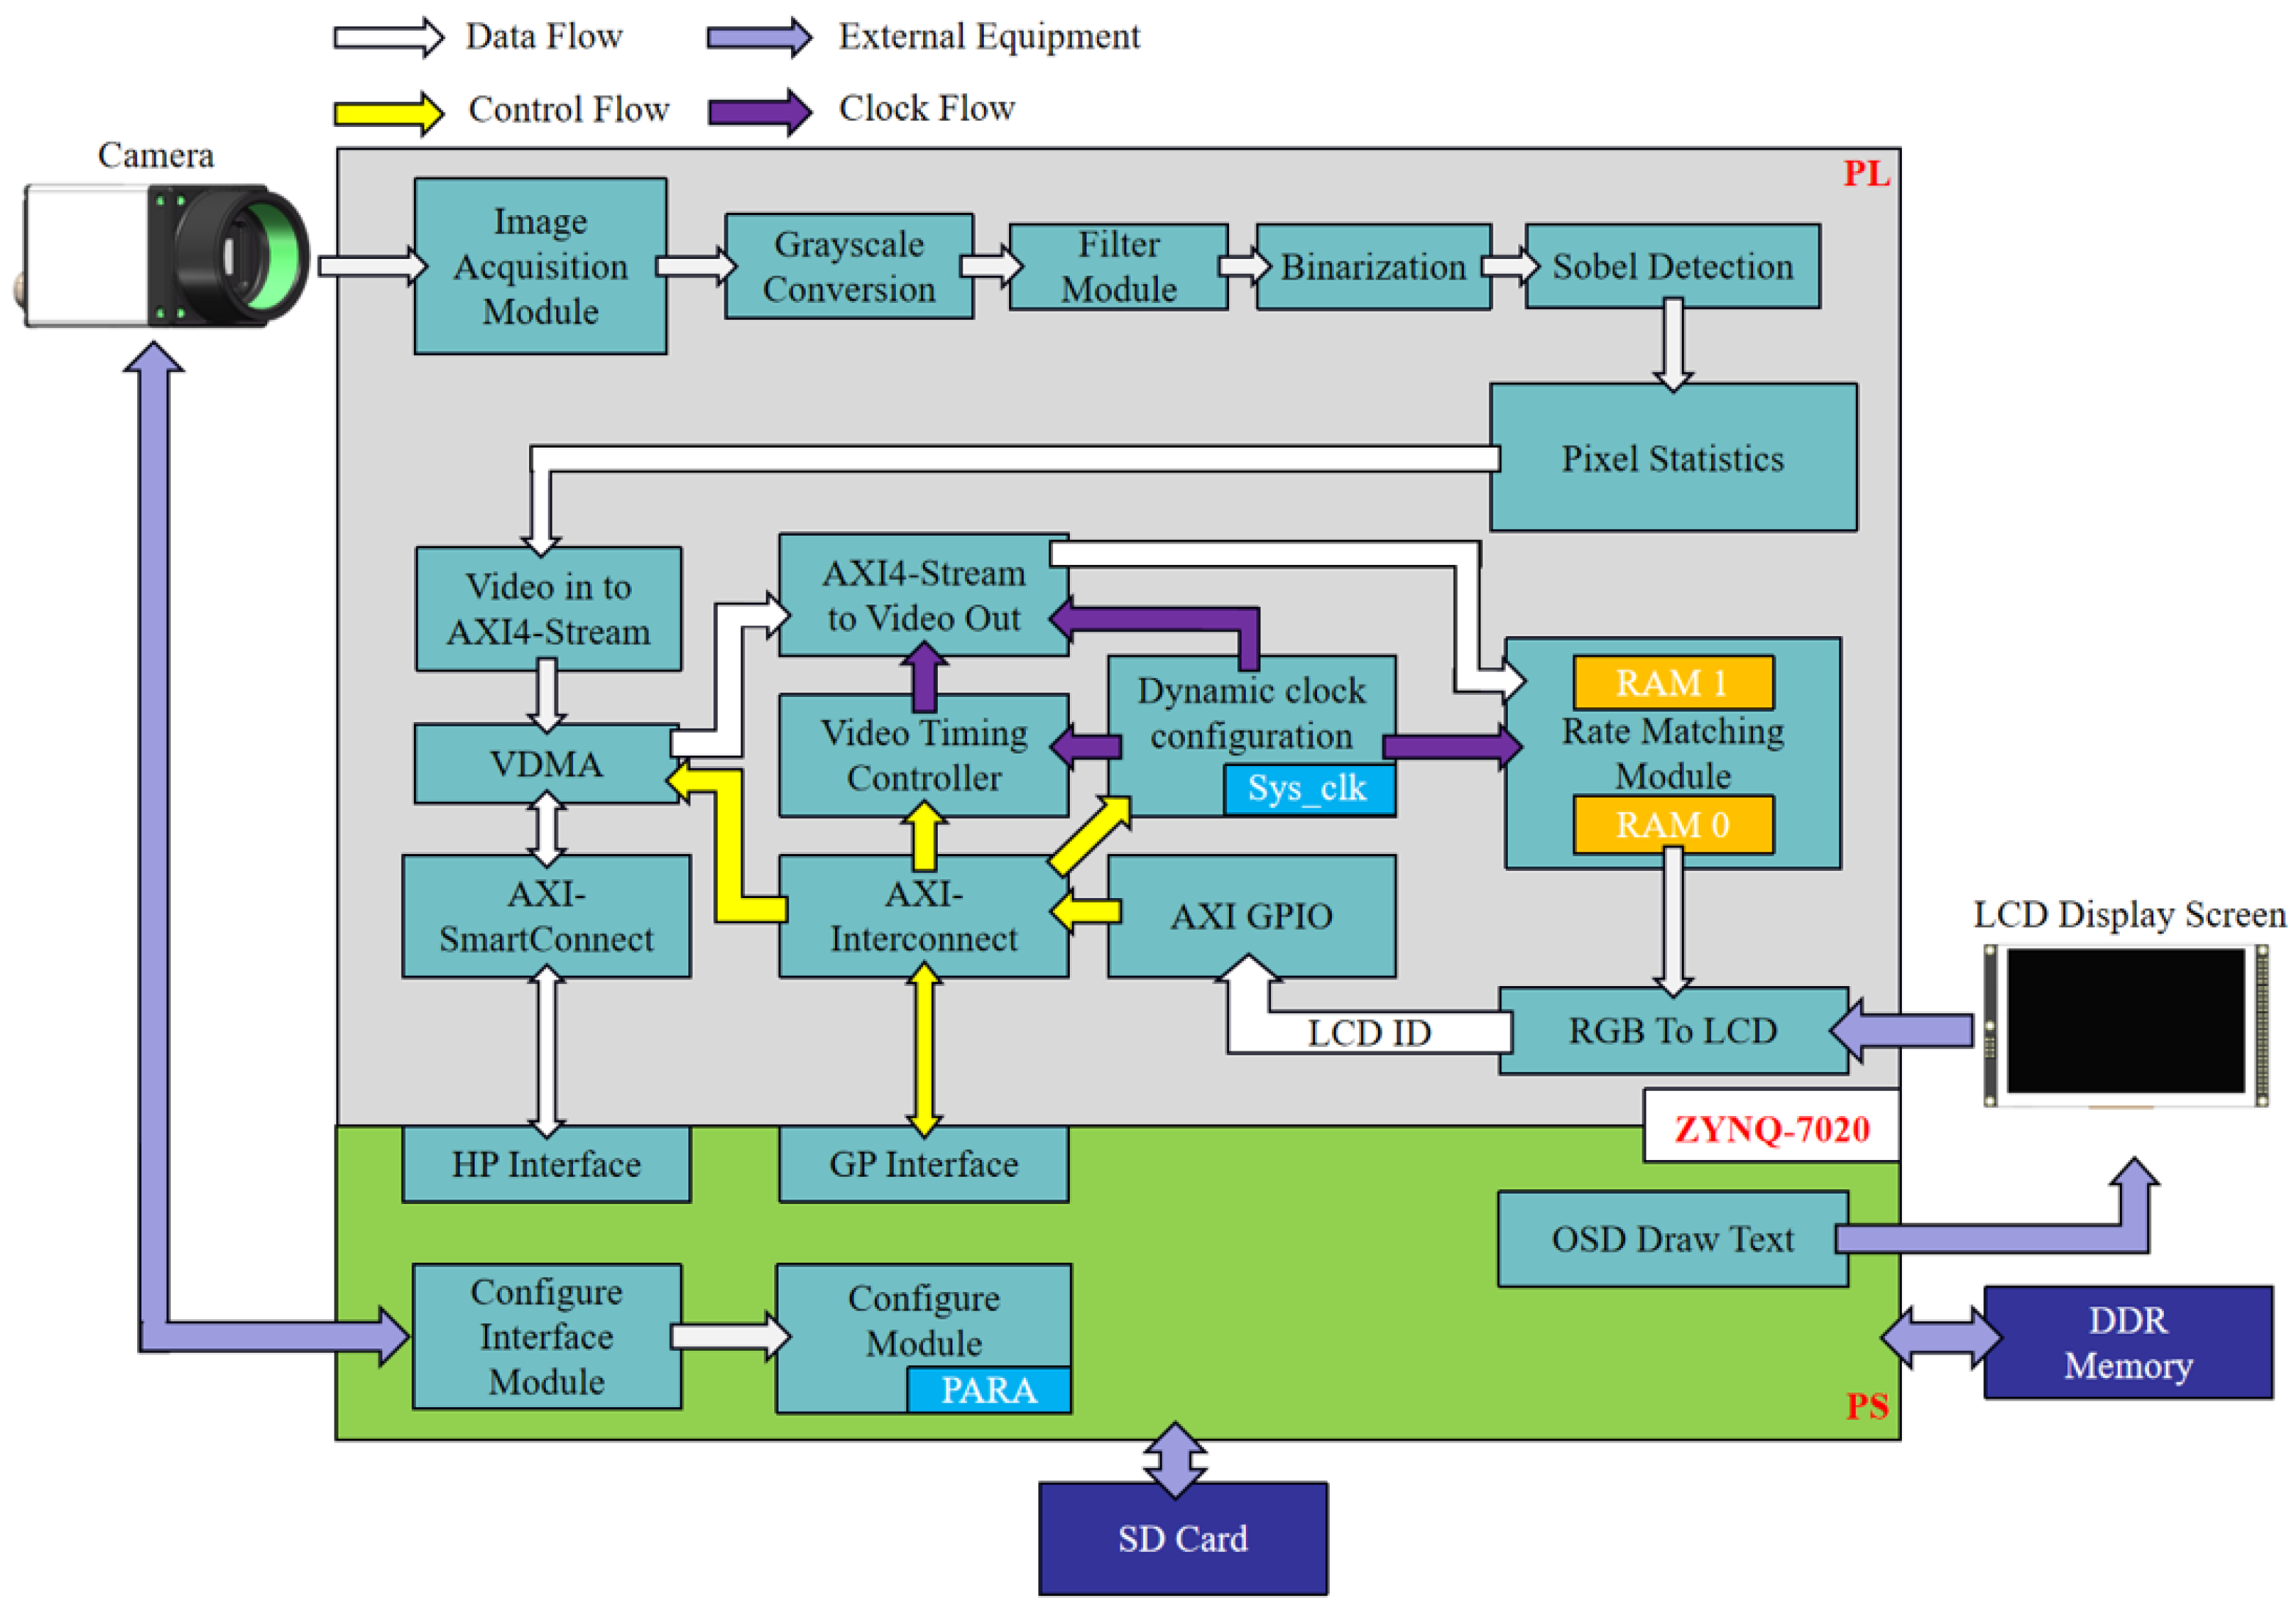
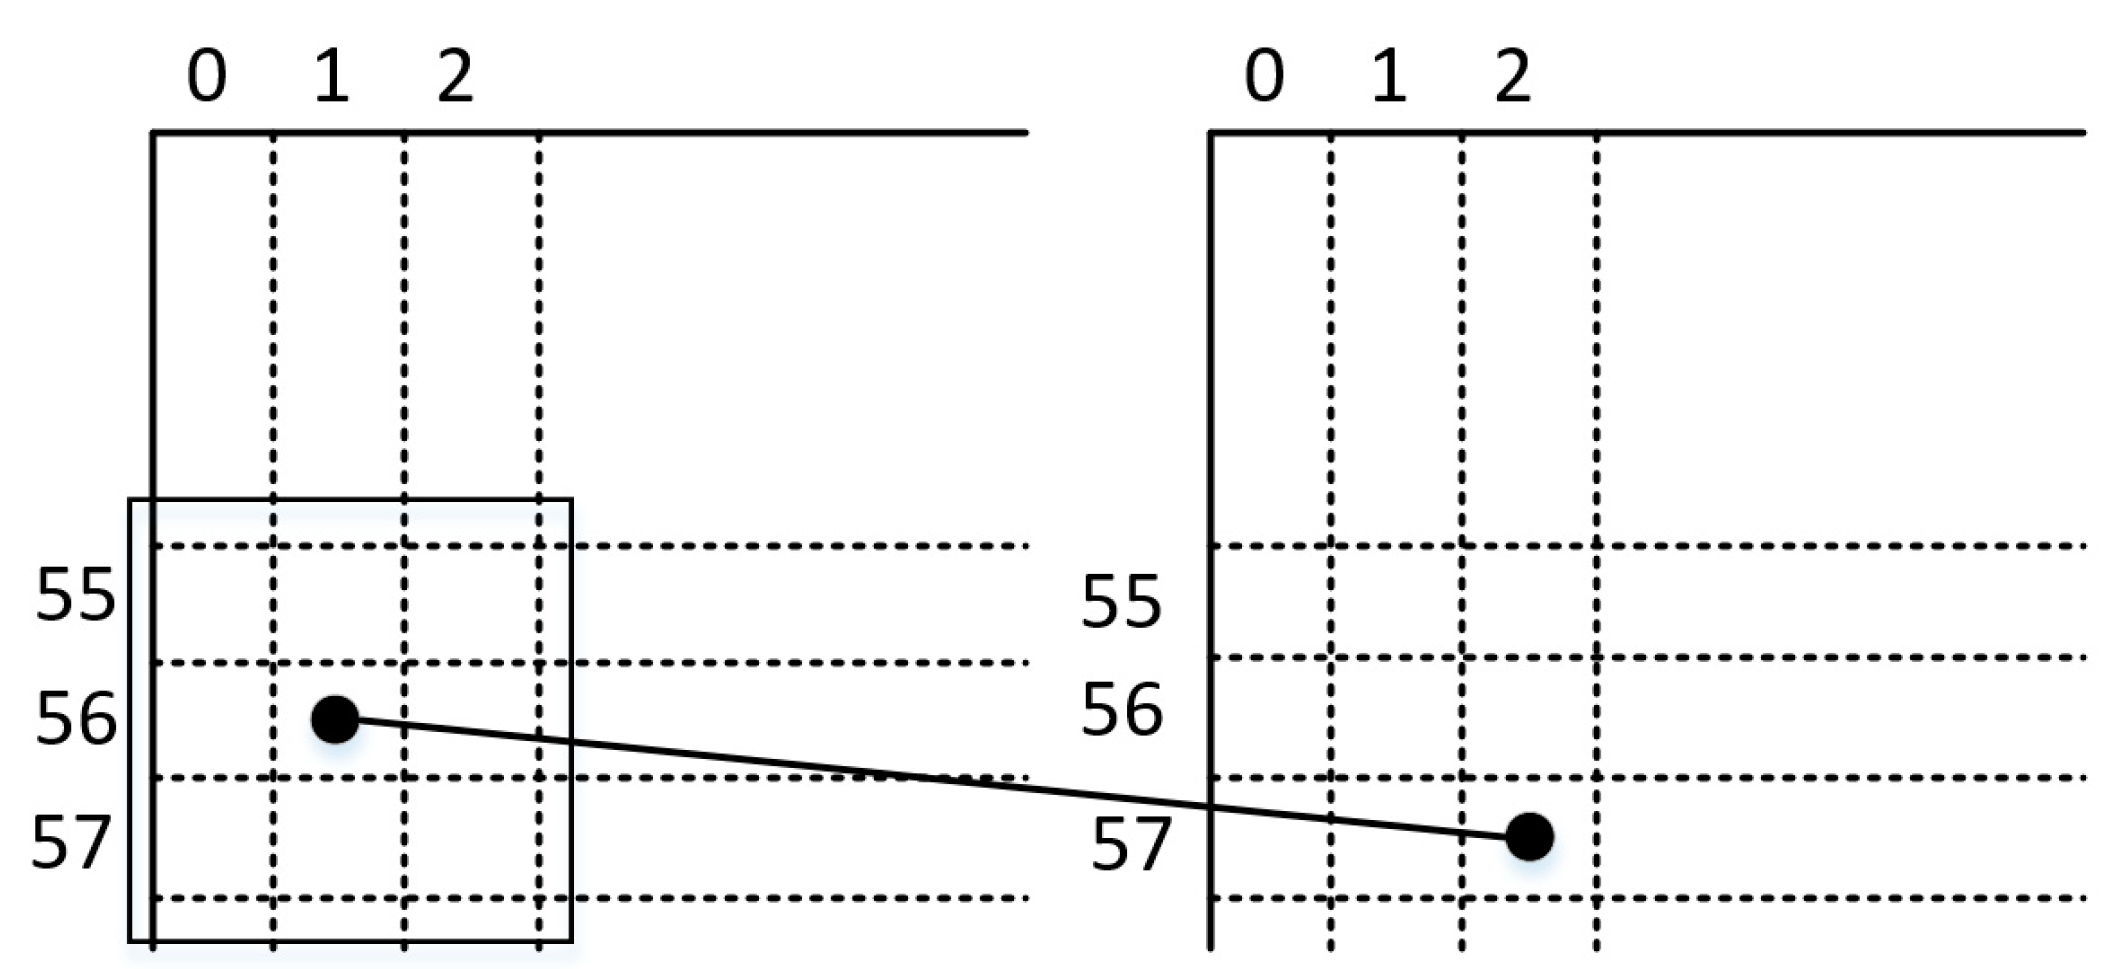
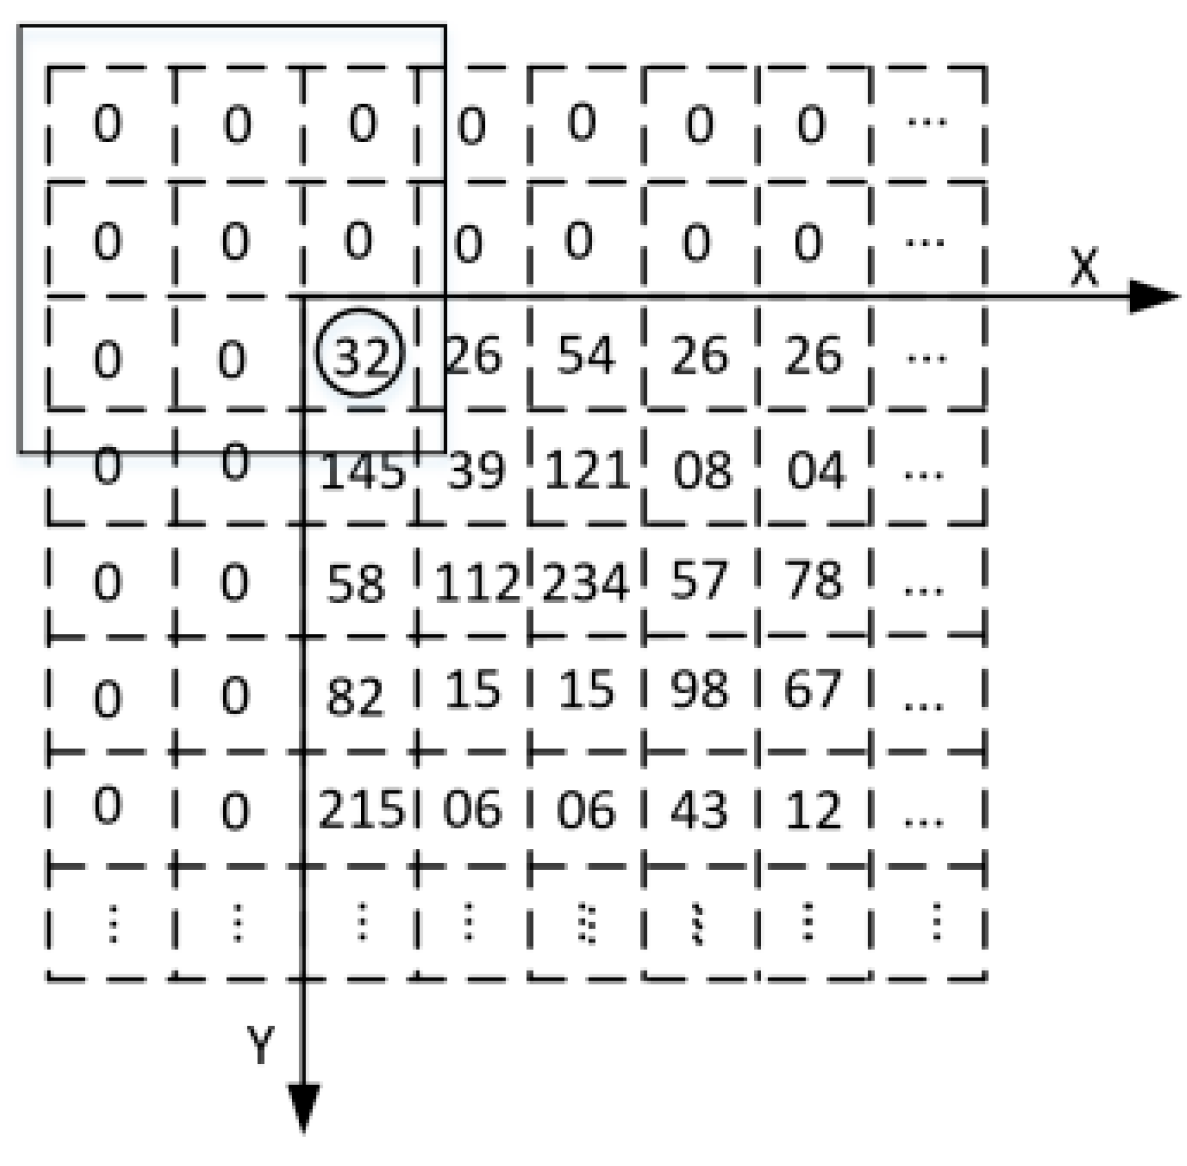
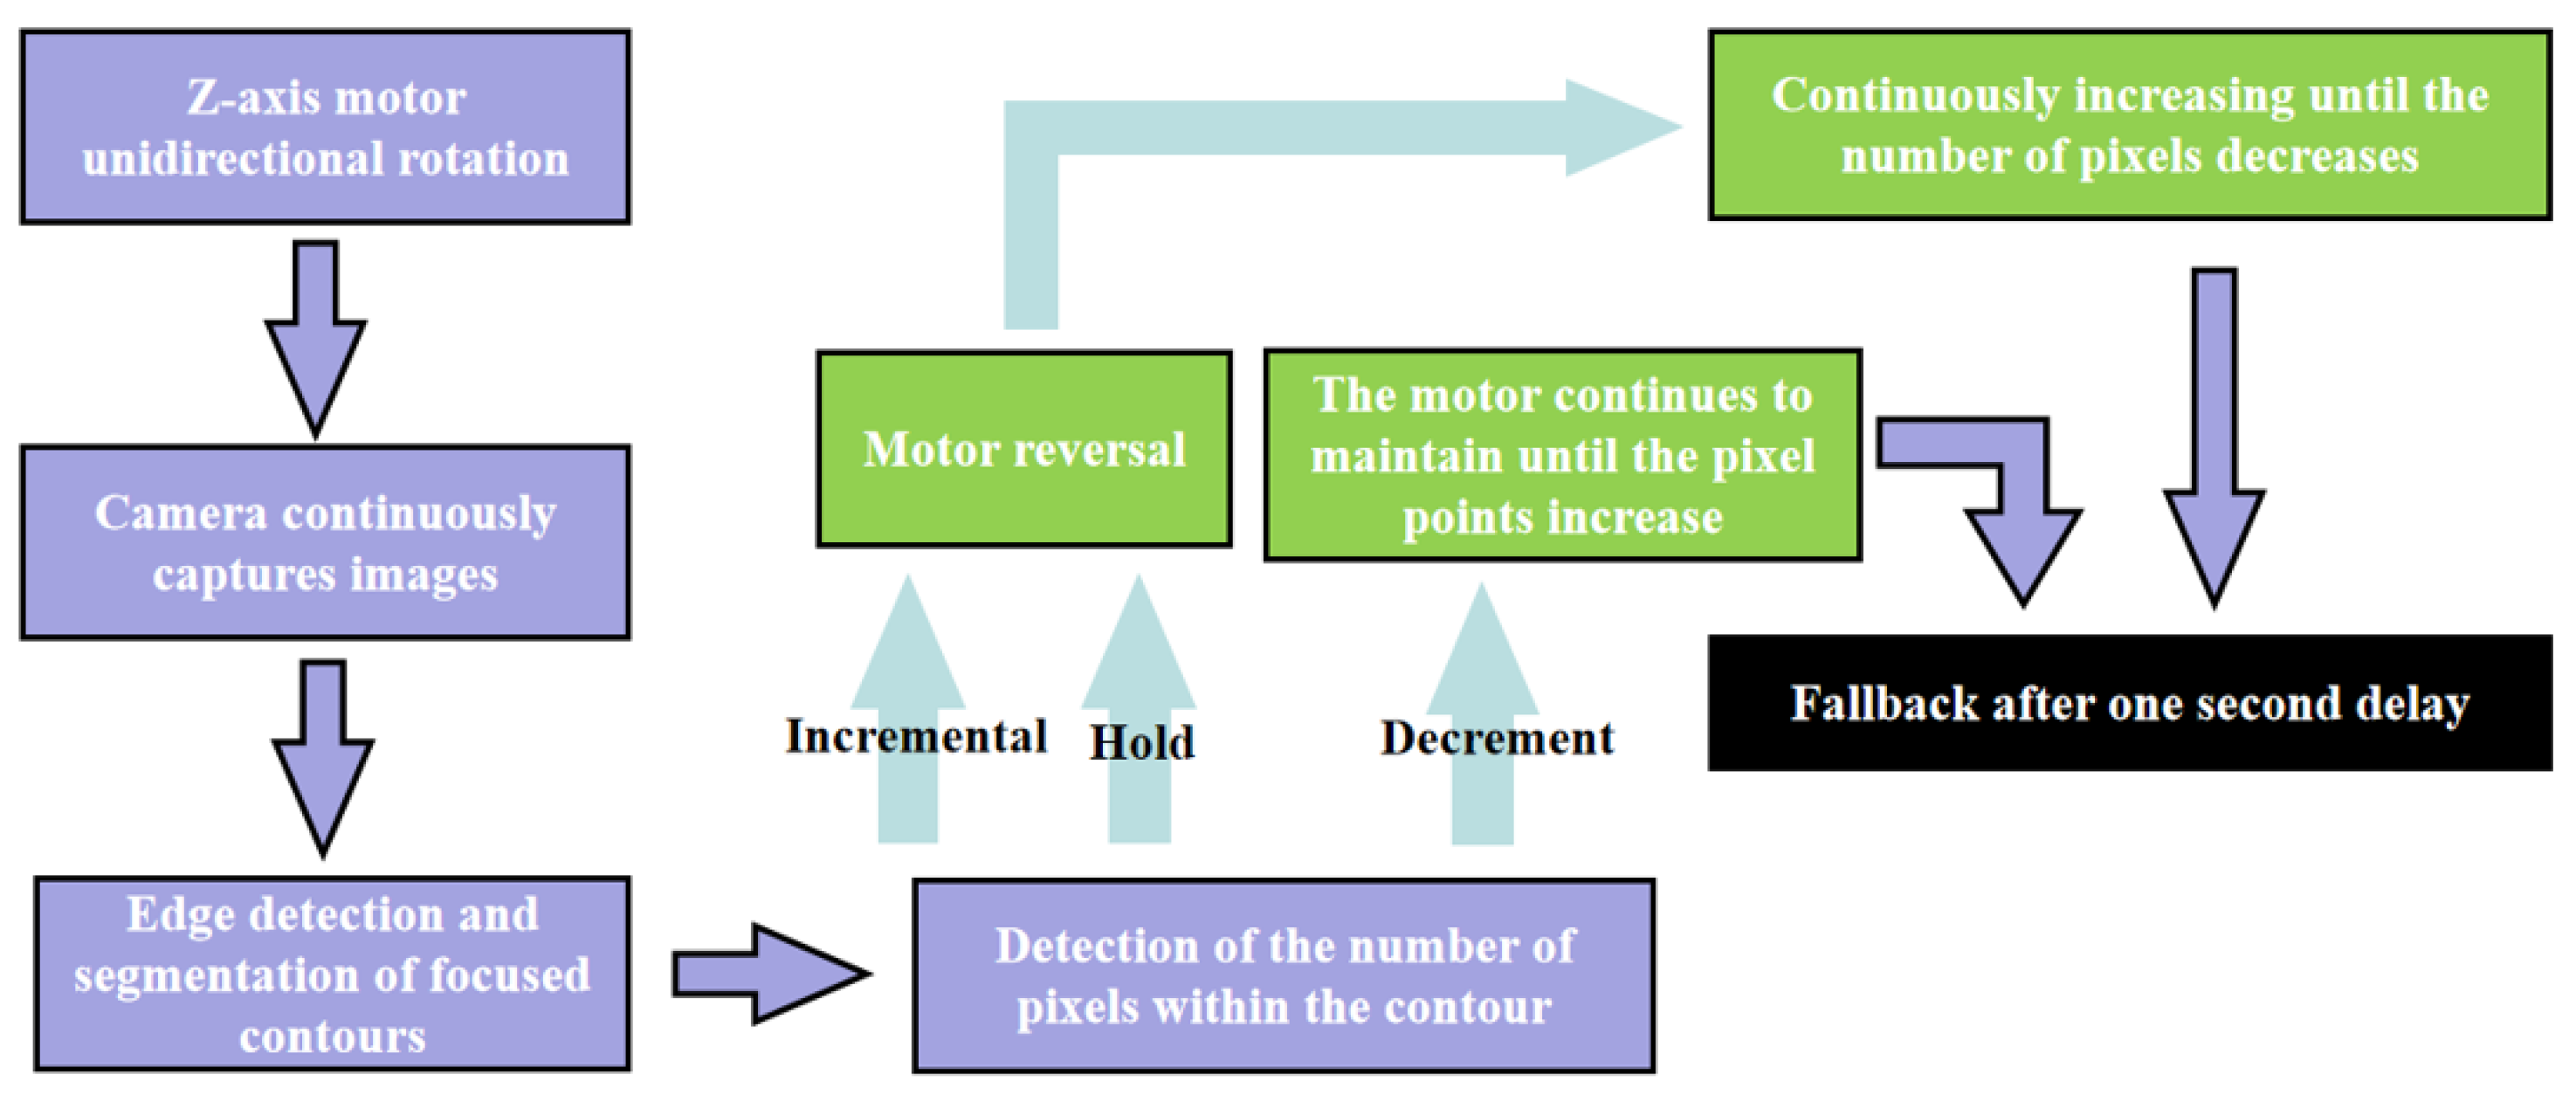
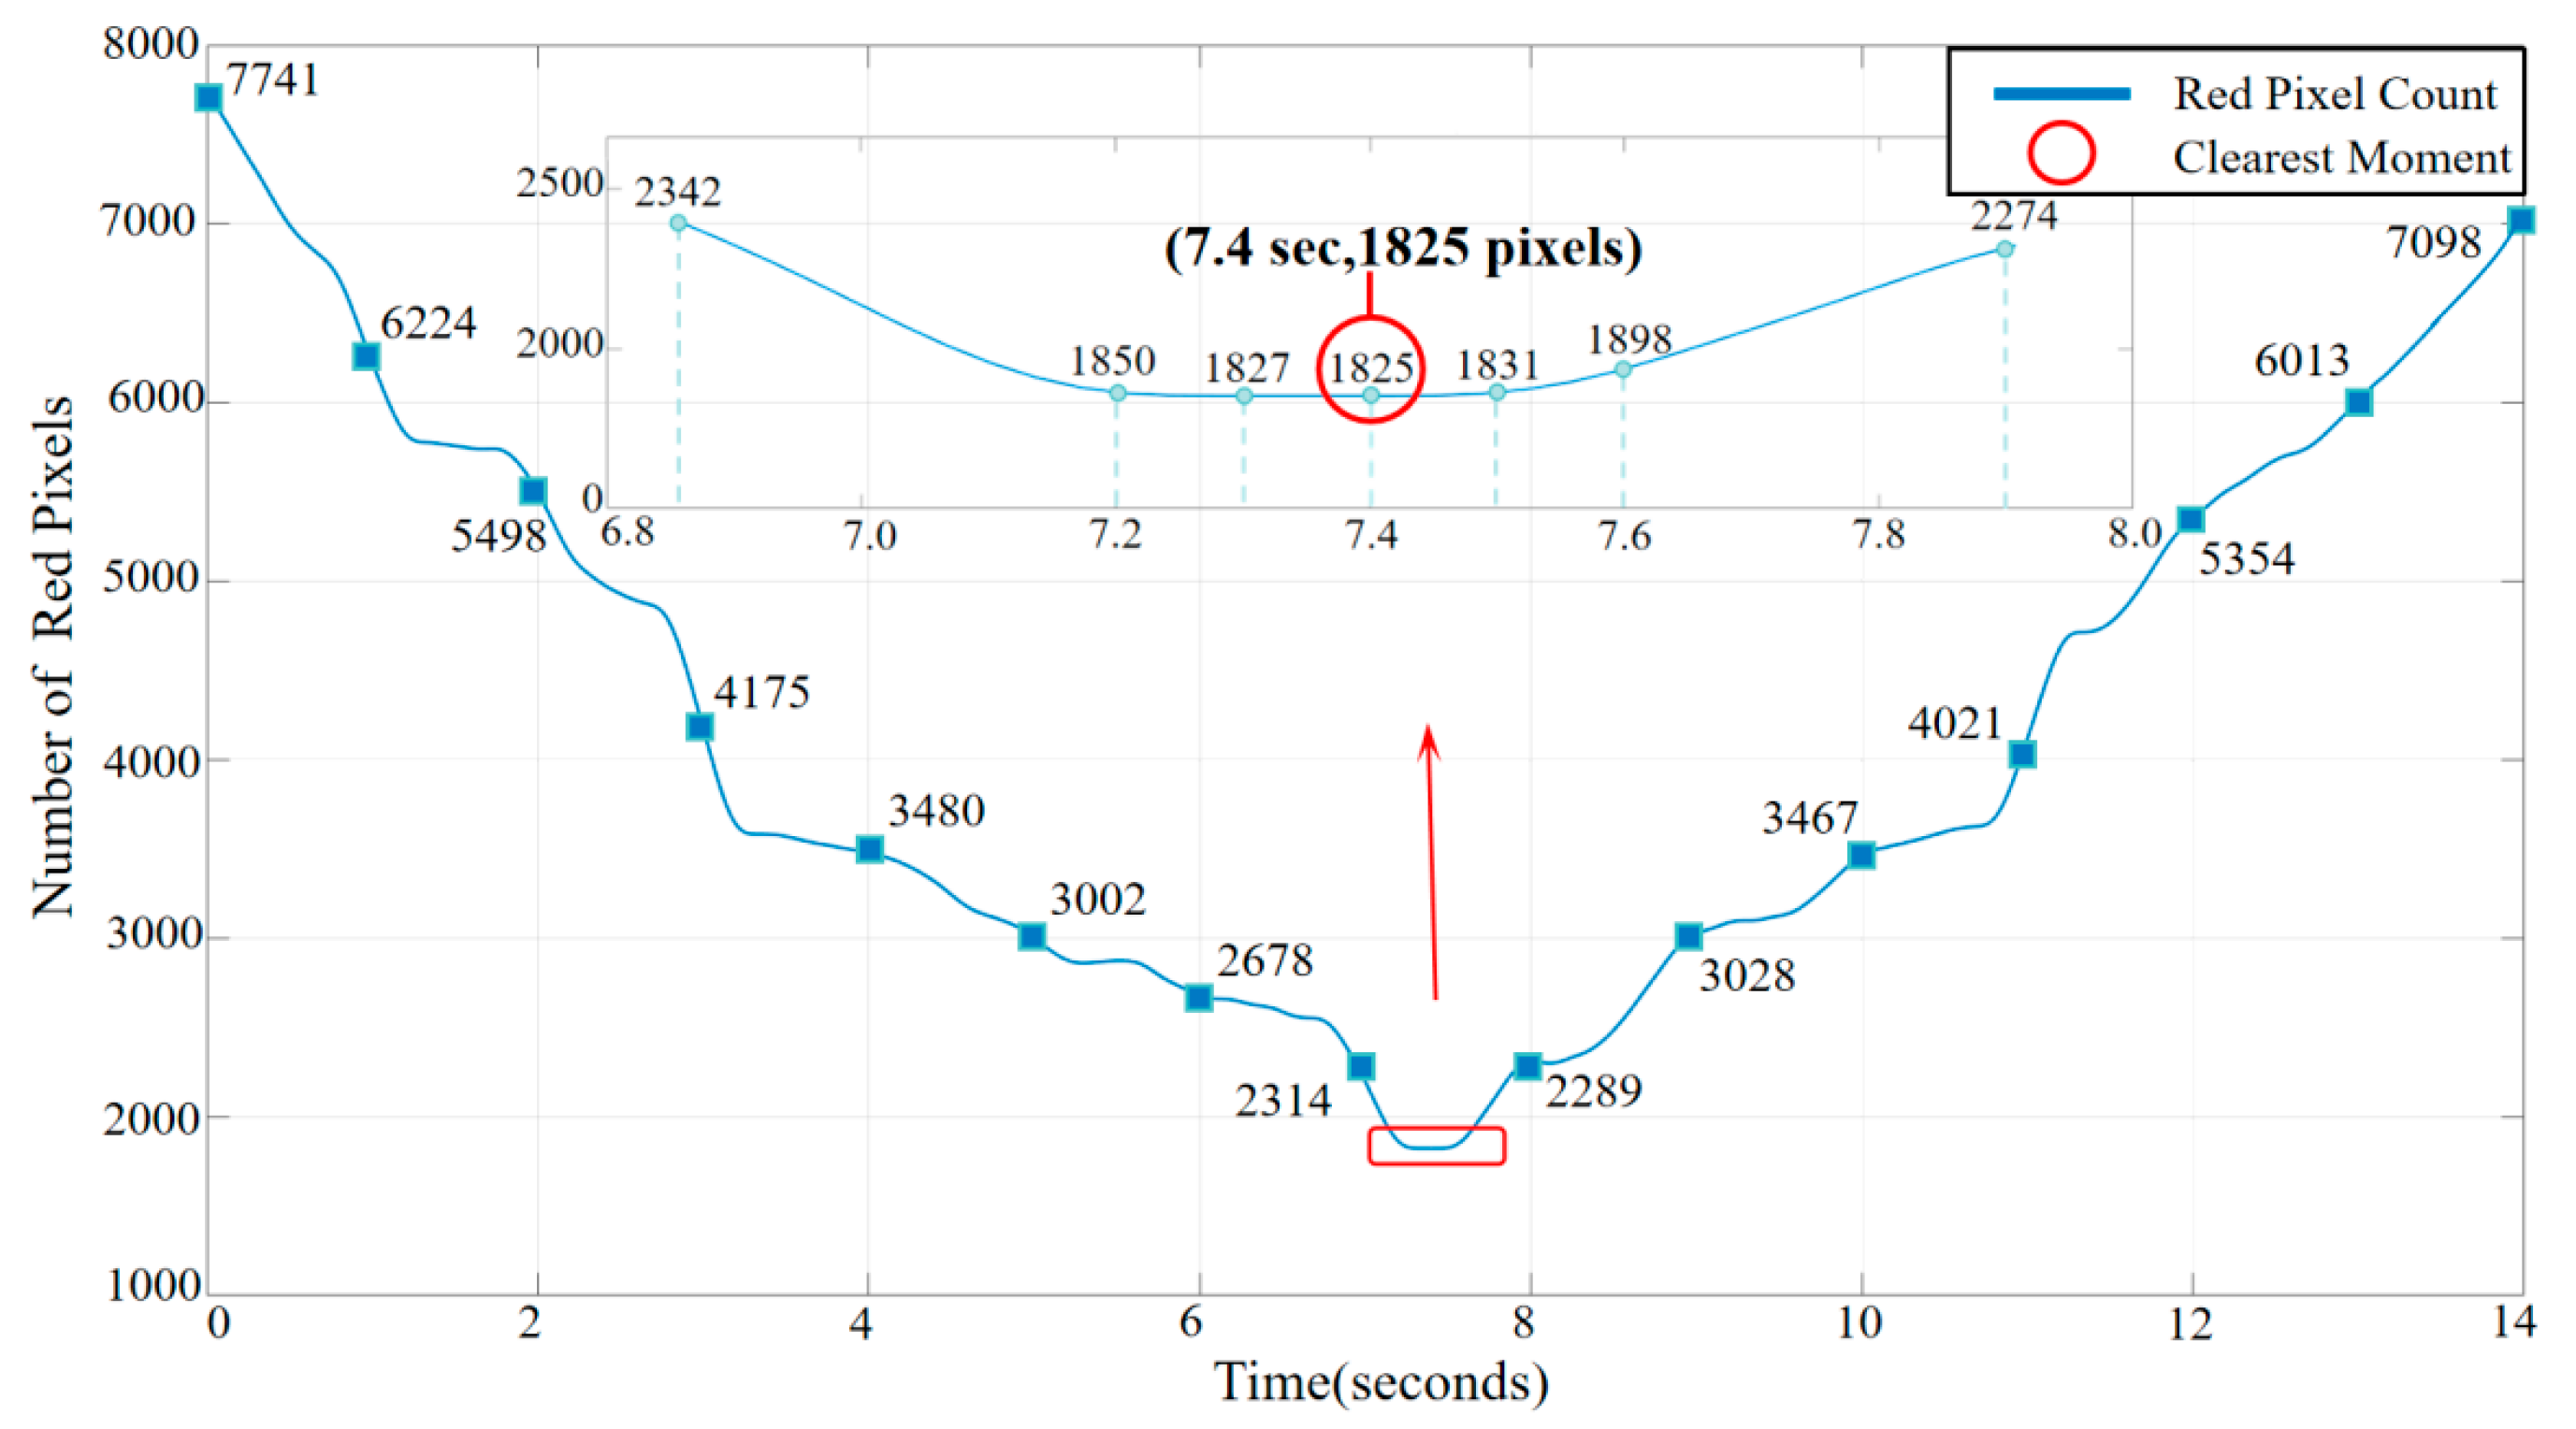
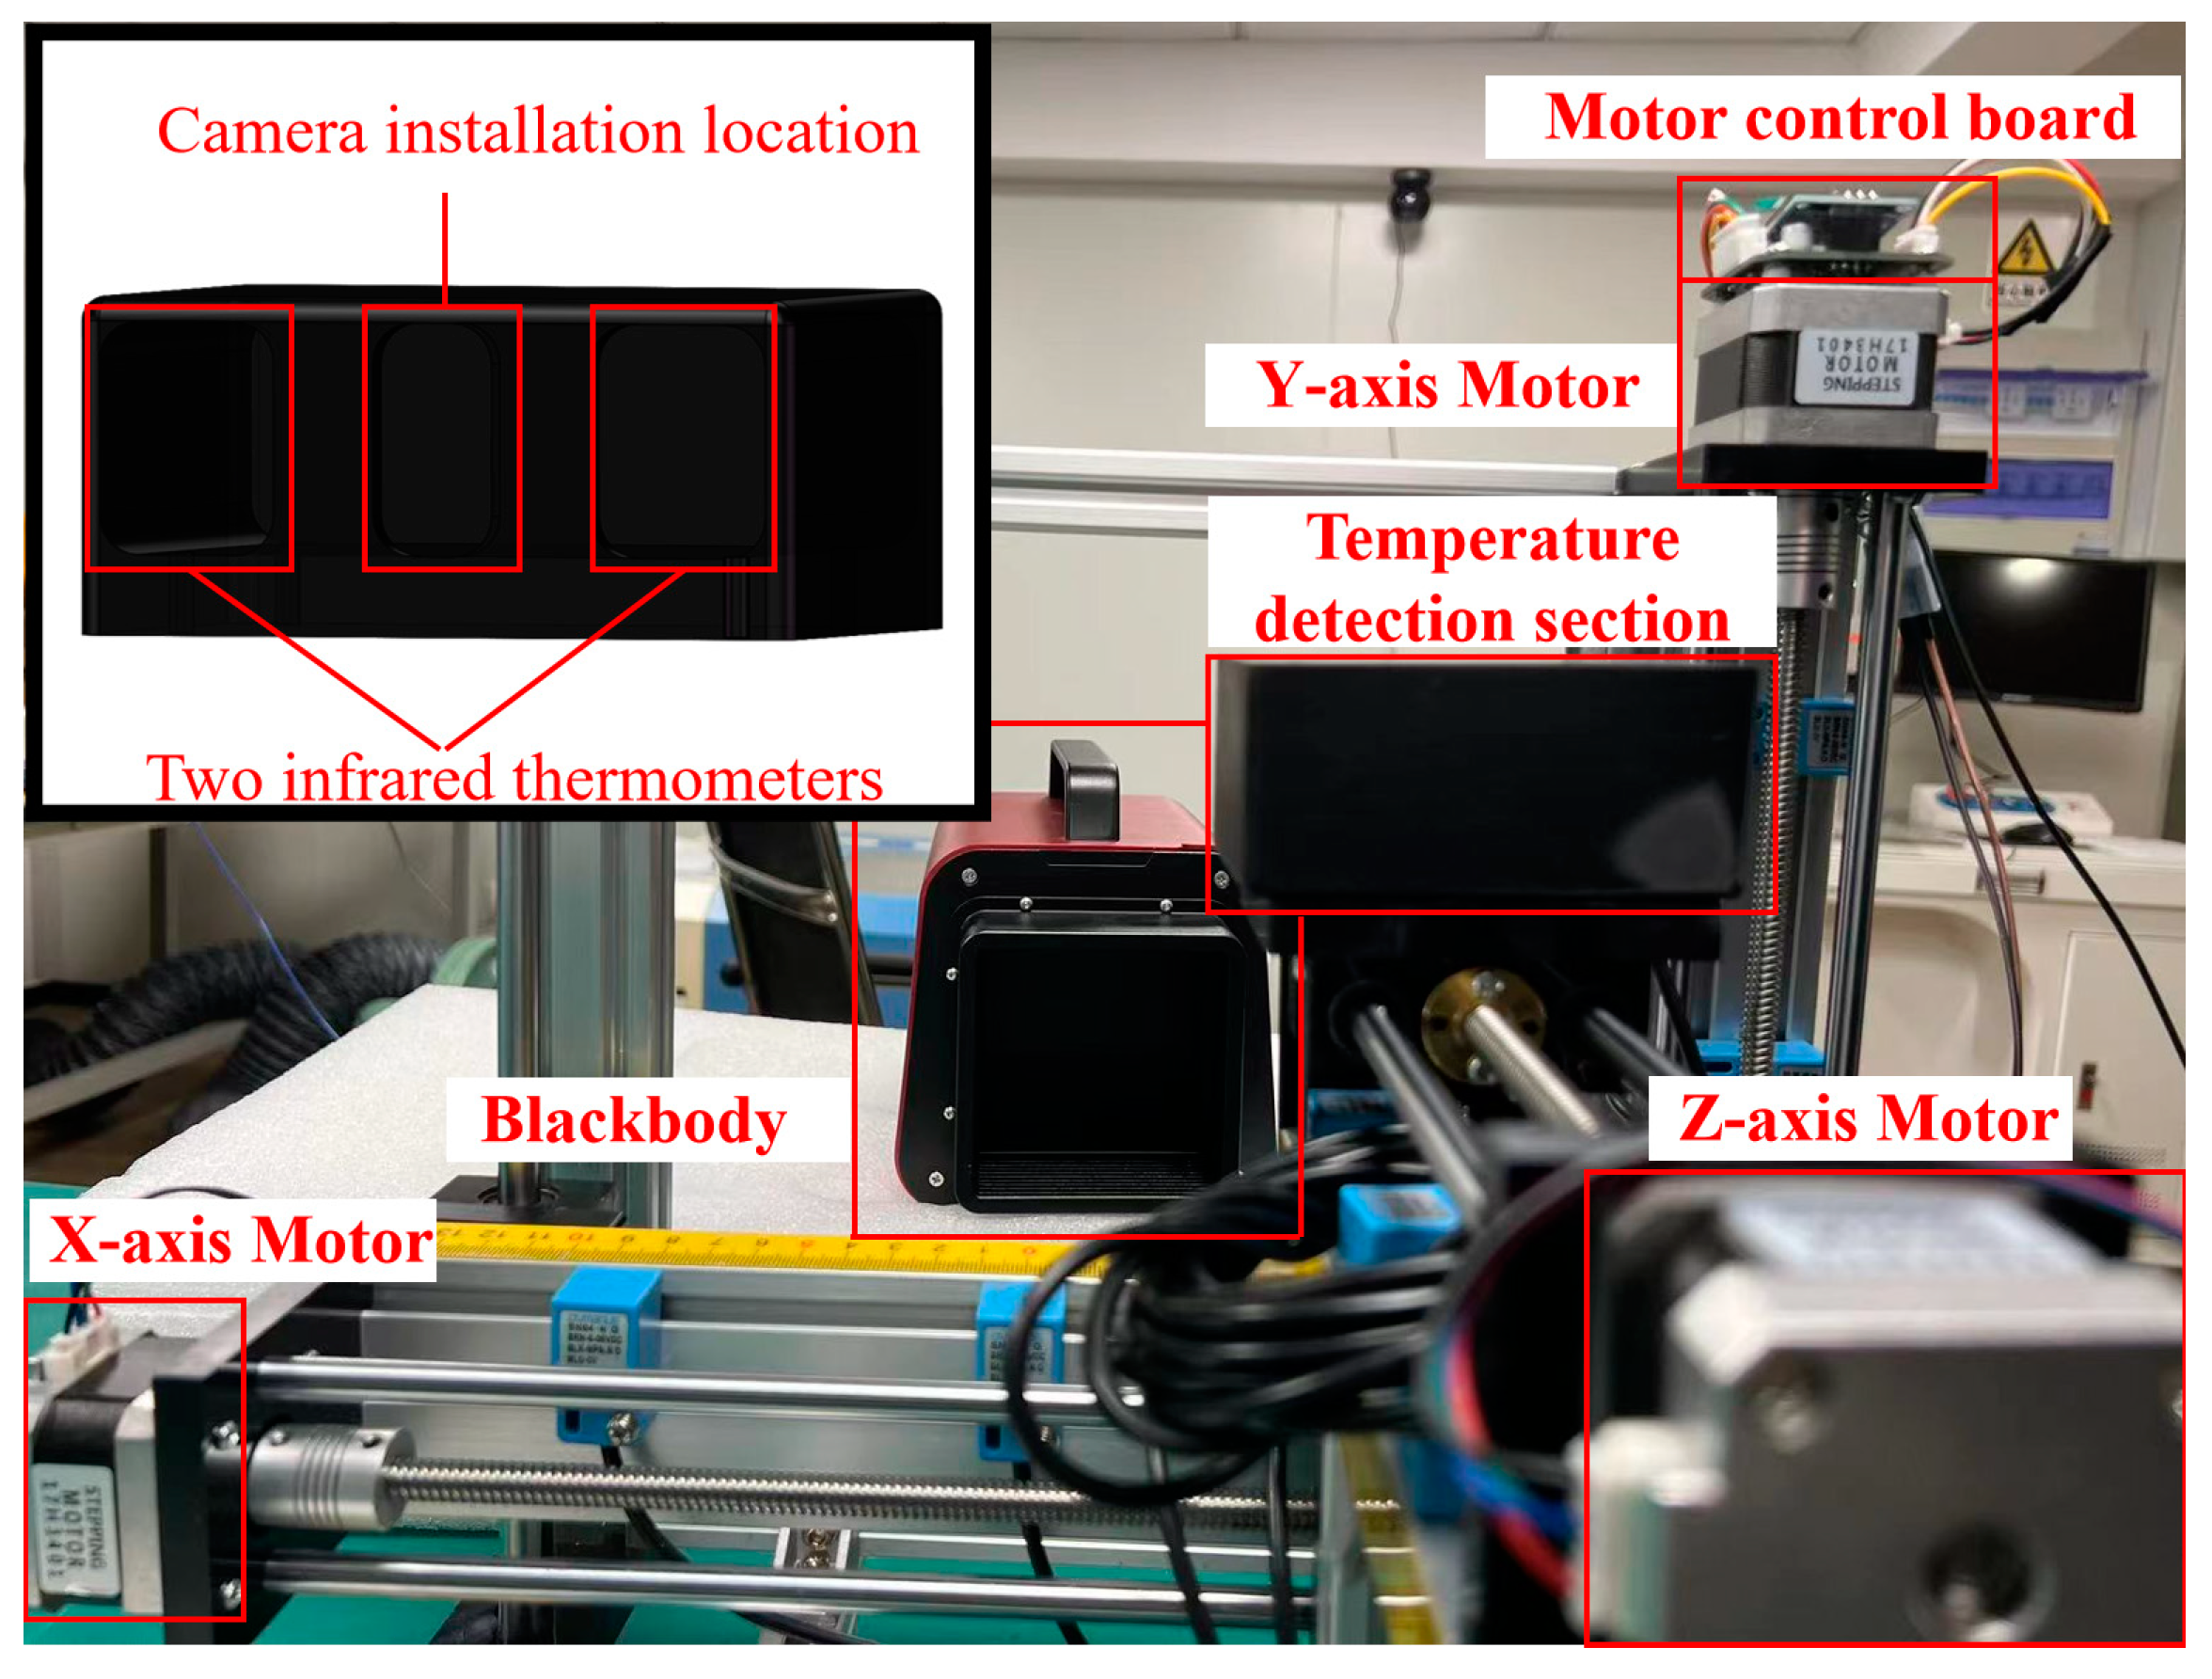
2.4. Auto-Correction System for the Focusing and Motor Control Method
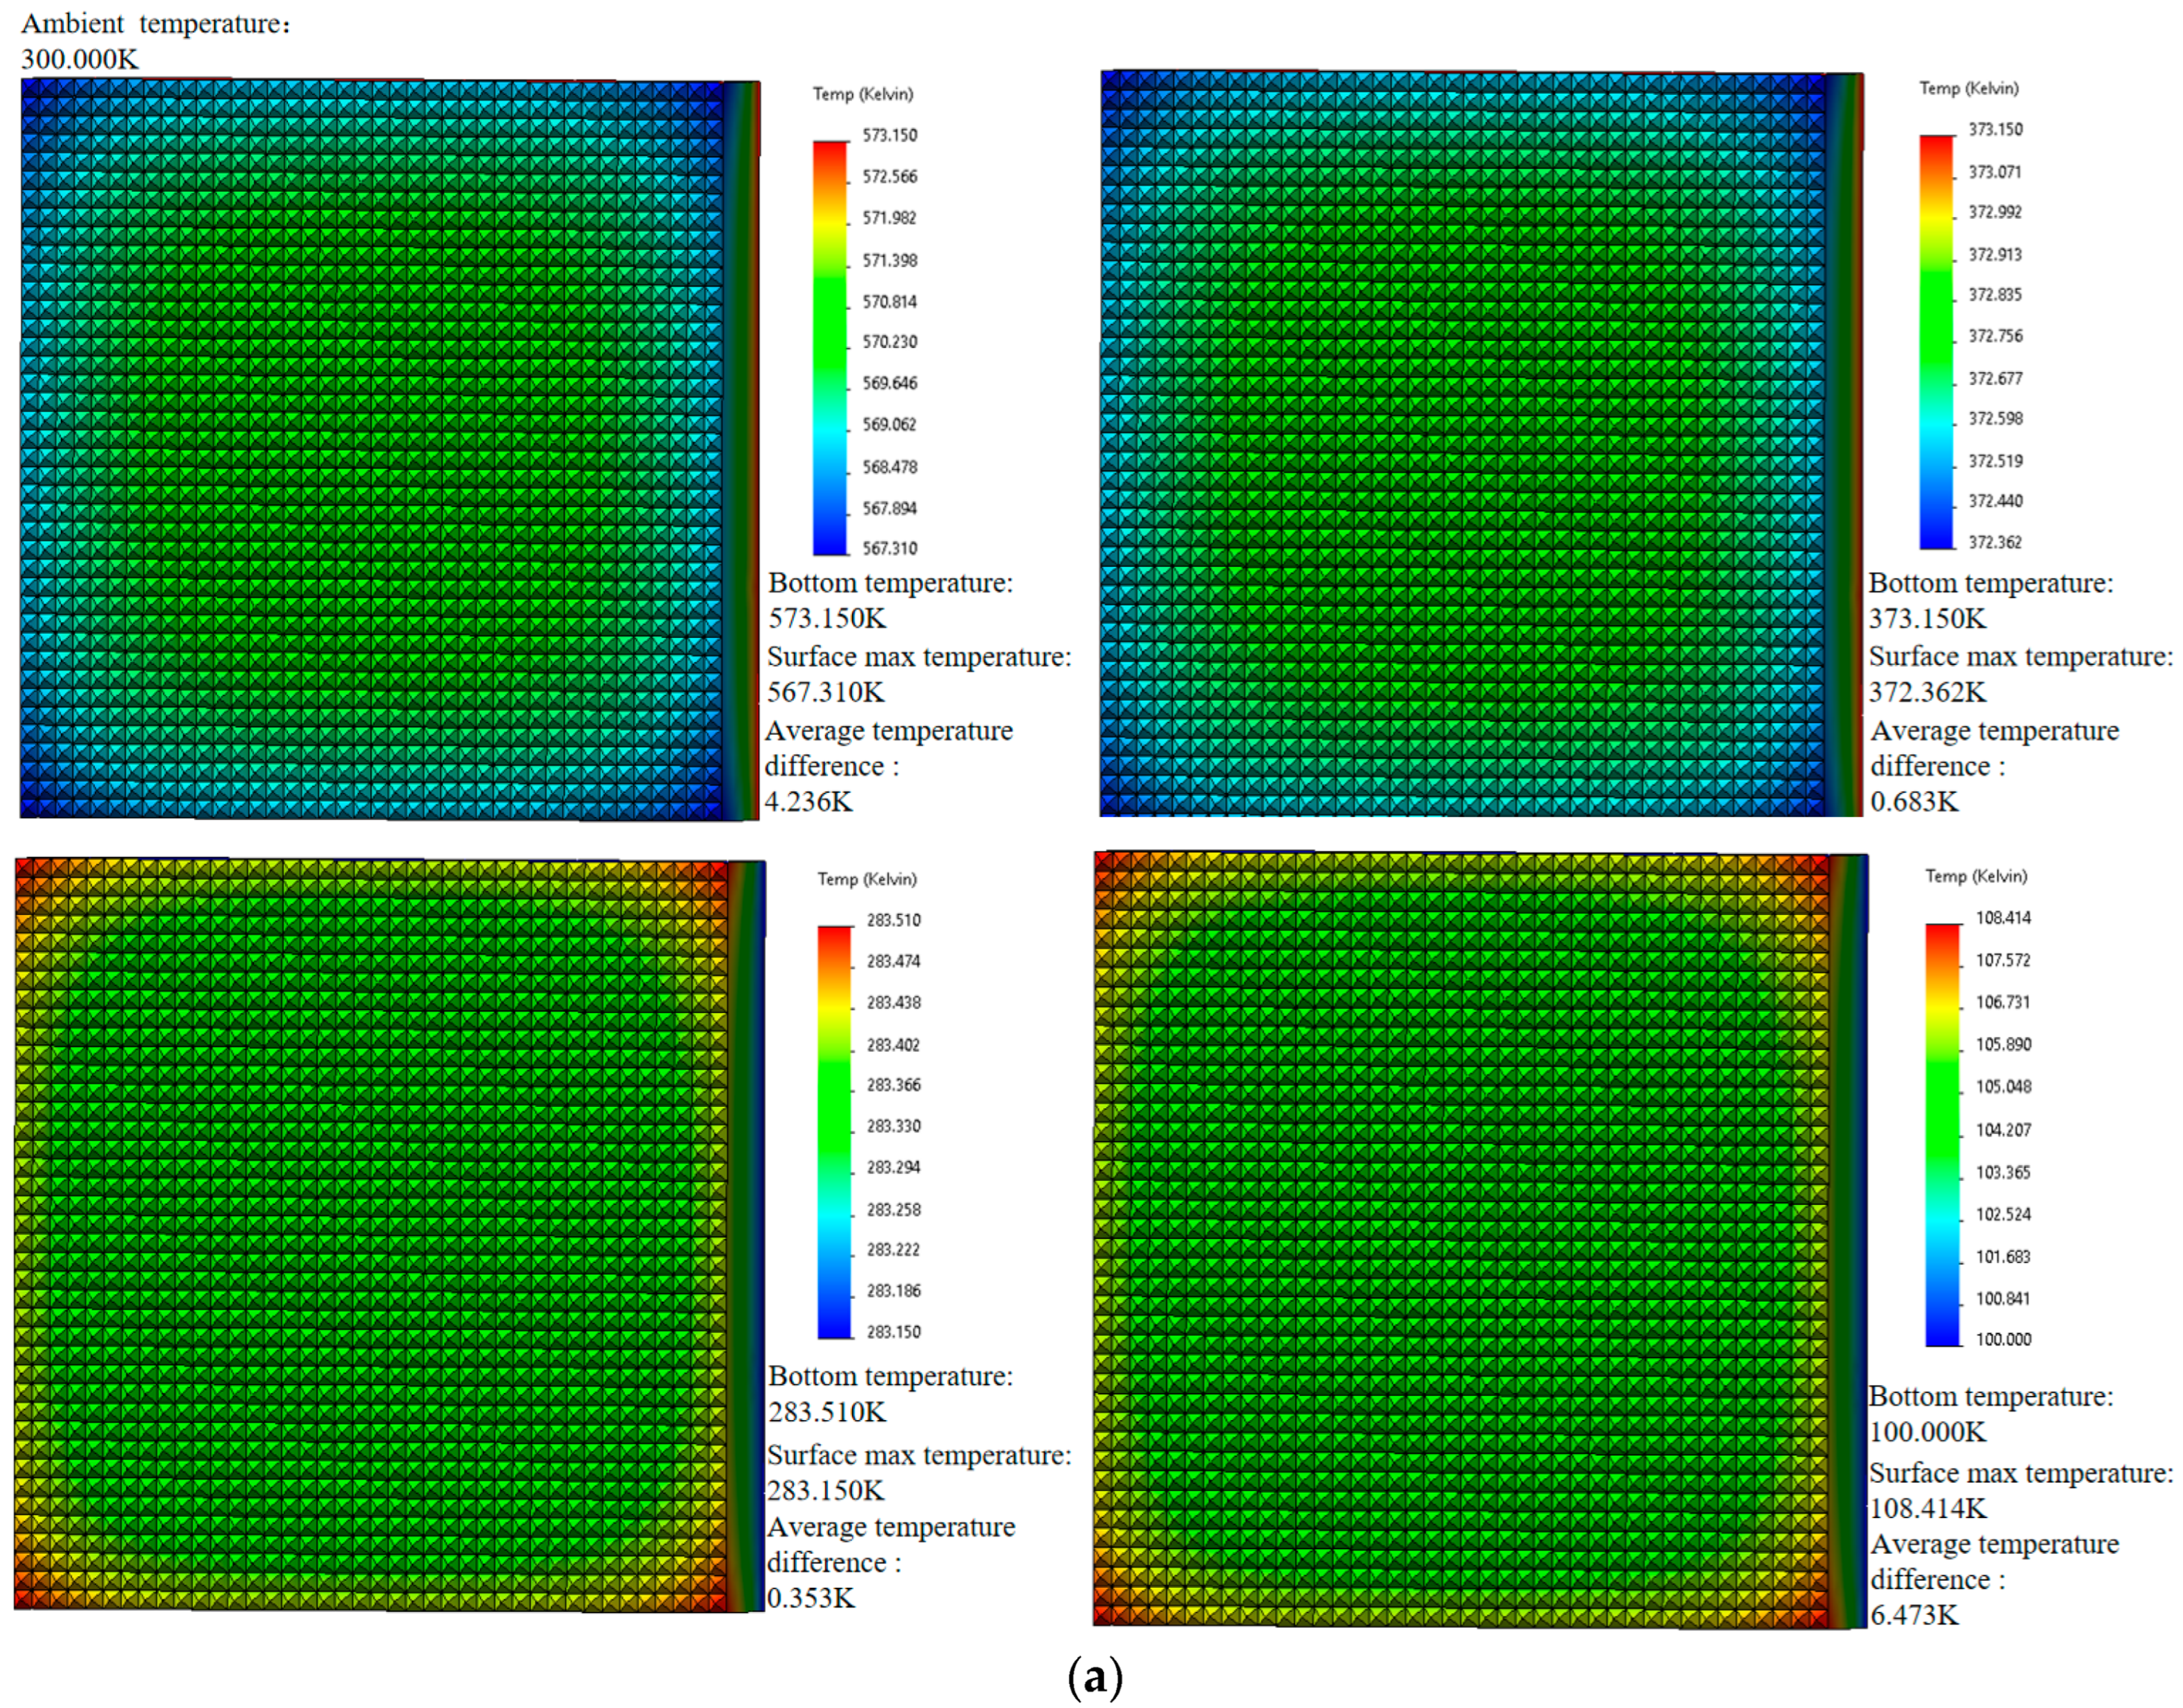
3. Simulation of Focusing Procedure and Temperature Correction
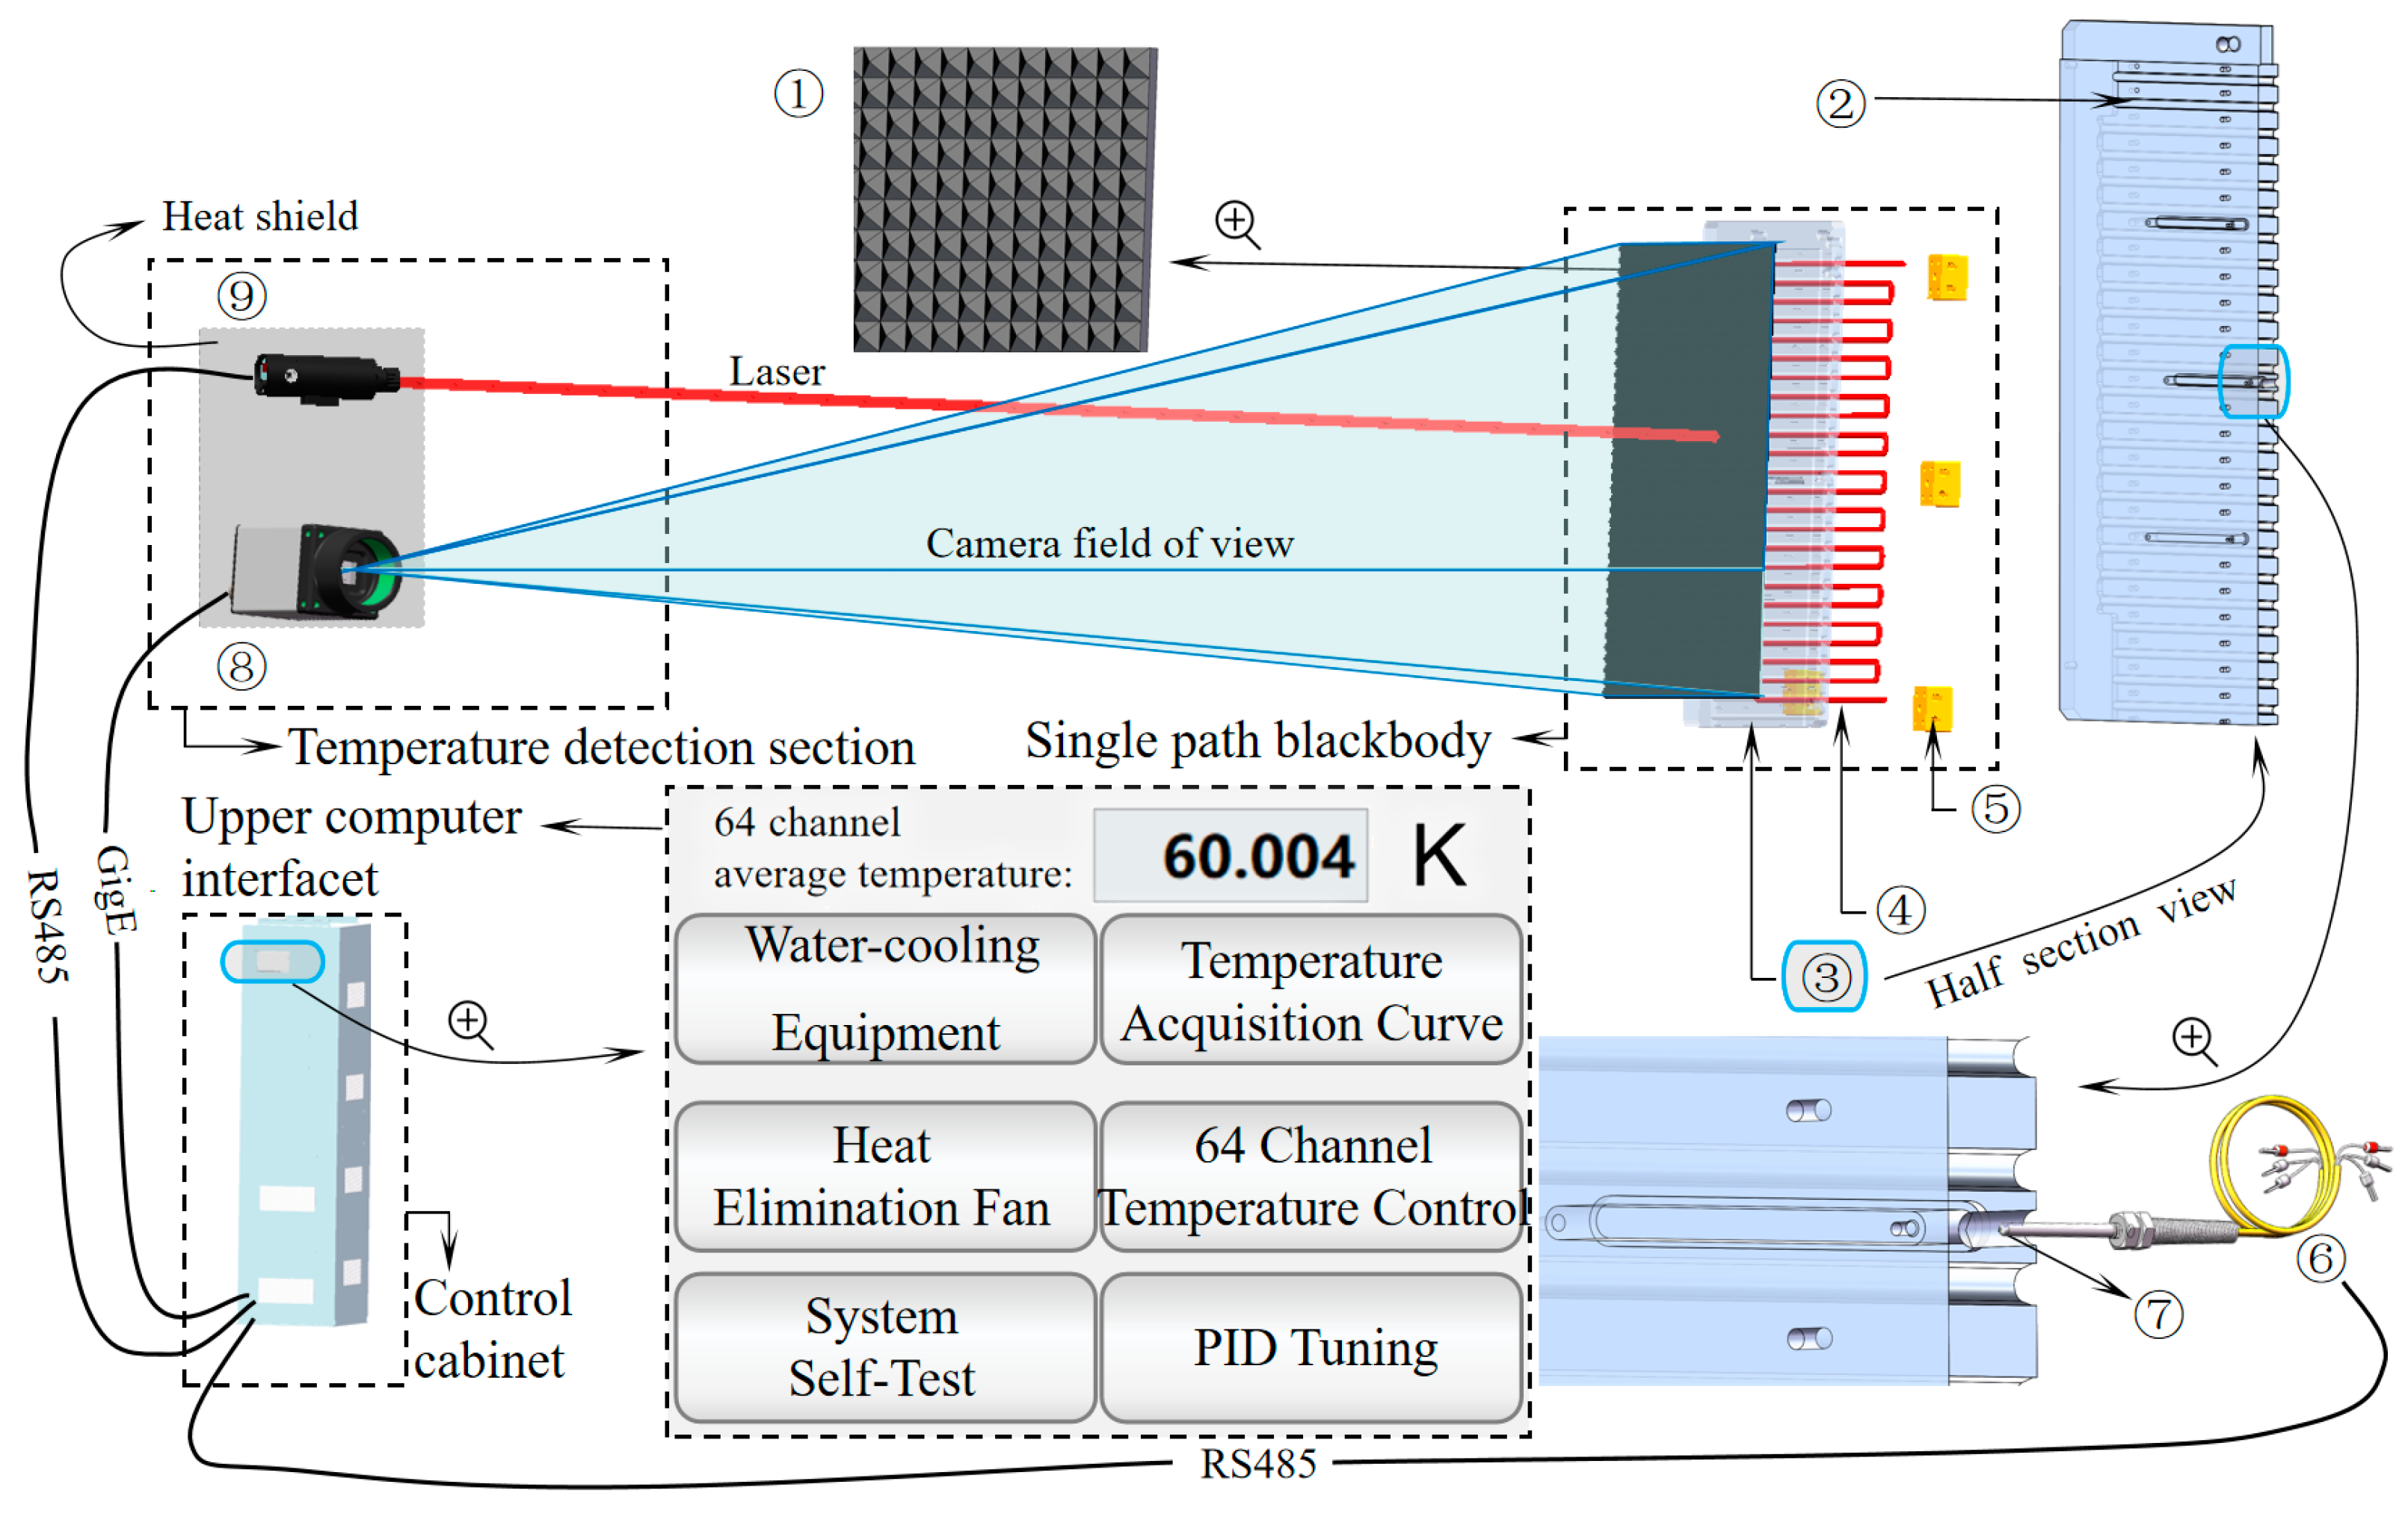
4. Experimental Measurement
5. Discussion
6. Conclusions
Author Contributions
Funding
Institutional Review Board Statement
Informed Consent Statement
Data Availability Statement
Conflicts of Interest
References
- Ayanu, Y.Z.; Conrad, C. Quantifying and mapping ecosystem services supplies and demands: A review of remote sensing applications. Environ. Sci. Technol. 2012, 46, 8529–8541. [Google Scholar] [CrossRef]
- Lundquist, J.D.; Chickadel, C. Separating snow and forest temperatures with thermal infrared remote sensing. Remote Sens. Environ. 2018, 209, 764–779. [Google Scholar] [CrossRef]
- Zhang, H.; Wang, C.S. Design and lmplementation of an lnfrared Radiant Source for Humidity Testing. Sensors 2018, 18, 3088. [Google Scholar] [CrossRef]
- Hu, Z.Y.; Hei, H.G.; Li, X.Y.; Chen, F.S. Modeling background response and applications for mid-infraredremote sensing camera. Infrared Phys. Technol. 2019, 103, 103082. [Google Scholar] [CrossRef]
- Szpakowski, D.M.; Jensen, J.L.R. A Review of the Applications of Remote Sensing in Fire Ecology. Remote Sens. 2019, 11, 2638. [Google Scholar] [CrossRef]
- Goswami, B.; Bhandari, G. A quantitative precipitation forecast model using convective-cloudtracking in satellite thermal infrared images and adaptive regression: Acase study along East Coast of India. Model Earth Syst. Environ. 2021, 7, 1097–1105. [Google Scholar] [CrossRef]
- Mlynczak, M.G.; Knipp, D.J. Space-Based Sentinels for Measurement of Infrared Cooling in the Thermosphere for space Weather Nowcasting and Forecasting. Space Weather 2018, 16, 363–375. [Google Scholar] [CrossRef] [PubMed]
- Gu, M.; Ren, Q.; Zhou, J.; Liao, S. Analysis and identification of infrared radiation characteristics of different attitude targets. Appl. Opt. 2021, 60, 109–118. [Google Scholar] [CrossRef] [PubMed]
- Manara, J.; Zipf, M.; Stark, T.; Arduini, M.; Ebert, H.-P.; Tutschke, A.; Hallam, A.; Hanspal, J.; Langley, M.; Hodge, D.; et al. Long wavelength infrared radiation thermometry for non-contact temperature measurements in gas turbines. Infrared Phys. Technol. 2017, 80, 120–130. [Google Scholar] [CrossRef]
- Ma, L.; Sun, H.; Ngo, I.; Han, J. Infrared radiation quantification of rock damage and its constitutive modeling under loading. Infrared Phys. Technol. 2022, 121, 104044. [Google Scholar] [CrossRef]
- Larciprete, M.C.; Paoloni, S.; Li Voti, R.; Gloy, Y.S.; Sibilia, C. Infrared radiation characterization of several stainless steel textiles in the 3.5–5.1 µm infrared range. Int. J. Therm. Sci. 2018, 132, 168–173. [Google Scholar] [CrossRef]
- Cui, S.; Xing, J. Research on Calibration Method of Infrared Temperature Measurement System near Room Temperature Field. Front. Phys. 2022, 9, 786443. [Google Scholar] [CrossRef]
- Mermelstein, M.D.; Snail, K.A.; Priest, R.G. Spectral and radiometric calibration of midwave and longwave infrared cameras. Opt. Eng. 2000, 39, 347–352. [Google Scholar] [CrossRef]
- Zhou, J.J.; Hao, X.P. Stray light separation based on the changeable veiling glare index for the vacuum radiance temperature standard facility. Opt. Express 2021, 29, 12344–12356. [Google Scholar] [CrossRef] [PubMed]
- Rani, A.; Upadhyay, R.S. Investigating Temperature Distribution of Two Different Types of Blackbody Sources Using Infrared Pyrometry Techniques. Mapan 2013, 28, 91–98. [Google Scholar] [CrossRef]
- Ji, Y.L.; Hao, X.P. Research on Large-Area Blackbody Radiation Source for Infrared Remote Sensor Calibration. Int. J. Thermophys. 2022, 43, 142. [Google Scholar] [CrossRef]
- Song, X.-Y.; Duanmu, Q.-D.; Dong, W.; Li, Z.-B. Piecewise linear calibration of the spectral responsivity of FTIR based on the high temperature blackbody. In Proceedings of the 5th International Symposium on Laser Interaction with Matter (LIMIS), Changsha, China, 11–13 November 2018. [Google Scholar] [CrossRef]
- Shu, X.; Hao, X.P. Research of 100~400 K Vacuum Infrared Radiance Temperature Standard Blackbody Source. Acta Metrol. Sin. 2019, 40, 13–19. [Google Scholar]
- Yoon, S.T.; Park, J.C.; Cho, Y.J. An experimental study on the evaluation of temperature uniformity on the surface of a blackbody using infrared cameras. Quant. Infrared Thermogr. J. 2021, 19, 172–186. [Google Scholar] [CrossRef]
- Wesley, B.; Vivek, P.; Jamie, M. A metrology enabled thermal imager for thermal vacuum testing. Quant. Infrared Thermogr. J. 2023, 20, 182–197. [Google Scholar] [CrossRef]
- Artem, A.T.; Thomas, R.W.; Thomas, R.M. Infrared thermometry in high temperature materials processing: Influence of liquid water and steam. Quant. Infrared Thermogr. J. 2023, 20, 123–141. [Google Scholar] [CrossRef]
- Minkina, W. Theoretical basics of radiant heat transfer–practical examples of calculation for the infrared (IR) used in infrared thermography measurements. Quant. Infrared Thermogr. J. 2022, 19, 172–186. [Google Scholar] [CrossRef]
- Kotecha, J.H.; Djuric, P.M. Gaussian sum particle filtering. IEEE Trans. Signal Process. 2003, 51, 2602–2612. [Google Scholar] [CrossRef]
- Hoang, N.D.; Nguyen, Q.L. Automatic recognition of asphalt pavement cracks using metaheuristic optimized edge detection algorithms and convolution neural network. Autom. Constr. 2018, 94, 203–213. [Google Scholar] [CrossRef]
- Li, Z.H.; Jin, H.Y. Edge detection algorithm of fractional order sobel operator for integer order differential filtering. Comput. Eng. Appl. 2018, 54, 179–184. [Google Scholar]


| Blackbody emitter size | 500 mm × 500 mm |
| Operating temperature range | 50 K–360 K |
| Temperature resolution | 0.001 K |
| Temperature accuracy | 0.01 K |
| Effective emissivity | 0.99 |
| Temperature uniformity | ≤0.5 K |
| Temperature control stability | 0.02 K/30 min |
| Temperature/K | The Average Difference between the Blackbody Surface Source Temperature and the Actual Temperature TTA/K | The Size of the Blackbody/mm | Average Ambient Temperature/K | Number of Temperature Controled Channels | |
|---|---|---|---|---|---|
| Manual | Automatic | ||||
| 100 | 0.781 | 0.456 | 500 × 500 | 80.278 | 16 |
| 283 | 0.011 | 0.007 | 2200 × 2200 | 301.872 | 64 |
| 373 | 0.035 | 0.017 | 2200 × 2200 | 301.981 | 64 |
| 573 | 1.023 | 0.693 | 1300 × 1300 | 301.102 | 32 |
| Temperature/K | Corrected Blackbody Surface Source Actual Temperature Uniformity /K | The Size of the Blackbody/mm | Average Ambient Temperature/K | Number of Temperature Controled Channels | |
|---|---|---|---|---|---|
| Manual | Automatic | ||||
| 100 | 0.437 | 0.283 | 500 × 500 | 80.273 | 16 |
| 283 | 0.116 | 0.071 | 2200 × 2200 | 301.872 | 64 |
| 373 | 0.725 | 0.327 | 2200 × 2200 | 301.981 | 64 |
| 573 | 2.213 | 1.189 | 1300 × 1300 | 301.102 | 32 |
| Performance Name | Increase the Proportion |
|---|---|
| Temperature measurement point consistency | 85.4% |
| Temperature measurement deviation | 40.4% |
| Temperature uniformity | 43.8% |
| Correction efficiency | 9.82 Times |
Disclaimer/Publisher’s Note: The statements, opinions and data contained in all publications are solely those of the individual author(s) and contributor(s) and not of MDPI and/or the editor(s). MDPI and/or the editor(s) disclaim responsibility for any injury to people or property resulting from any ideas, methods, instructions or products referred to in the content. |
© 2024 by the authors. Licensee MDPI, Basel, Switzerland. This article is an open access article distributed under the terms and conditions of the Creative Commons Attribution (CC BY) license (https://creativecommons.org/licenses/by/4.0/).
Share and Cite
Yang, W.; Cao, C.; Huang, P.; Bai, J.; Zhao, B.; Zhu, S.; Jin, H.; Jin, K.; He, X.; Li, C.; et al. Temperature-Automated Calibration Methods for a Large-Area Blackbody Radiation Source. Sensors 2024, 24, 1707. https://doi.org/10.3390/s24051707
Yang W, Cao C, Huang P, Bai J, Zhao B, Zhu S, Jin H, Jin K, He X, Li C, et al. Temperature-Automated Calibration Methods for a Large-Area Blackbody Radiation Source. Sensors. 2024; 24(5):1707. https://doi.org/10.3390/s24051707
Chicago/Turabian StyleYang, Wenhang, Chen Cao, Pujiang Huang, Jindong Bai, Bangjian Zhao, Shouzheng Zhu, Haijun Jin, Ke Jin, Xin He, Chunlai Li, and et al. 2024. "Temperature-Automated Calibration Methods for a Large-Area Blackbody Radiation Source" Sensors 24, no. 5: 1707. https://doi.org/10.3390/s24051707
APA StyleYang, W., Cao, C., Huang, P., Bai, J., Zhao, B., Zhu, S., Jin, H., Jin, K., He, X., Li, C., Wang, J., Liu, S., & Qi, H. (2024). Temperature-Automated Calibration Methods for a Large-Area Blackbody Radiation Source. Sensors, 24(5), 1707. https://doi.org/10.3390/s24051707