
Improving Dust Aerosol Optical Depth (DAOD) Retrieval from the GEOKOMPSAT-2A (GK-2A) Satellite for Daytime and Nighttime Monitoring


Abstract
1. Introduction
2. Materials and Methods
2.1. Materials
2.1.1. Satellite Observations: GEOKOMPSAT-2A (GK-2A)
2.1.2. AERONET
2.1.3. Suomi-NPP/VIIRS
2.1.4. CALIPSO/CALIOP
2.1.5. Dust Storm Events in 2020–2021
2.2. Methods
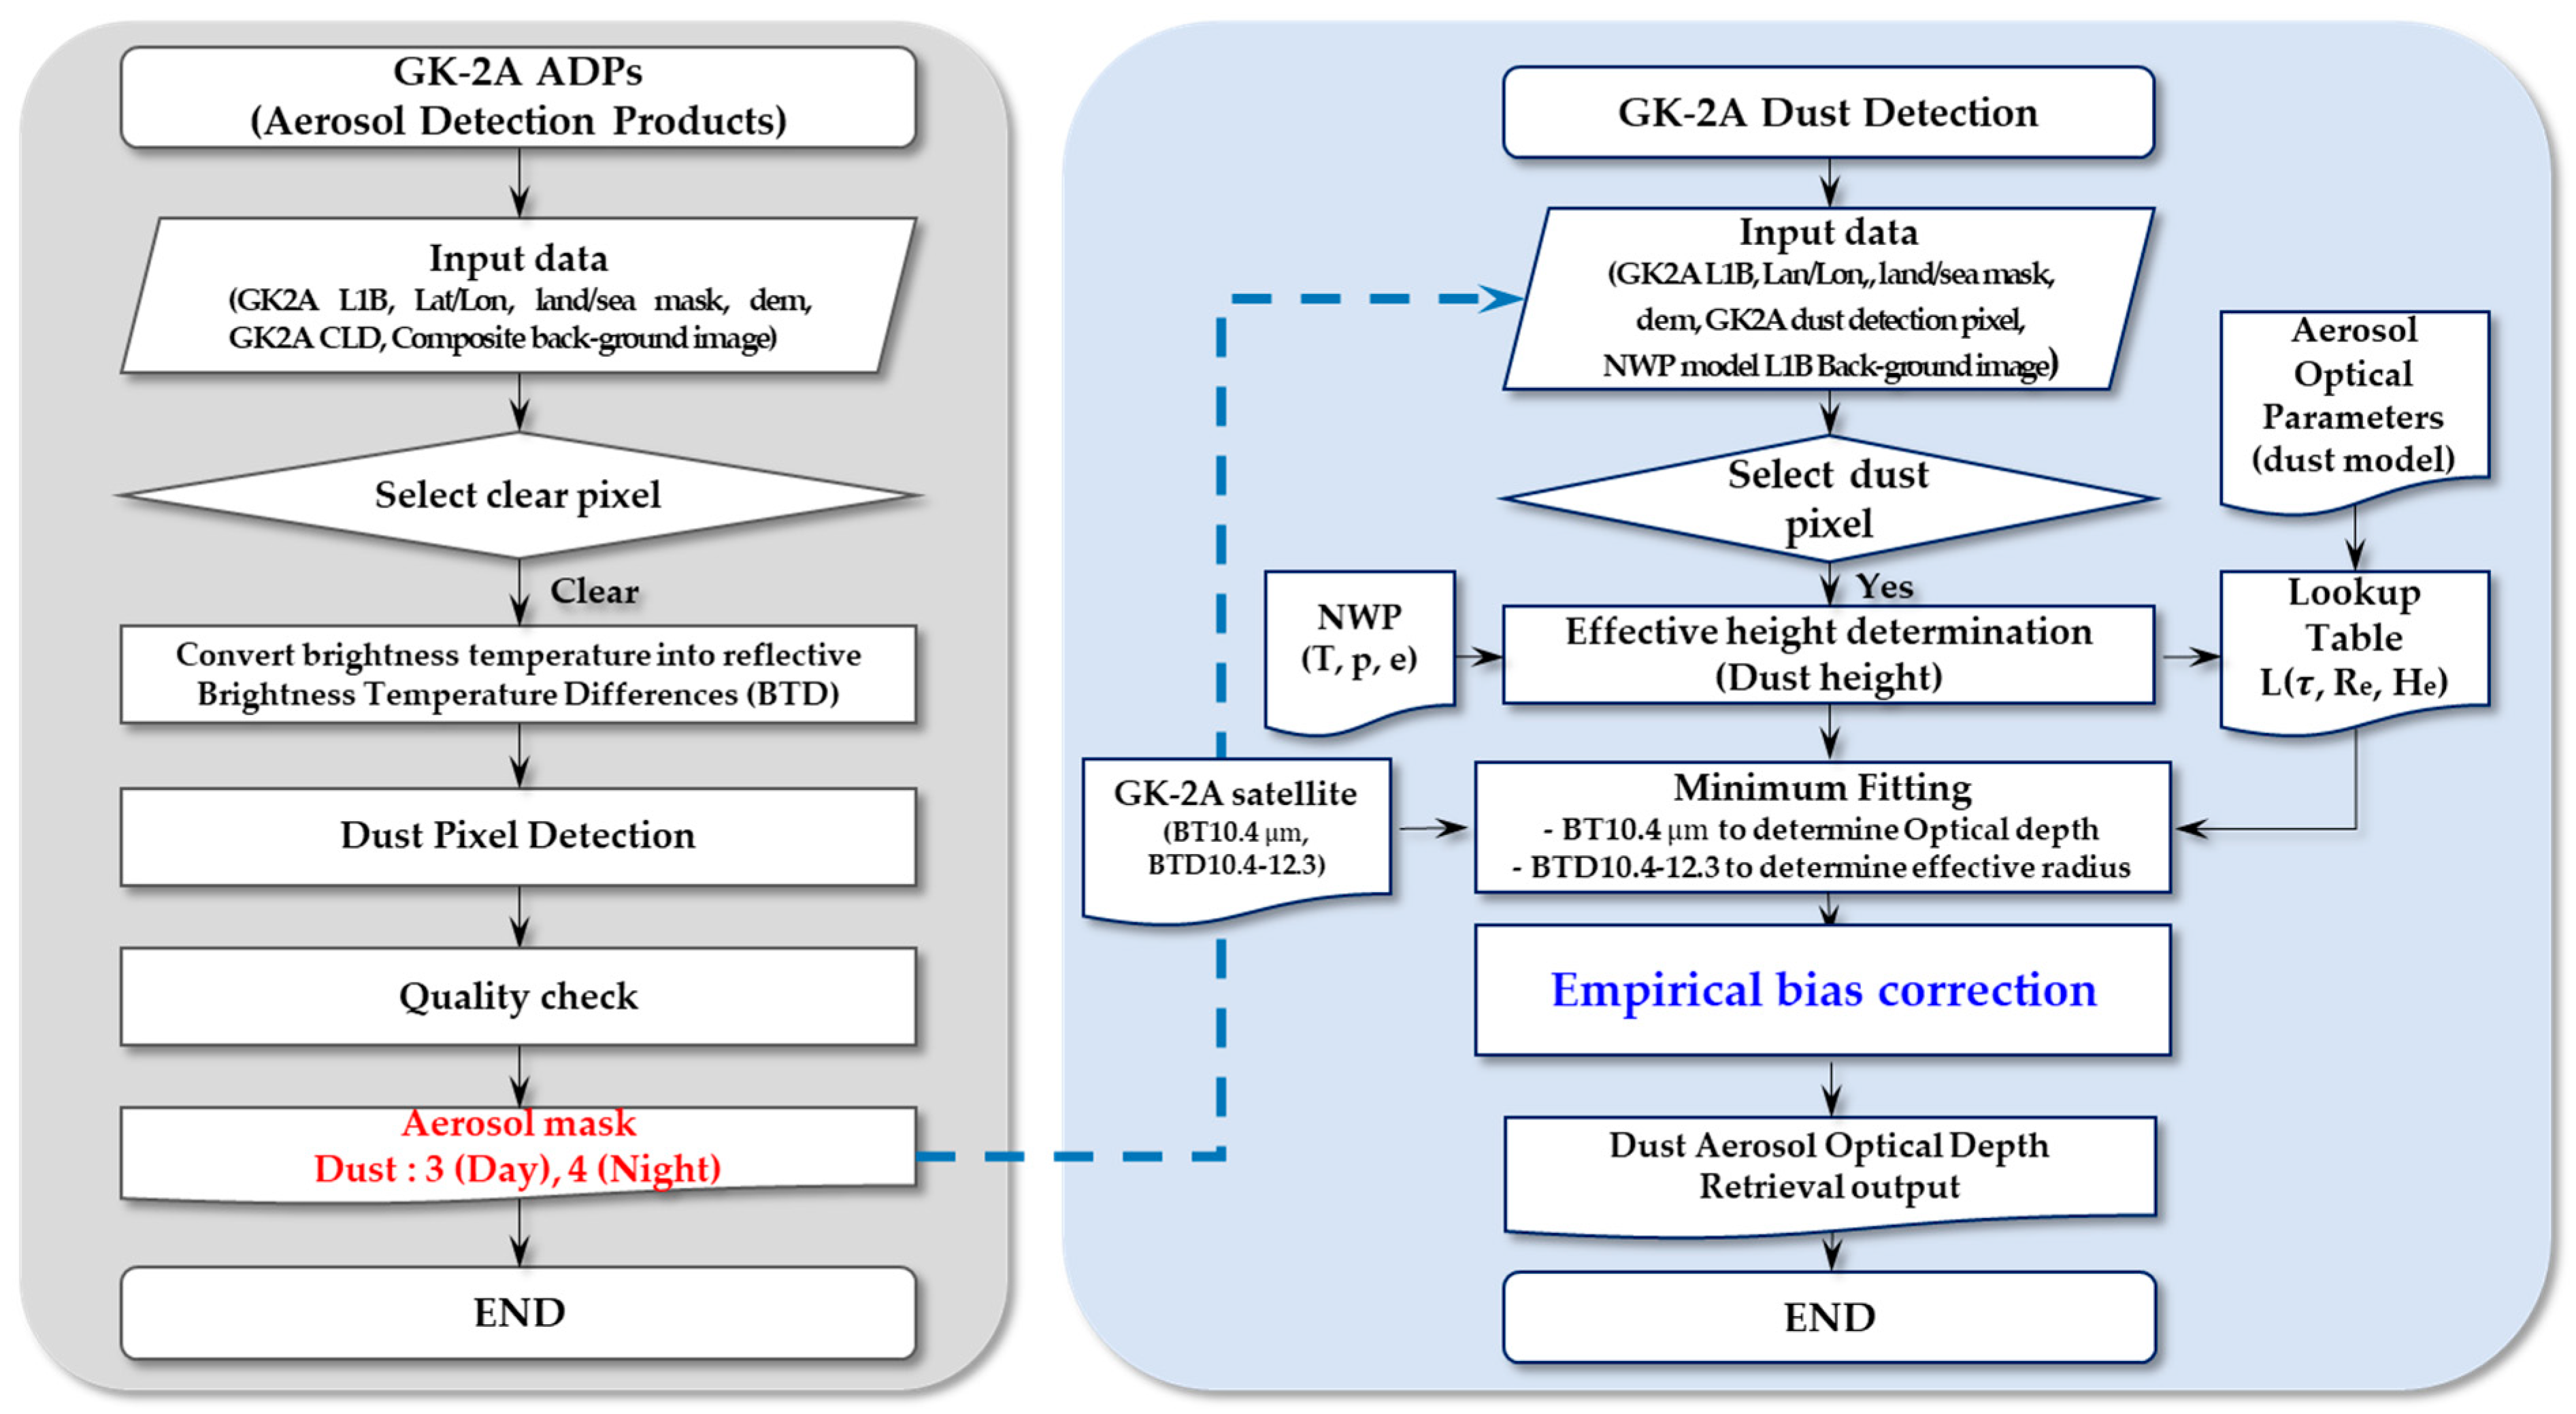
2.2.1. Look-Up-Table-Based Physical Retrieval Algorithm
GK-2A Dust Pixel Retrievals
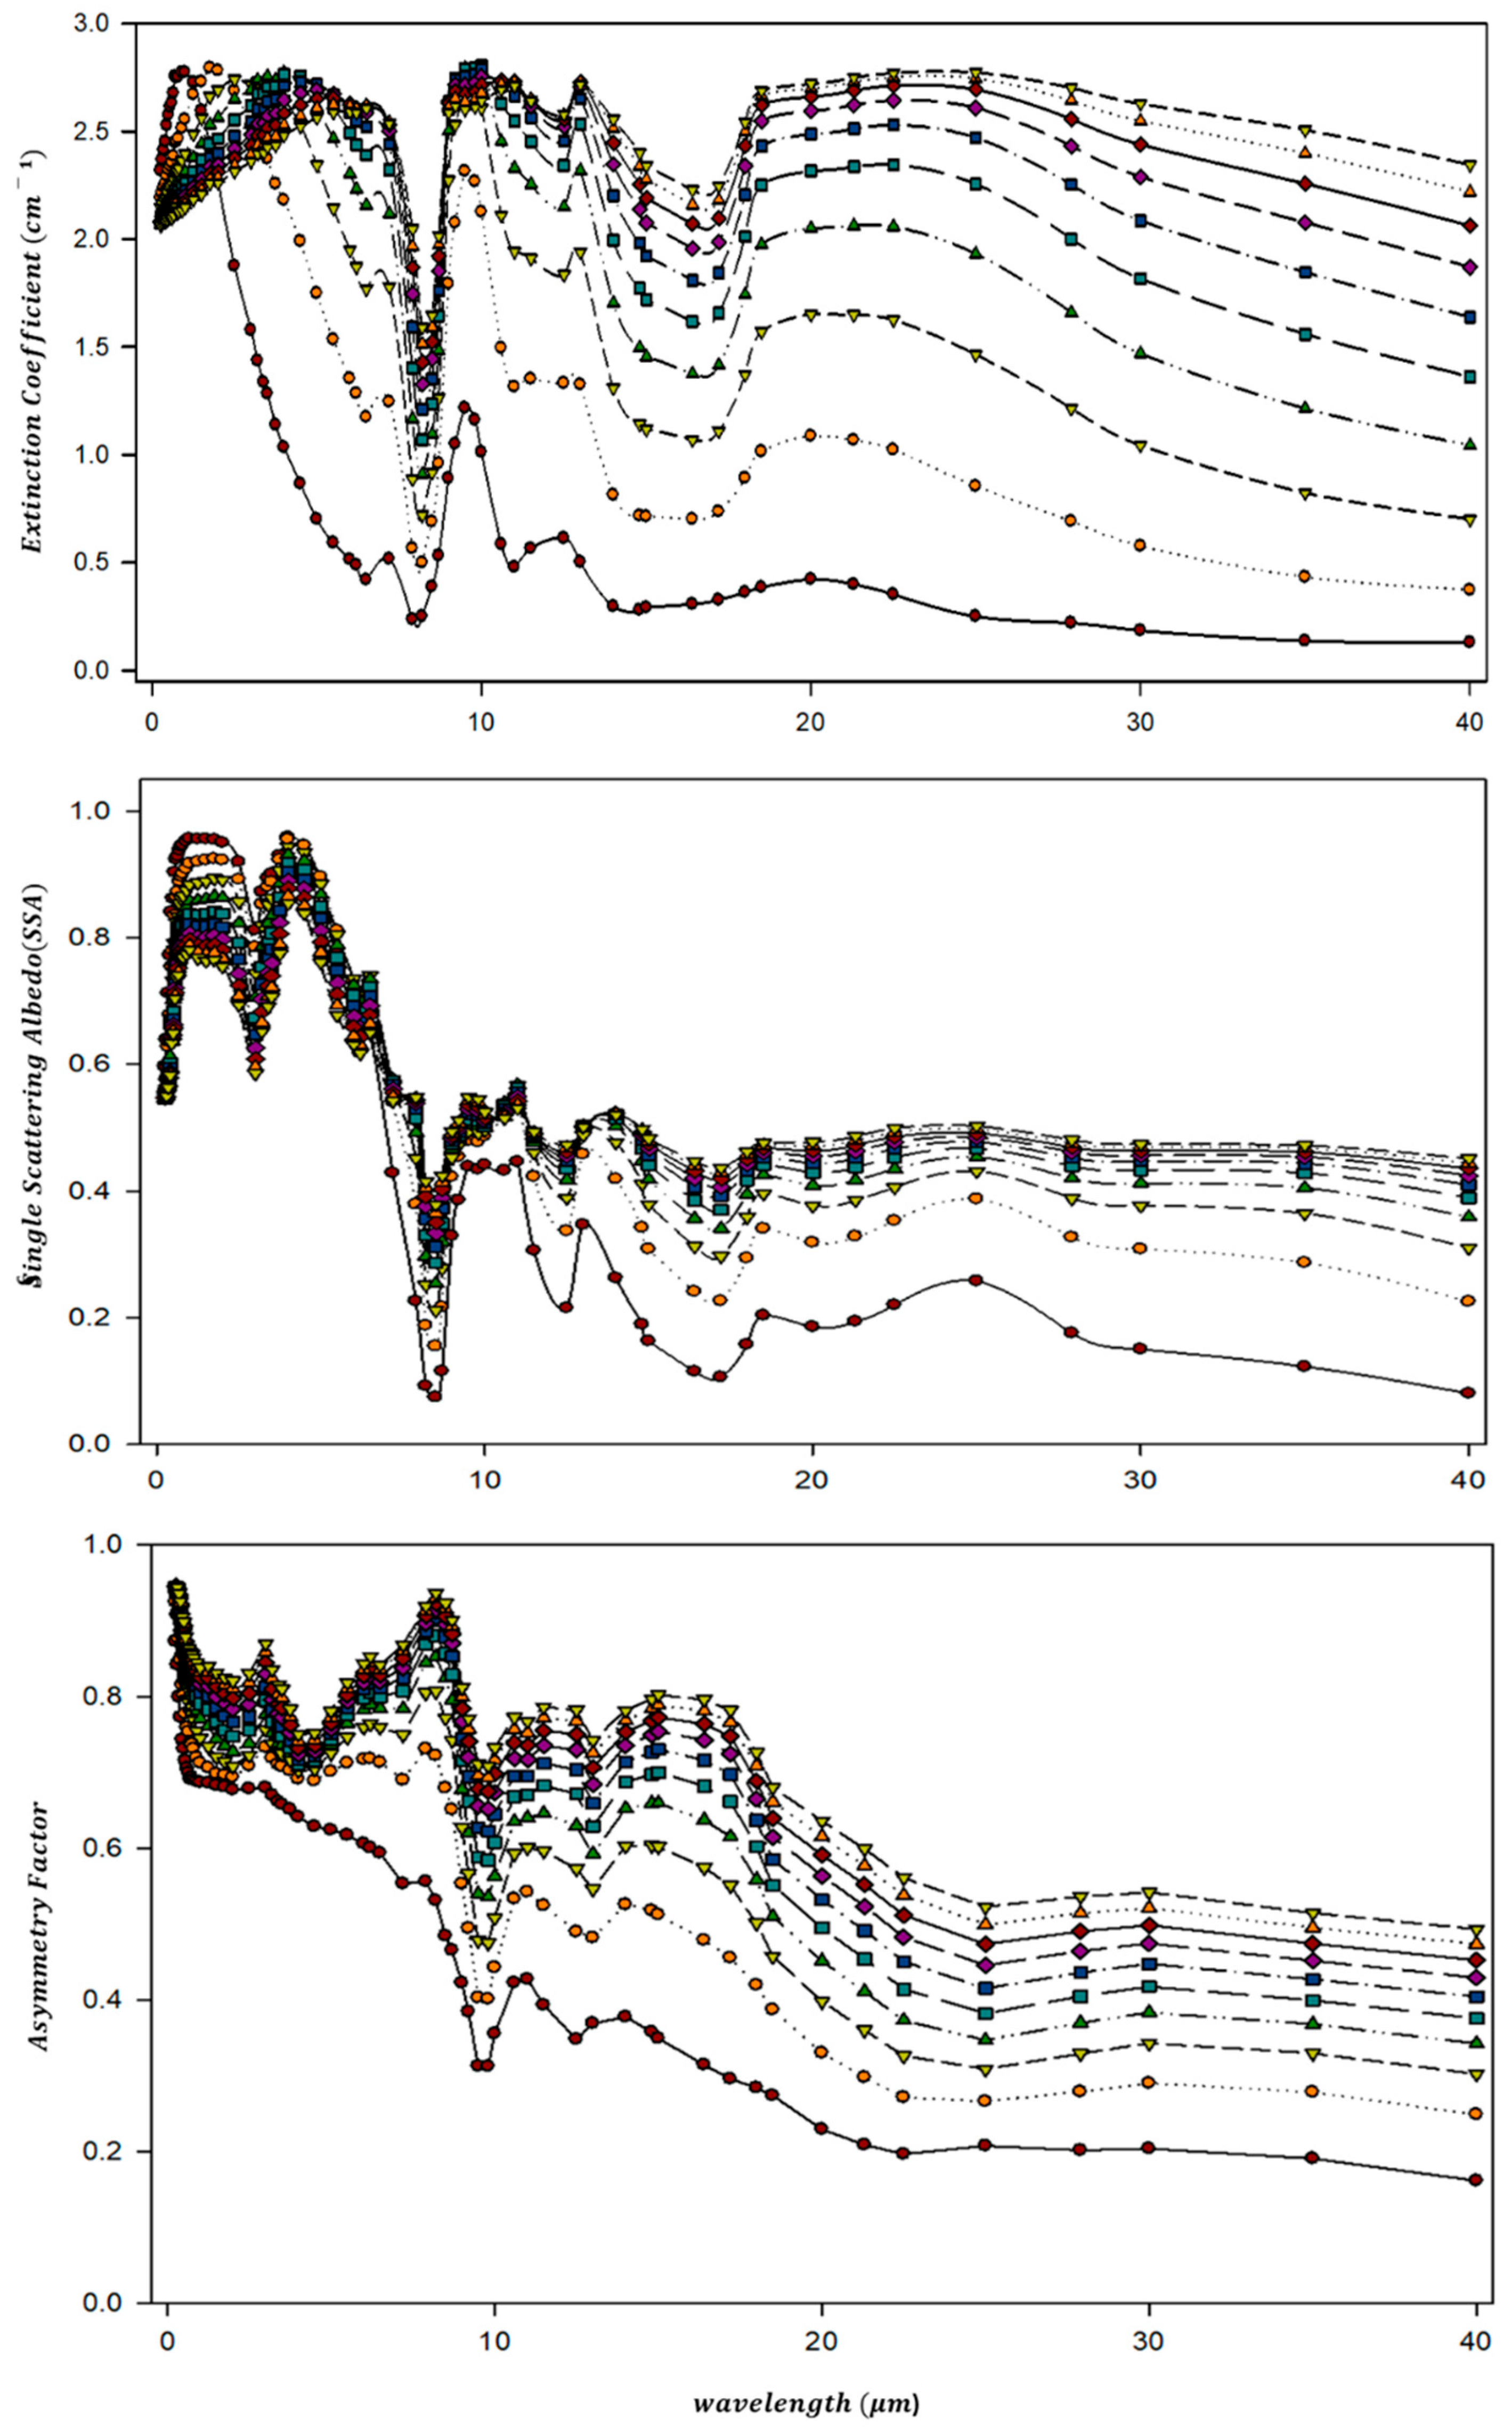
Forward Simulation
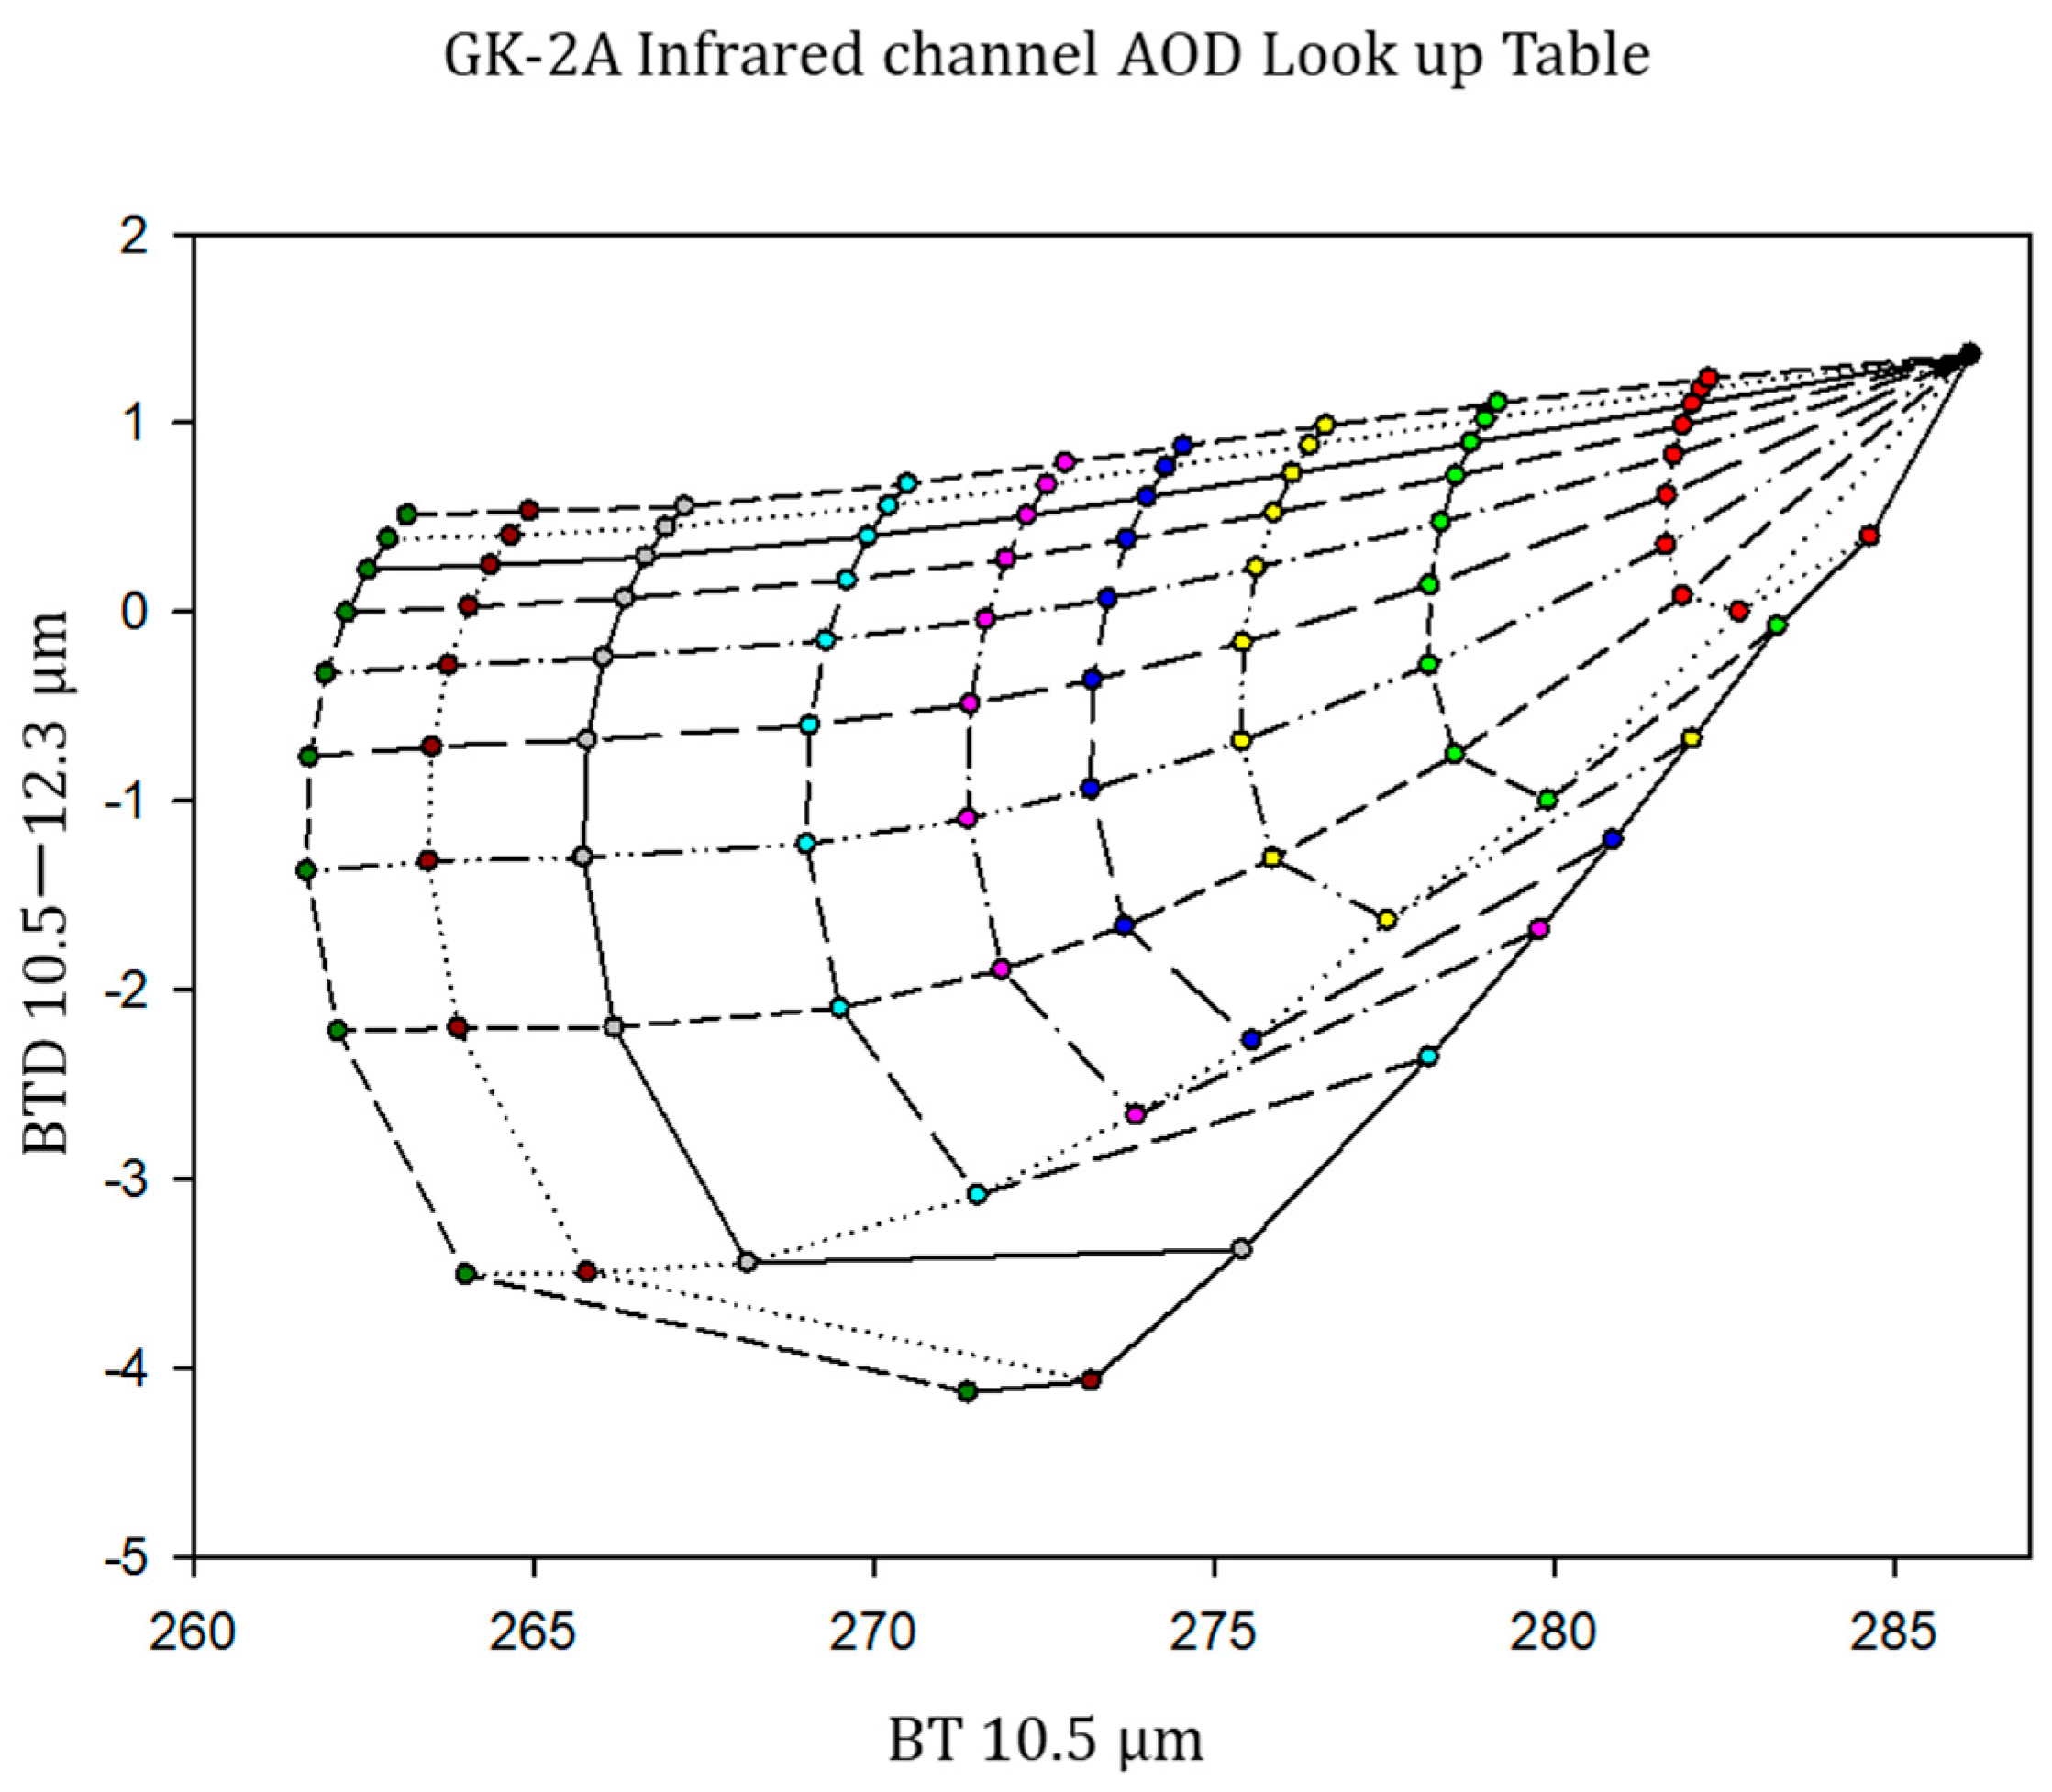
DAOD Look-Up Table
Estimation of the Effective Dust Height
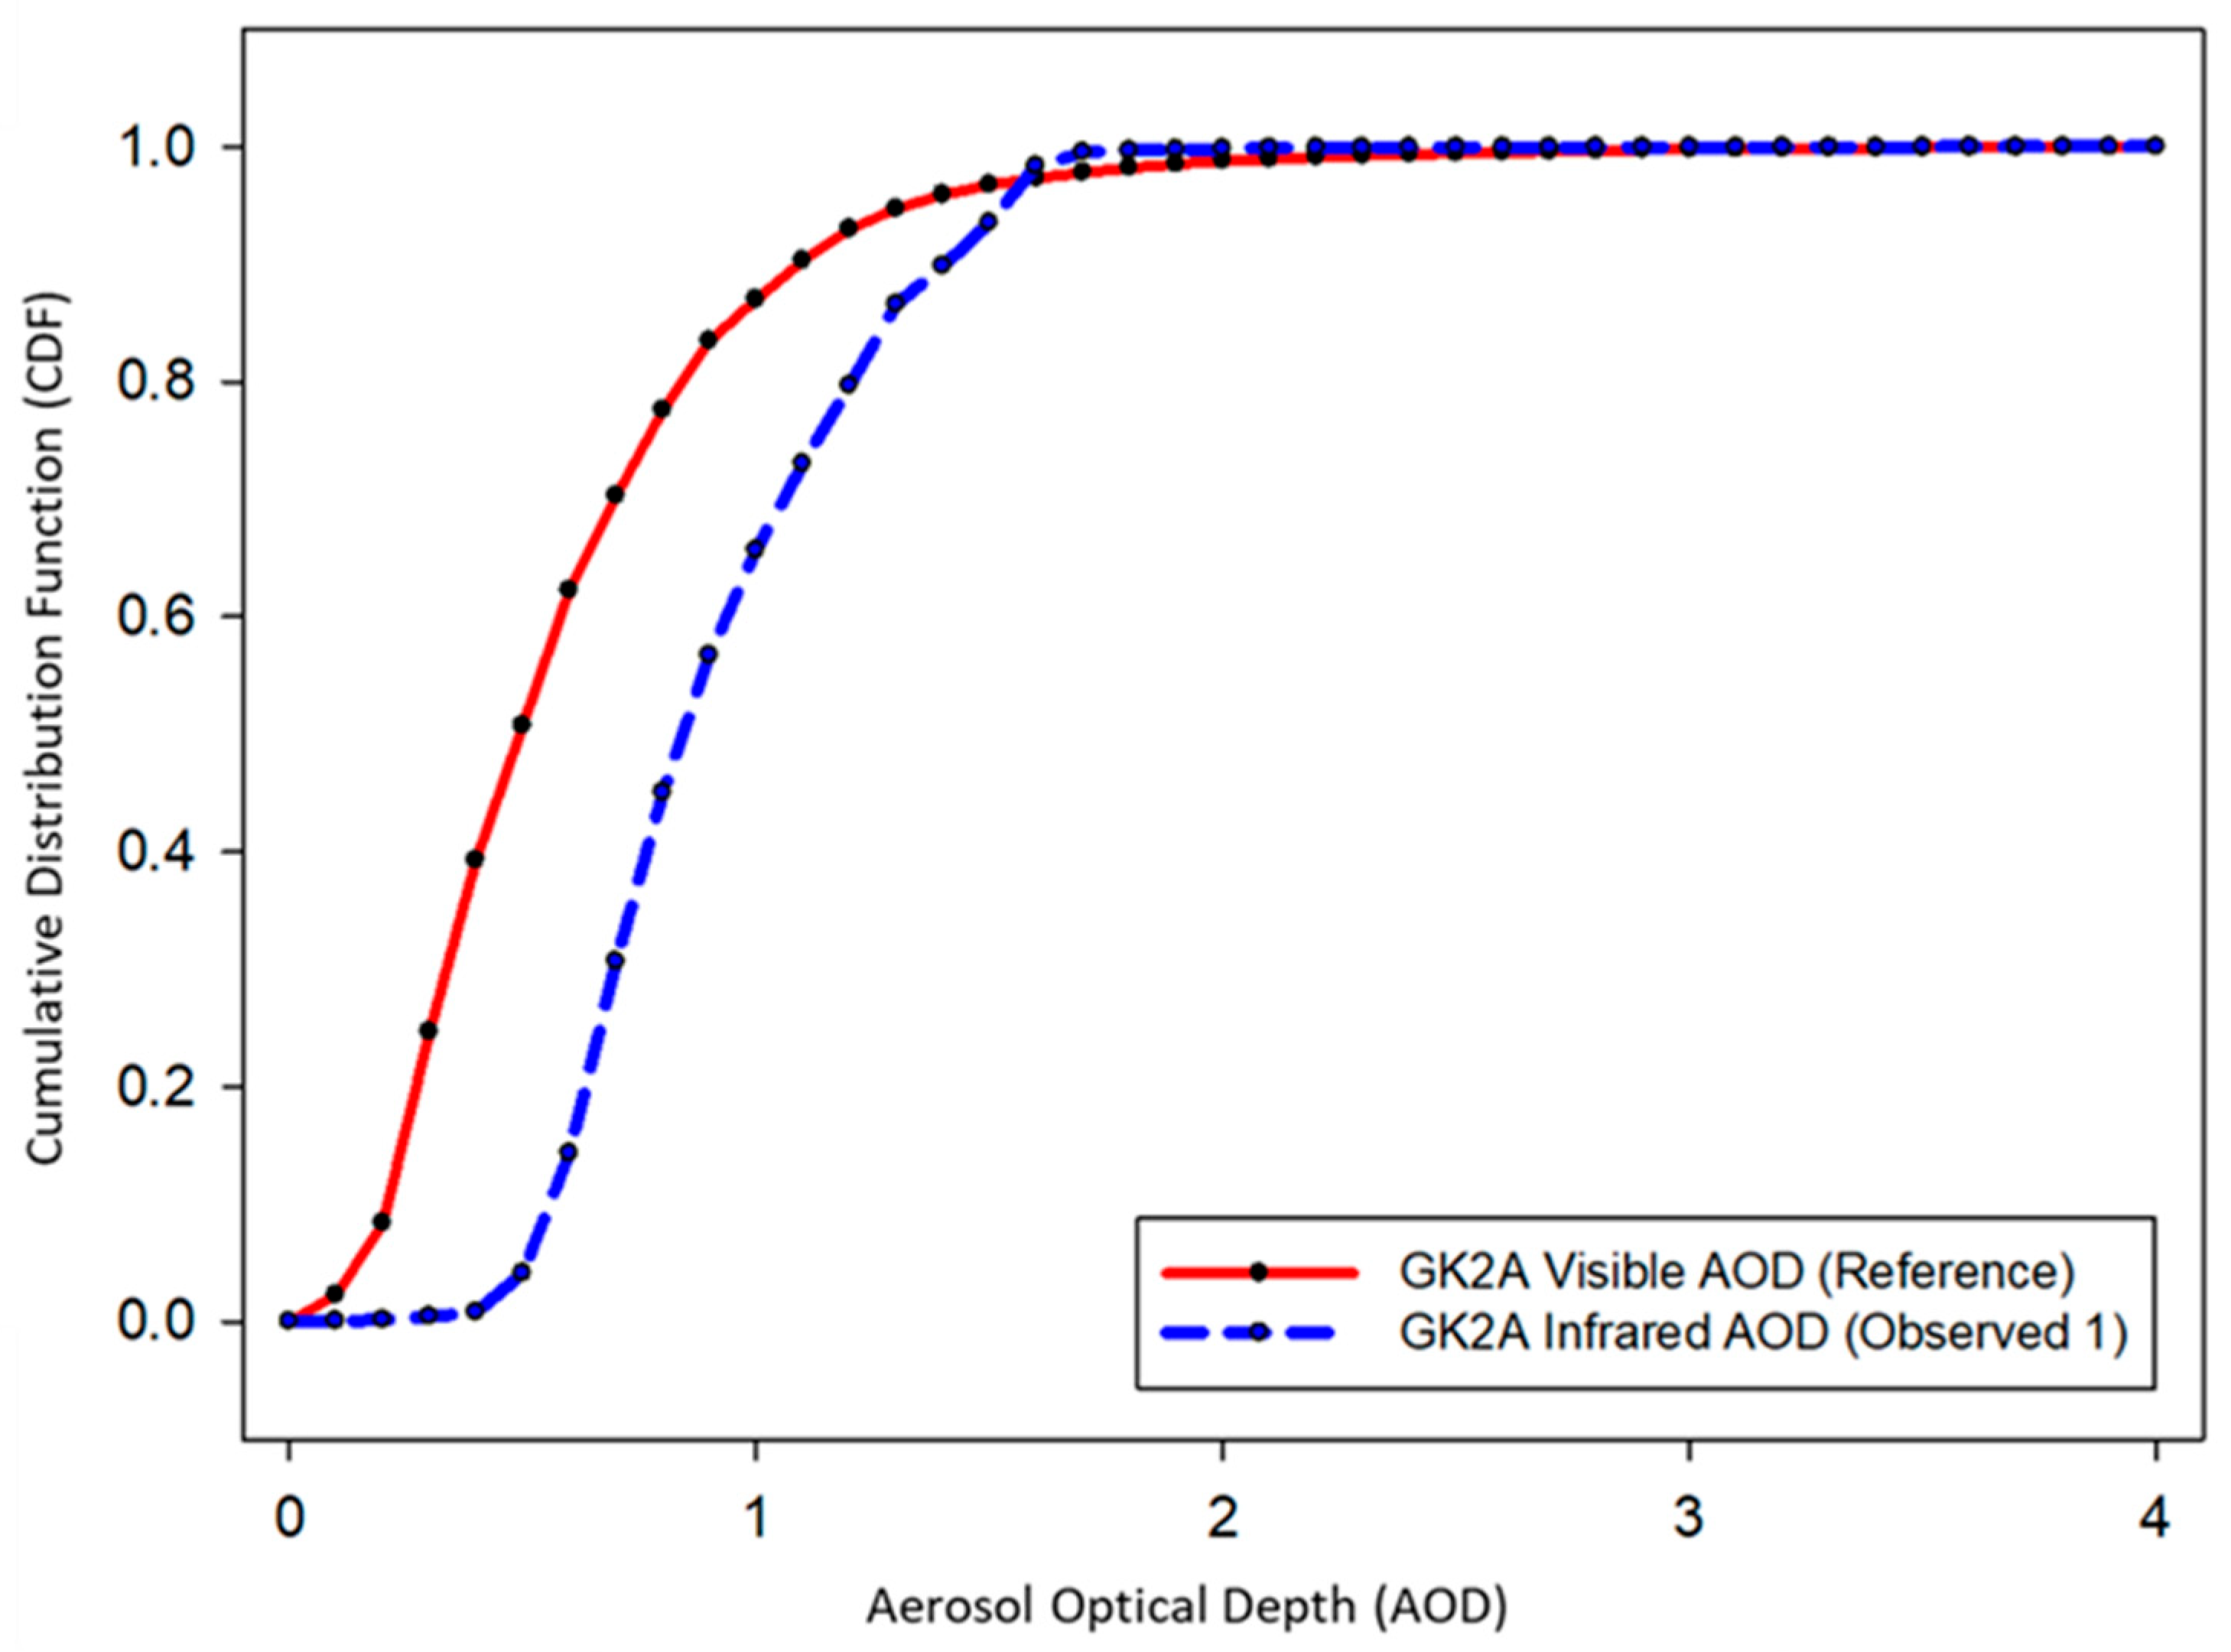
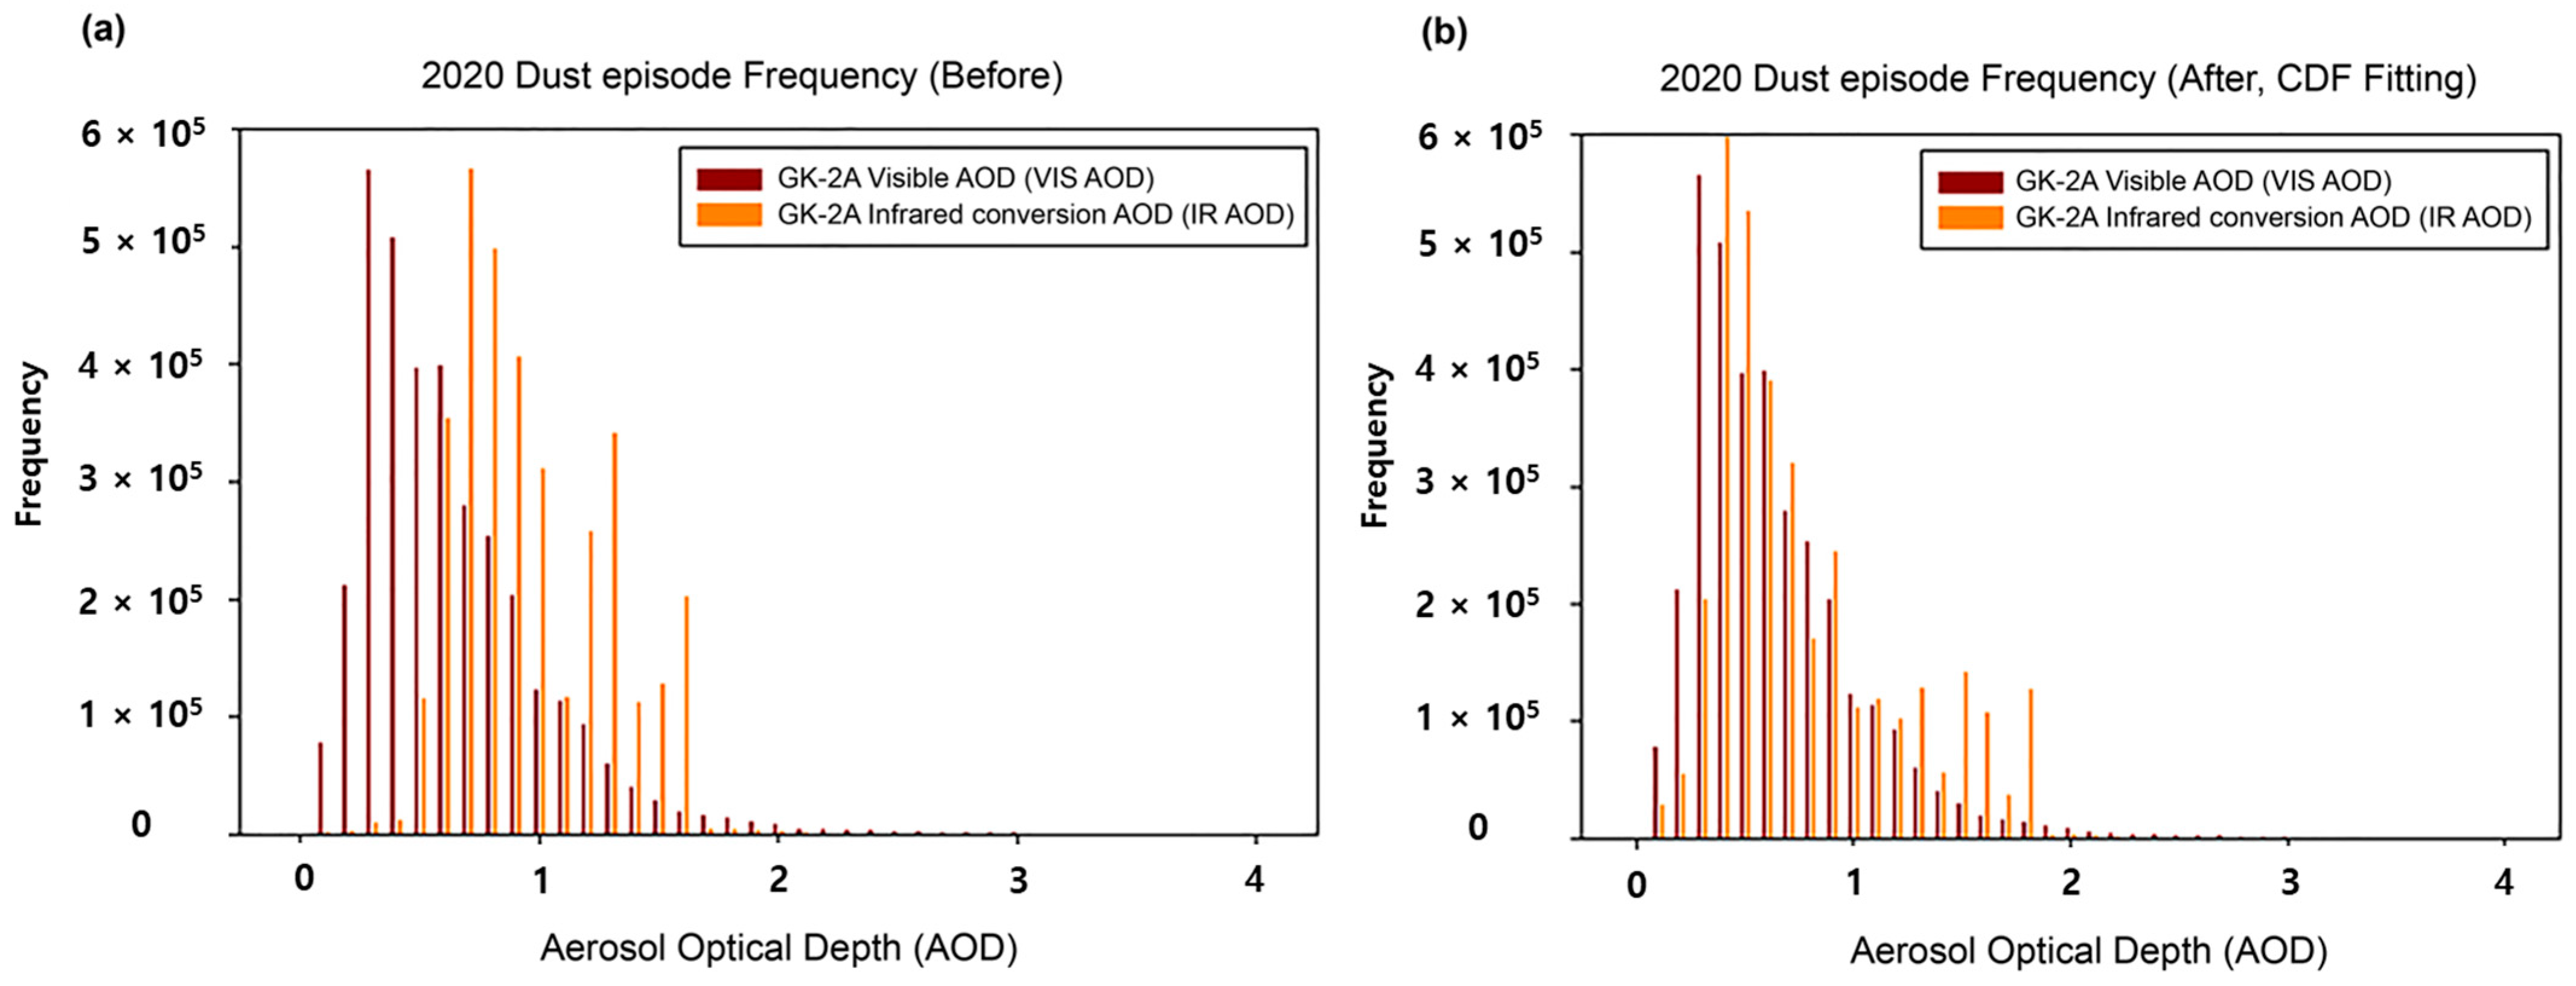
2.2.2. Empirical Bias Correction Method
3. Results and Discussion
3.1. Dust Detection Using Infrared Channels from GK-2A
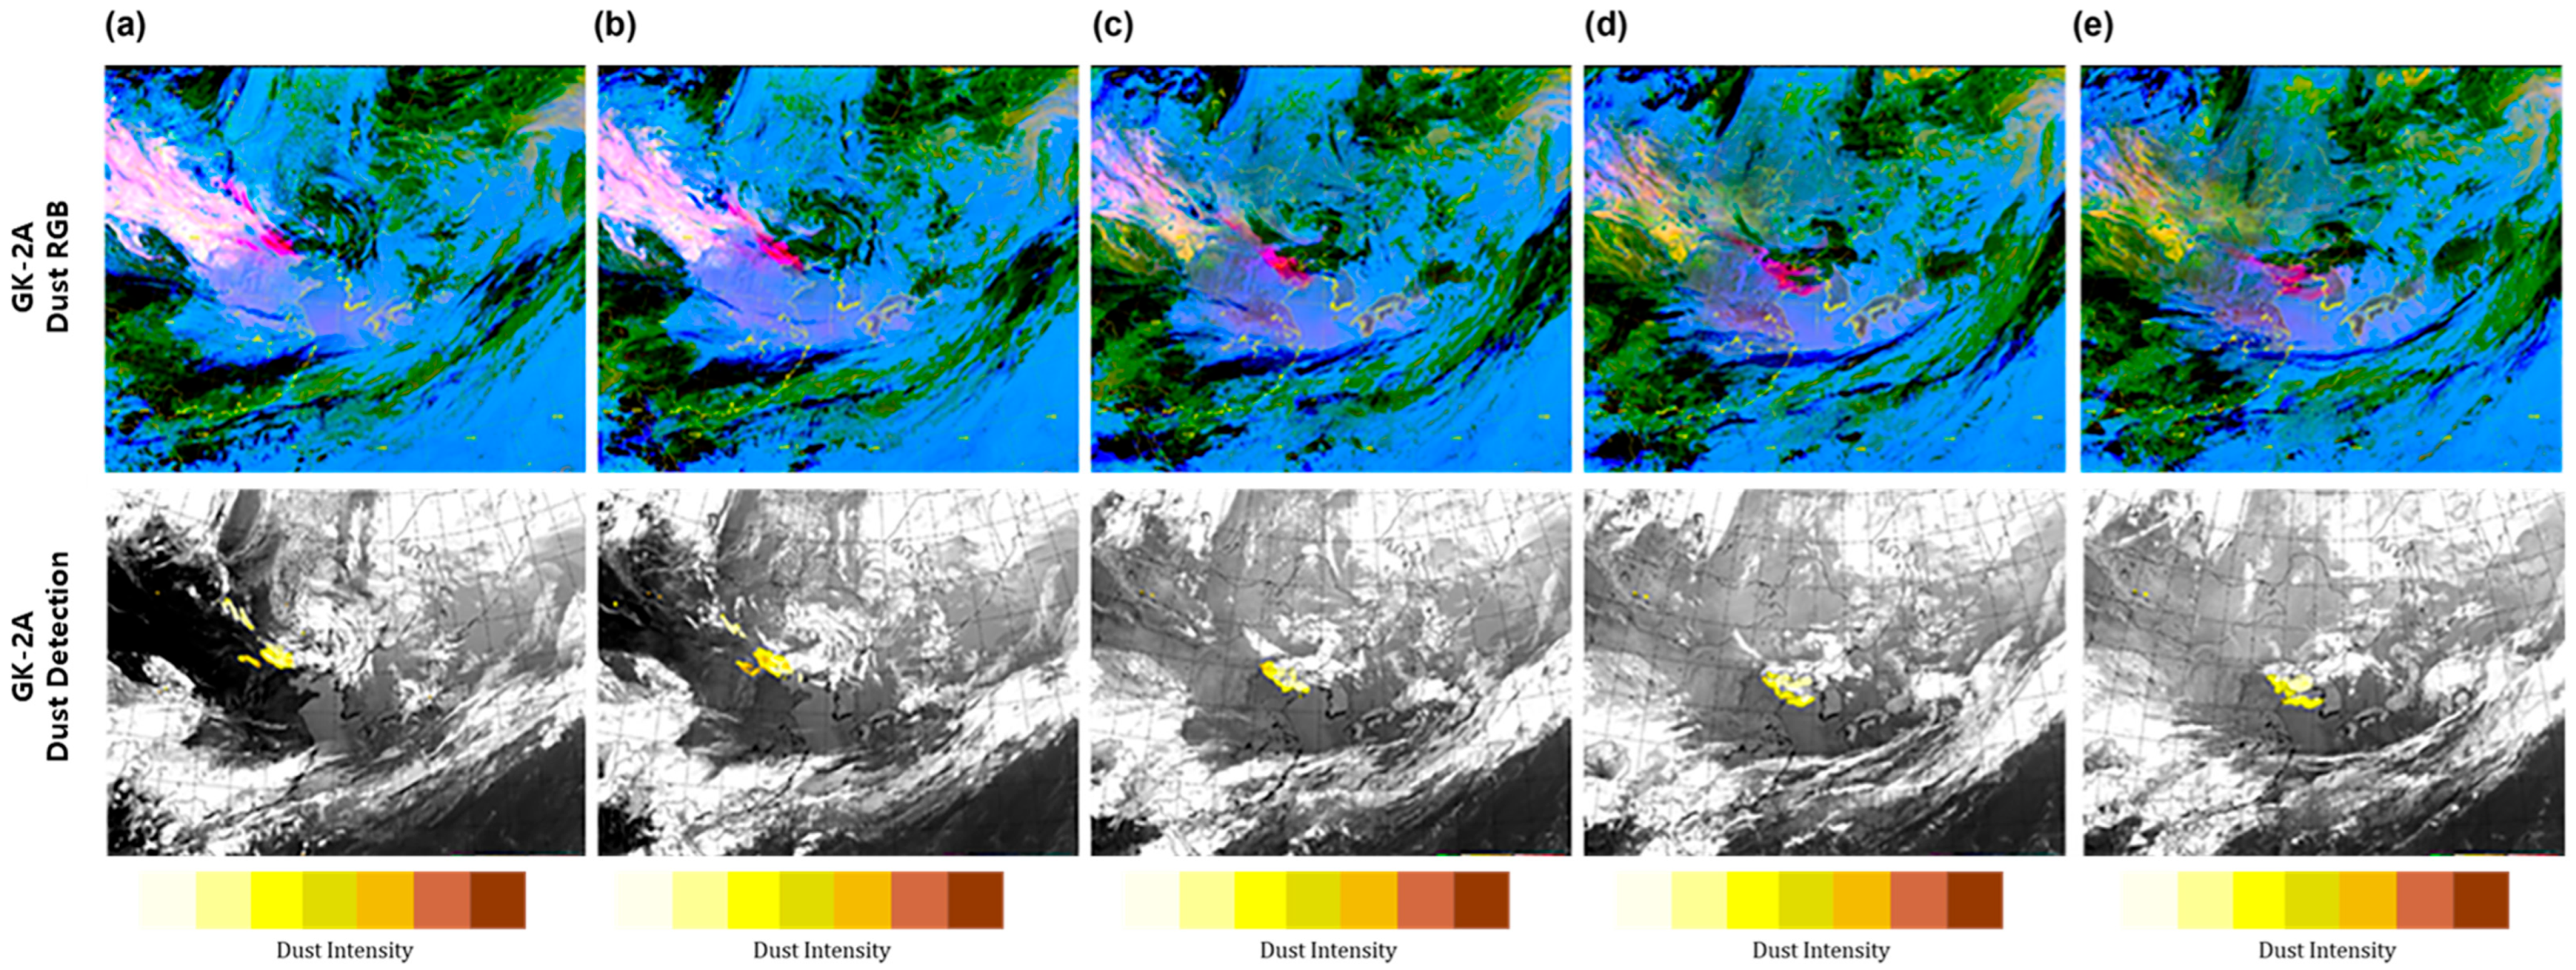
3.1.1. Comparisons of Dust Imagery Products during the Nighttime
3.1.2. Comparison of Dust Imagery Products during the Daytime
3.2. Correction of DAOD Visible and Infrared Channels from GK-2A
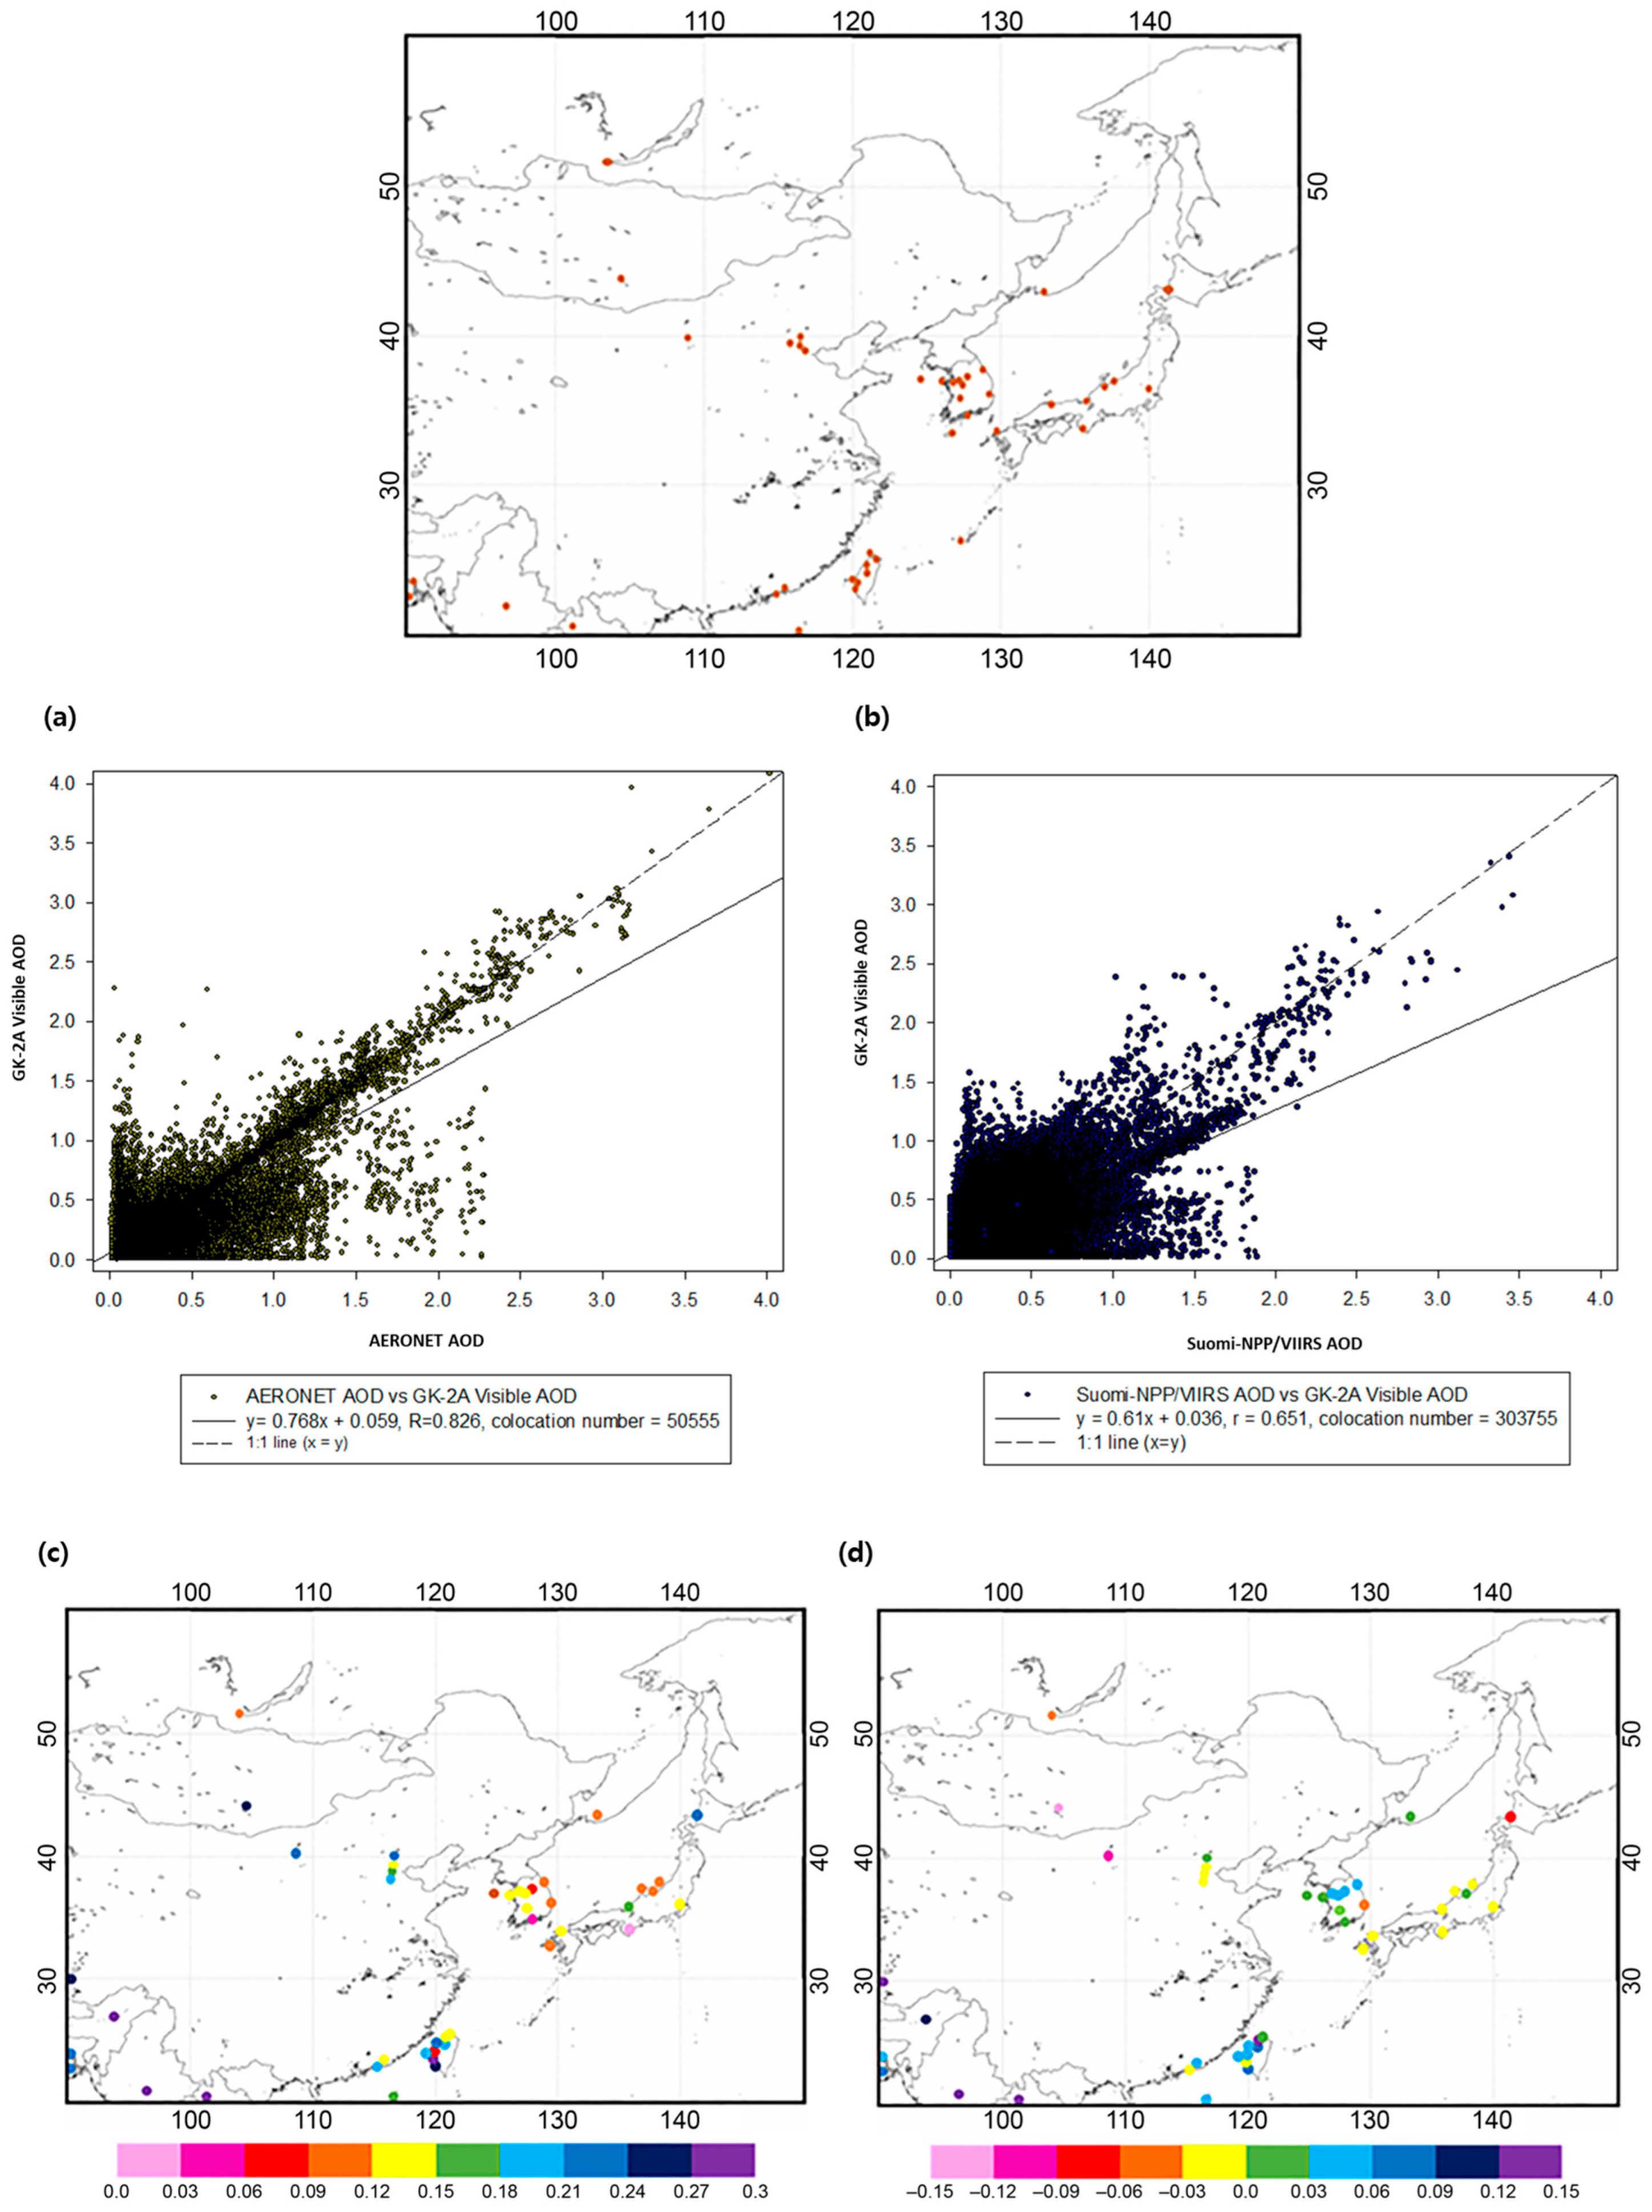
3.2.1. GK-2A Visible AOD Spatial Variability and Retrieval Accuracy
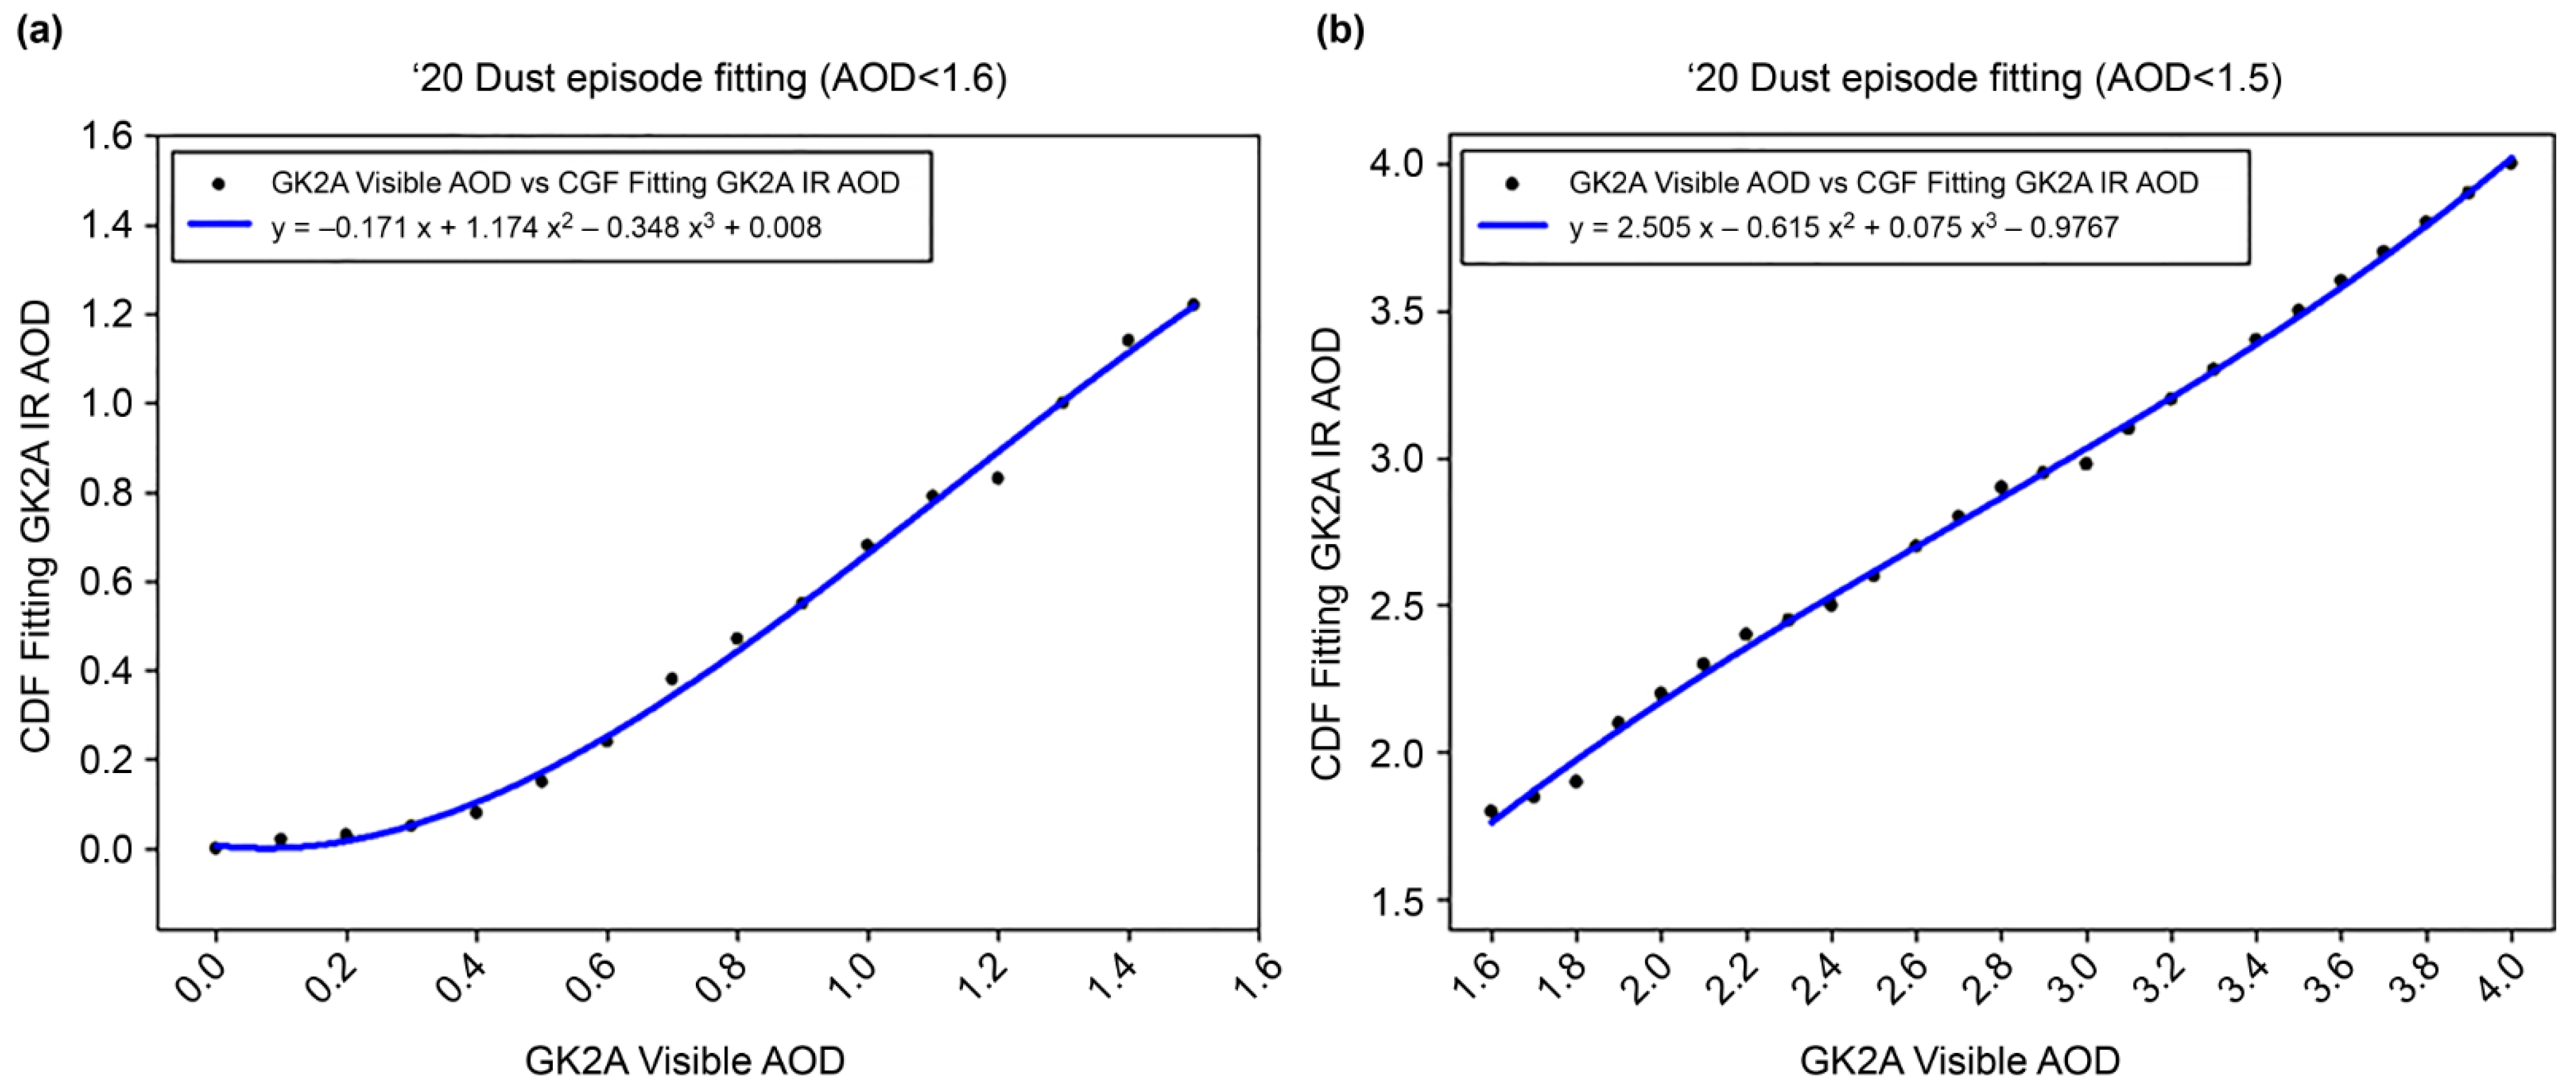
3.2.2. Bias Correction of GK-2A Infrared DAOD
3.2.3. Accuracy of Infrared DAOD Applied to Coefficient (Correction Factor)
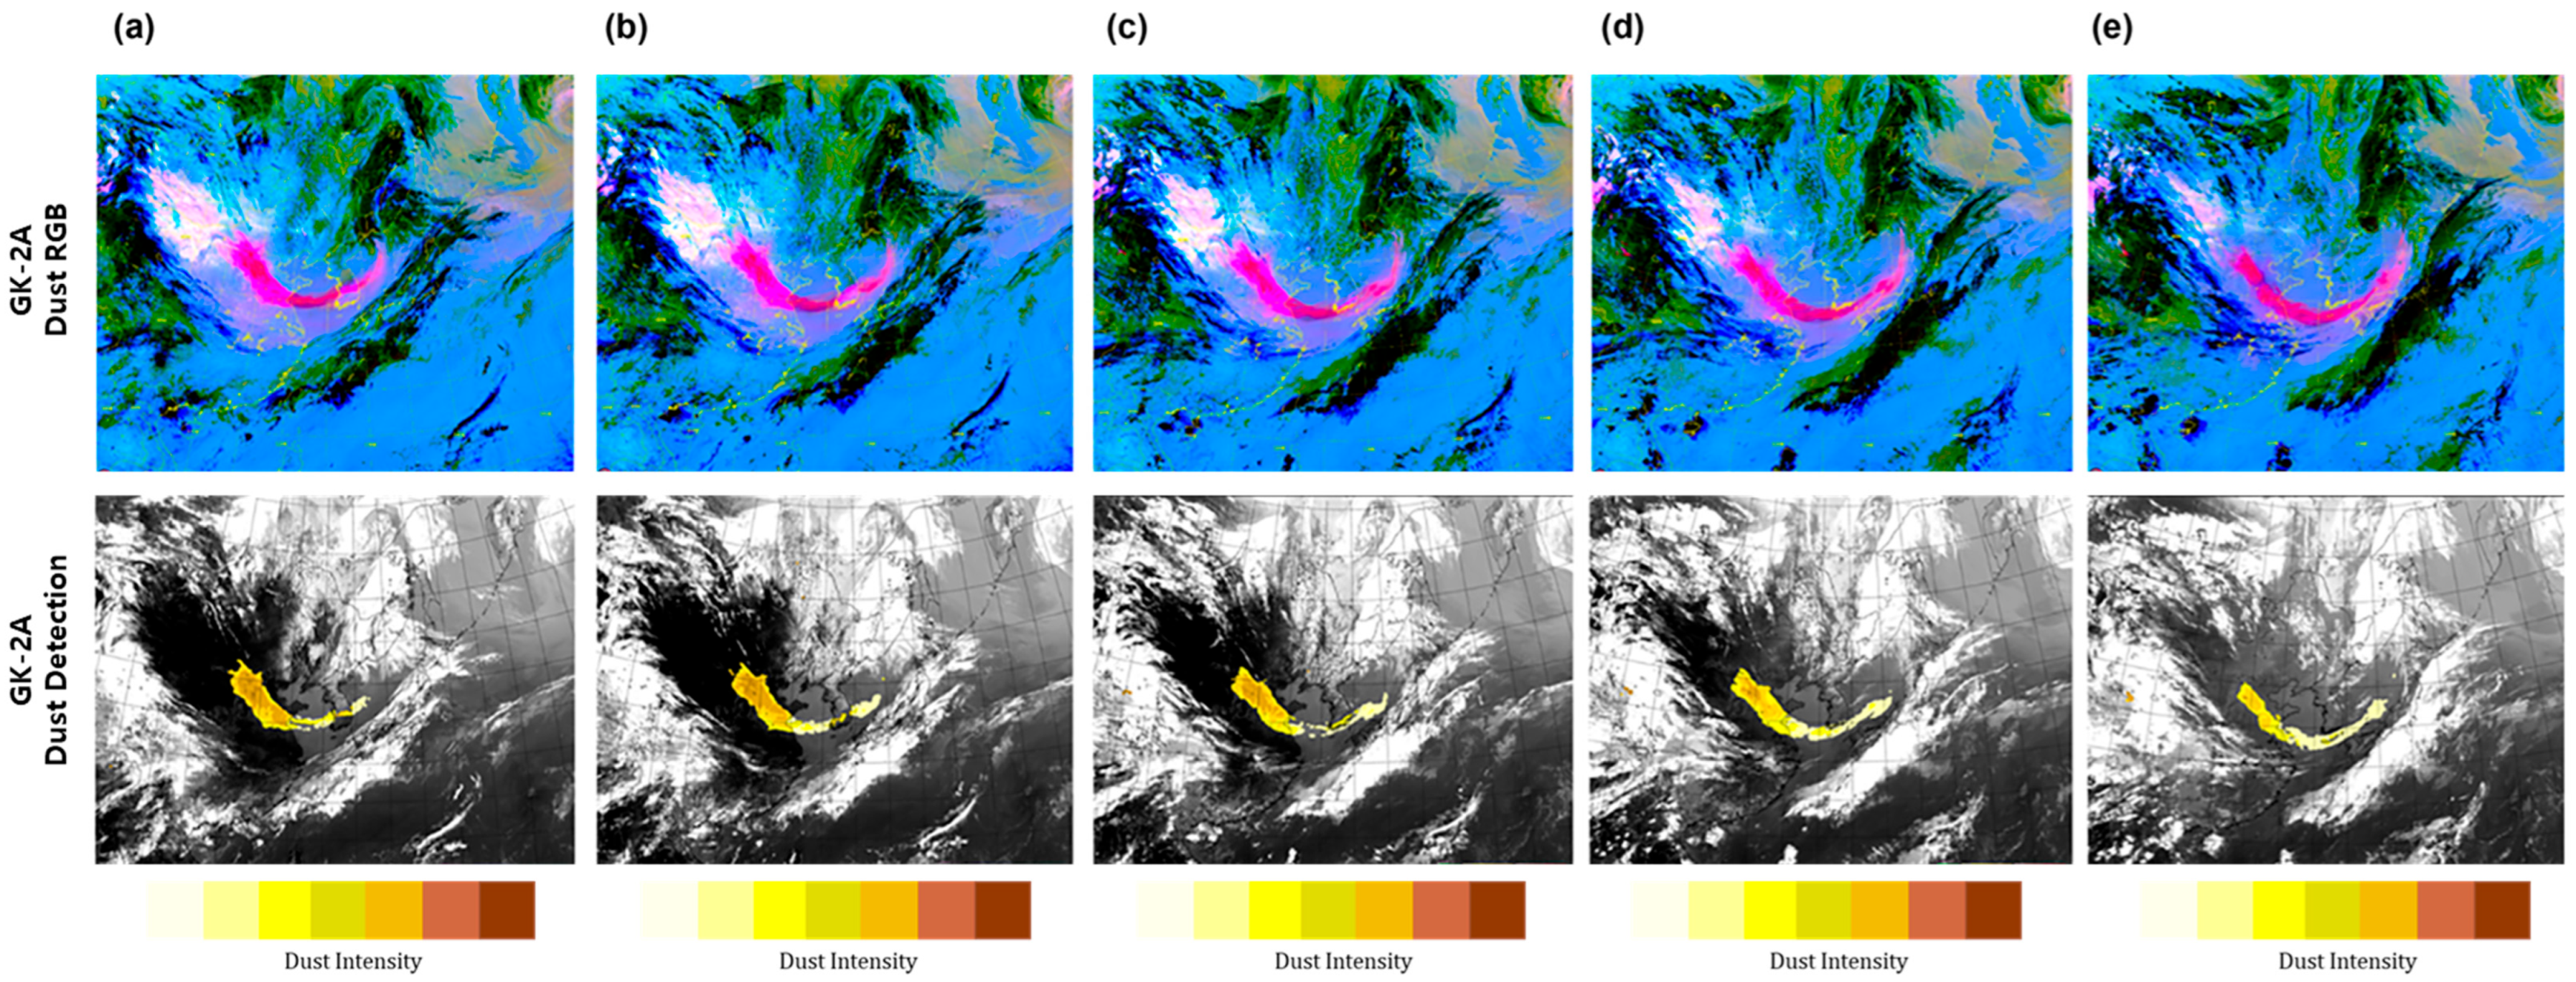
3.3. Qualitative Comparisons through Intense Dust Events
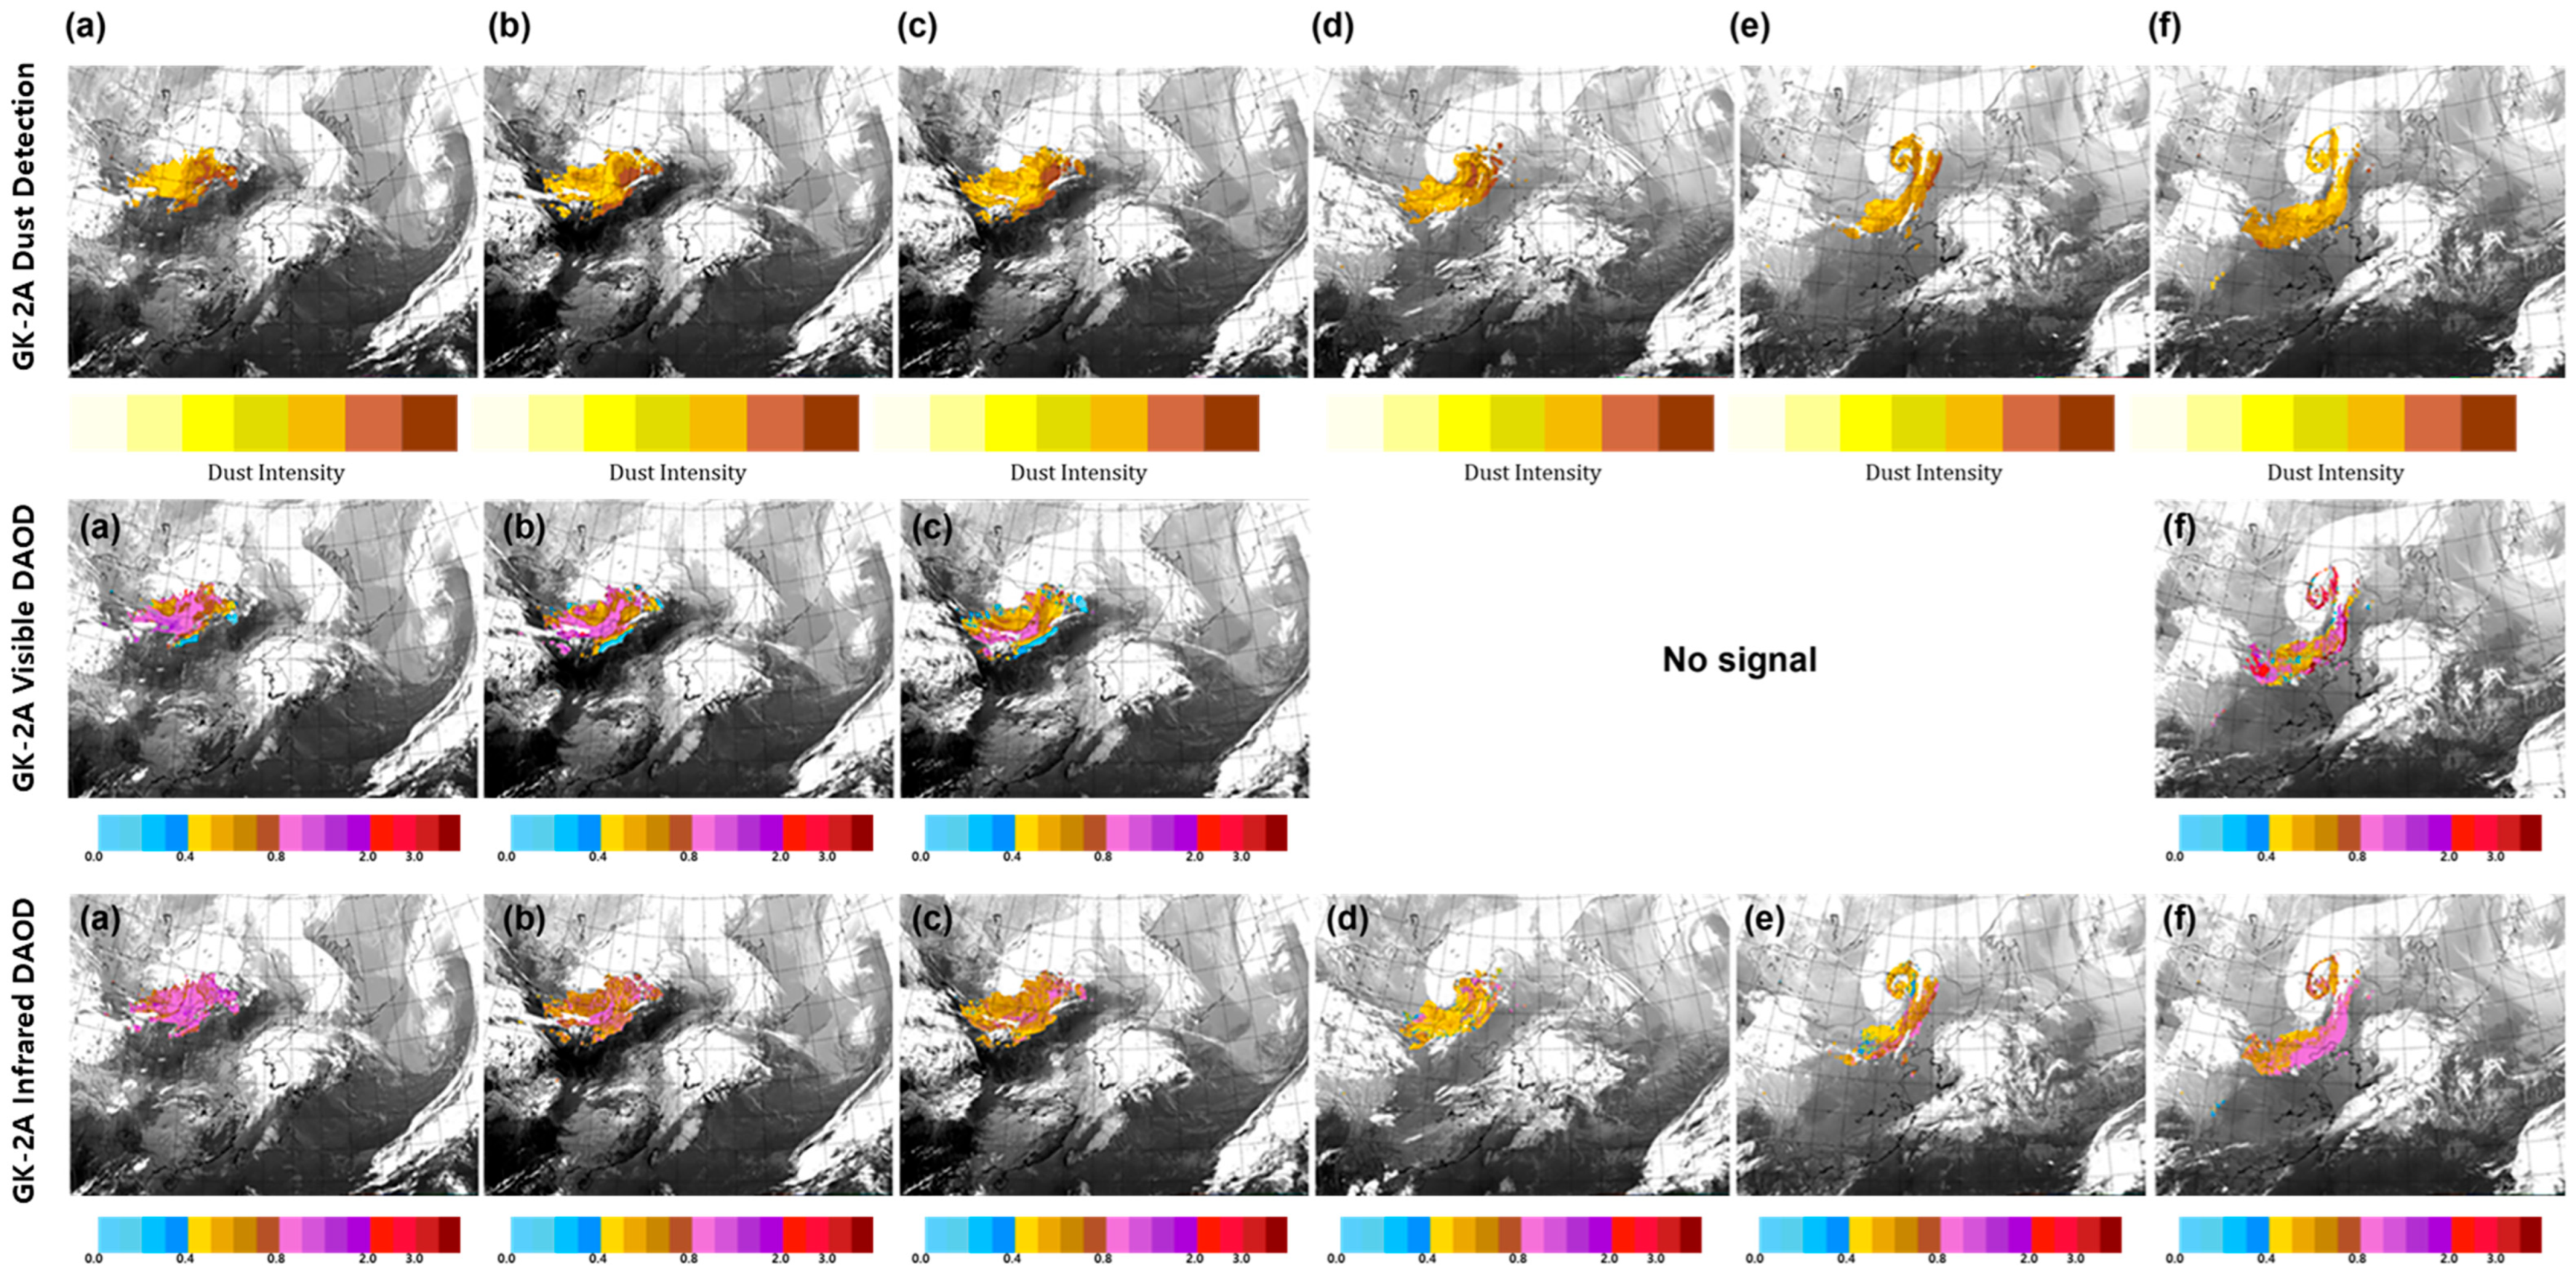
3.3.1. Spring Dust Transport over the Korean Peninsula on 23–28 March 2021
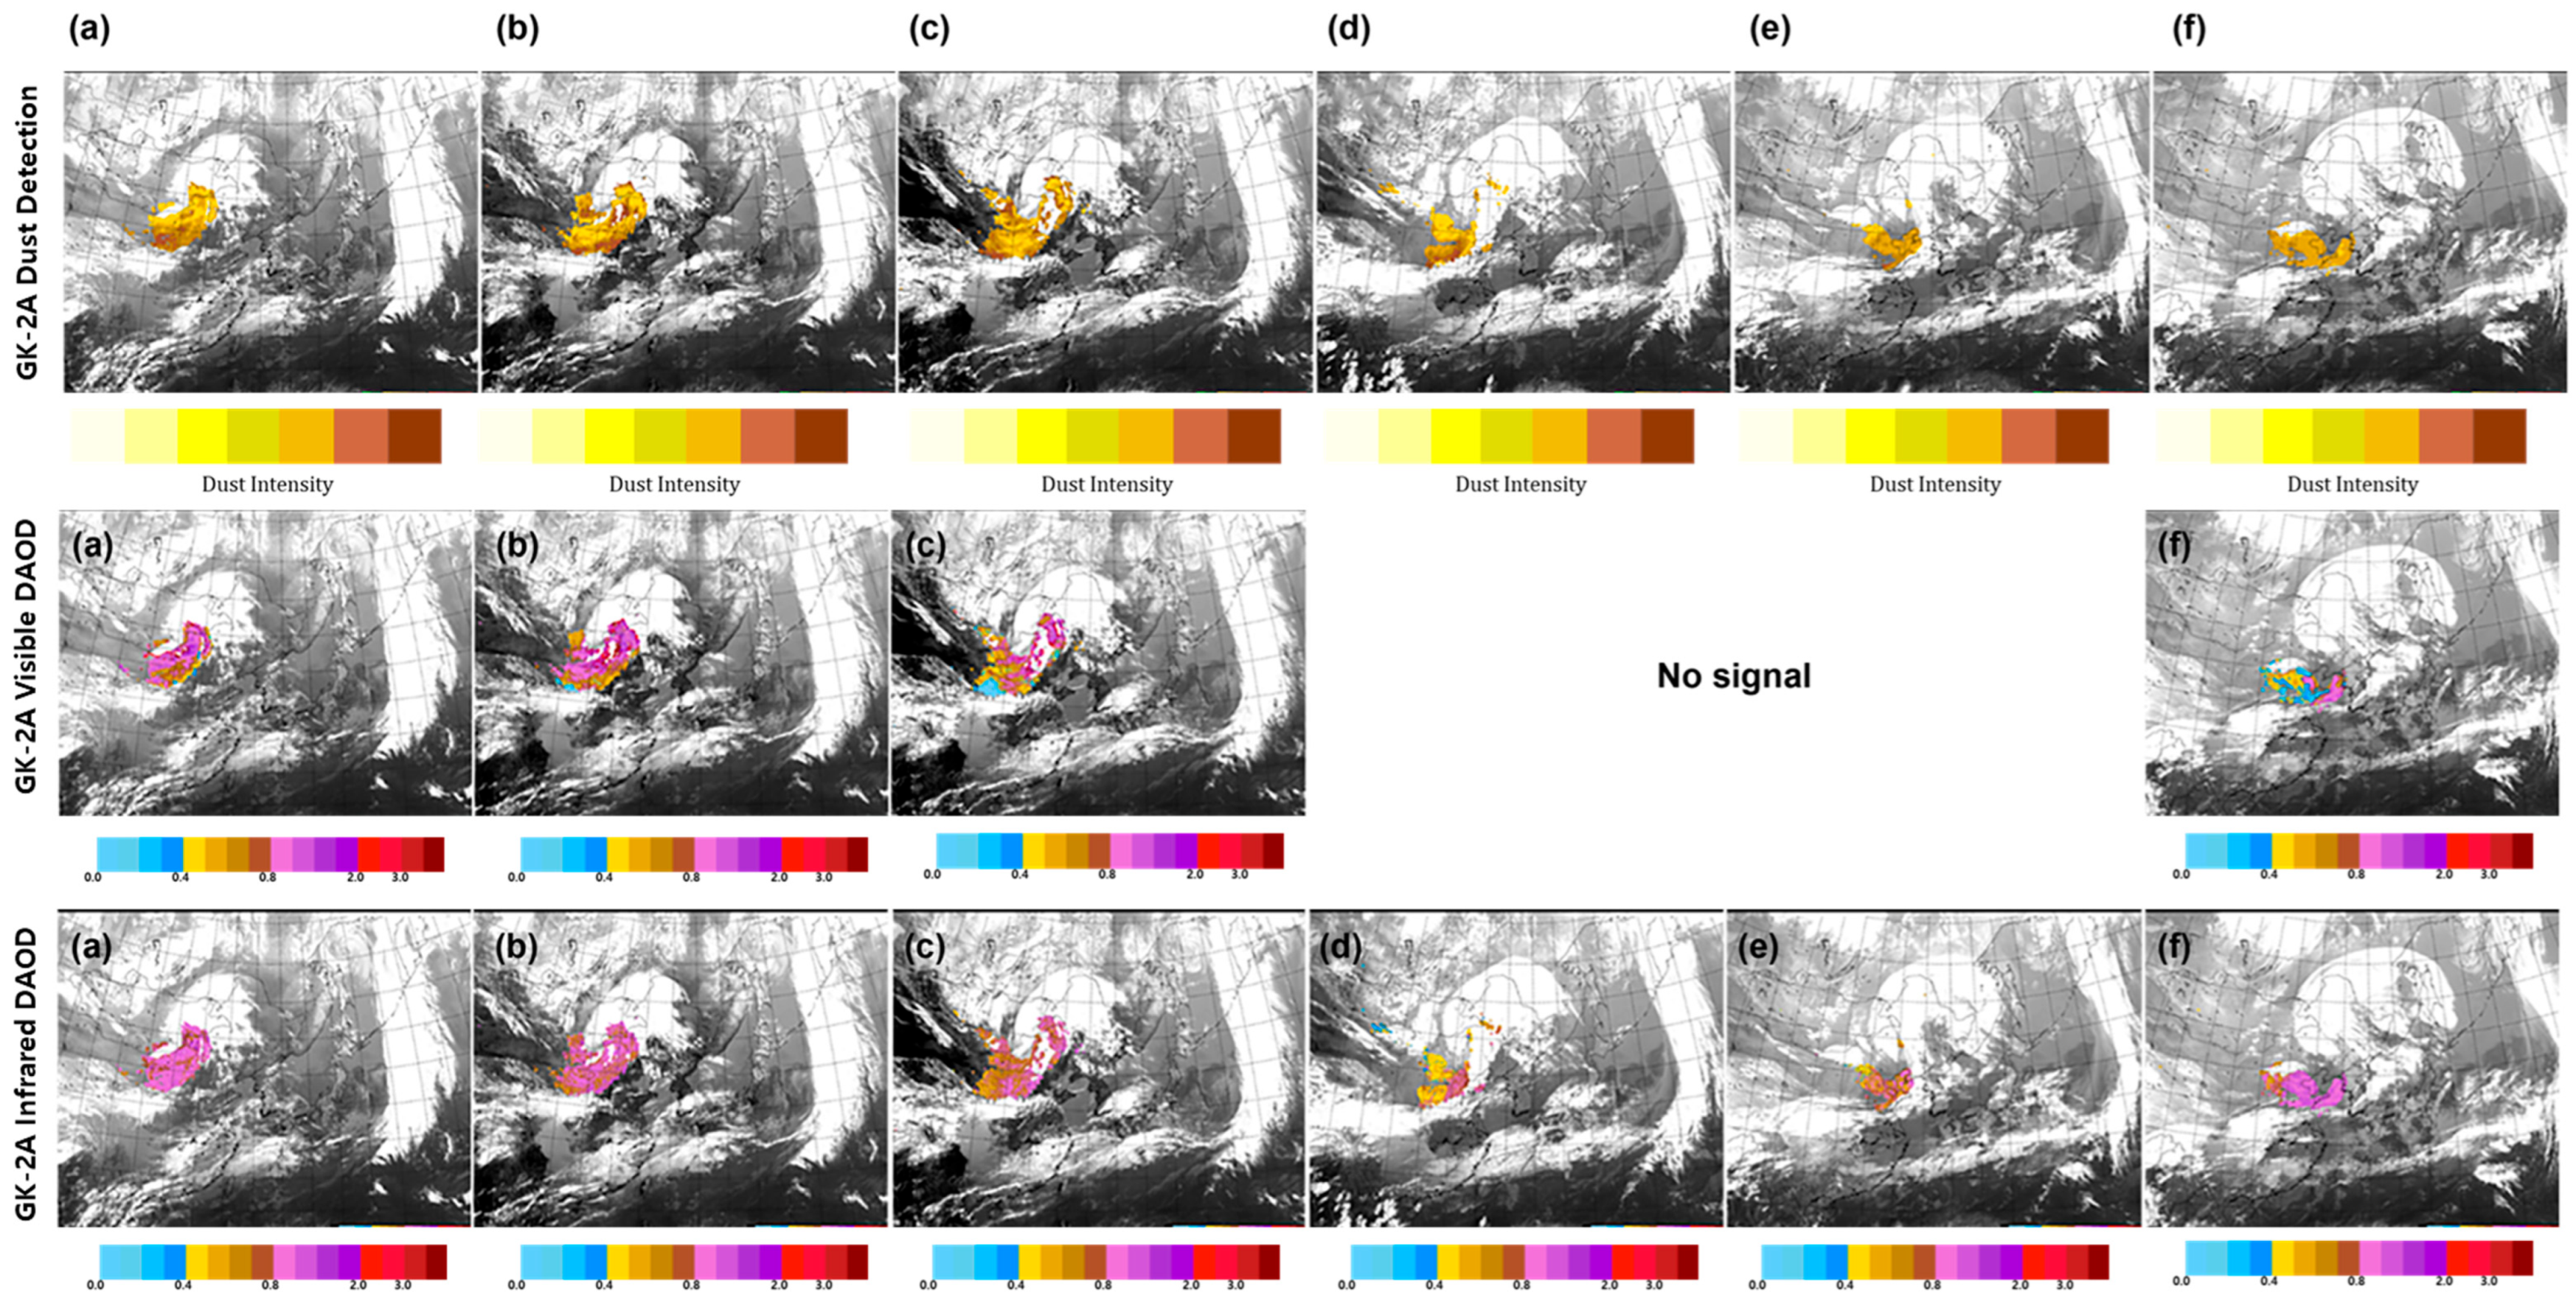
3.3.2. Example of Dust Transport over the Korean Peninsula on 14–16 April 2021 (Spring Dust)
3.3.3. Example of Dust Transport over the Korean Peninsula on 4–8 May 2021 (Spring Dust)
3.4. Quantitative Comparison between GK-2A DAOD and CALIPSO/CALIOP throughout Dust Events in 2021 (Validation)
4. Summary and Conclusions
- The GK-2A/AMI DAOD was developed to detect yellow sand in northeast Asia and achieve continuous monitoring during the day and night.
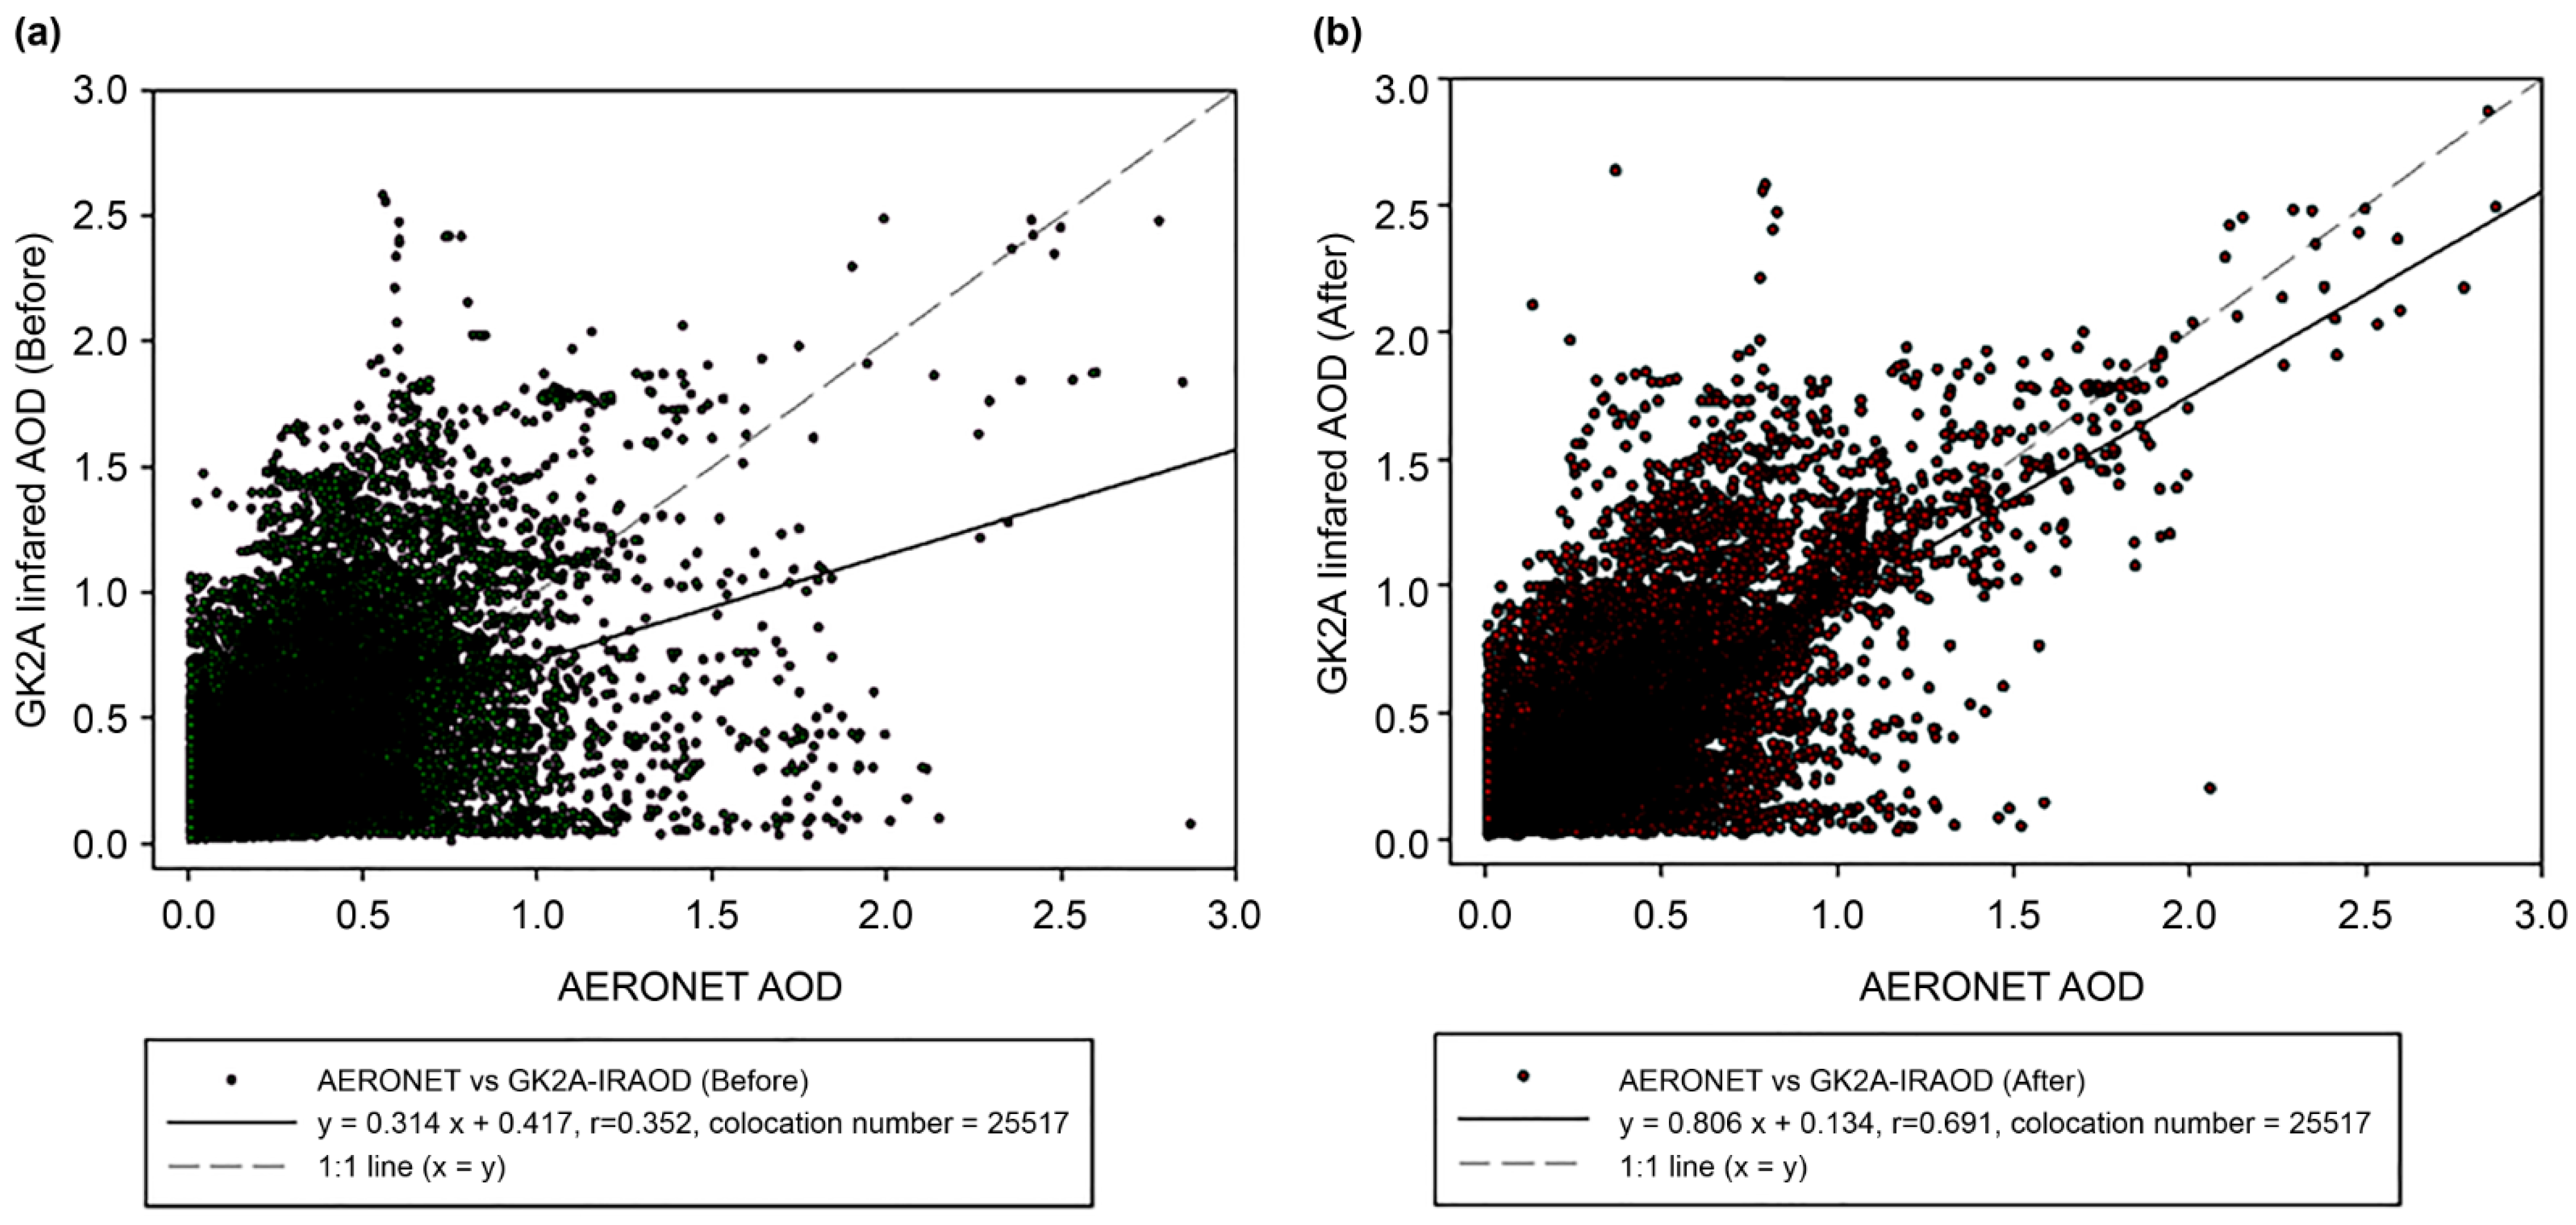
- The GK-2A/AMI AOD had an overall high correlation with AERONET (R = 0.691) and Suomi-NPP/VIIRS (R = 0.651).
- The developed DAOD exhibited variable accuracy in the visible AOD; thus, its accuracy was improved using a CDF fitting method, assuming that the visible AOD is true.
- Following the DAOD correction, it was validated quantitatively and qualitatively with AERONET. In particular, when yellow dust appeared, the movement flow of the dust was monitored and showed continuity for 24 h.
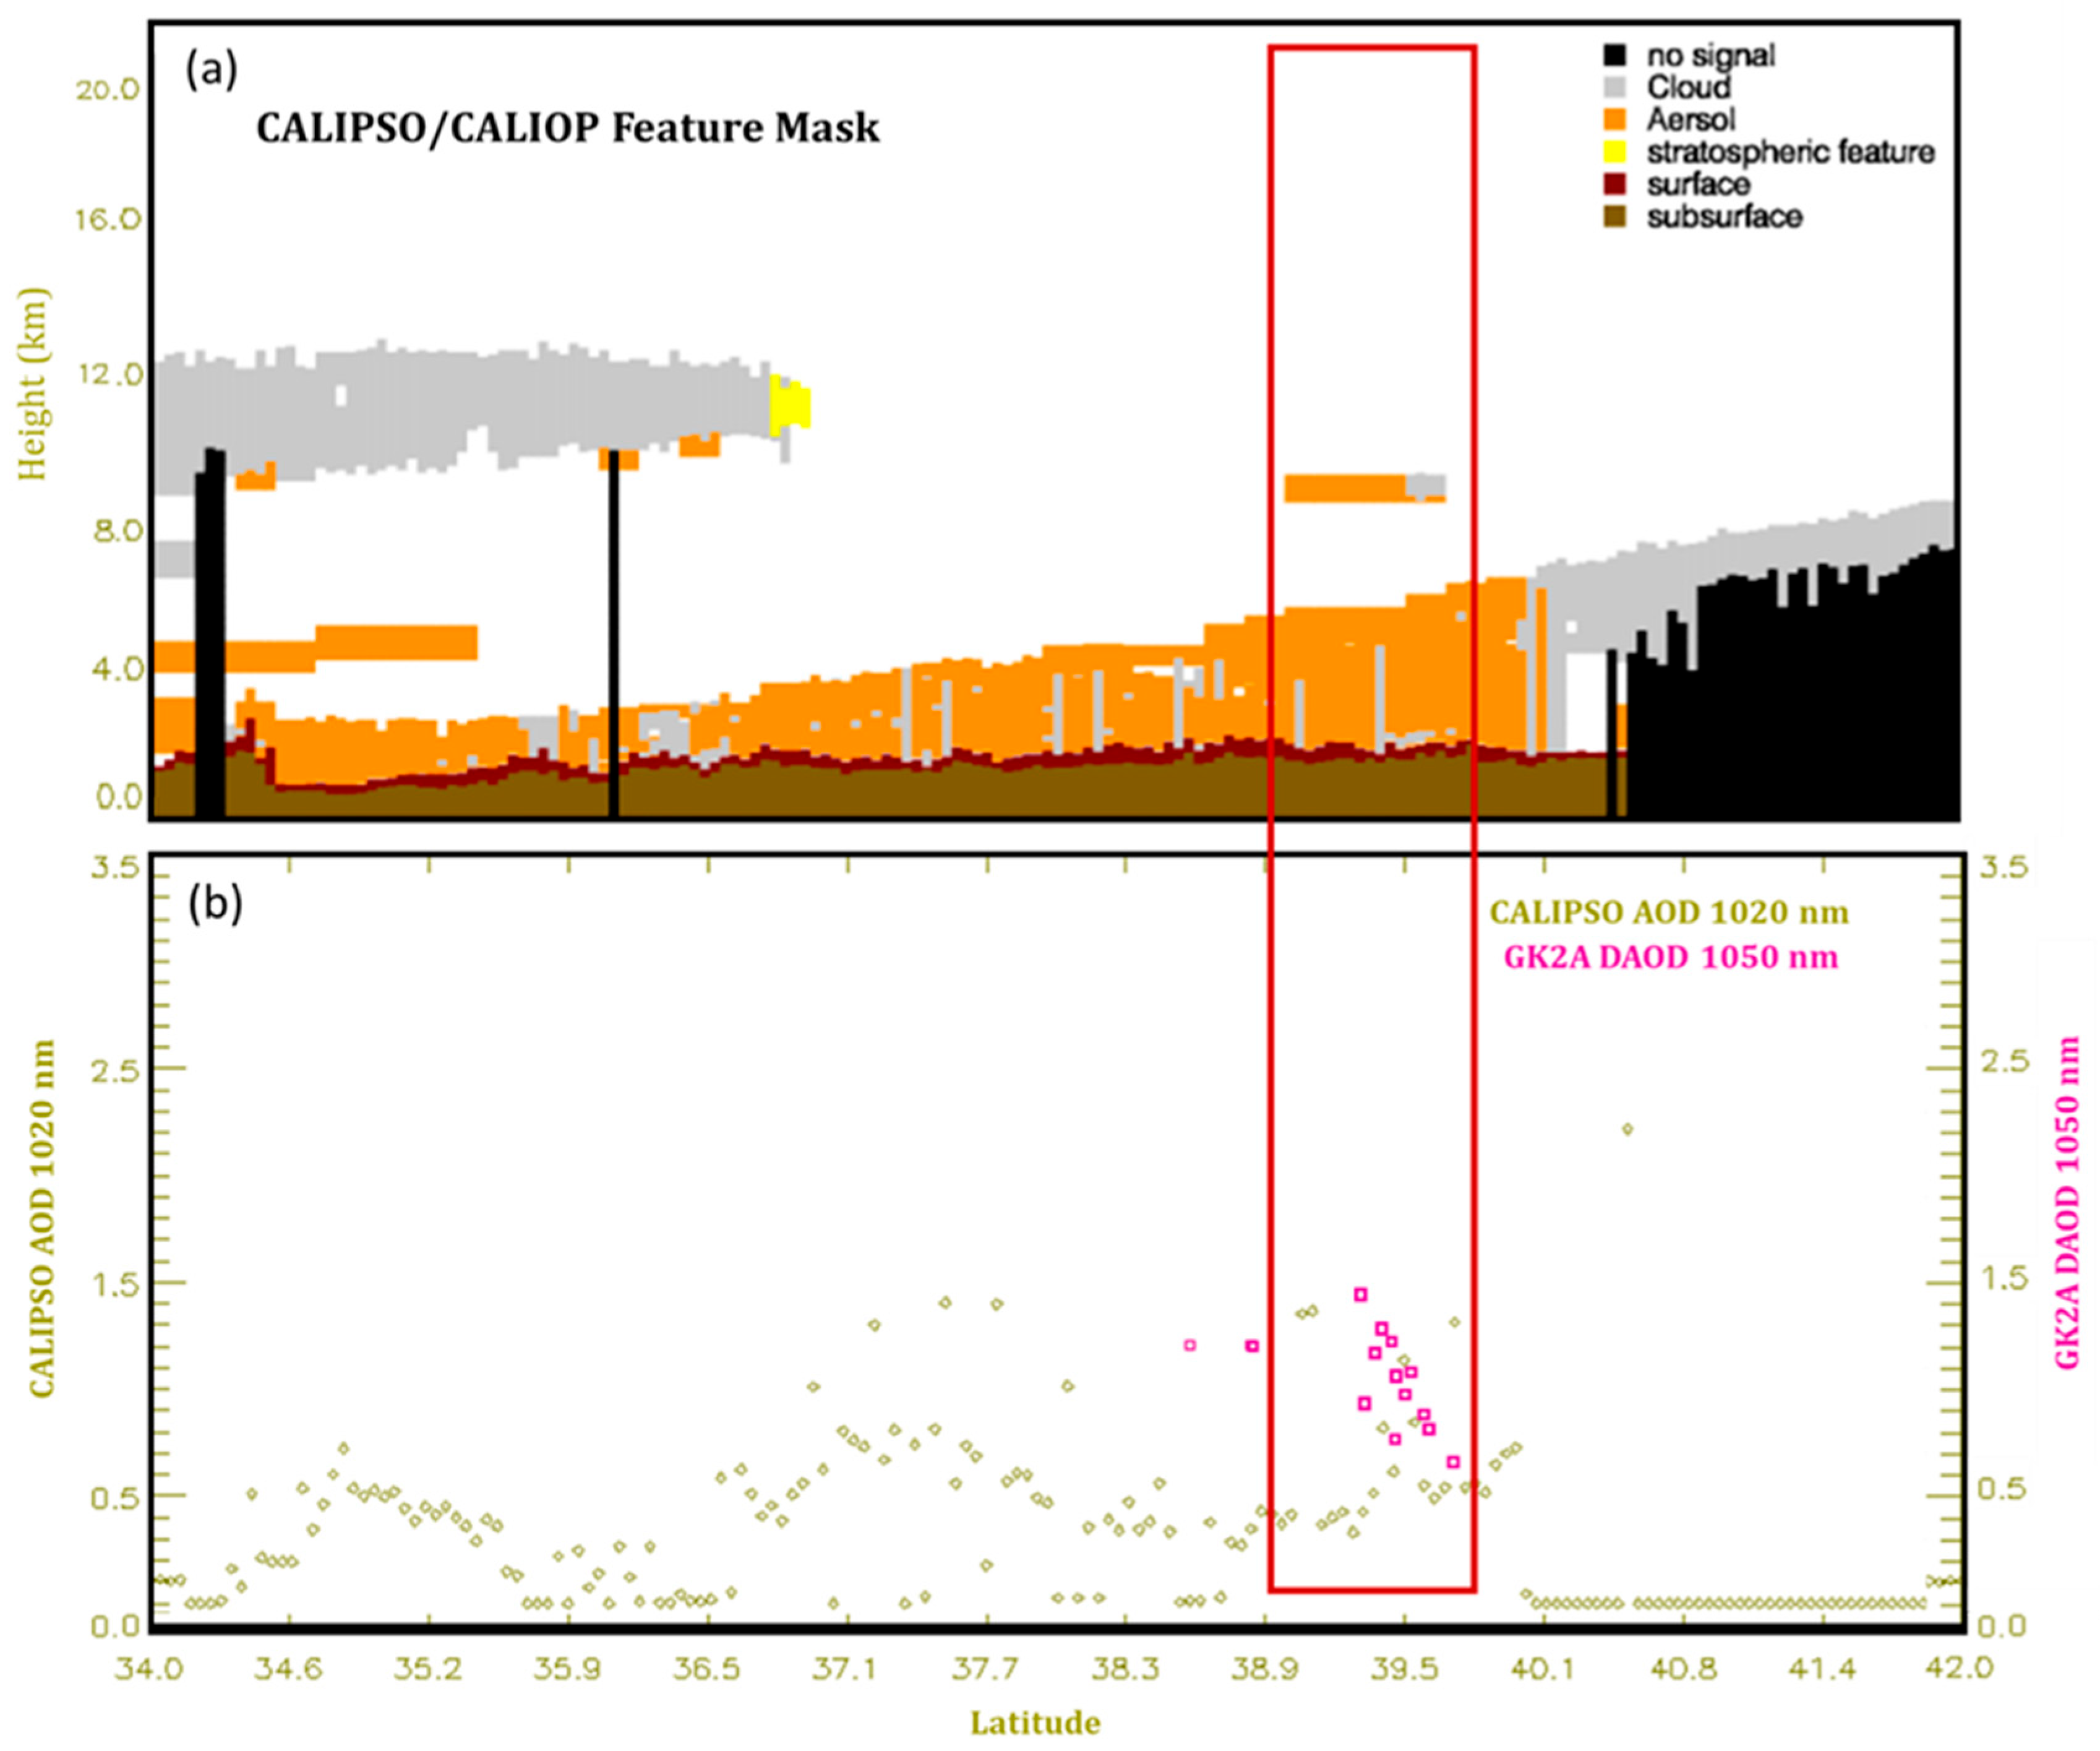
- Validation of the DAOD with CALIPSO/CALIOP at night showed quantitative values similar to 1020 nm for the CALIPO product, enabling the persistence of the height and attribute of the dust at the time of occurrence.
Author Contributions
Funding
Institutional Review Board Statement
Informed Consent Statement
Data Availability Statement
Conflicts of Interest
References
- Che, H.Z.; Shi, G.Y.; Zhang, X.Y.; Zhao, J.Q.; Li, Y. Analysis of sky conditions using 40 year records of solar radiation data in China. Theor. Appl. Climatol. 2007, 89, 83–94. [Google Scholar] [CrossRef]
- Cheng, S.H.; Yang, L.X.; Zhou, X.H.; Xue, L.K.; Gao, X.M.; Zhou, Y.; Wang, W.X. Size-fractionated water-soluble ions, situ pH and water content in aerosol on hazy days and the influences on visibility impairment in Jinan, China. Atmos. Environ. 2011, 45, 4631–4640. [Google Scholar] [CrossRef]
- Liang, F.; Xia, X.A. Long-term trends in solar radiation and the associated climatic factors over China for 1961–2000. In Annales Geophysicae; Copernicus GmbH: Göttingen, Germany, 2005; Volume 23, pp. 2425–2432. [Google Scholar]
- Menon, S.; Hansen, J.; Nazarenko, L.; Luo, Y. Climate effects of black carbon aerosols in China and India. Science 2002, 297, 2250–2253. [Google Scholar] [CrossRef]
- Xu, J.; Bergin, M.H.; Yu, X.; Liu, G.; Zhao, J.; Carrico, C.M.; Baumann, K. Measurement of aerosol chemical, physical and radiative properties in the Yangtze Delta region of China. Atmos. Environ. 2002, 36, 161–173. [Google Scholar] [CrossRef]
- Pope, C.A.; Dockery, D.W.; Schwartz, J. Review of epidemiological evidence of health effects of particulate air pollution. Inhal. Toxicol. 1995, 7, 1–18. [Google Scholar] [CrossRef]
- Yu, F.; Luo, G.; Ma, X. Regional and global modeling of aerosol optical properties with a size, composition, and mixing state resolved particle microphysics model. Atmos. Chem. Phys. 2012, 12, 5719–5736. [Google Scholar] [CrossRef]
- Hauser, A.; Oesch, D.; Foppa, N.; Wunderle, S. NOAA AVHRR derived aerosol optical depth over land. J. Geophys. Res. Atmos. 2005, 110, D8. [Google Scholar] [CrossRef]
- Hauser, A.; Oesch, D.; Foppa, N. Aerosol optical depth over land: Comparing AERONET, AVHRR and MODIS. Geophys. Res. Lett. 2005, 32, L17816. [Google Scholar] [CrossRef]
- Torres, O.; Tanskanen, A.; Veihelmann, B.; Ahn, C.; Braak, R.; Bhartia, P.K.; Veefkind, P.; Levelt, P. Aerosols and surface UV products from Ozone Monitoring Instrument observations: An overview. J. Geophys. Res. Atmos. 2007, 112. [Google Scholar] [CrossRef]
- Kahn, R.A.; Gaitley, B.J.; Garay, M.J.; Diner, D.J.; Eck, T.F.; Smirnov, A.; Holben, B.N. Multiangle Imaging SpectroRadiometer global aerosol product assessment by comparison with the Aerosol Robotic Network. J. Geophys. Res. Atmos. 2010, 115. [Google Scholar] [CrossRef]
- Remer, L.A.; Mattoo, S.; Levy, R.C.; Munchak, L.A. MODIS 3 km aerosol product: Algorithm and global perspective. Atmos. Meas. Tech. 2013, 6, 1829–1844. [Google Scholar] [CrossRef]
- Huang, J.; Kondragunta, S.; Laszlo, I.; Liu, H.; Remer, L.A.; Zhang, H.; Superczynski, S.; Ciren, P.; Holben, B.N.; Petrenko, M. Validation and expected error estimation of Suomi-NPP VIIRS aerosol optical thickness and Ångström exponent with AERONET. J. Geophys. Res. Atmos. 2016, 121, 7139–7160. [Google Scholar] [CrossRef]
- Liu, H.; Remer, L.A.; Huang, J.; Huang, H.C.; Kondragunta, S.; Laszlo, I.; Oo, M.; Jackson, J.M. Preliminary evaluation of S-NPP VIIRS aerosol optical thickness. J. Geophys. Res. Atmos. 2014, 119, 3942–3962. [Google Scholar] [CrossRef]
- Nakajima, T.; Nakajima, T.Y.; Higurashi, A.; Sano, I.; Takamura, T.; Ishida, H.; Schutgens, N. A study of aerosol and cloud information retrievals from CAI imager on board GOSAT satellite. J. Remote Sens. Soc. Jpn. 2008, 28, 178–189. [Google Scholar]
- Capelle, V.; Chédin, A.; Siméon, M.; Tsamalis, C.; Pierangelo, C.; Pondrom, M.; Crevoisier, C.; Crepeau, L.; Scott, N.A. Evaluation of IASI-derived dust aerosol characteristics over the tropical belt. Atmos. Chem. Phys. 2014, 14, 9343–9362. [Google Scholar] [CrossRef]
- Cuesta, J.; Eremenko, M.; Flamant, C.; Dufour, G.; Laurent, B.; Bergametti, G.; Höpfner, M.; Orphal, J.; Zhou, D. Three-dimensional distribution of a major desert dust outbreak over East Asia in March 2008 derived from IASI satellite observations. J. Geophys. Res. Atmos. 2015, 120, 7099–7127. [Google Scholar] [CrossRef]
- Vogelmann, A.M.; Flatau, P.J.; Szczodrak, M.; Markowicz, K.M.; Minnett, P.J. Observations of large aerosol infrared forcing at the surface. Geophys. Res. Lett. 2003, 30, 1655. [Google Scholar] [CrossRef]
- Ginoux, P. Warming or cooling dust? Nat. Geosci. 2017, 10, 246–248. [Google Scholar] [CrossRef]
- Heinold, B.; Knippertz, P.; Marsham, J.H.; Fiedler, S.; Dixon, N.S.; Schepanski, K.; Laurent, B.; Tegen, I. The role of deep convection and nocturnal low-level jets for dust emission in summertime West Africa: Estimates from convection-permitting simulations. J. Geophys. Res. Atmos. 2013, 118, 4385–4400. [Google Scholar] [CrossRef] [PubMed]
- Hourdin, F.; Gueye, M.; Diallo, B.; Dufresne, J.L.; Escribano, J.; Menut, L.; Marticoréna, B.; Siour, G.; Guichard, F. Parameterization of convective transport in the boundary layer and its impact on the representation of the diurnal cycle of wind and dust emissions. Atmos. Chem. Phys. 2015, 15, 6775–6788. [Google Scholar] [CrossRef]
- Kocha, C.; Tulet, P.; Lafore, J.P.; Flamant, C. The importance of the diurnal cycle of Aerosol Optical Depth in West Africa. Geophys. Res. Lett. 2013, 40, 785–790. [Google Scholar] [CrossRef]
- Holben, B.N.; Eck, T.F.; Slutsker, I.A.; Tanré, D.; Buis, J.P.; Setzer, A.; Vermote, E.; Reagan, J.A.; Kaufman, Y.J.; Nakajima, T.; et al. AERONET—A federated instrument network and data archive for aerosol characterization. Remote Sens. Environ. 1998, 66, 1–16. [Google Scholar] [CrossRef]
- Jackson, J.M.; Liu, H.; Laszlo, I.; Kondragunta, S.; Remer, L.A.; Huang, J.; Huang, H.C. Suomi-NPP VIIRS aerosol algorithms and data products. J. Geophys. Res. Atmos. 2013, 118, 12673–12689. [Google Scholar] [CrossRef]
- Omar, A.H.; Winker, D.M.; Vaughan, M.A.; Hu, Y.; Trepte, C.R.; Ferrare, R.A.; Lee, K.P.; Hostetler, C.A.; Kittaka, C.; Rogers, R.R.; et al. The CALIPSO automated aerosol classification and lidar ratio selection algorithm. J. Atmos. Ocean. Technol. 2009, 26, 1994–2014. [Google Scholar] [CrossRef]
- Young, S.A.; Vaughan, M.A. The retrieval of profiles of particulate extinction from Cloud-Aerosol Lidar Infrared Pathfinder Satellite Observations (CALIPSO) data: Algorithm description. J. Atmos. Ocean. Technol. 2009, 26, 1105–1119. [Google Scholar] [CrossRef]
- Jee, J.B.; Lee, K.T.; Lee, K.H.; Zo, I.S. Development of GK-2A AMI aerosol detection algorithm in the East-Asia region using Himawari-8 AHI data. Asia-Pac. J. Atmos. Sci. 2020, 56, 207–223. [Google Scholar] [CrossRef]
- Ahn, S.; Jee, J.B.; Lee, K.T.; Oh, H.J. Enhanced accuracy of airborne volcanic ash detection using the GEOKOMPSAT-2A Satellite. Sensors 2021, 21, 1359. [Google Scholar] [CrossRef]
- Liu, Y.; Key, J.R. Detection and analysis of low-level temperature inversions with MODIS. In IEEE International Geoscience and Remote Sensing Symposium; IEEE: Piscataway, NJ, USA, 2002; Volume 4, pp. 2308–2310. [Google Scholar]
- Ackerman, S.A. Remote sensing aerosols using satellite infrared observations. J. Geophys. Res. Atmos. 1997, 102, 17069–17079. [Google Scholar] [CrossRef]
- Shenk, W.E.; Curran, R.J. The detection of dust storms over land and water with satellite visible and infrared measurements. Mon. Weather Rev. 1974, 102, 830–837. [Google Scholar] [CrossRef]
- Takashima, T.; Masuda, K. Emissivities of quartz and Sahara dust powders in the infrared region (7–17 μ). Remote Sens. Environ. 1987, 23, 51–63. [Google Scholar] [CrossRef]
- Takashima, T.; Masuda, K. Averaged emissivities of quartz and sahara dust powders in the infrared region. Remote Sens. Environ. 1988, 26, 301–302. [Google Scholar] [CrossRef]
- King, M.D.; Menzel, W.P.; Kaufman, Y.J.; Tanré, D.; Gao, B.C.; Platnick, S.; Ackerman, S.A.; Remer, L.A.; Pincus, R.; Hubanks, P.A. Cloud and aerosol properties, precipitable water, and profiles of temperature and water vapor from MODIS. IEEE Trans. Geosci. Remote Sens. 2003, 41, 442–458. [Google Scholar] [CrossRef]
- Gu, Y.; Rose, W.I.; Bluth, G.J. Retrieval of mass and sizes of particles in sandstorms using two MODIS IR bands: A case study of April 7, 2001 sandstorm in China. Geophys. Res. Lett. 2003, 30. [Google Scholar] [CrossRef]
- Salisbury, J.W.; Wald, A. The role of volume scattering in reducing spectral contrast of reststrahlen bands in spectra of powdered minerals. Icarus 1992, 96, 121–128. [Google Scholar] [CrossRef]
- Wald, A.E.; Salisbury, J.W. Thermal infrared directional emissivity of powdered quartz. J. Geophys. Res. Solid Earth 1995, 100, 24665–24675. [Google Scholar] [CrossRef]
- Wenrich, M.L.; Christensen, P.R. Optical constants of minerals derived from emission spectroscopy: Application to quartz. J. Geophys. Res. Solid Earth 1996, 101, 15921–15931. [Google Scholar] [CrossRef]
- Wald, A.E.; Kaufman, Y.J.; Tanré, D.; Gao, B.C. Daytime and nighttime detection of mineral dust over desert using infrared spectral contrast. J. Geophys. Res. Atmos. 1998, 103, 32307–32313. [Google Scholar] [CrossRef]
- Sokolik, I.N. The spectral radiative signature of wind-blown mineral dust: Implications for remote sensing in the thermal IR region. Geophys. Res. Lett. 2002, 29, 7-1–7-4. [Google Scholar] [CrossRef]
- Park, S.U.; Lee, E.H. Parameterization of Asian dust (Hwangsa) particle-size distributions for use in dust emission models. Atmos. Environ. 2004, 38, 2155–2162. [Google Scholar] [CrossRef]
- Hansell, R.A.; Ou, S.C.; Liou, K.N.; Roskovensky, J.K.; Tsay, S.C.; Hsu, C.; Ji, Q. Simultaneous detection/separation of mineral dust and cirrus clouds using MODIS thermal infrared window data. Geophys. Res. Lett. 2007, 34. [Google Scholar] [CrossRef]
- Zhang, P.; Lu, N.M.; Hu, X.Q.; Dong, C.H. Identification and physical retrieval of dust storm using three MODIS thermal IR channels. Glob. Planet. Change 2006, 52, 197–206. [Google Scholar] [CrossRef]
- Orofino, V.; Blanco, A.; Fonti, S.; Proce, R.; Rotundi, A. The infrared optical constants of limestone particles and implications for the search of carbonates on Mars. Planet. Space Sci. 1998, 46, 1659–1669. [Google Scholar] [CrossRef]
- Marra, A.C.; Blanco, A.; Fonti, S.; Jurewicz, A.; Orofino, V. Fine hematite particles of Martian interest: Absorption spectra and optical constants. J. Phys. Conf. Ser. 2005, 6, 132. [Google Scholar] [CrossRef]
- Stamnes, K.; Tsay, S.C.; Wiscombe, W.; Jayaweera, K. Numerically stable algorithm for discrete-ordinate-method radiative transfer in multiple scattering and emitting layered media. Appl. Opt. 1988, 27, 2502–2509. [Google Scholar] [CrossRef] [PubMed]
- Ricchiazzi, P.; Yang, S.; Gautier, C.; Sowle, D. SBDART: A research and teaching software tool for plane-parallel radiative transfer in the Earth’s atmosphere. Bull. Am. Meteorol. Soc. 1998, 79, 2101–2114. [Google Scholar] [CrossRef]
- Mayer, B.; Kylling, A. The libRadtran software package for radiative transfer calculations-description and examples of use. Atmos. Chem. Phys. 2005, 5, 1855–1877. [Google Scholar] [CrossRef]
- Pavolonis, M.; Sieglaff, J. GOES-R Advanced Baseline Imager (ABI) Algorithm Theoretical Basis Document for Volcanic Ash (Detection and Height). 2009. Available online: http://www.star.nesdis.noaa.gov/goesr/docs/ATBD/VolAsh.pdf (accessed on 1 January 2019).
- Kidder, S.Q.; Jones, A.S. A blended satellite total precipitable water product for operational forecasting. J. Atmos. Ocean. Technol. 2007, 24, 74–81. [Google Scholar] [CrossRef]
- He, L.; Wang, L.; Lin, A.; Zhang, M.; Bilal, M.; Wei, J. Performance of the NPP-VIIRS and Aqua-MODIS aerosol optical depth products over the Yangtze River Basin. Remote Sens. 2018, 10, 117. [Google Scholar] [CrossRef]
- Zhang, H.; Kondragunta, S.; Laszlo, I.; Zhou, M. Improving GOES Advanced Baseline Imager (ABI) aerosol optical depth (AOD) retrievals using an empirical bias correction algorithm. Atmos. Meas. Tech. 2020, 13, 5955–5975. [Google Scholar] [CrossRef]
- Benedetti, A.; Di Giuseppe, F.; Jones, L.; Peuch, V.H.; Rémy, S.; Zhang, X. The value of satellite observations in the analysis and short-range prediction of Asian dust. Atmos. Chem. Phys. 2019, 19, 987–998. [Google Scholar] [CrossRef]
- Cao, J.; Lee, S.; Zheng, X.; Ho, K.; Zhang, X.; Guo, H.; Chow, J.C.; Wang, H. Characterization of dust storms to Hong Kong in April 1998. Water Air Soil Pollut. Focus 2003, 3, 213–229. [Google Scholar] [CrossRef]
- Peyridieu, S.; Chédin, A.; Tanré, D.; Capelle, V.; Pierangelo, C.; Lamquin, N.; Armante, R. Saharan dust infrared optical depth and altitude retrieved from AIRS: A focus over North Atlantic–comparison to MODIS and CALIPSO. Atmos. Chem. Phys. 2010, 10, 1953–1967. [Google Scholar] [CrossRef]


| Band | Band Name | Wavelength | Band Width (Max) | Spatial Resolution (km) | |
|---|---|---|---|---|---|
| Min (um) | Max (um) | ||||
| 1 (blue) | VIS0.47 | 0.43 | 0.48 | 0.075 | 1 |
| 2 (green) | VIS0.51 | 0.52 | 0.52 | 0.063 | 1 |
| 3 (red) | VIS0.64 | 0.63 | 0.66 | 0.125 | 0.5 |
| 4 (VIS) | VIS0.86 | 0.85 | 0.87 | 0.088 | 1 |
| 5 (NIR) | NIR1.37 | 1.37 | 1.38 | 0.03 | 2 |
| 6 (NIR) | NIR1.61 | 1.60 | 1.62 | 0.075 | 2 |
| 7 (IR) | SWIR3.8 | 3.74 | 3.96 | 0.5 | 2 |
| 8 (IR) | WV6.3 | 6.06 | 6.43 | 1.038 | 2 |
| 9 (IR) | WV6.9 | 6.89 | 7.01 | 0.5 | 2 |
| 10 (IR) | WV7.3 | 7.26 | 7.43 | 0.688 | 2 |
| 11 (IR) | IR8.7 | 8.44 | 8.76 | 0.5 | 2 |
| 12 (IR) | IR9.6 | 9.54 | 9.72 | 0.475 | 2 |
| 13 (IR) | IR10.5 | 10.3 | 10.6 | 0.875 | 2 |
| 14 (IR) | IR11.2 | 11.1 | 11.3 | 1.0 | 2 |
| 15 (IR) | IR12.3 | 12.2 | 12.5 | 1.25 | 2 |
| 16 (IR) | IR13.3 | 13.2 | 13.4 | 0.75 | 2 |
| Satellite Data Composition | Dust Event Date | Oriental Dust Location | Analysis Day |
|---|---|---|---|
| Training dataset dust episodes (2020) | 16–17 February 2020 | Dalian (Northeast of China) | 00:00 UTC–10:50 UTC |
| 20–23 February 2020 | Wulatezhongqi/Yanan~ Shandong province/ Bohai sea | ||
| 12–14 March 2020 | Tibetan Plateau~ Shandong province~ Bohai sea | ||
| 18–19 March 2020 | Inner Mongolia~Bohai sea | ||
| 30 March–2 April 2020 | Southeast of Mongolia | ||
| 3–7 April 2020 | Wulatezhongqi (East of Monolia) | ||
| 15–18 April 2020 | Mongolia | ||
| 20–22 April 2020 | Dandong~Bohai sea~ Tongliao, Siping | ||
| 24–25 April 2020 | East of Mongolia | ||
| 10–11 May 2020 | Bohia sea~Siping | ||
| 11–14 May 2020 | Inner Mongolia | ||
| 31 May–6 June 2020 | Gobi Desert~ Wulatezhongqi~ Erenhot~Jurihe | ||
| 5–11 June 2020 | Taklamakan | ||
| 9–11 June 2020 | Gobi Desert | ||
| 19–23 October 2020 | Gobi Desert | ||
| 30 October–2 November 2020 | Gobi Desert | ||
| 5–8 November 2020 | Gobi Desert | ||
| 7–8 November 2020 | Manchuria | ||
| Analysis dataset dust edpisodes (2021) | 13–14 January 2021 | Gobi Desert | 00:00 UTC–23:50 UTC |
| 21–22 February 2021 | Gobi Desert | ||
| 15–17 March 2021 | Mongolia | ||
| 23–28 March 2021 | Gobi Desert | ||
| 15–17 April 2021 | Mongolia | ||
| 26–27 April 2021 | Mongolia | ||
| 04–07 May 2021 | Gobi Desert | ||
| 23–24 May 2021 | Gobi Desert | ||
| 16 December 2021 | Inner Mongolia |
| Variable Name | Number of Entries | Entries |
|---|---|---|
| Wavelength | 5 | 3.8, 10.5, 11.2, 12.4, 13.3 μm (considering spectral response function) |
| Solar zenith angle | 9 | 0, 10, 20, 30,..., 80 (10 intervals) |
| Satellite zenith angle | 17 | 0, 5, 10, 15,..., 80 (5 intervals) |
| Relative azimuth angle | 18 | 0, 10, 20,..., 170 (10 intervals) |
| AOD | 10 | 0.0, 0.3, 0.6, 0.9, 1.2, 1.5, 2.0, 3.0, 4.0, 5.0 |
| Dust Aerosol model | 10 | 1, 2, 3, 4, 5, 6, 7, 8, 9, 10 μm (considering effective radius) |
| Dust Altitude | 10 | 1, 2, 3, 4, 5, 6, 7, 8, 9, 10 km |
| Site | Latitude (Degree) | Longitude (Degree) | Elevation (m) | Type |
|---|---|---|---|---|
| Anmyon | 36.539 N | 126.330 E | 47 | Rural |
| AOE_Baotou | 40.852 N | 109.629 E | 1314 | Rural |
| Beijing | 39.977 N | 116.381 E | 92 | Urban |
| Beijing-CAMS | 39.933 N | 116.317 E | 106 | Urban |
| Beijing-RADI | 40.005 N | 116.379 E | 59 | Urban |
| Bhola | 22.227 N | 90.756 E | 7 | |
| Chen-Kung_Univ | 22.993 N | 120.204 E | 50 | |
| Chiba_University | 35.625 N | 140.104 E | 60 | |
| Dalanzadgad | 43.577 N | 104.419 E | 1470 | Rural |
| Dhaka_University | 23.728 N | 90.398 E | 34 | |
| Dibrugarh_Univ. | 27.451 N | 94.896 E | 119 | |
| Dongsha_island | 20.699 N | 116.729 E | 5 | |
| Douliu | 23.712 N | 120.545 E | 60 | |
| EPA-NCU | 24.968 N | 121.185 E | 144 | |
| Fuguei_Cape | 25.297 N | 121.538 E | 50 | |
| Fukue | 32.752 N | 128.682 E | 80 | |
| Fukuoka | 33.524 N | 130.475 E | 30 | |
| Gangneung_WNU | 37.771 N | 128.867 E | 60 | Suburban |
| Gwangju_GIST | 35.228 N | 126.843 E | 52 | Urban |
| Hankuk_UFS | 37.339 N | 127.266 E | 167 | |
| Hokkaido_University | 43.075 N | 141.341 E | 59 | |
| Hong_Kong_PolyU | 22.393 N | 114.180 E | 30 | |
| Hong_Kong_Sheung | 22.483 N | 114.117 E | 40 | |
| Irkutsk | 51.800 N | 103.087 E | 670 | |
| Kaohsiung | 22.676 N | 120.292 E | 15 | |
| Luang_Namtha | 20.931 N | 101.416 E | 557 | |
| Lulin | 23.469 N | 120.874 E | 2868 | |
| Mandalay_MTU | 21.973 N | 96.186 E | 104 | |
| NAM_CO | 30.773 N | 90.963 E | 4746 | |
| Niigata | 37.846 N | 138.942 E | 10 | |
| Noto | 37.334 N | 137.137 E | 200 | |
| Osaka | 34.651 N | 135.591 E | 50 | |
| Seoul_SNU | 37.458 N | 126.951 E | 116 | Urban |
| Shirahama | 33.693 N | 135.357 E | 10 | |
| Socheongcho | 37.423 N | 124.738 E | 28 | Ocean |
| Taipei_CWB | 25.015 N | 121.538 E | 26 | |
| Ussuriysk | 43.700 N | 132.163 E | 280 | |
| XiangHe | 39.754 N | 116.962 E | 36 | Urban |
| Xitun | 24.162 N | 120.617 E | 91 | |
| Yonsei_University | 37.564 N | 126.935 E | 97 | Urban |
| Site | Latitude/Longitude (Degree) | Colocation Number | RMSE | Bias |
|---|---|---|---|---|
| Anmyon | 36.539 N/126.330 E | 1675 | 0.122 | 0.009 |
| AOE_Baotou | 40.852 N/109.629 E | 1156 | 0.225 | −0.111 |
| Beijing | 39.977 N/116.381 E | 1031 | 0.146 | −0.023 |
| Beijing-CAMS | 39.933 N/116.317 E | 1975 | 0.177 | −0.017 |
| Beijing-RADI | 40.005 N/116.379 E | 1871 | 0.191 | −0.02 |
| Bhola | 22.227 N/90.756 E | 1871 | 0.211 | 0.047 |
| Chen-Kung_Univ | 22.993 N/120.204 E | 1404 | 0.273 | 0.062 |
| Chiba_University | 35.625 N/140.104 E | 1165 | 0.13 | −0.023 |
| Dalanzadgad | 43.577 N/104.419 E | 2133 | 0.264 | −0.155 |
| Dhaka_University | 23.728 N/90.398 E | 681 | 0.224 | 0.078 |
| Dibrugarh_Univ. | 27.451 N/94.896 E | 948 | 0.279 | 0.101 |
| Dongsha_island | 20.699 N/116.729 E | 1526 | 0.176 | 0.052 |
| Douliu | 23.712 N/120.545 E | 722 | 0.185 | 0.029 |
| EPA-NCU | 24.968 N/121.185 E | 994 | 0.193 | 0.024 |
| Fuguei_Cape | 25.297 N/121.538 E | 604 | 0.134 | 0.016 |
| Fukue | 32.752 N/128.682 E | 1689 | 0.095 | −0.006 |
| Fukuoka | 33.524 N/130.475 E | 1767 | 0.141 | −0.008 |
| Gangneung_WNU | 37.771 N/128.867 E | 1343 | 0.13 | 0.032 |
| Gwangju_GIST | 35.228 N/126.843 E | 565 | 0.134 | 0.003 |
| Hankuk_UFS | 37.339 N/127.266 E | 1800 | 0.073 | 0.055 |
| Hokkaido_University | 43.075 N/141.341 E | 918 | 0.237 | −0.067 |
| Hong_Kong_PolyU | 22.393 N/114.180 E | 591 | 0.18 | −0.006 |
| Hong_Kong_Sheung | 22.483 N/114.117 E | 860 | 0.13 | 0.006 |
| Irkutsk | 51.800 N/103.087 E | 1105 | 0.101 | −0.049 |
| Kaohsiung | 22.676 N/120.292 E | 1626 | 0.24 | 0.062 |
| Luang_Namtha | 20.931 N/101.416 E | 1745 | 0.496 | 0.222 |
| Lulin | 23.469 N/120.874 E | 630 | 0.09 | −0.013 |
| Mandalay_MTU | 21.973 N/96.186 E | 2299 | 0.303 | 0.154 |
| NAM_CO | 30.773 N/90.963 E | 639 | 0.261 | −0.139 |
| Niigata | 37.846 N/138.942 E | 1384 | 0.106 | −0.014 |
| Noto | 37.334 N/137.137 E | 1329 | 0.12 | 0.014 |
| Osaka | 34.651 N/135.591 E | 1371 | 0.182 | −0.023 |
| Seoul_SNU | 37.458 N/126.951 E | 1655 | 0.137 | 0.034 |
| Shirahama | 33.693 N/135.357 E | 516 | 0.028 | −0.006 |
| Socheongcho | 37.423 N/124.738 E | 1000 | 0.115 | 0.008 |
| Taipei_CWB | 25.015 N/121.538 E | 761 | 0.248 | 0.126 |
| Ussuriysk | 43.700 N/132.163 E | 870 | 0.094 | 0.012 |
| XiangHe | 39.754 N/116.962 E | 1388 | 0.202 | 0.002 |
| Xitun | 24.162 N/120.617 E | 1486 | 0.233 | 0.053 |
| Yonsei_University | 37.564 N/126.935 E | 1436 | 0.136 | 0.049 |
Disclaimer/Publisher’s Note: The statements, opinions and data contained in all publications are solely those of the individual author(s) and contributor(s) and not of MDPI and/or the editor(s). MDPI and/or the editor(s) disclaim responsibility for any injury to people or property resulting from any ideas, methods, instructions or products referred to in the content. |
© 2024 by the authors. Licensee MDPI, Basel, Switzerland. This article is an open access article distributed under the terms and conditions of the Creative Commons Attribution (CC BY) license (https://creativecommons.org/licenses/by/4.0/).
Share and Cite
Ahn, S.; Kim, H.-S.; Byon, J.-Y.; Lim, H. Improving Dust Aerosol Optical Depth (DAOD) Retrieval from the GEOKOMPSAT-2A (GK-2A) Satellite for Daytime and Nighttime Monitoring. Sensors 2024, 24, 1490. https://doi.org/10.3390/s24051490
Ahn S, Kim H-S, Byon J-Y, Lim H. Improving Dust Aerosol Optical Depth (DAOD) Retrieval from the GEOKOMPSAT-2A (GK-2A) Satellite for Daytime and Nighttime Monitoring. Sensors. 2024; 24(5):1490. https://doi.org/10.3390/s24051490
Chicago/Turabian StyleAhn, Soi, Hyeon-Su Kim, Jae-Young Byon, and Hancheol Lim. 2024. "Improving Dust Aerosol Optical Depth (DAOD) Retrieval from the GEOKOMPSAT-2A (GK-2A) Satellite for Daytime and Nighttime Monitoring" Sensors 24, no. 5: 1490. https://doi.org/10.3390/s24051490
APA StyleAhn, S., Kim, H.-S., Byon, J.-Y., & Lim, H. (2024). Improving Dust Aerosol Optical Depth (DAOD) Retrieval from the GEOKOMPSAT-2A (GK-2A) Satellite for Daytime and Nighttime Monitoring. Sensors, 24(5), 1490. https://doi.org/10.3390/s24051490