
Revolutionizing Robotic Depalletizing: AI-Enhanced Parcel Detecting with Adaptive 3D Machine Vision and RGB-D Imaging for Automated Unloading


Abstract
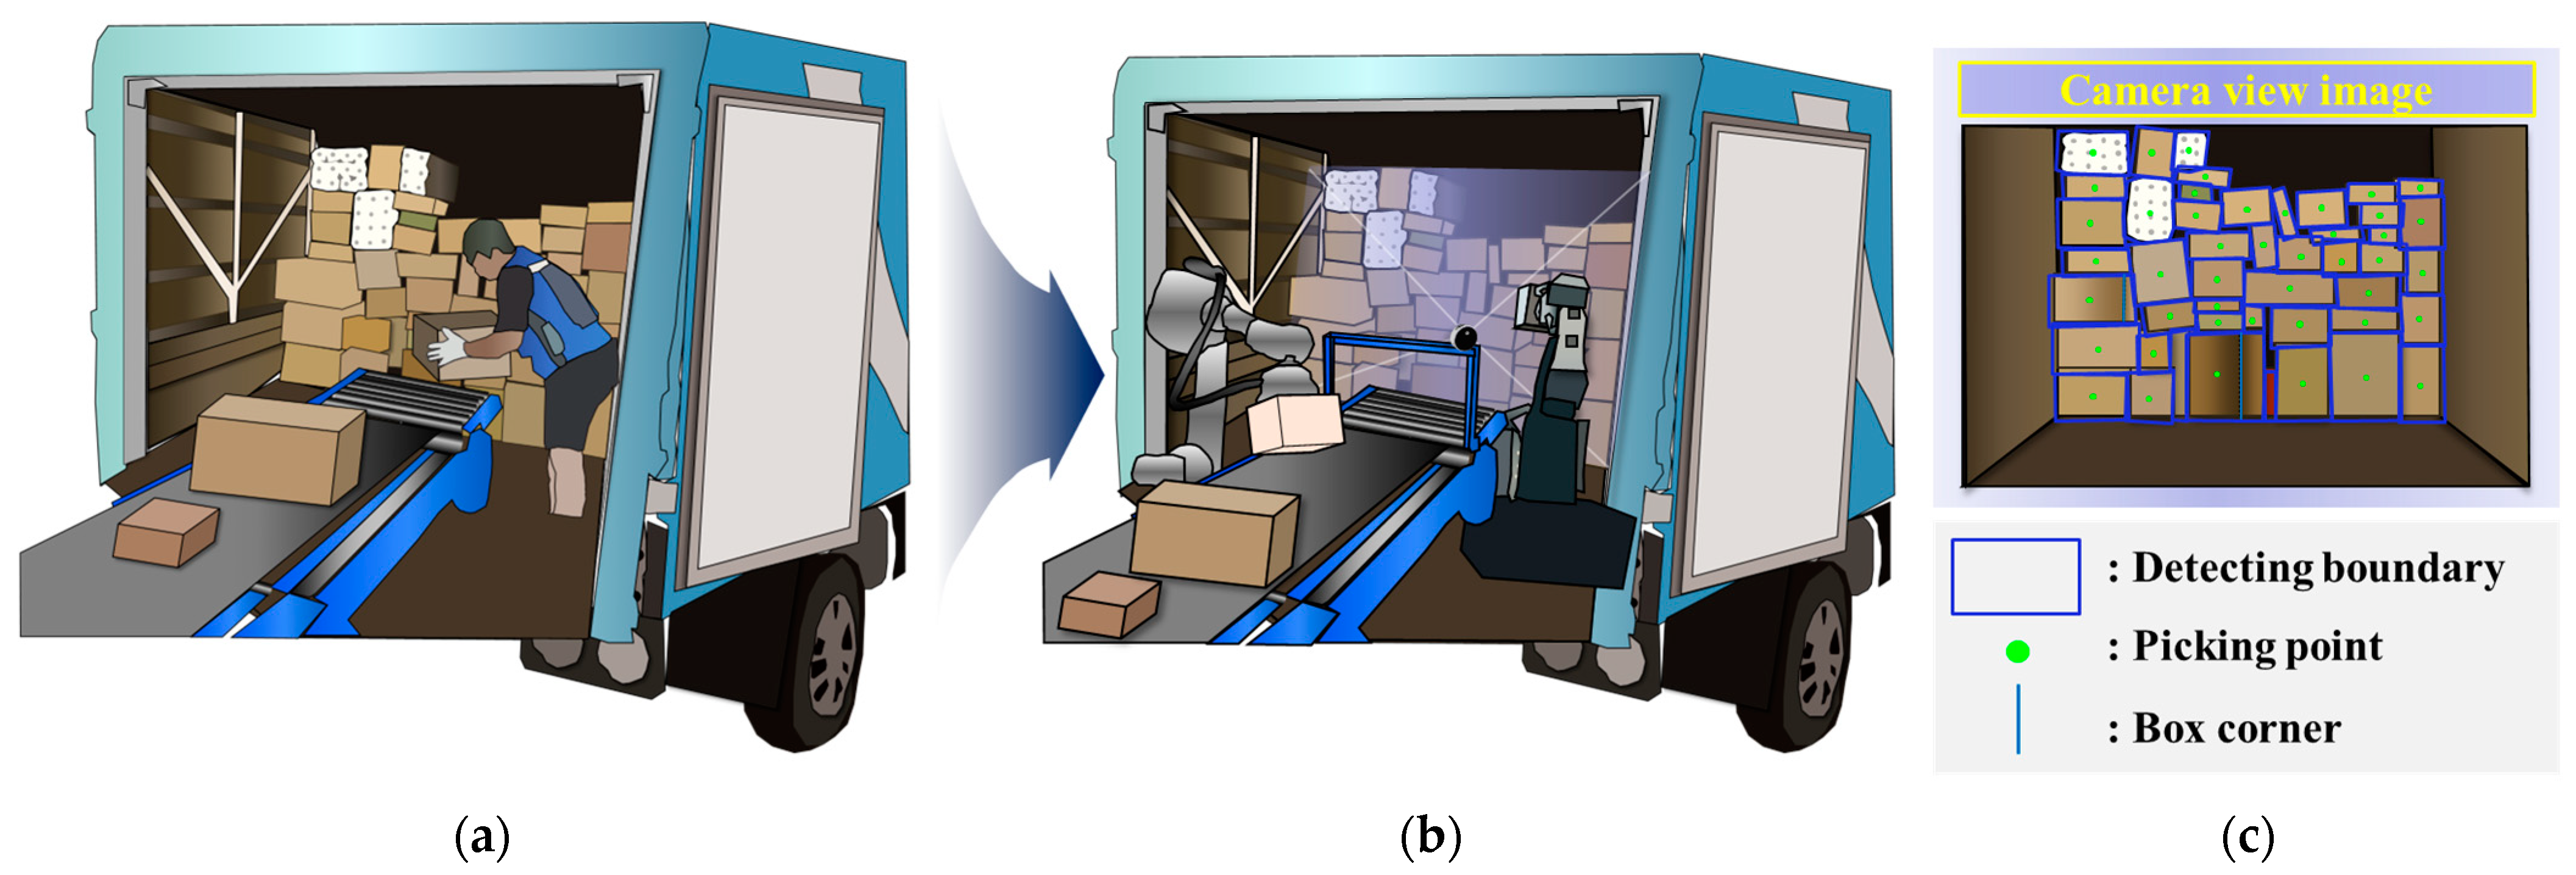
1. Introduction
2. Experimental Conditions
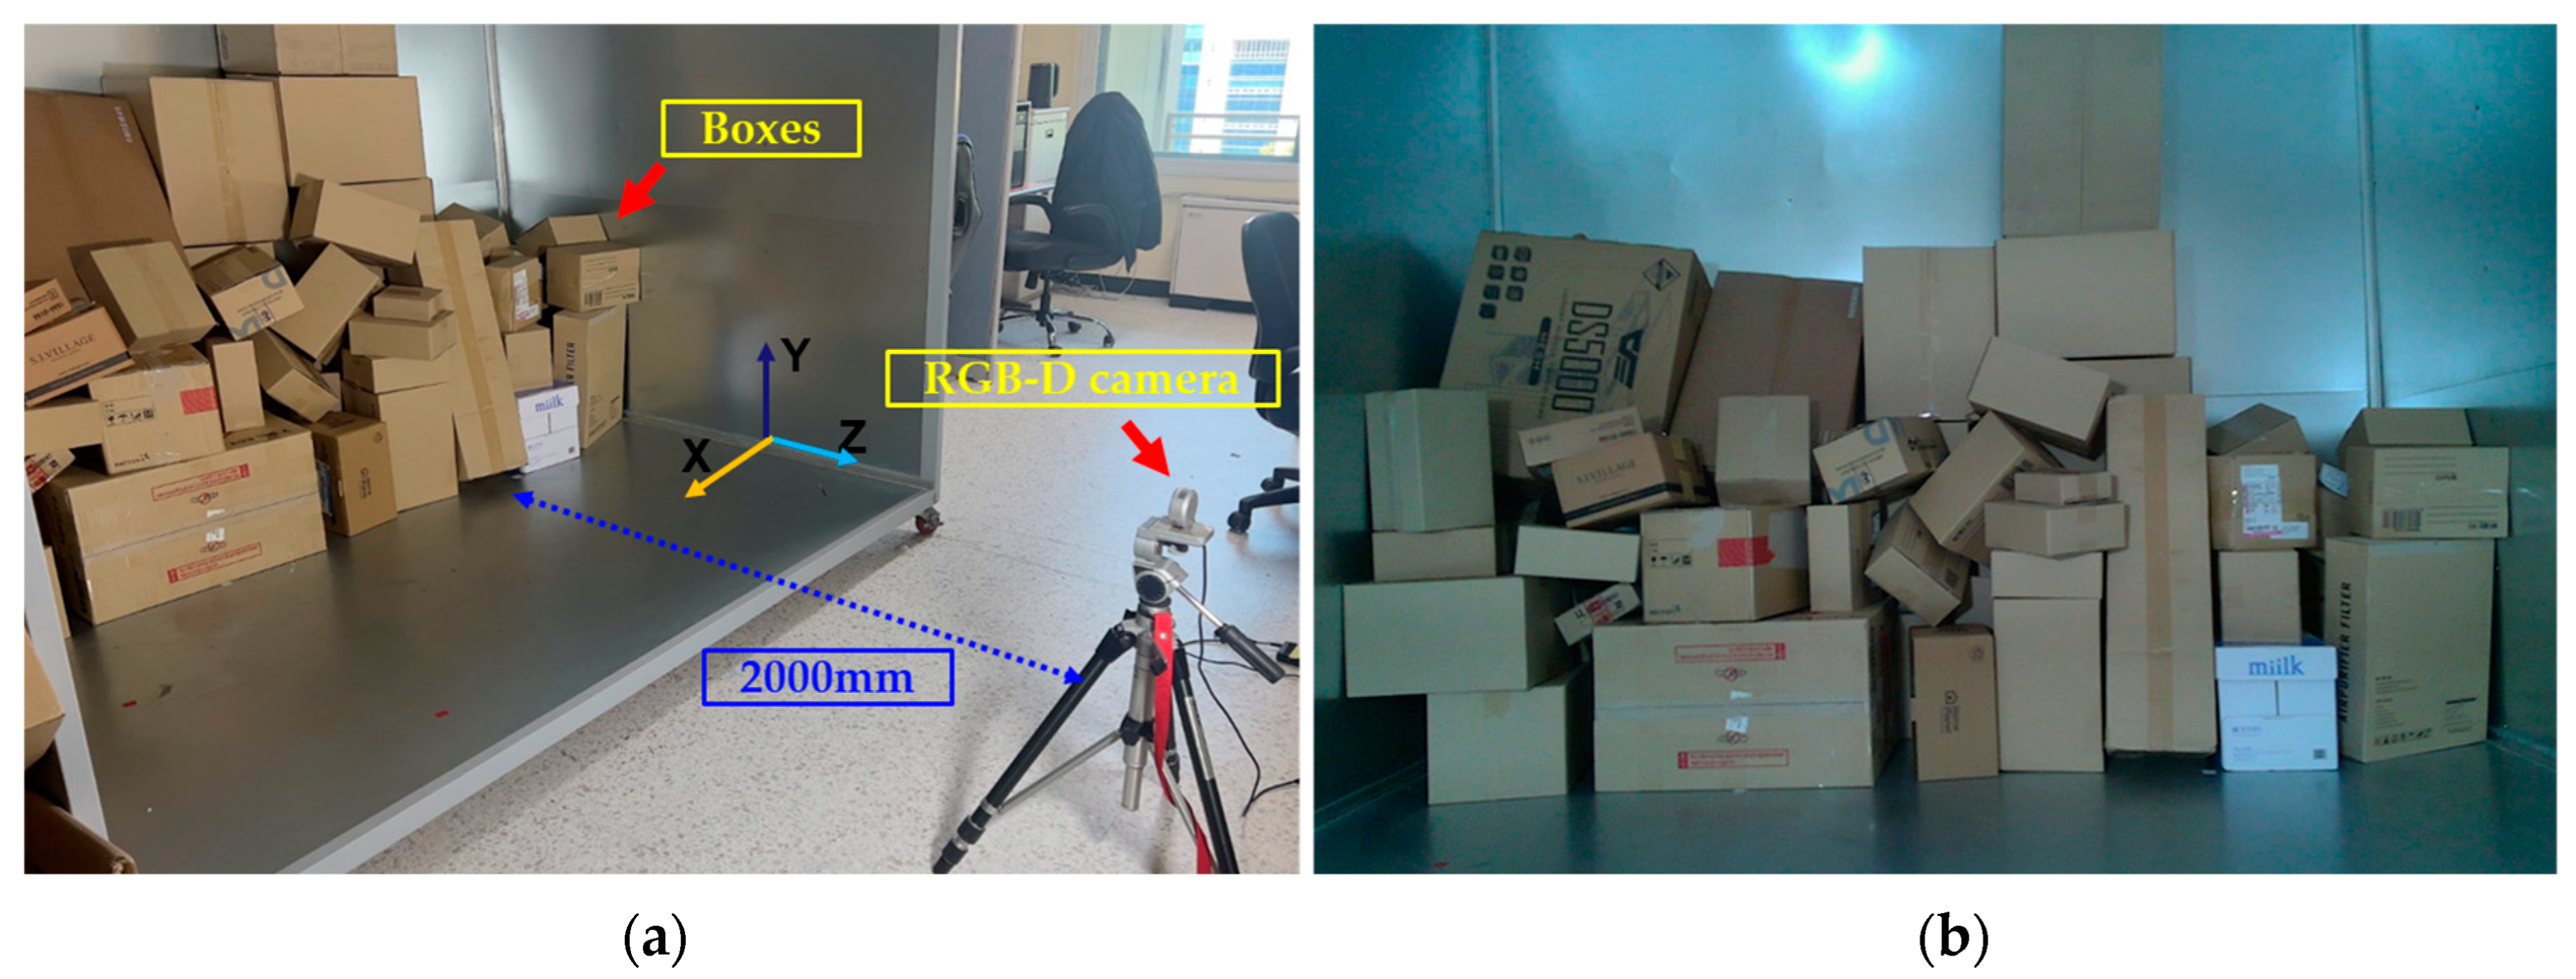
2.1. Experimental Setup for Object Detection
2.2. Verification Method for Parcel Detection
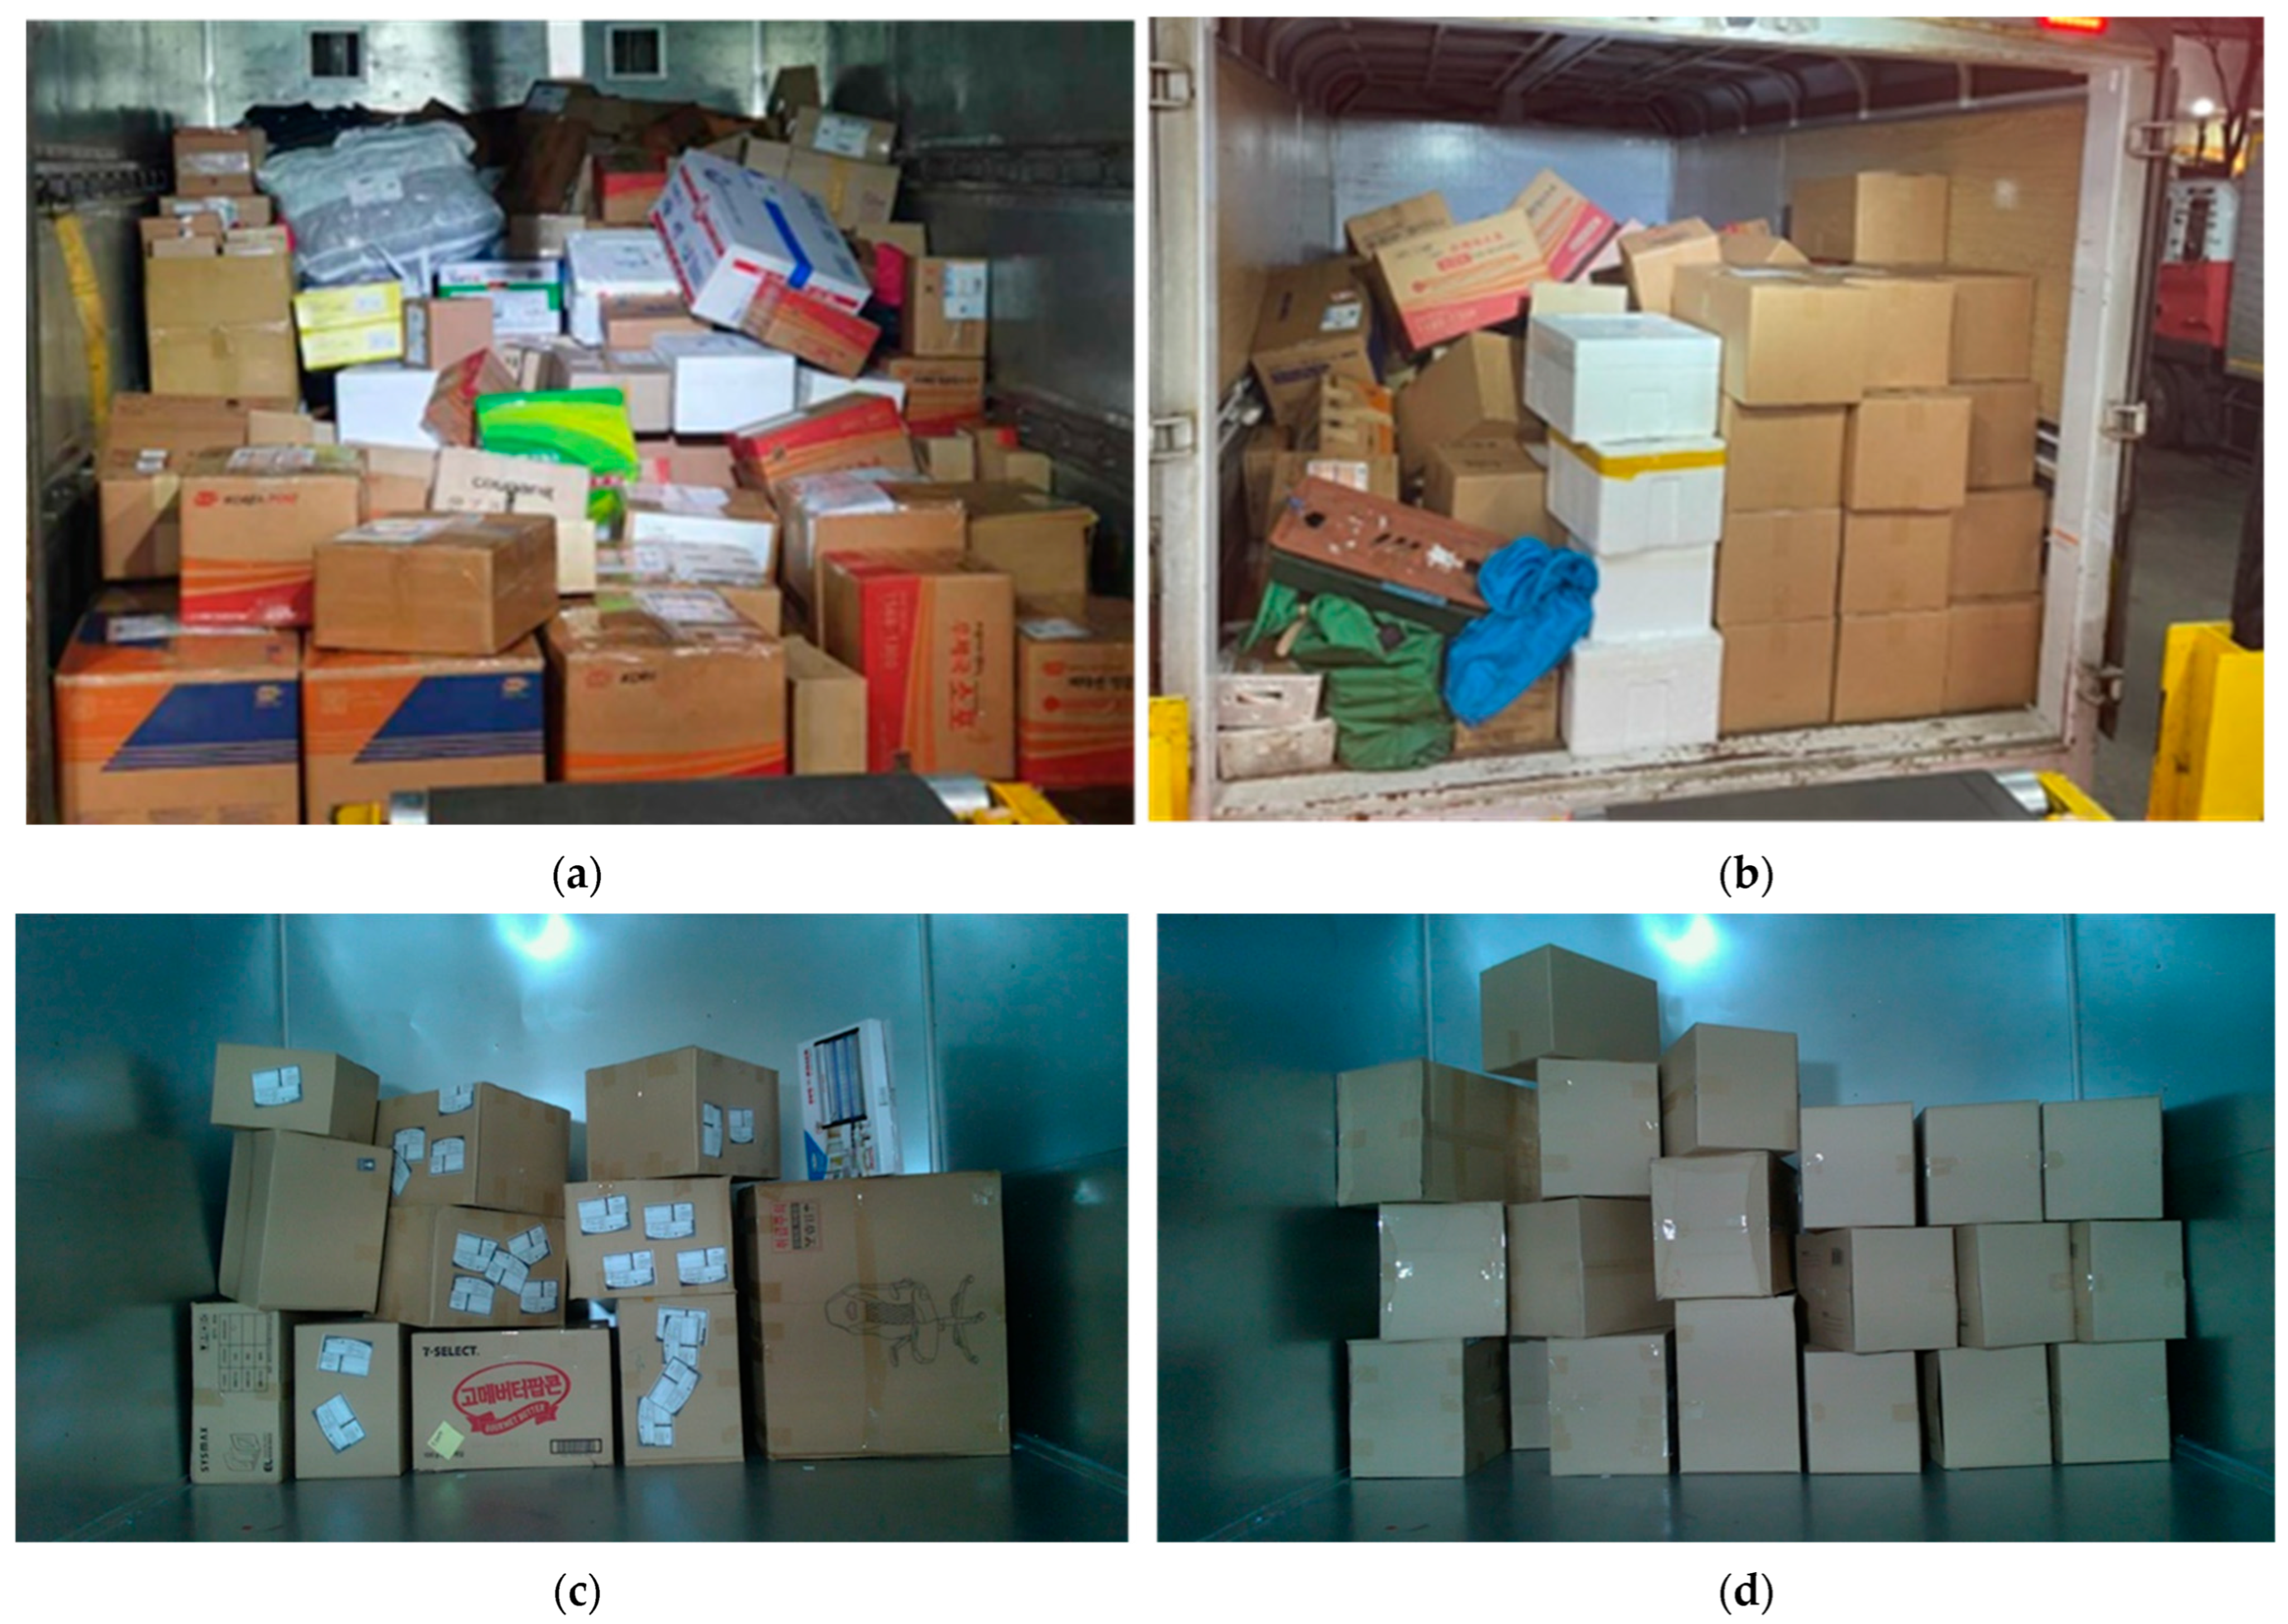
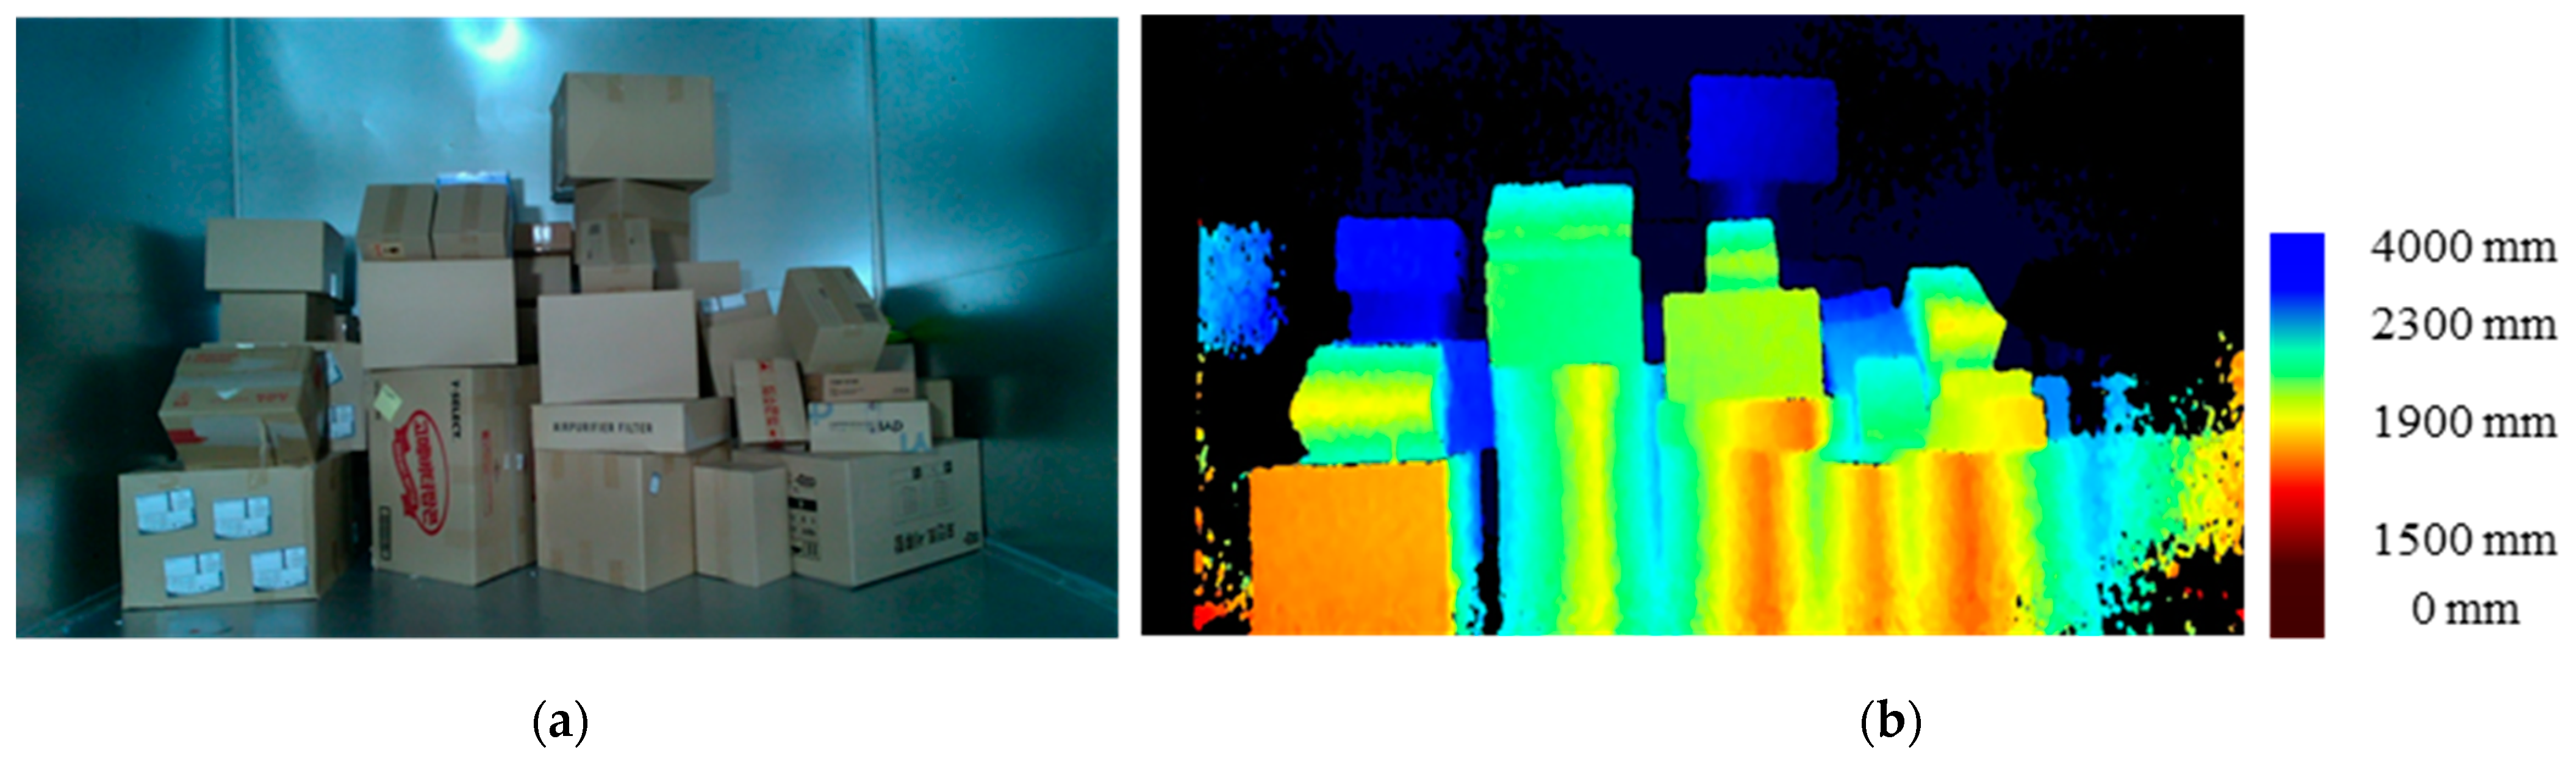
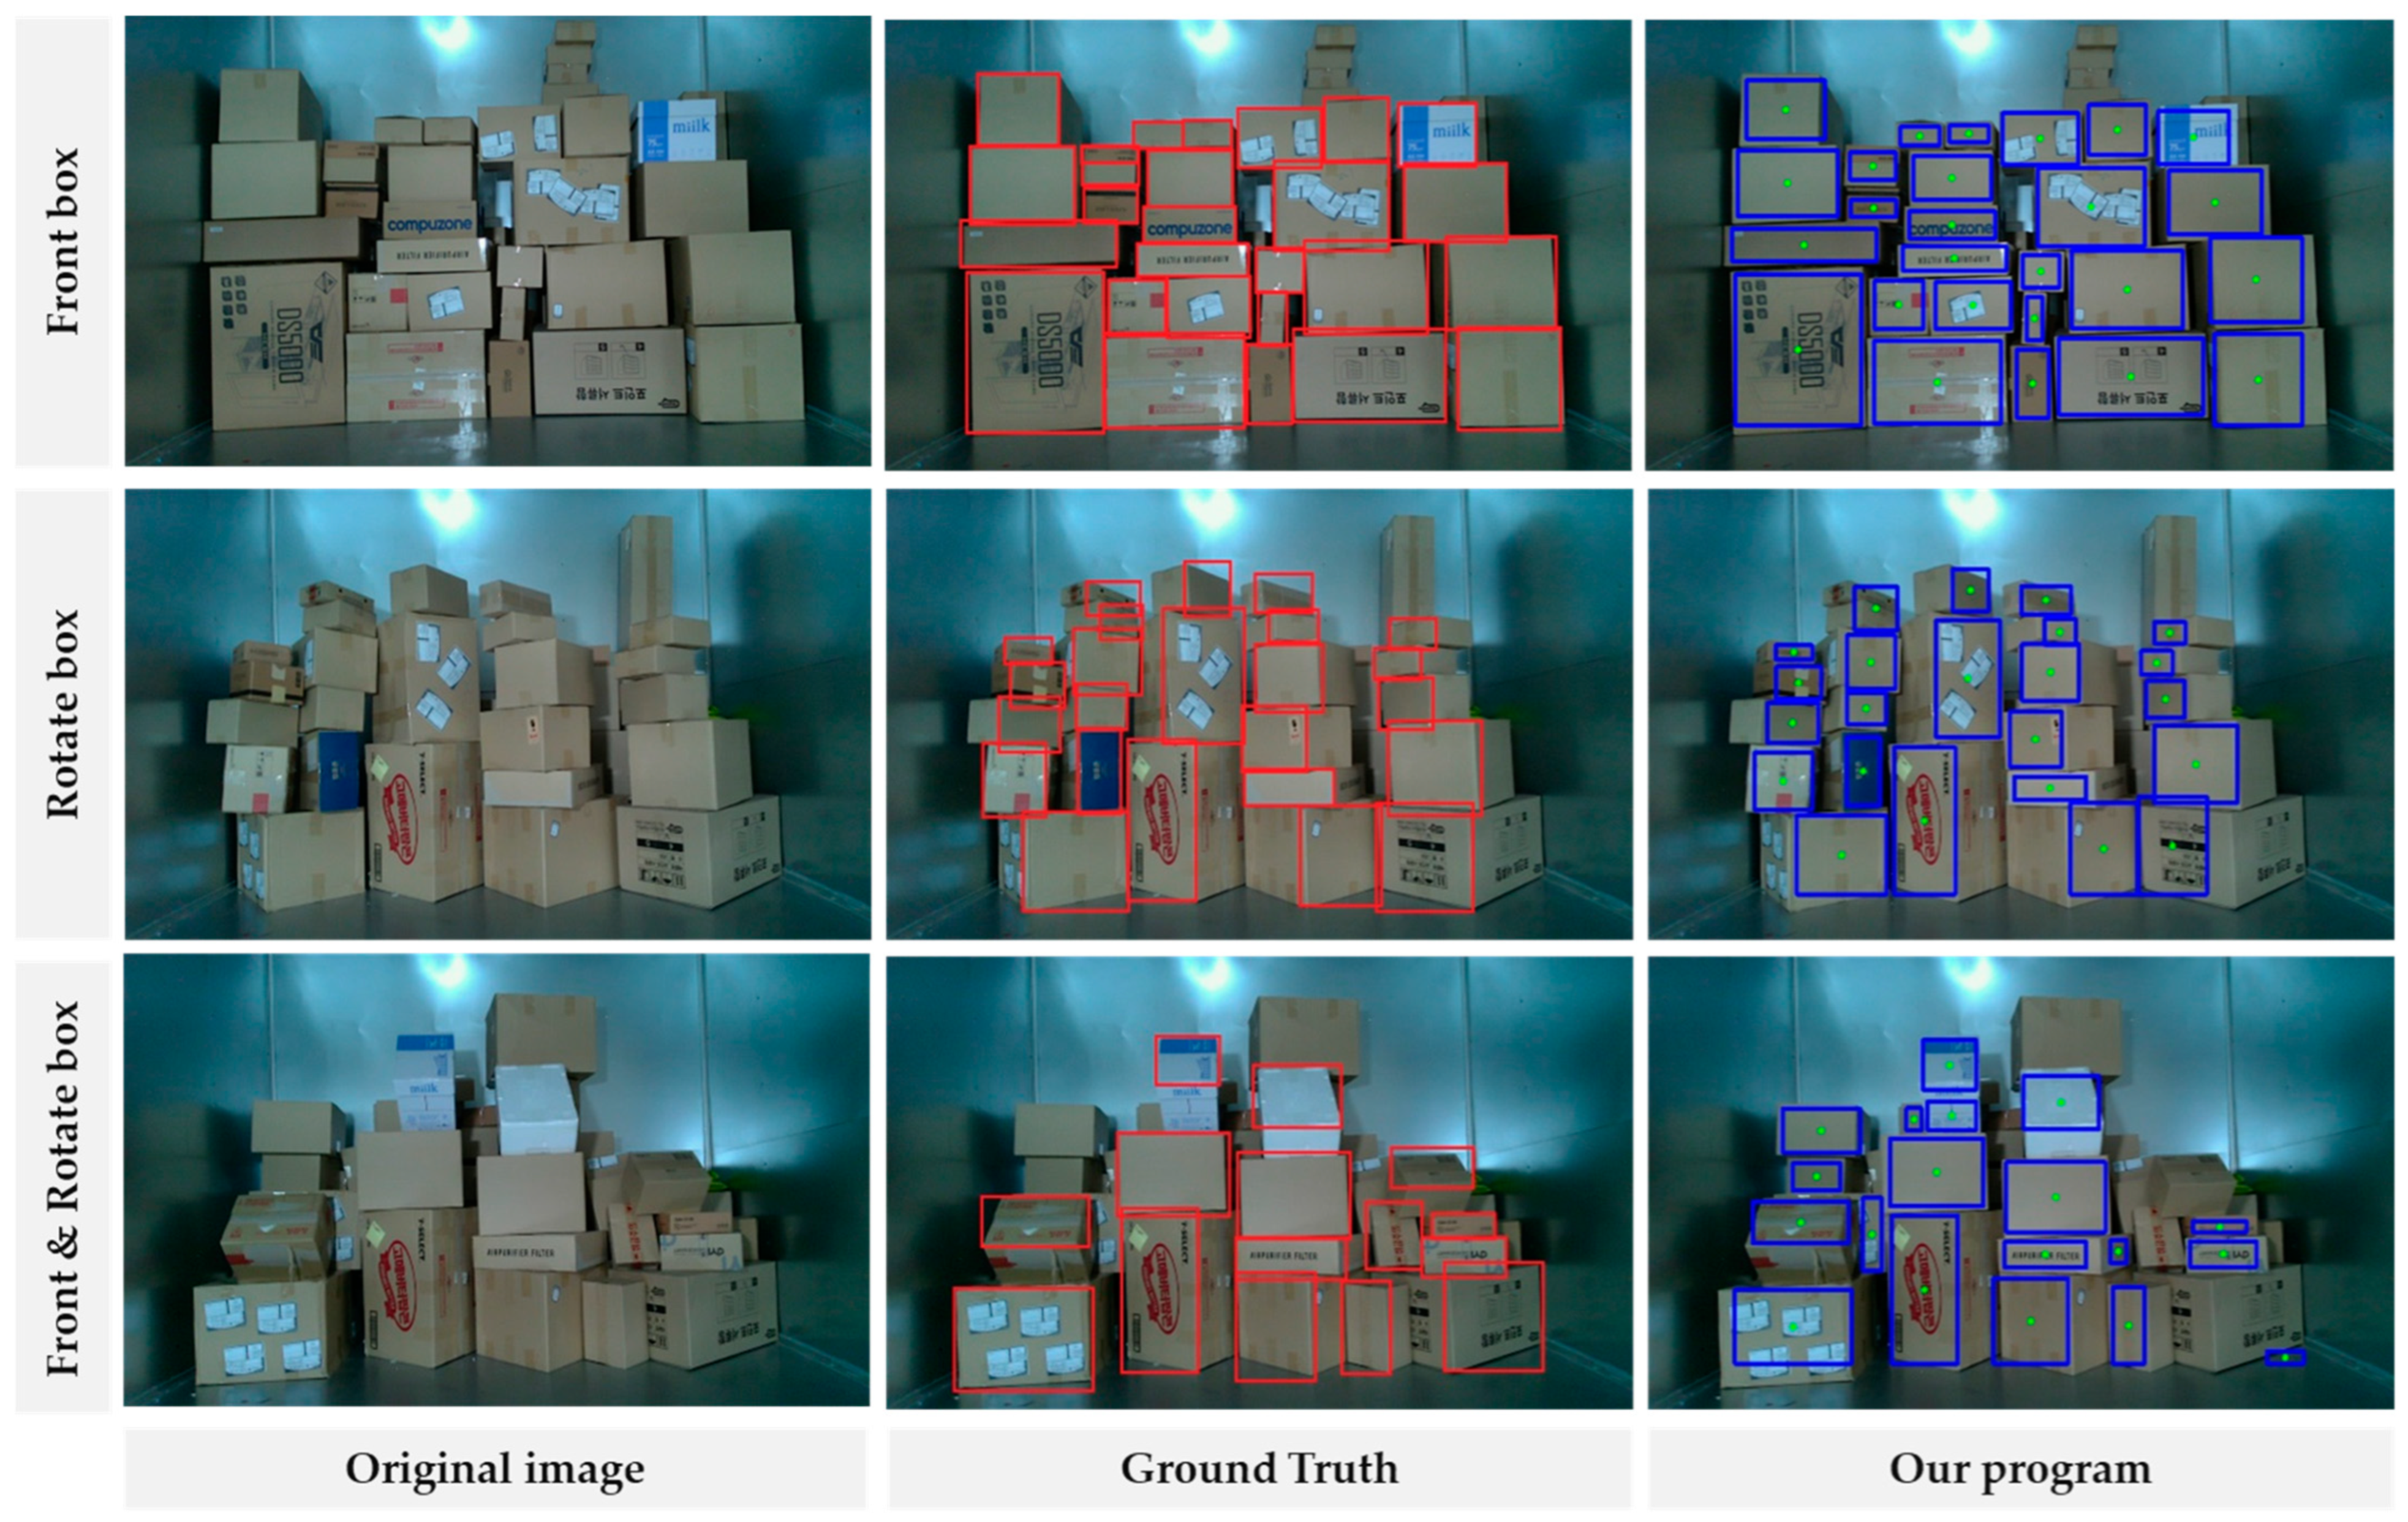
2.3. Parcel Arrangement Environment for Actual Experiments
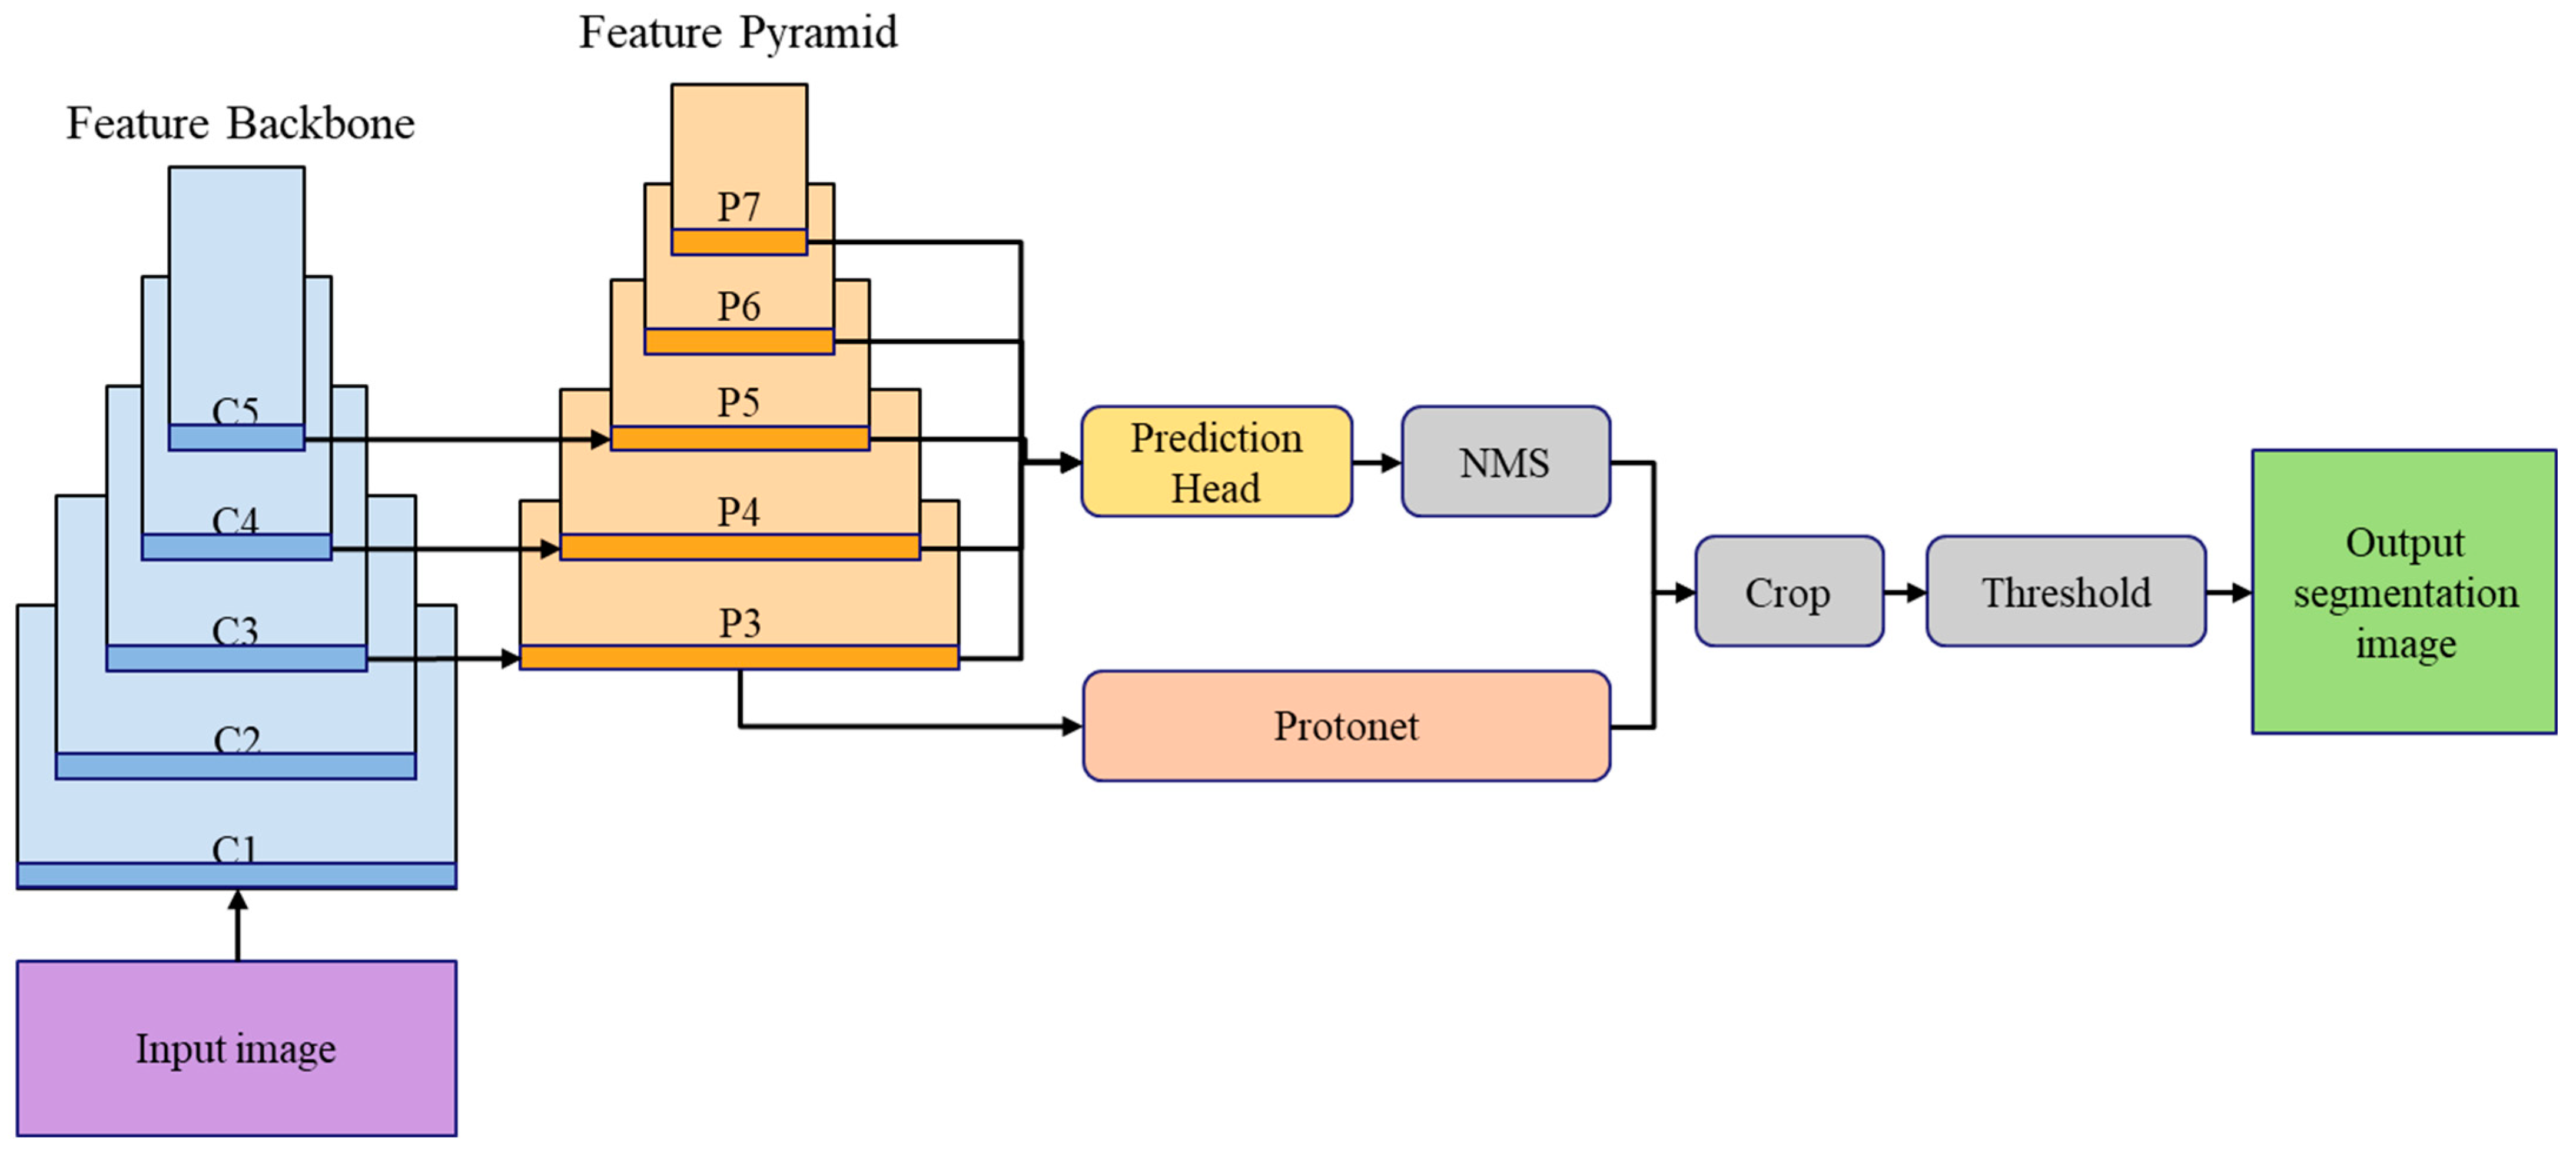
3. Detection Method for Complex Array of Parcels in Delivery Truck
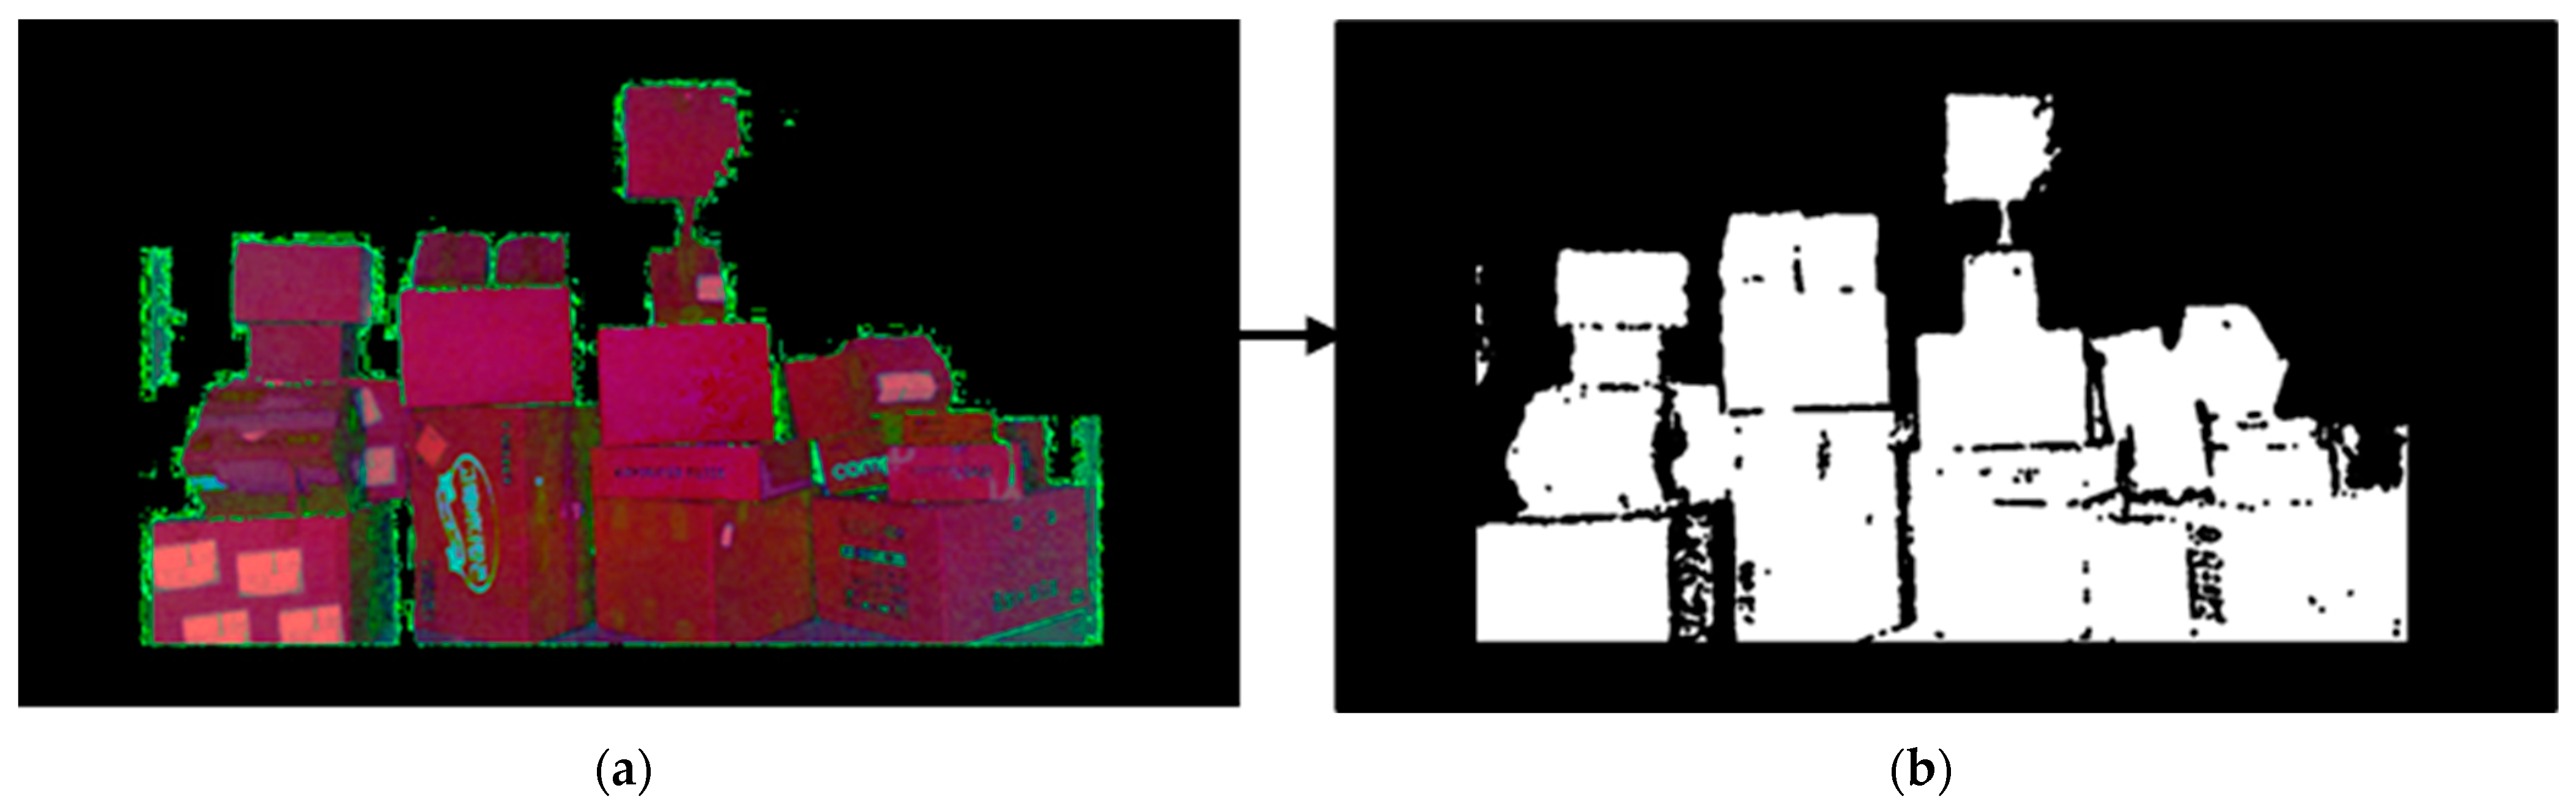
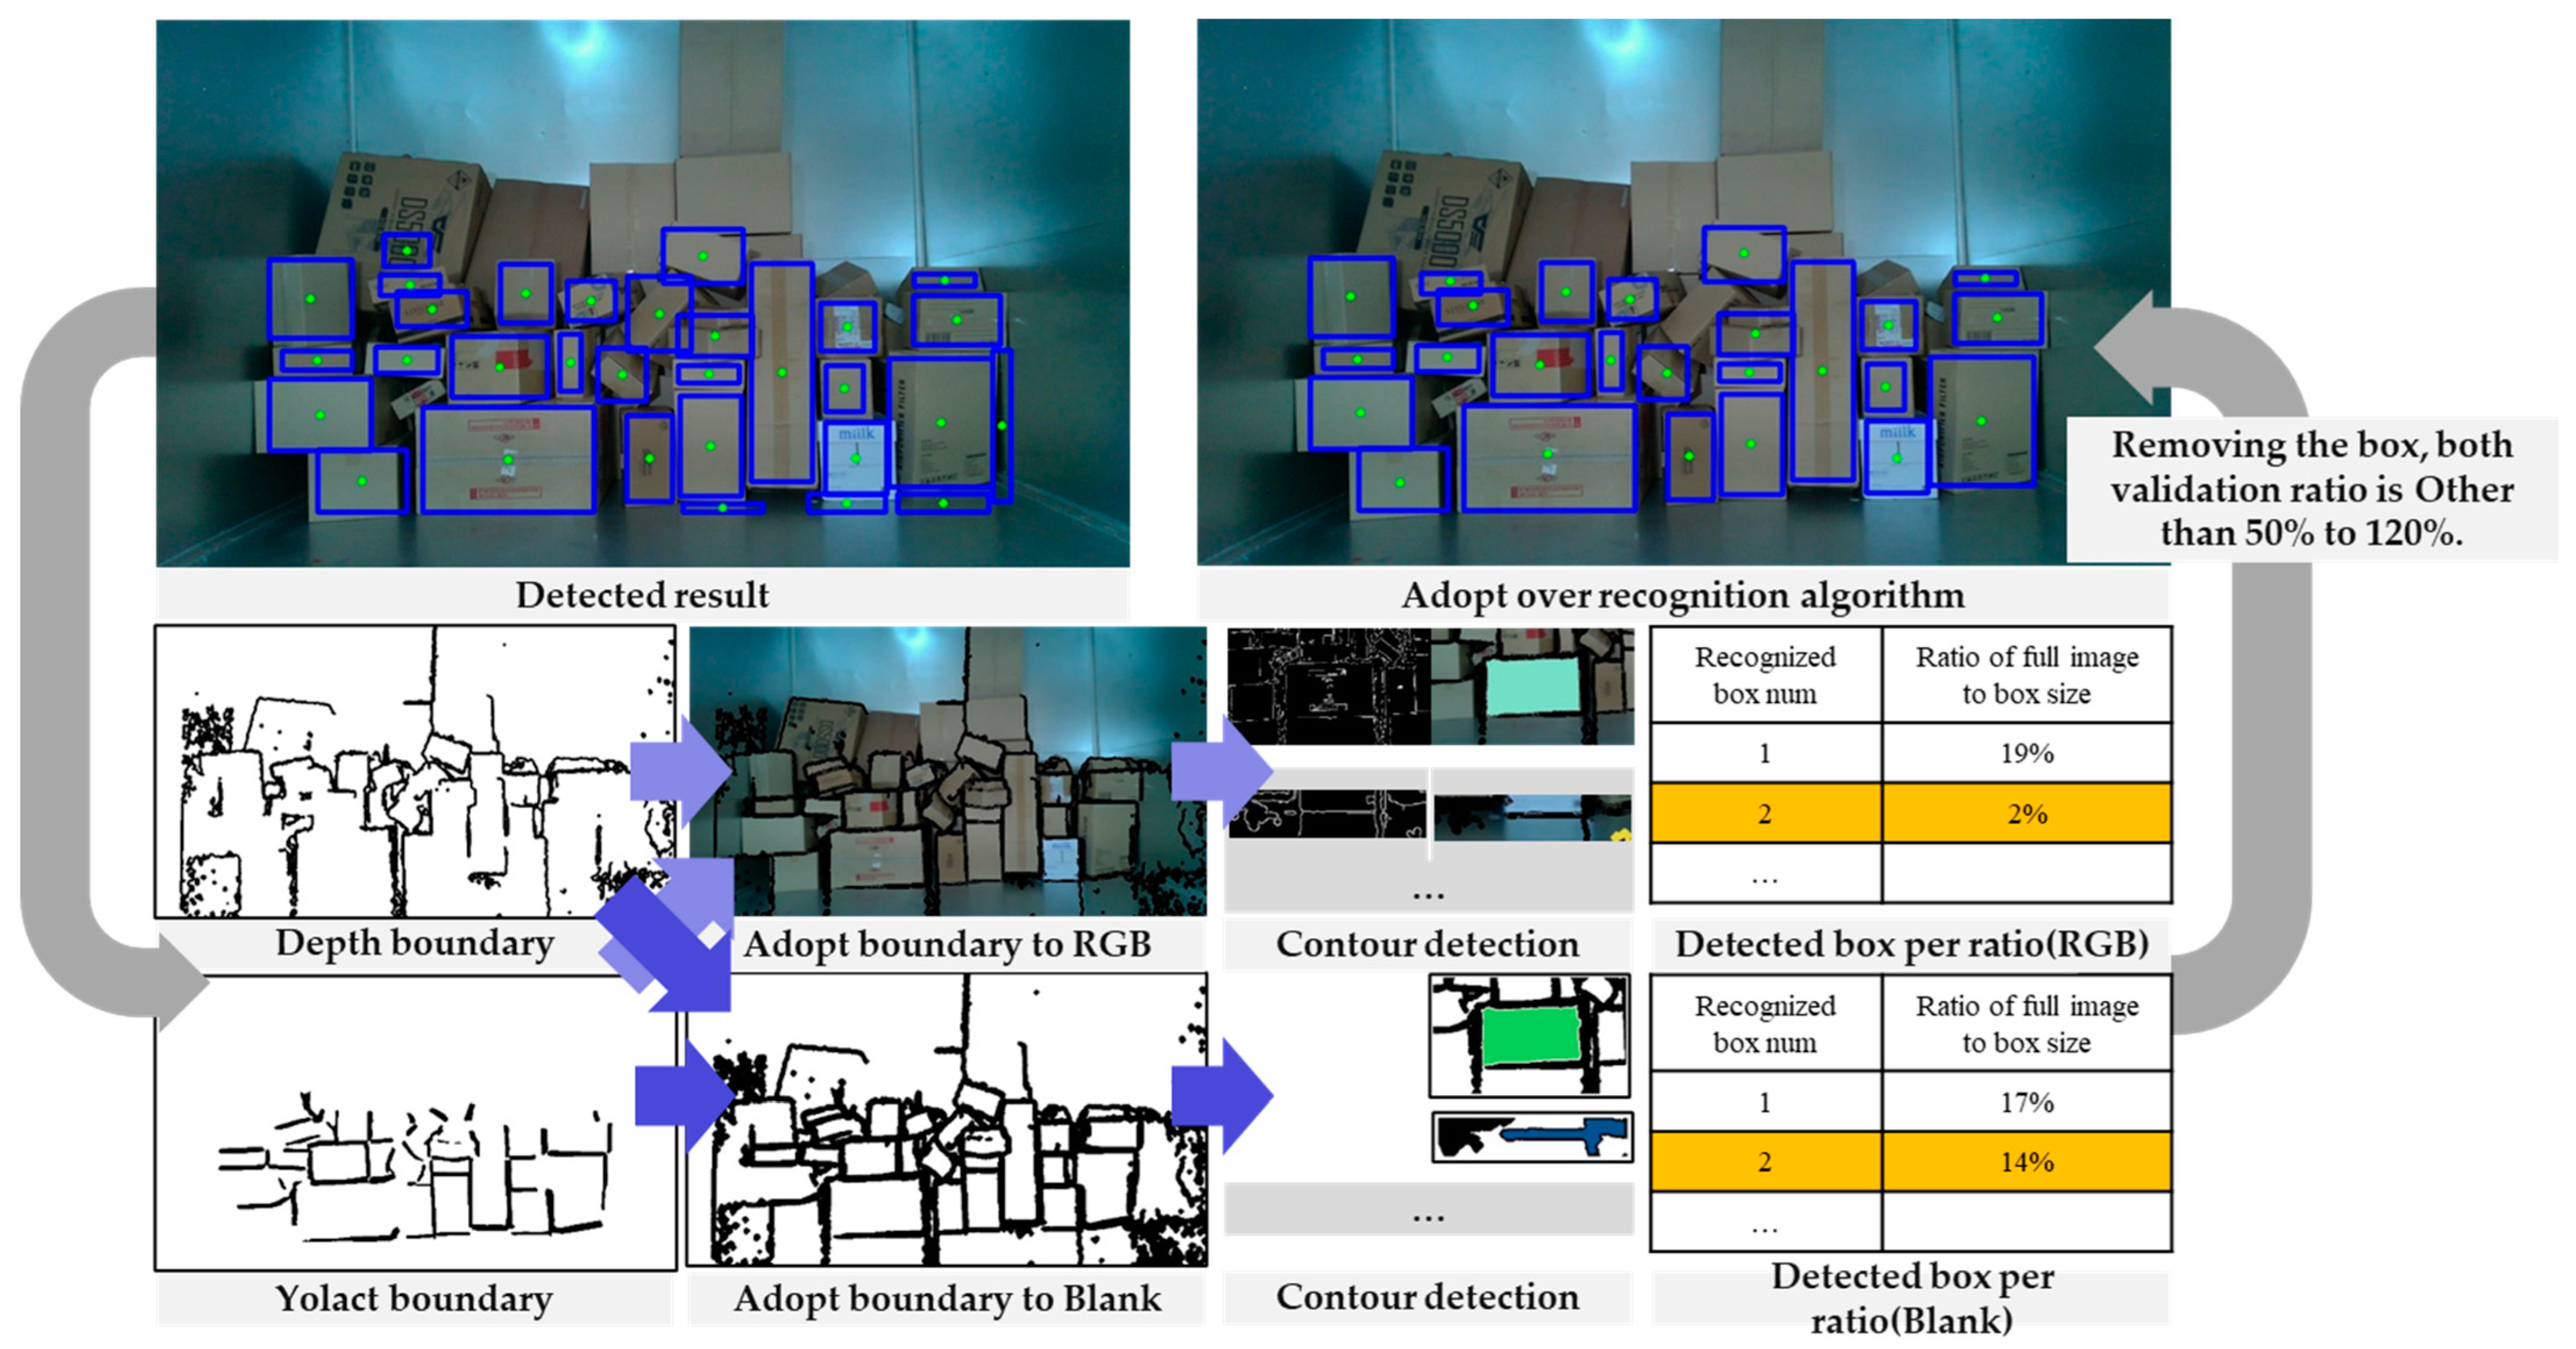
3.1. Three Parcel Boundary Detection Methods for Boundary Integration
3.2. Parcel Detection for Boundary Contour Detection
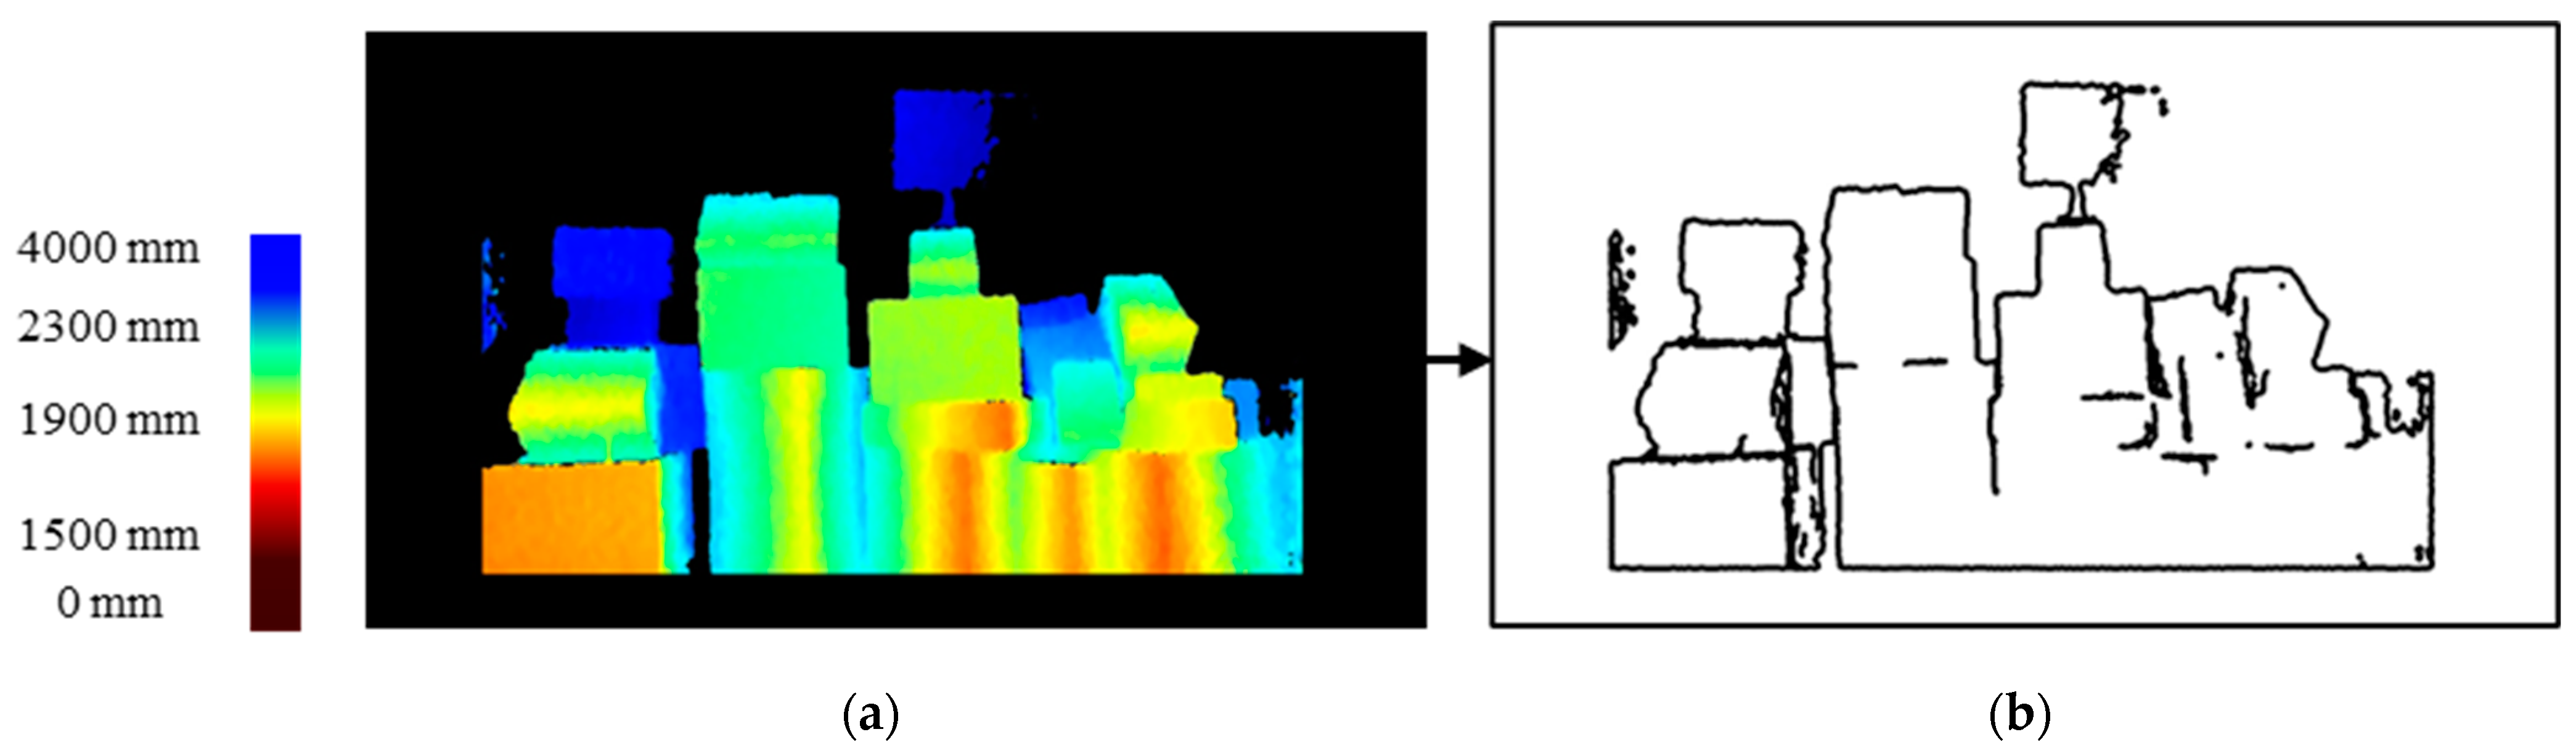
3.3. Segmentation of the Wide Side of the Detected Parcel Using Depth
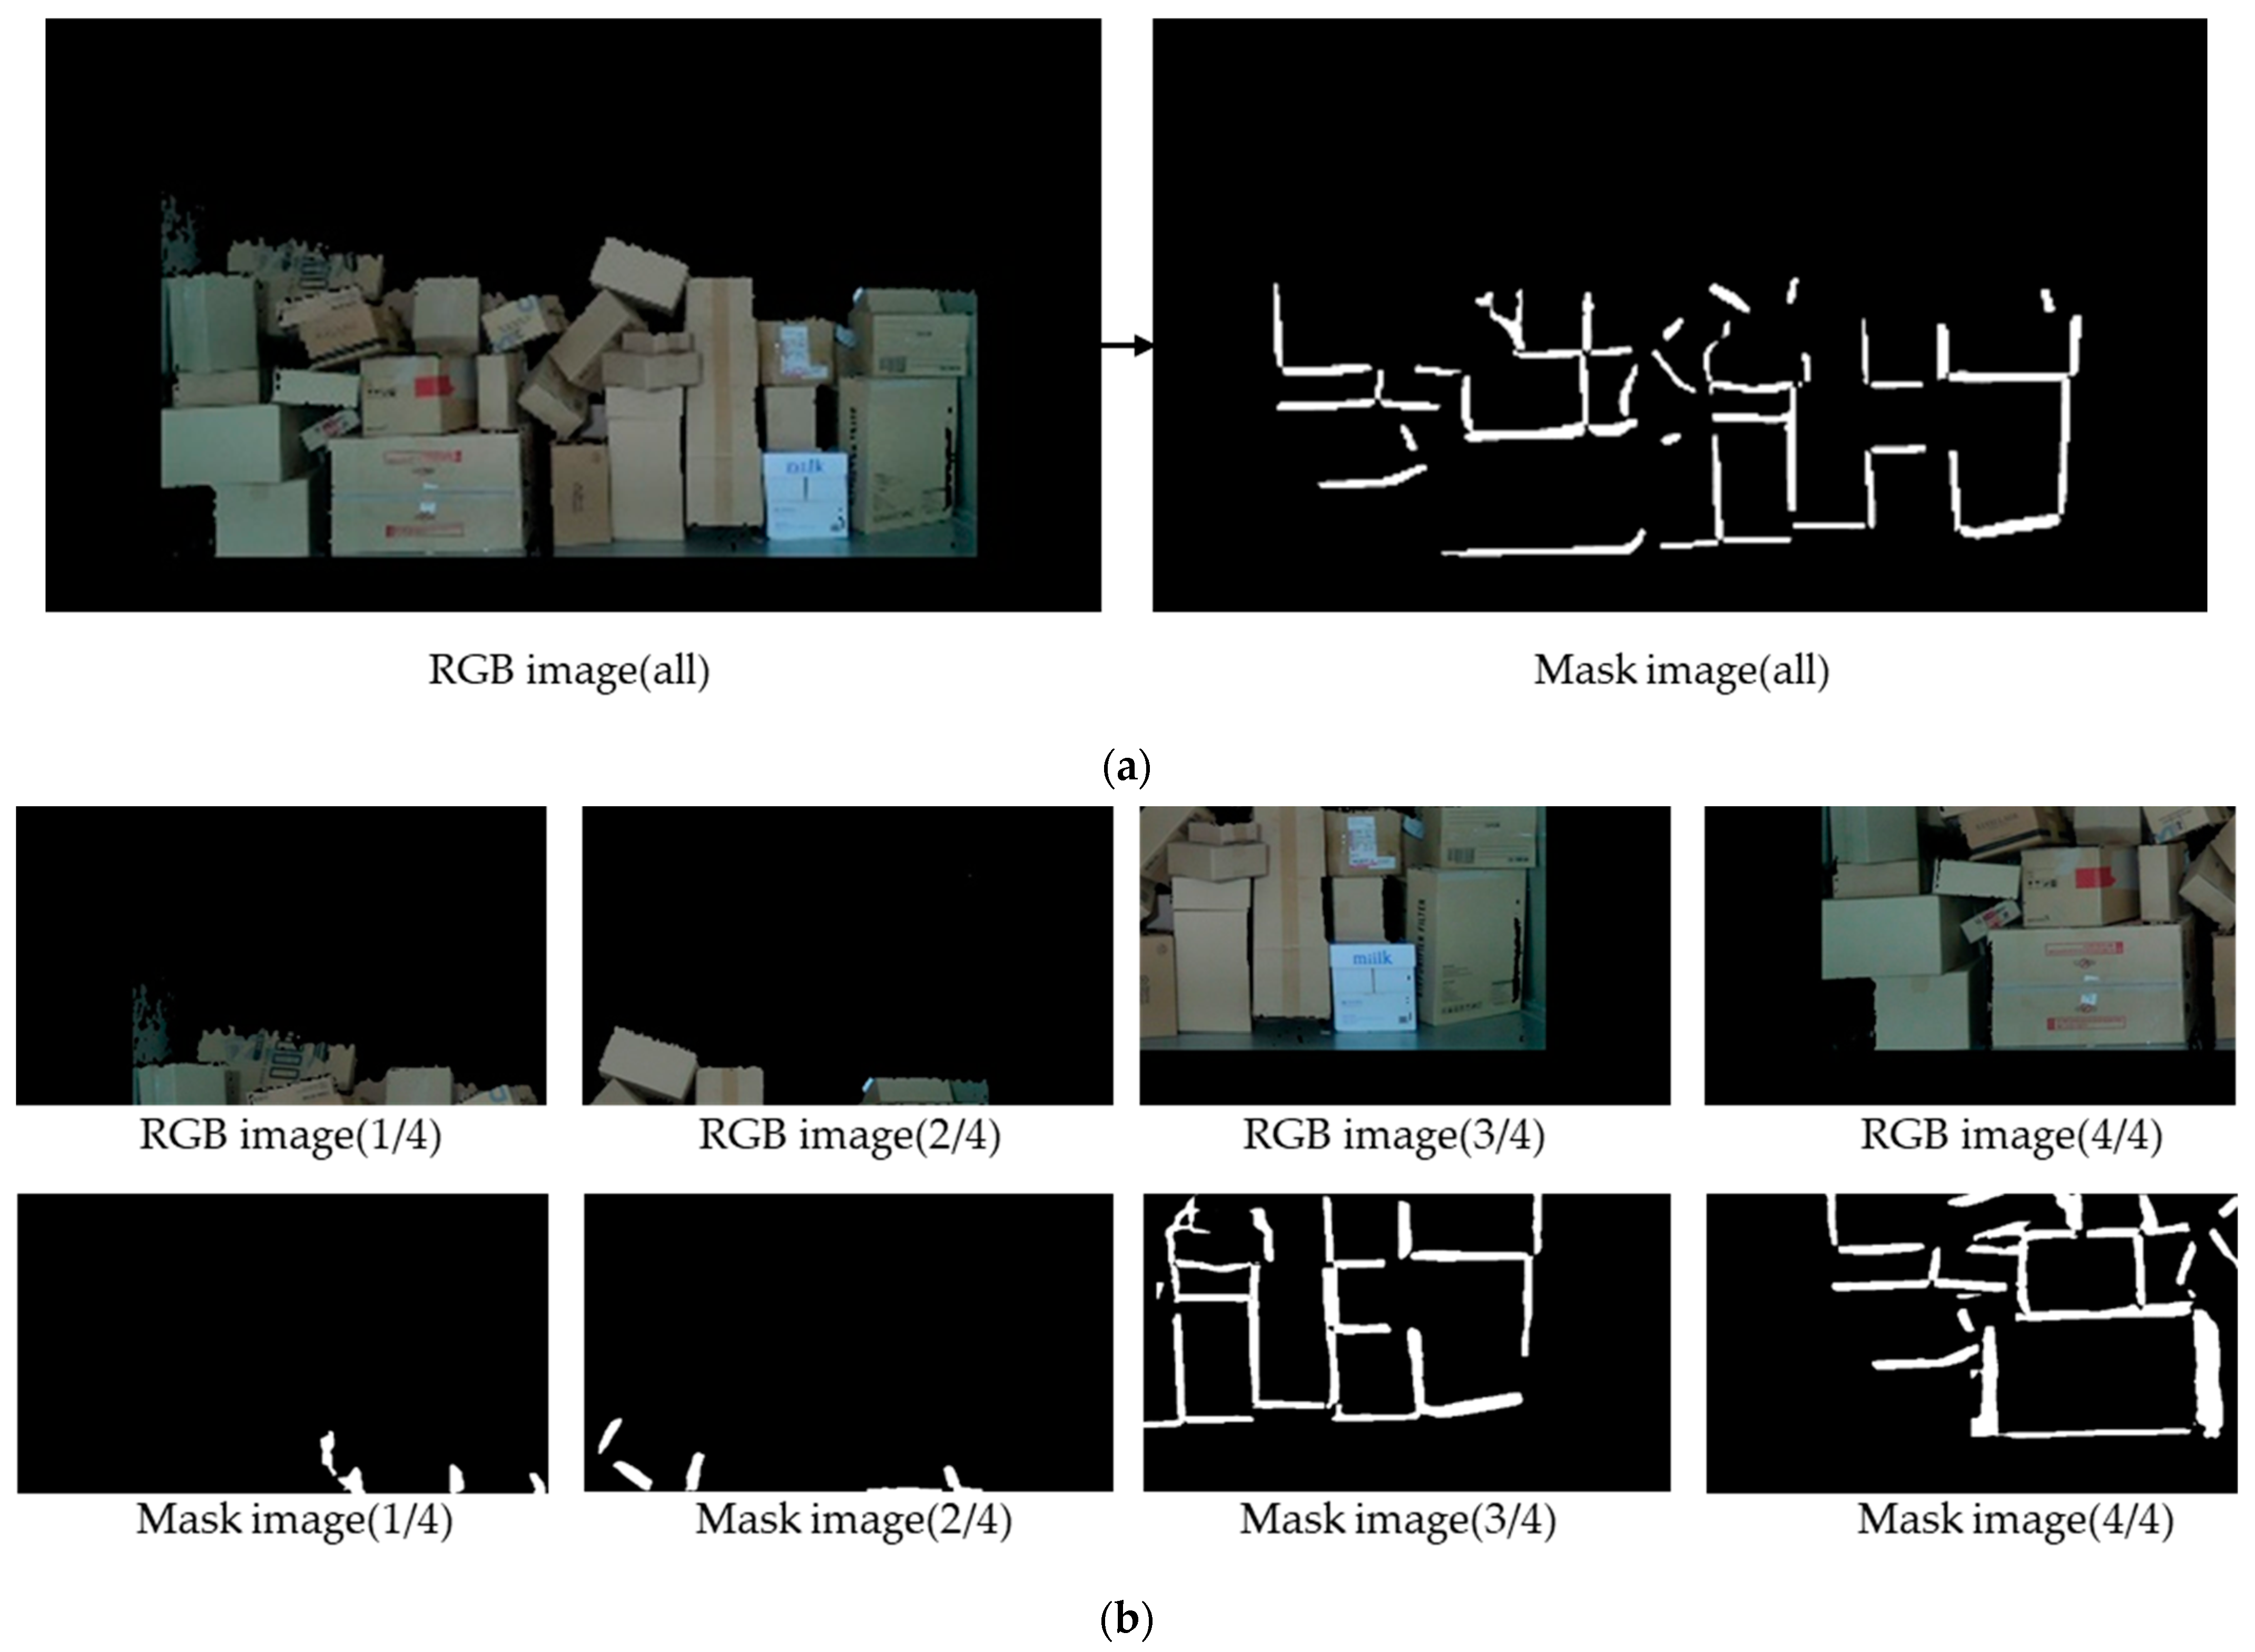
3.4. Effective Noise Removing for Suppressing Over-Detection Using Area Calculation
4. Mean Average Precision Validation for Picking Point
5. Discussion
6. Conclusions
Author Contributions
Funding
Institutional Review Board Statement
Informed Consent Statement
Data Availability Statement
Conflicts of Interest
References
- Mendoza-Calderón, K.D.; Jaimes, J.A.M.; Maradey-Lazaro, J.G.; Rincón-Quintero, A.D.; Cardenas-Arias, C.G. Design of an automatic palletizer. J. Phys. Conf. Ser. 2022, 2224, 012095. [Google Scholar] [CrossRef]
- Echelmeyer, W.; Kirchheim, A.; Wellbrock, E. Robotics-logistics: Challenges for automation of logistic processes. In Proceedings of the 2008 IEEE International Conference on Automation and Logistics, Qingdao, China, 1–3 September 2008; pp. 2099–2103. [Google Scholar] [CrossRef]
- Katsoulas, D.K.; Kosmopoulos, D.I. An efficient depalletizing system based on 2D range imagery. In Proceedings of the 2001 ICRA. IEEE International Conference on Robotics and Automation (Cat. No. 01CH37164), Seoul, Republic of Korea, 21–26 May 2001; pp. 305–312. [Google Scholar] [CrossRef]
- Zaccaria, F.; Baldassarri, A.; Palli, G.; Carricato, M. A mobile robotized system for depalletizing applications: Design and experimentation. IEEE Access 2021, 9, 96682–96691. [Google Scholar] [CrossRef]
- Canny, J. A computational approach to edge detection. IEEE Trans. Pattern Anal. Mach. Intell. 1986, 6, 679–698. [Google Scholar] [CrossRef]
- Xie, G.; Lu, W. Image edge detection based on opencv. Int. J. Electron. Electr. Eng. 2013, 1, 104–106. Available online: https://www.ijeee.net/uploadfile/2013/0702/20130702104409134.pdf (accessed on 2 June 2013). [CrossRef]
- Arbelaez, P.; Maire, M.; Fowlkes, C.; Malik, J. Contour detection and hierarchical image segmentation. IEEE Trans. Pattern Anal. Mach. Intell. 2010, 33, 898–916. [Google Scholar] [CrossRef]
- Zhao, Z.-Q.; Zheng, P.; Xu, S.-T.; Wu, X. Object detection with deep learning: A review. IEEE Trans. Neural Netw. Learn. Syst. 2019, 30, 3212–3232. [Google Scholar] [CrossRef]
- Xu, Z.-F.; Jia, R.-S.; Sun, H.-M.; Liu, Q.-M.; Cui, Z. Light-YOLOv3: Fast method for detecting green mangoes in complex scenes using picking robots. Appl. Intell. 2020, 50, 4670–4687. [Google Scholar] [CrossRef]
- Syed-Ab-Rahman, S.F.; Hesamian, M.H.; Prasad, M. Citrus disease detection and classification using end-to-end anchor-based deep learning model. Appl. Intell. 2021, 52, 927–938. [Google Scholar] [CrossRef]
- Zhang, J.; Chen, J.; Chen, S.; Wang, Z.; Zhang, J. Detection and segmentation of unlearned objects in unknown environment. IEEE Trans. Ind. Inform. 2020, 17, 6211–6220. [Google Scholar] [CrossRef]
- Park, J.; Jun, M.B.; Yun, H. Development of robotic bin picking platform with cluttered objects using human guidance and convolutional neural network (CNN). J. Manuf. Syst. 2022, 63, 539–549. [Google Scholar] [CrossRef]
- Monica, R.; Aleotti, J.; Rizzini, D.L. Detection of parcel boxes for pallet unloading using a 3D time-of-flight industrial sensor. In Proceedings of the 2020 Fourth IEEE International Conference on Robotic Computing (IRC), Taichung, Taiwan, 9–11 November 2020; pp. 314–318. [Google Scholar] [CrossRef]
- Chiaravalli, D.; Palli, G.; Monica, R.; Aleotti, J.; Rizzini, D.L. Integration of a multi-camera vision system and admittance control for robotic industrial depalletizing. In Proceedings of the 2020 25th IEEE International Conference on Emerging Technologies and Factory Automation (ETFA), Vienna, Austria, 8–11 September 2020; pp. 667–674. [Google Scholar] [CrossRef]
- Yunardi, R.T.; Winarno; Pujiyanto. Contour-based object detection in Automatic Sorting System for a parcel boxes. In Proceedings of the 2015 International Conference on Advanced Mechatronics, Intelligent Manufacture, and Industrial Automation (ICAMIMIA), Surabaya, Indonesia, 15–17 October 2015; pp. 38–41. [Google Scholar] [CrossRef]
- Ladplee, N.; Pimpin, A.; Srituravanich, W.; Damrongplasit, N. Volumetric Measurement of Rectangular Parcel Box Using LiDAR Depth Camera for Dimensioning and 3D Bin Packing Applications. In Proceedings of the 2022 IEEE International Conference on Consumer Electronics-Asia (ICCE-Asia), Yeosu, Republic of Korea, 26–28 October 2022; pp. 1–4. [Google Scholar] [CrossRef]
- Redmon, J.; Divvala, S.; Girshick, R.; Farhadi, A. You only look once: Unified, real-time object detection. In Proceedings of the IEEE Conference on Computer Vision and Pattern Recognition, Las Vegas, NV, USA, 27–30 June 2016; pp. 779–788. [Google Scholar] [CrossRef]
- He, K.; Gkioxari, G.; Dollár, P.; Girshick, R. Mask r-cnn. In Proceedings of the IEEE International Conference on Computer Vision, Venice, Italy, 22–29 October 2017; pp. 2961–2969. [Google Scholar] [CrossRef]
- Zhao, K.; Wang, Y.; Zhu, Q.; Zuo, Y. Intelligent Detection of Parcels Based on Improved Faster R-CNN. Appl. Sci. 2022, 12, 7158. [Google Scholar] [CrossRef]
- Dorr, L.; Brandt, F.; Pouls, M.; Naumann, A. Fully-automated packaging structure recognition in logistics environments. In Proceedings of the 2020 25th IEEE International Conference on Emerging Technologies and Factory Automation (ETFA), Vienna, Austria, 8–11 September 2020; pp. 526–533. [Google Scholar] [CrossRef]
- Hwang, S.; Park, J.; Won, J.; Kwon, Y.; Kim, Y. Object Detection for Cargo Unloading System Based on Fuzzy C Means. Comput. Mater. Contin. 2022, 71, 4167–4181. [Google Scholar] [CrossRef]
- Kim, M.; Kim, Y. Parcel Classification and Positioning of Intelligent Parcel Storage System Based on YOLOv5. Appl. Sci. 2022, 13, 437. [Google Scholar] [CrossRef]
- Kim, M.; Kwon, Y.; Kim, J.; Kim, Y. Image classification of parcel boxes under the underground logistics system using CNN MobileNet. Appl. Sci. 2022, 12, 3337. [Google Scholar] [CrossRef]
- Caccavale, R.; Arpenti, P.; Paduano, G.; Fontanellli, A.; Lippiello, V.; Villani, L.; Siciliano, B. A flexible robotic depalletizing system for supermarket logistics. IEEE Robot. Autom. Lett. 2020, 5, 4471–4476. [Google Scholar] [CrossRef]
- Buongiorno, D.; Caramia, D.; Di Ruscio, L.; Longo, N.; Panicucci, S.; Di Stefano, G.; Bevilacqua, V.; Brunetti, A. Object Detection for Industrial Applications: Training Strategies for AI-Based Depalletizer. Appl. Sci. 2022, 12, 11581. [Google Scholar] [CrossRef]
- Han, S.; Liu, X.; Han, X.; Wang, G.; Wu, S. Visual sorting of express parcels based on multi-task deep learning. Sensors 2020, 20, 6785. [Google Scholar] [CrossRef]
- Nguyen, T.P.; Kim, S.; Kim, H.-G.; Han, J.; Yoon, J. detection under noise effect of tags and complex arrangement of pile with Cycle-GAN and Mask-RCNN. In Proceedings of the 2022 IEEE Eighth International Conference on Big Data Computing Service and Applications (BigDataService), Newark, CA, USA, 15–18 August 2022; pp. 22–26. [Google Scholar] [CrossRef]
- Yoon, J.; Han, J.; Nguyen, T.P. Logistics box recognition in robotic industrial de-palletising procedure with systematic RGB-D image processing supported by multiple deep learning methods. Eng. Appl. Artif. Intell. 2023, 123, 106311. [Google Scholar] [CrossRef]
- Fontana, E.; Zarotti, W.; Rizzini, D.L. A comparative assessment of parcel box detection algorithms for industrial applications. In Proceedings of the 2021 European Conference on Mobile Robots (ECMR), Bonn, Germany, 31 August–3 September 2021; pp. 1–6. [Google Scholar] [CrossRef]
- Arpenti, P.; Caccavale, R.; Paduano, G.; Fontanelli, G.A.; Lippiello, V.; Villani, L.; Siciliano, B. RGB-D recognition and localization of cases for robotic depalletizing in supermarkets. IEEE Robot. Autom. Lett. 2020, 5, 6233–6238. [Google Scholar] [CrossRef]
- Bolya, D.; Zhou, C.; Xiao, F.; Lee, Y.J. YOLACT++ Better Real-Time Instance Segmentation. IEEE Trans. Pattern Anal. Mach. Intell. 2019, 44, 1108–1121. [Google Scholar] [CrossRef]
- Hua, M.; Nan, Y.; Lian, S. Small obstacle avoidance based on RGB-D semantic segmentation. In Proceedings of the IEEE/CVF International Conference on Computer Vision Workshops, Seoul, Republic of Korea, 27 October–2 November 2019. [Google Scholar] [CrossRef]
- Bradski, G. The openCV library. Dr. Dobb’s J. Softw. Tools Prof. Program. 2000, 25, 120–123. [Google Scholar]
- Torralba, A.; Russell, B.C.; Yuen, J. Labelme: Online image annotation and applications. Proc. IEEE 2010, 98, 1467–1484. [Google Scholar] [CrossRef]
- Sokolova, M.; Lapalme, G. A systematic analysis of performance measures for classification tasks. Inf. Process. Manag. 2009, 45, 427–437. [Google Scholar] [CrossRef]
- Rezatofighi, H.; Tsoi, N.; Gwak, J.; Sadeghian, A.; Reid, I.; Savarese, S. Generalized intersection over union: A metric and a loss for bounding box regression. In Proceedings of the IEEE/CVF Conference on Computer Vision and Pattern Recognition, Long Beach, CA, USA, 15–20 June 2019; pp. 658–666. [Google Scholar]


| Information | Model | Resolution (RGB) | Resolution (Depth) | FPS |
|---|---|---|---|---|
| Camera | Intel L515 (RGB-D) | 1920 × 1080 | 1024 × 768 | 30 |
| Box Arrangement | Image Number | Parcel Number | Precision (%) | Recall (%) | mAP (0.5) % | FPS |
|---|---|---|---|---|---|---|
| Front box | 50 | 1043 | 96.26 | 96.6 | 93.82 | 1.42 |
| Rotated box | 25 | 584 | 90.2 | 96.23 | 87.2 | 1.43 |
| Front and rotated box | 50 | 1082 | 92.3 | 95.2 | 90.85 | 1.41 |
Disclaimer/Publisher’s Note: The statements, opinions and data contained in all publications are solely those of the individual author(s) and contributor(s) and not of MDPI and/or the editor(s). MDPI and/or the editor(s) disclaim responsibility for any injury to people or property resulting from any ideas, methods, instructions or products referred to in the content. |
© 2024 by the authors. Licensee MDPI, Basel, Switzerland. This article is an open access article distributed under the terms and conditions of the Creative Commons Attribution (CC BY) license (https://creativecommons.org/licenses/by/4.0/).
Share and Cite
Kim, S.; Truong, V.-D.; Lee, K.-H.; Yoon, J. Revolutionizing Robotic Depalletizing: AI-Enhanced Parcel Detecting with Adaptive 3D Machine Vision and RGB-D Imaging for Automated Unloading. Sensors 2024, 24, 1473. https://doi.org/10.3390/s24051473
Kim S, Truong V-D, Lee K-H, Yoon J. Revolutionizing Robotic Depalletizing: AI-Enhanced Parcel Detecting with Adaptive 3D Machine Vision and RGB-D Imaging for Automated Unloading. Sensors. 2024; 24(5):1473. https://doi.org/10.3390/s24051473
Chicago/Turabian StyleKim, Seongje, Van-Doi Truong, Kwang-Hee Lee, and Jonghun Yoon. 2024. "Revolutionizing Robotic Depalletizing: AI-Enhanced Parcel Detecting with Adaptive 3D Machine Vision and RGB-D Imaging for Automated Unloading" Sensors 24, no. 5: 1473. https://doi.org/10.3390/s24051473
APA StyleKim, S., Truong, V.-D., Lee, K.-H., & Yoon, J. (2024). Revolutionizing Robotic Depalletizing: AI-Enhanced Parcel Detecting with Adaptive 3D Machine Vision and RGB-D Imaging for Automated Unloading. Sensors, 24(5), 1473. https://doi.org/10.3390/s24051473