1. Introduction
The transportation industry has experienced significant advancements, resulting in a substantial increase in vehicle proliferation. While these advancements have certainly made life more convenient, they have also resulted in more crashes. As per the latest report from the World Health Organization (WHO) [
1], crashes yield an estimated 20 to 50 million minor to moderate injuries and approximately 1.3 million fatalities each year. Additionally, several countries dedicate around 3% of their Gross Domestic Product to addressing the economic impact of crashes. Risky driving behaviors, including but not limited to cellphone use while driving, non-compliance with seat belt usage, speeding, drunk driving, distracted driving, and drowsy driving, have been identified as primary catalysts for these traffic incidents. The effective identification and penalization of such risky driving practices can contribute significantly to a reduction in the occurrence of crashes.
Risky driving behavior detection in traffic surveillance scenarios refers to the capture of drivers by electronic police devices on the roadway, followed by identifying dangerous and violating behaviors in the captured images. The significance of automatically detecting risky driving has garnered attention from several researchers in computer vision and artificial intelligence. Most existing studies utilize in-vehicle or dashboard cameras, capturing participants while they engage in specific distracted behaviors. These studies can be divided into image classification-based methods [
2,
3,
4,
5,
6] and object detection-based methods [
7,
8]. Image classification-based techniques map input images into predefined categories of risky driving behavior [
2,
3,
4,
5,
6]. In contrast, object detection-based techniques offer locational information about risky driving behavior through bounding boxes associated with specific body parts within the images [
7,
8]. Compared with the simulation scenario in the car, detecting risky driving in traffic surveillance scenarios is more challenging. This is due to varying data acquisition conditions in traffic surveillance scenes, such as complex illumination, extreme weather conditions, and diverse camera positions and angles. At present, various methods [
9,
10,
11,
12,
13,
14,
15,
16,
17,
18] have been developed to address specific challenges such as occlusion [
9,
10,
11], adverse weather [
15,
16,
17,
18], or insufficient illumination [
12,
13,
14] in traffic scenes. However, most of these methods are used for vehicle detection or autonomous driving, and only a few studies [
12,
13] have attempted to identify driver behavior. Moreover, both classification-based and detection-based methodologies heavily rely on abundant labeled data, with only a small fraction of research focusing on unsupervised learning for risky driving behavior classification tasks [
19,
20]. Notably, there is a lack of publicly reported semi-supervised or unsupervised learning approaches for object detection-based identification of risky driving behavior. Hence, it becomes imperative to explore and implement semi-supervised or unsupervised learning techniques in the domain of risky driving behavior detection.
Benchmark datasets serve a crucial role in advancing empirical progress within the realm of deep learning. Noteworthy benchmarks for risky driving detection include the State Farm dataset [
21], AUC Distracted Driver dataset [
22], FDUDrivers [
23], and Drive&Act [
24]. These existing datasets typically capture data related to the driver’s face, head, hands, or postures using in-vehicle cameras located at the front, back, side, or top of the vehicle. However, they significantly differ from data in traffic surveillance scenes in two key ways. Firstly, most of this data is simulated, requiring participants to perform specific actions. Secondly, images captured inside the vehicle generally have higher quality due to the closer shooting distance, fixed angles, and minimal impact from adverse weather and lighting conditions. Consequently, models trained on in-vehicle data may face challenges in effectively generalizing to road surveillance scenarios. Nonetheless, the development of such benchmarks remains limited, primarily due to considerations related to acquisition costs and privacy.
To rectify the scarcity of data associated with risky driving behaviors in traffic surveillance scenarios, this study proposes a novel benchmark known as Bayonet-Drivers. The foundational data for constructing Bayonet-Drivers is procured through an intelligent monitoring and recording system installed at road intersections. Data collection for Bayonet-Drivers covers various challenging conditions, including complex illumination, severe weather, and potential interference from car background information. Furthermore, due to the high prevalence of severe crashes attributed to disregarding seat belts and using phones while driving, the primary focus lies in detecting these specific types of risky driving behaviors. To our knowledge, this benchmark stands as the inaugural publicly available standard for the detection of risky driving behaviors within traffic surveillance settings. Therefore, Bayonet-Drivers can serve as a valuable tool for evaluating approaches geared towards the detection of risky driving behaviors within traffic surveillance contexts.
Additionally, to counter the issues resulting from an insufficient quantity of labeled data, DGMB-Net, a novel network architecture for the semi-supervised detection of risky driving behaviors, is proposed. The primary advantages of DGMB-Net can be broadly summarized into three aspects: (1) DGMB-Net incorporates an enhanced end-to-end teacher–student semi-supervised learning method, thereby reducing the burden associated with laborious and time-consuming data labeling. (2) The inclusion of an Adaptive Perceptual Learning(APL) Module enhances spatial perception and feature expression capabilities. This strategic integration ensures adequate capture of both local and global contexts within the network. (3) A Hierarchical Feature Pyramid Network(HFPN) is implemented, effectively amalgamating low-level and high-level features to generate comprehensive feature maps, thereby bolstering detection accuracy.
In conclusion, in order to address the limitations mentioned above, this study aims to provide the industry with a novel driver behavior benchmark and a high-precision, low-cost risky-driving-behavior detection method suitable for traffic monitoring scenarios. Due to the limited availability of traffic monitoring data in existing research, the adoption of fully supervised learning requires a large amount of cost. Hence, one of the innovations of this study is to provide a novel benchmark. This provides developers with data for monitoring scenarios, covering different challenging scenarios such as complex lighting, bad weather, etc., which helps them to conduct more in-depth research. The second innovation of this study is to provide a high-precision semi-supervised approach for risky-driving-behavior detection in traffic-monitoring scenarios. This approach not only reduces the cost of manual annotation during model training but also effectively addresses various challenging scenarios.
The structure of the remaining sections of this paper is organized as follows.
Section 2 presents related work.
Section 3 details the Bayonet-Drivers.
Section 4 introduces the proposed semi-supervised DGMB-Net for driver risky-driving detection.
Section 5 presents the analytical results, followed by the discussion in
Section 6.
Section 7 presents the conclusions and prospects.
3. Bayonet-Drivers Dataset
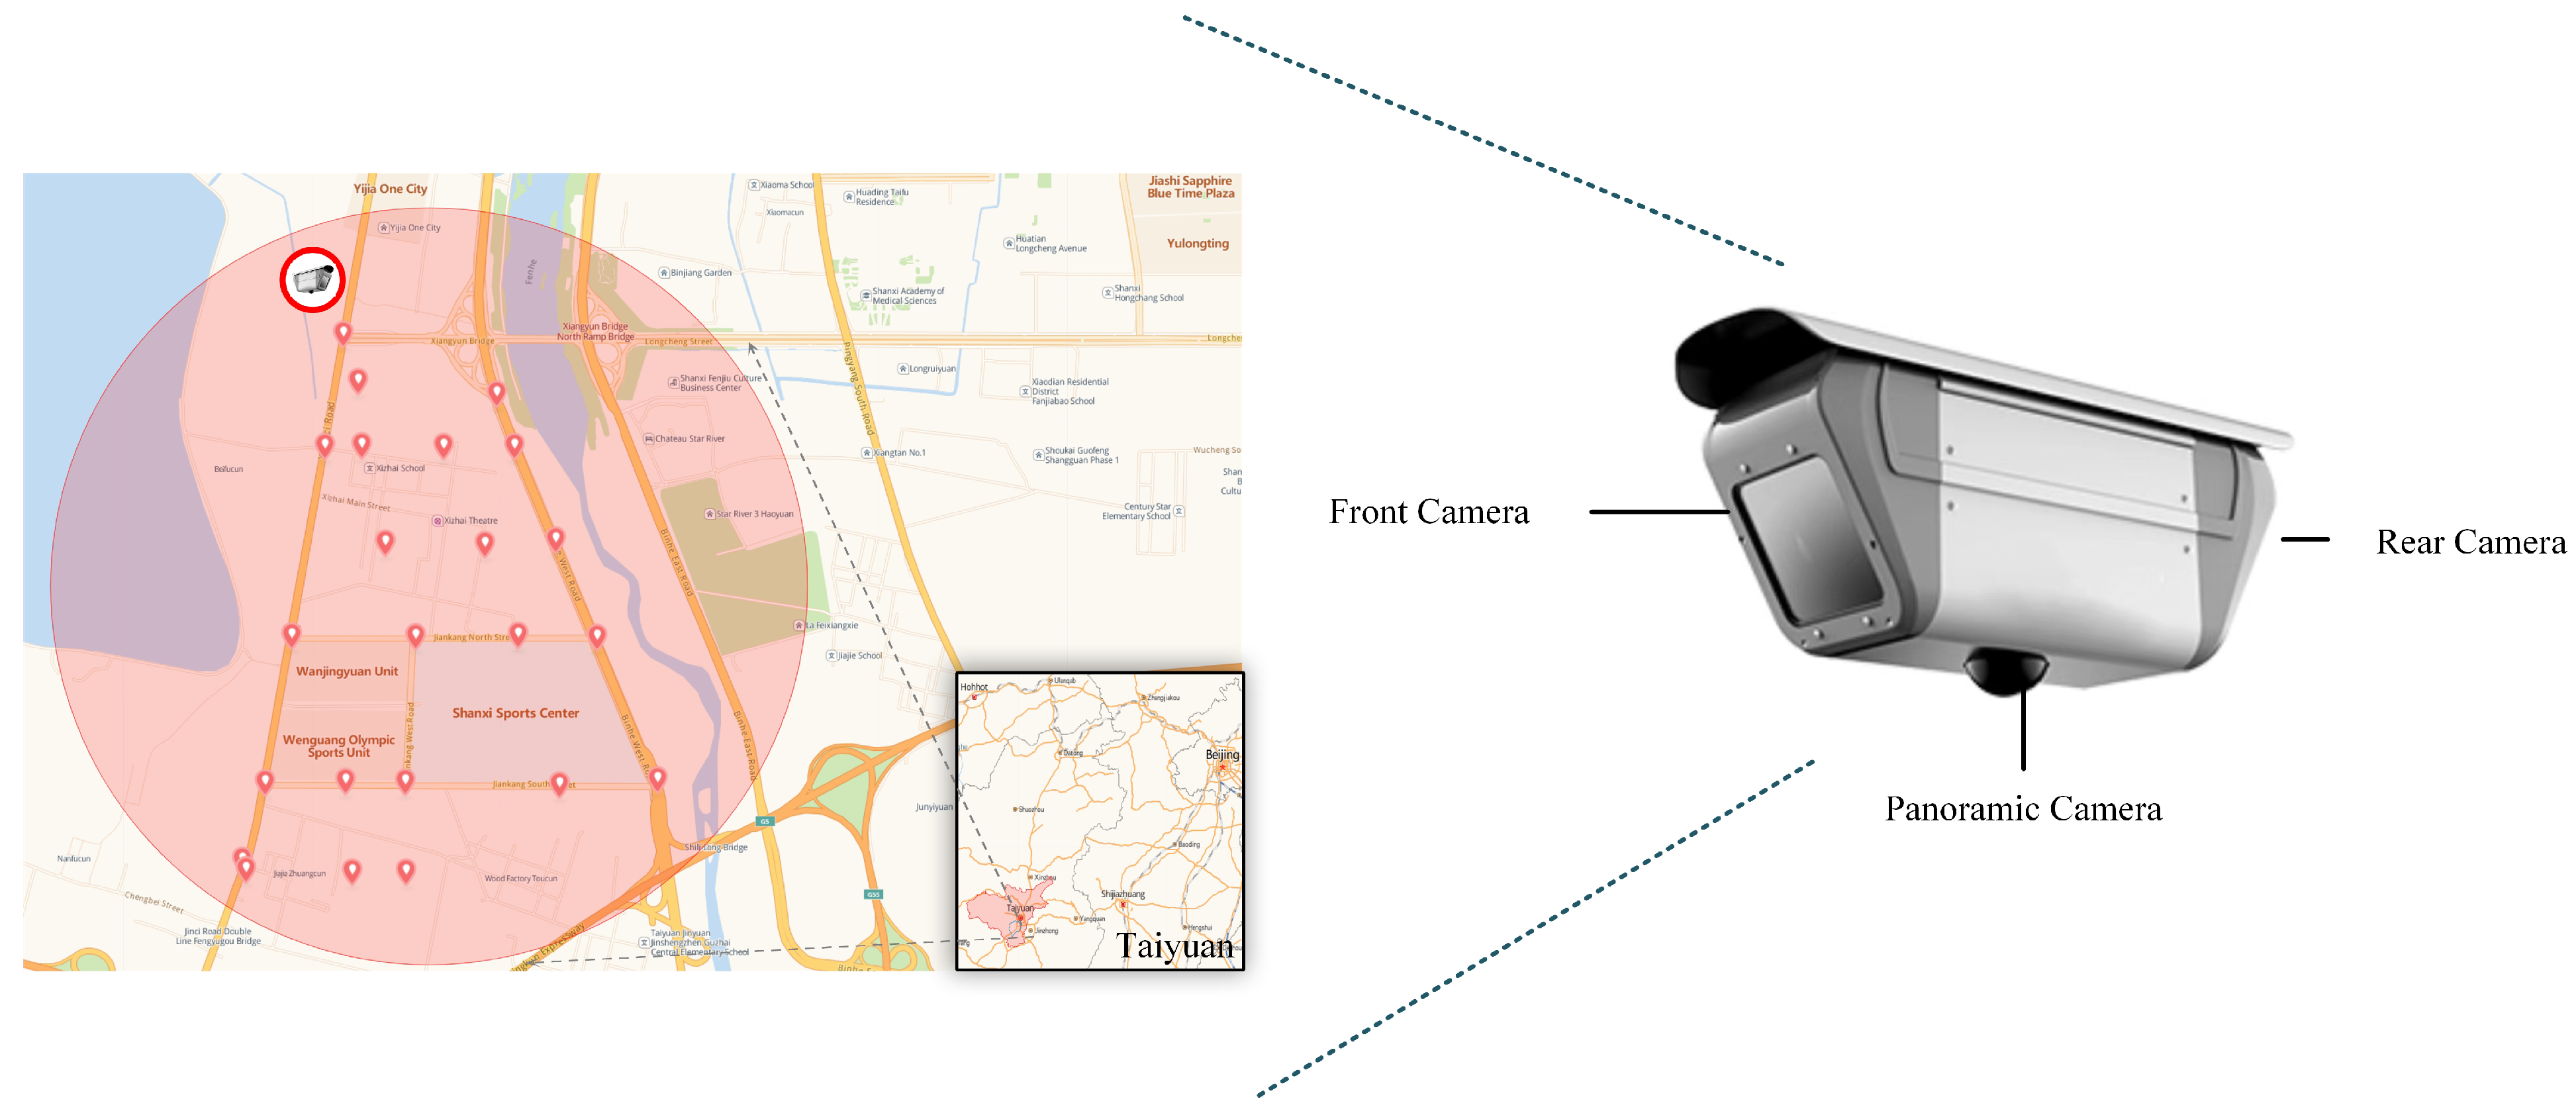
The entirety of the original data for Bayonet-Drivers was procured utilizing high-definition intelligent integrated cameras, integrated within an intelligent monitoring and recording system situated at a road intersection. The cameras are positioned along a main road with three or four lanes, situated at a height of approximately 4.5 m above typical vehicles and roughly 6 m above ground level.
The site of data collection is situated within the Jinyuan District of Taiyuan City, Shanxi Province, China, an area that spans 289 square kilometers and encompasses a total of 537 km of roads (as depicted in
Figure 1). This endeavor resulted in a compilation of 100 h of video clips. To ensure a diverse dataset, video capture was executed at various times, specifically between 9:00 and 15:00 and from 19:00 to 20:30 during July 2020. Due to the long time, wide geographical range, and strong randomness of the data collection, Bayonet-Drivers encompasses individuals of varying ages (including the young, middle-aged, and some elderly) with diverse driving habits. According to the most recent report from the WHO as of December 2023 [
1], drivers who use mobile phones are about four times more likely to be involved in a crash than those who do not. Using a cell phone while driving slows down reaction times (especially braking reaction time, but also reaction time to traffic signals) and makes it difficult to stay in the right lane and maintain the right following distance. Wearing seat belts reduces the risk of death for vehicle passengers by 50%. Consequently, Bayonet-Drivers comprises scenarios of safe driving and risky driving, where risky driving includes using a cell phone and not wearing a seat belt. Details of Bayonet-Drivers are shown in
Table 2.
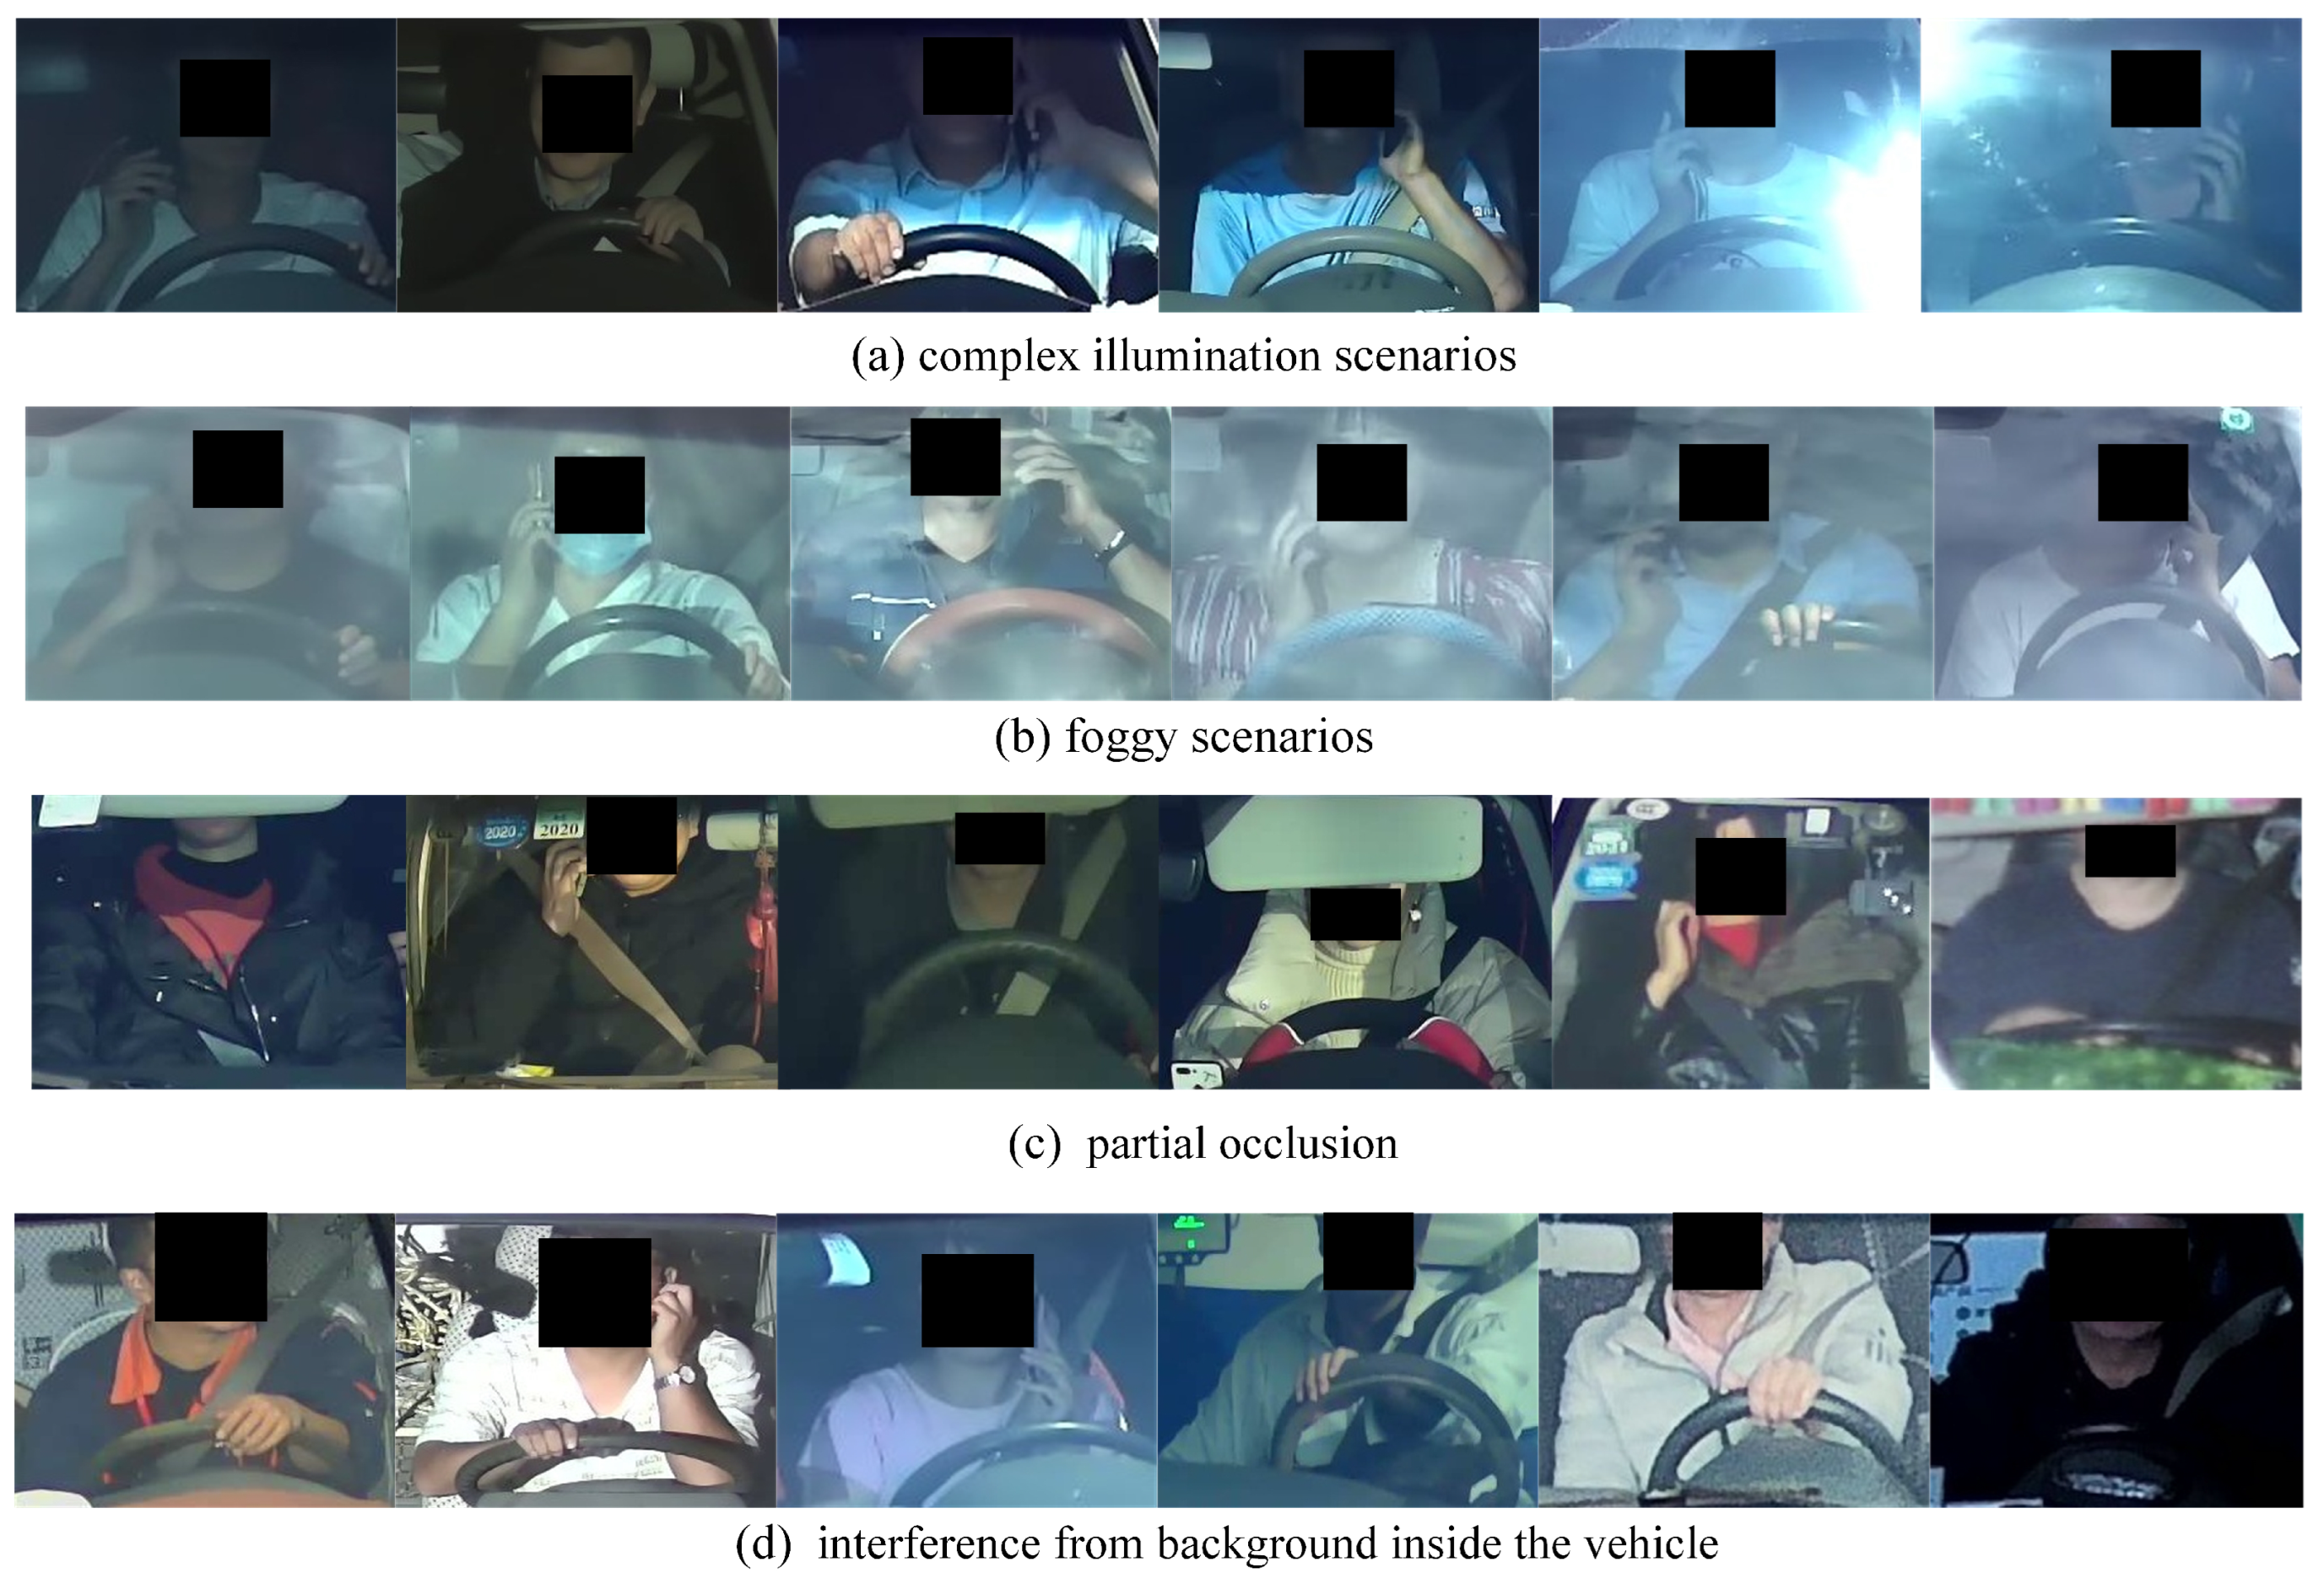
As the data were gathered in a real-world setting, Bayonet-Drivers encapsulates a broad spectrum of challenging scenarios, including a variety of weather conditions such as sunny, cloudy, and foggy days, as well as complex illumination conditions like low light, dazzling light, and uneven illumination, along with interference from the car interior. Moreover, different forms of partial occlusions obscure the driver’s posture. For instance, sun visors may entirely or partially obstruct the driver’s face, hindering the detection of cell phone usage.
The images within the Bayonet-Drivers dataset possess dimensions of 224 × 224 pixels. During the construction process, an image was extracted every 30 frames for regular scenarios, while for challenging scenarios, an image was extracted every 10 frames. This resulted in a final dataset comprising 10,000 images, with 3000 of them annotated in the MS COCO format.
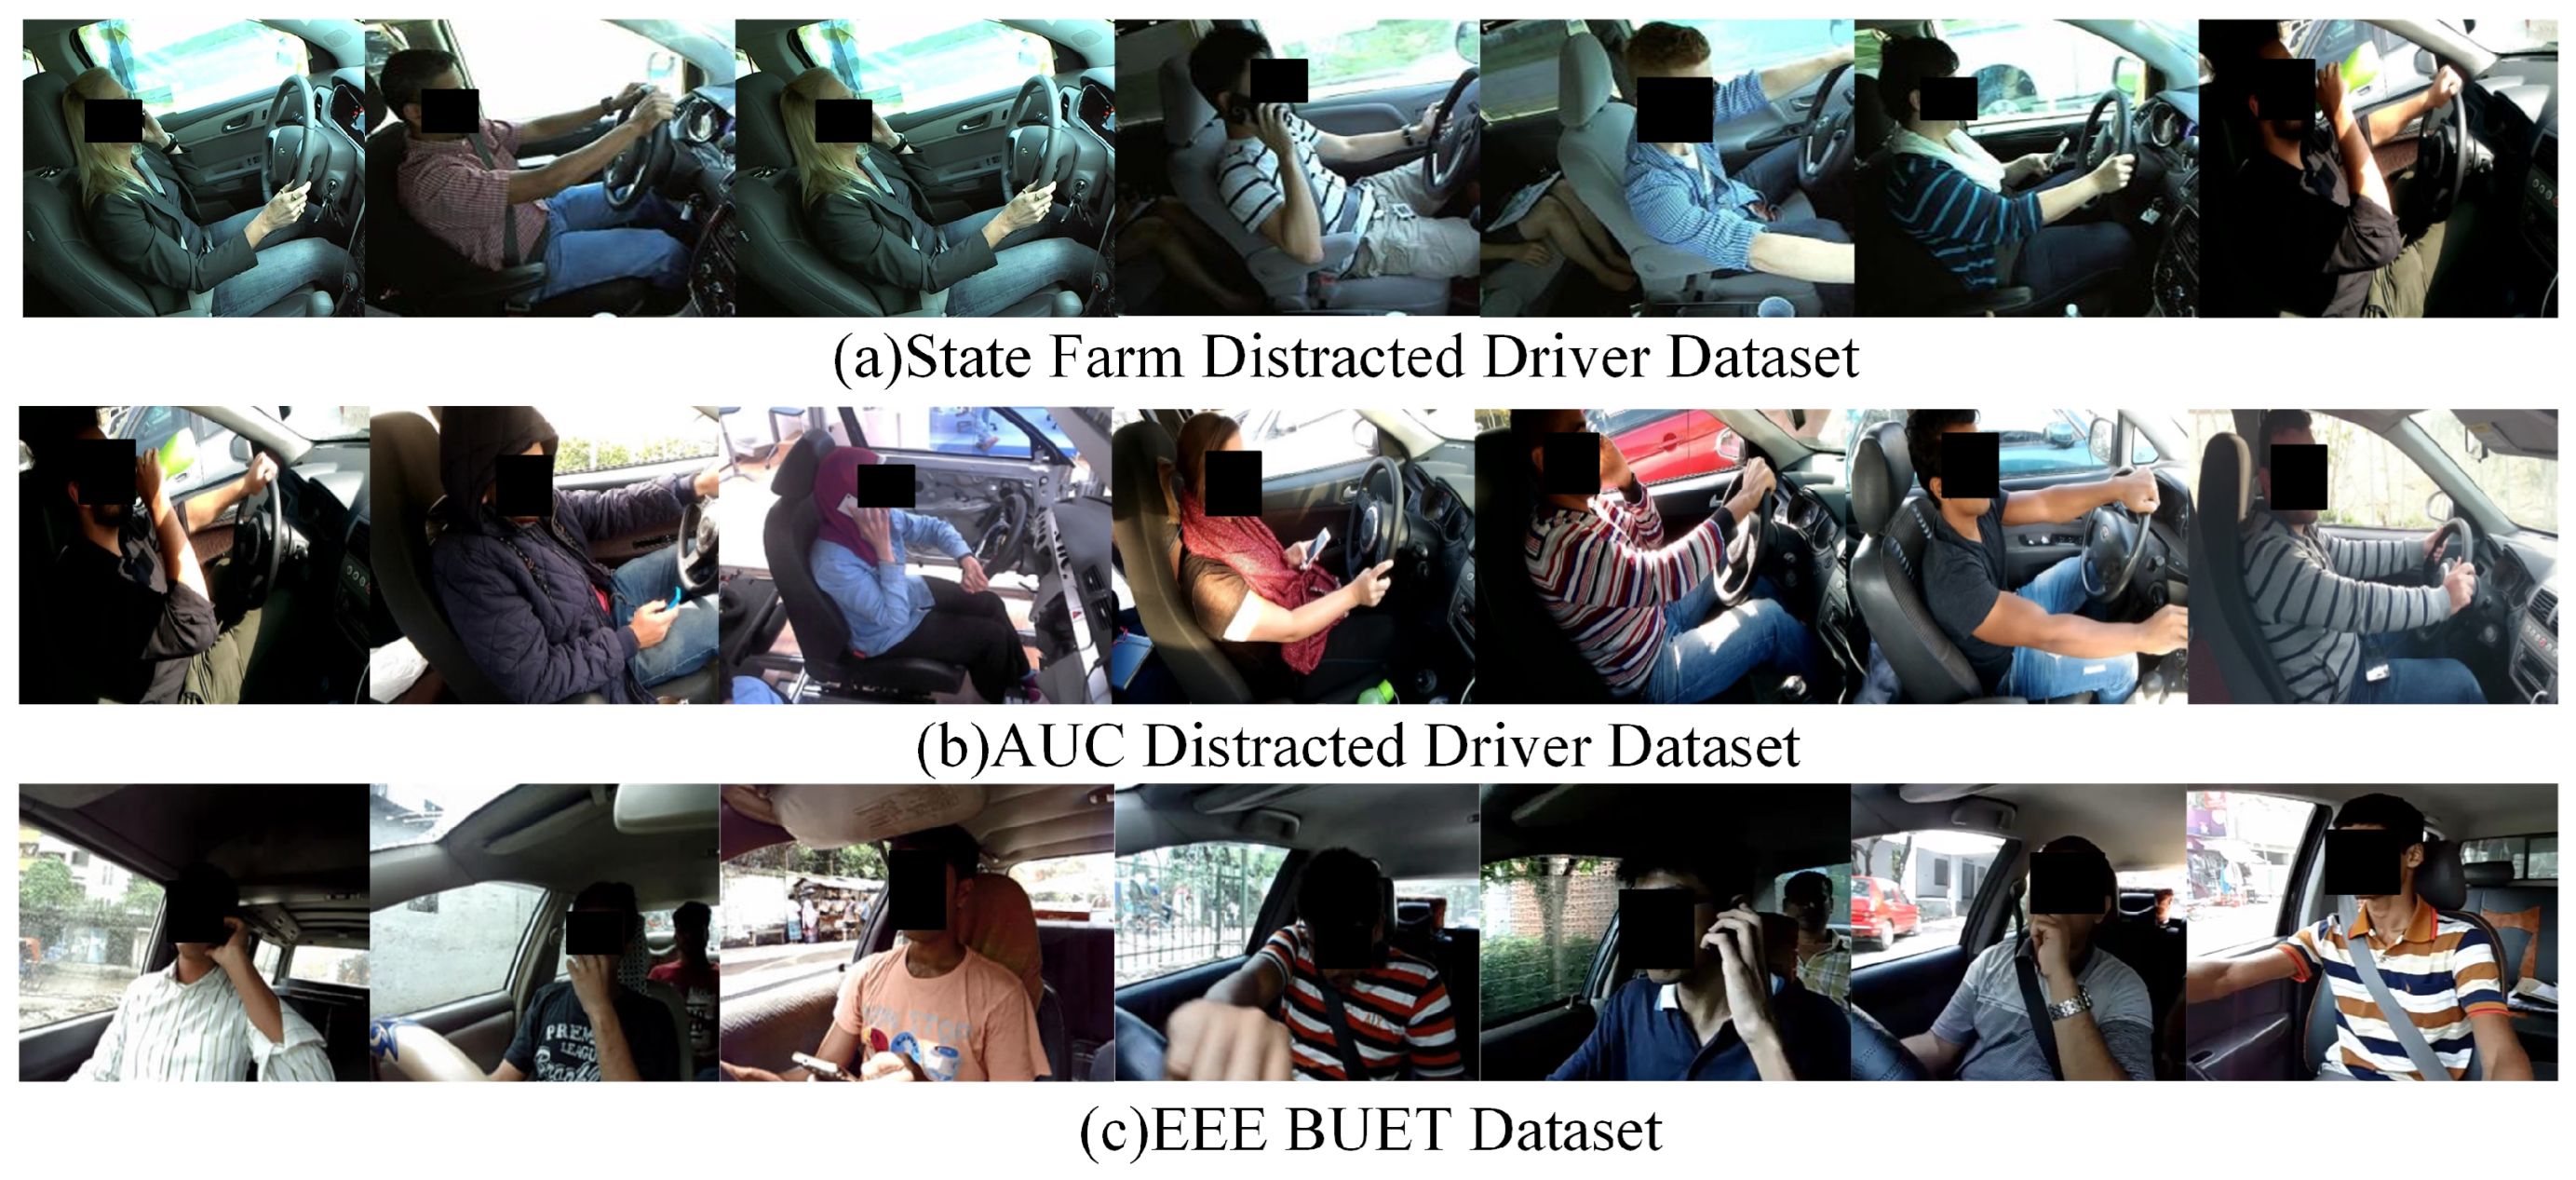
Figure 2 displays some of the challenging example images from the Bayonet-Driver dataset. For comparison, examples from several representative publicly available in-vehicle datasets, including State Farm [
21], AUC [
22], and EEE BUET [
33], are illustrated in
Figure 3.
4. Methodology
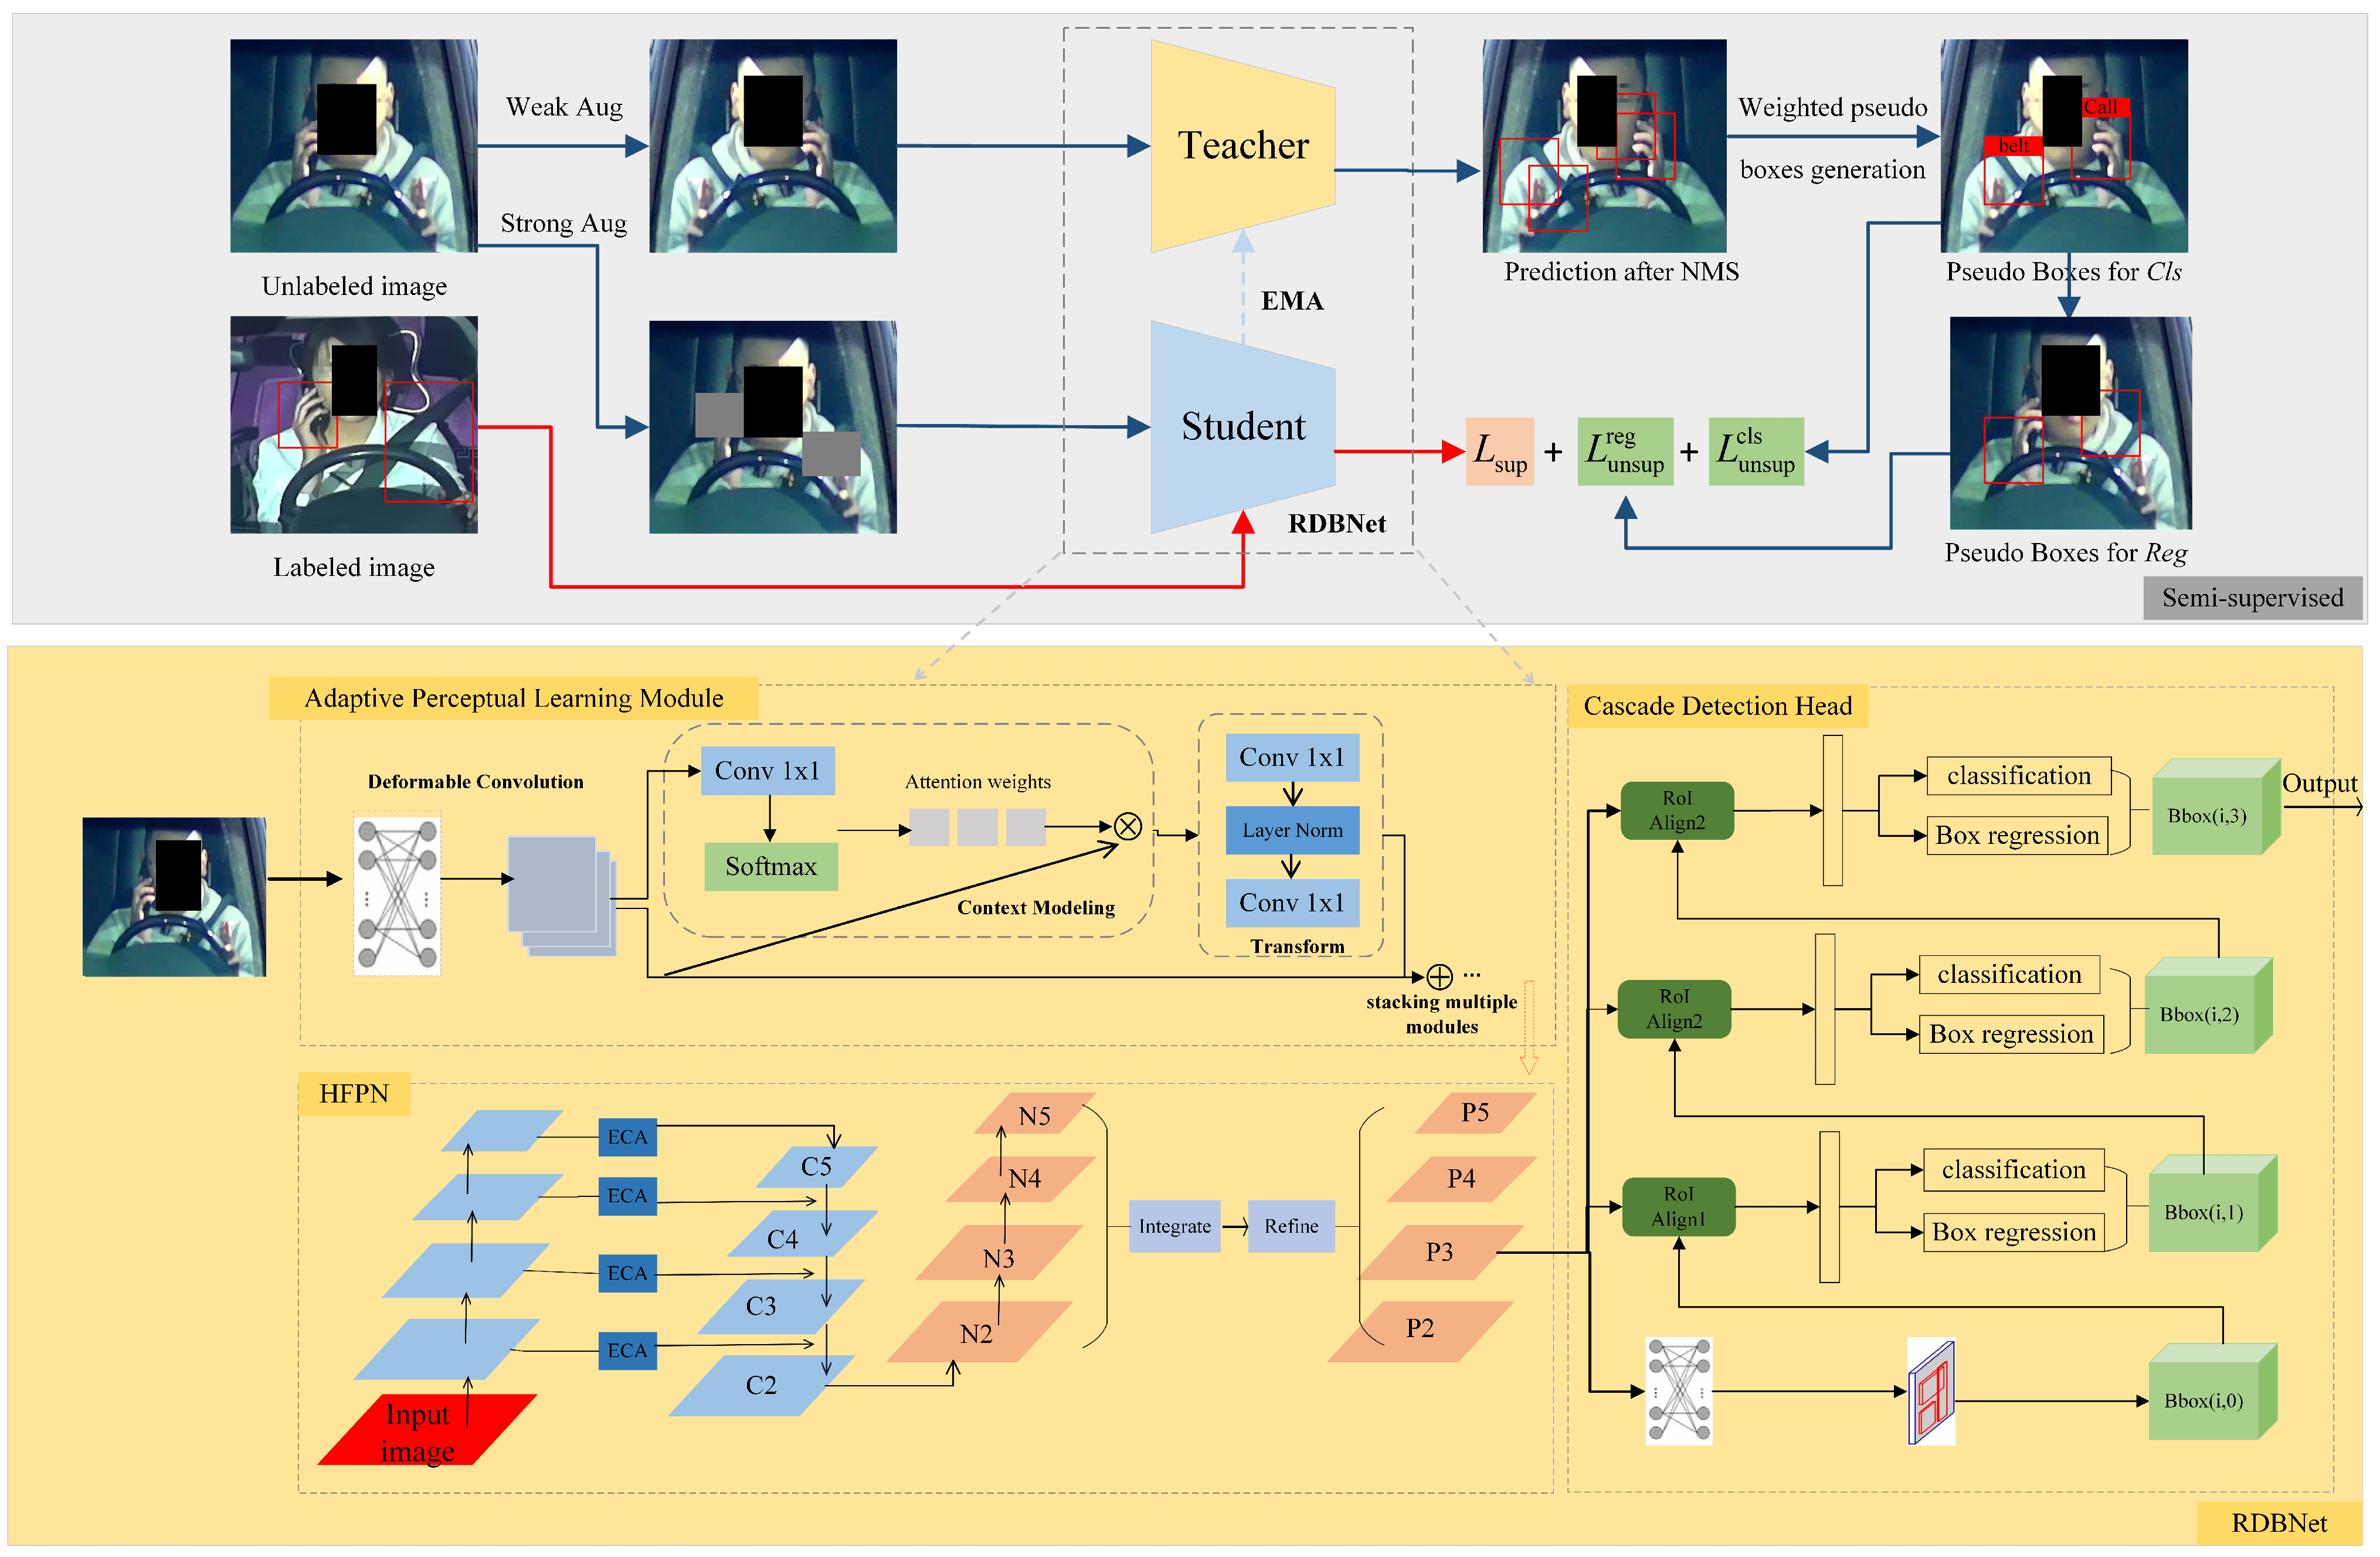
As shown in
Figure 4, an end-to-end semi-supervised network for risky driving detection termed by DGMB-Net based on the classical teacher–student framework [
51] is proposed. Within DGMB-Net, the teacher and student models employ the same structure, specifically RDB-Net, which is composed of the Adaptive Perceptual Learning (APL) module, the Hierarchical Feature Pyramid Network (HFPN), and the cascade detection head. While the APL module and HFPN are designed to improve detection accuracy through advancing spatial perception and fusing features at different levels and scales, the cascade detection head is introduced to realize high-precision bounding box regression and object classification.
4.1. Semi-Supervised Learning
The teacher model and student model have the same structure as mentioned previously. The teacher model produces pseudo-labels for unlabeled images, while the student model is simultaneously trained on labeled images with ground-truth labels and unlabeled images.
Both the teacher model and the student model are randomly initialized throughout the training phase. During each training iteration, a training data batch is formed by randomly sampling labeled and unlabeled images based on a certain data sampling ratio. Unlabeled data are processed by weak augmentation and strong augmentation, aiming to increase the diversity and variation of the unlabeled data, thereby improving the performance and generalization of the model. Weak augmentation, such as random cropping and color jittering, is applied for pseudo-labeling of the teacher model and training of the student model. Strong augmentation such as rotation, scaling, shearing, and flipping is utilized for the detection training of student models. Throughout the training phase, the student model is trained using gradient descent, while the teacher model is continually updated based on the student model using the commonly employed exponential moving average strategy. Afterwards, Non-Maximum Suppression (NMS) is usually utilized to remove the large number of pseudo boxes that are generated by the teacher model and have lower confidence than a fixed threshold.
Although the process of NMS can eliminate the majority of non-foreground boxes, there may still be some redundant boxes remaining due to the overlap between the actual targets and the generated pseudo-labels in terms of their spatial location, dimensions, or visual characteristics. In this case, simply applying one threshold to filter out these redundant candidate boxes might result in inaccurate boundary delineation or even missing detection. To address this problem, a Nonlinear Weighted Pseudo Boxes Generation (NWPG) algorithm is proposed to align the generated pseudo boxes with the ground truth for the accuracy of pseudo-labels. The following is the generation process:
where
X,
Y are the final coordinate values, respectively. NWPG only calculates the coordinates of the upper left and the lower right corners of each candidate box.
and
respectively represent the initial coordinate value, and
represents the confidence score of the corresponding candidate box.
The loss function
L is the weighted sum of the supervised loss function
and the unsupervised loss function
:
where
controls the proportion of unlabeled image loss, and both
and
are normalized by the number of images in their respective training data:
where
represents the classification loss,
represents the bounding box regression loss,
represents the i-th labeled image,
represents the i-th unlabeled image,
represents the total number of labeled images, and
represents the total number of unlabeled images.
4.2. RDB-Net
RDB-Net is composed of three modules: the Adaptive Perceptual Learning Module for feature extraction, the Hierarchical Feature Pyramid Network for feature fusion, and the cascade detection head for high-precision detection.
4.2.1. Adaptive Perceptual Learning Module
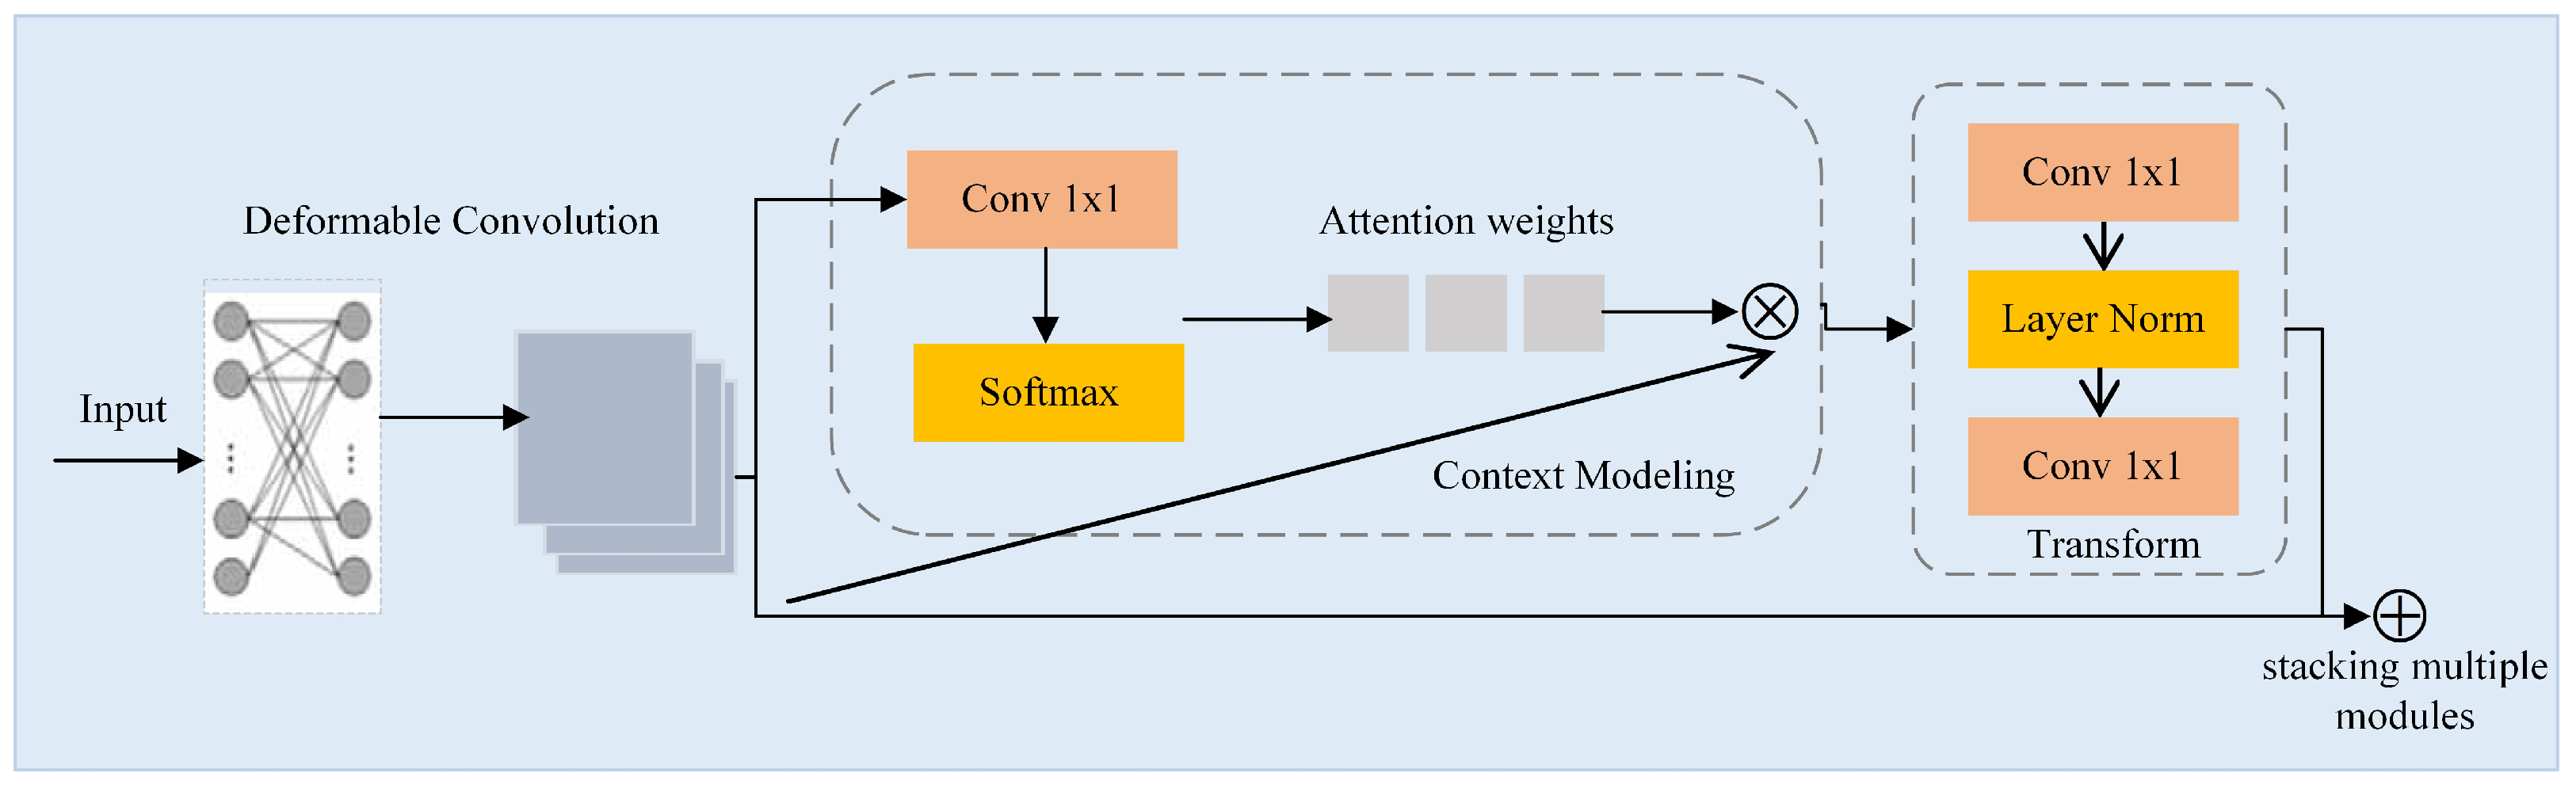
Risky-driving-behavior detection in traffic monitoring scenarios is a challenging task due to the presence of complex lighting conditions, adverse weather conditions, and interference from the background inside the vehicle. To enhance the adaptability of feature extraction network in different scenarios, a plug-and-play module, termed Adaptive Perceptual Learning (APL) Module, is proposed.
For the accuracy and versatility of the model, the classical ResNet50 is applied as the base backbone. The APL module is incorporated into the final three stages of the ResNet50 network. Within the APL module, deformable convolution (DCN) [
52] effectively captures fine details and effectively models spatial variations in complex lighting and noisy conditions by adaptively adjusting the receptive field. Simultaneously, the APL module leverages global context (GC) modeling [
53] to address the challenges of complex lighting and noisy images by integrating overall information and capturing remote dependencies, thus compensating for the loss of detail and low contrast.
Figure 5 shows the structure of the APL module. Firstly, deformable convolution processes the feature map of the previous stage. Then, the feature map is passed through a
convolution block and softmax function in the context modeling part and is then added to the original input to acquire the global context feature, which expands the input receptive field. In the transformation process, two convolutional layers are employed to decrease the channel dimension and minimize the parameter count. Finally, the result and input of the feature transformation are added element-wise. The process can be expressed with the subsequent formula:
where
x is the feature map input,
y is the output,
i is the index of positions,
j represents traversing all positions,
is the total number of positions in the feature maps,
represents the weight through the first 1 × 1 convolution,
represents the weight through the first 1 × 1 convolution after the softmax function,
represents the weight through the last 1 × 1 convolution,
is the global attention pooling weight, and
is the transformation process.
4.2.2. Hierarchical Feature Pyramid Network
Regarding the FPN module, it strengthens the features extracted by the backbone, enabling the model to detect targets of different scales efficiently. However, traditional FPN’s sole reliance on a top-down path hampers the balanced distribution of feature information across levels, limiting the impact of low-level features on high-level features. To effectively capture multi-scale feature information and perform hierarchical feature fusion, this study proposes a Hierarchical Feature Pyramid Network (HFPN) inspired by [
54,
55].
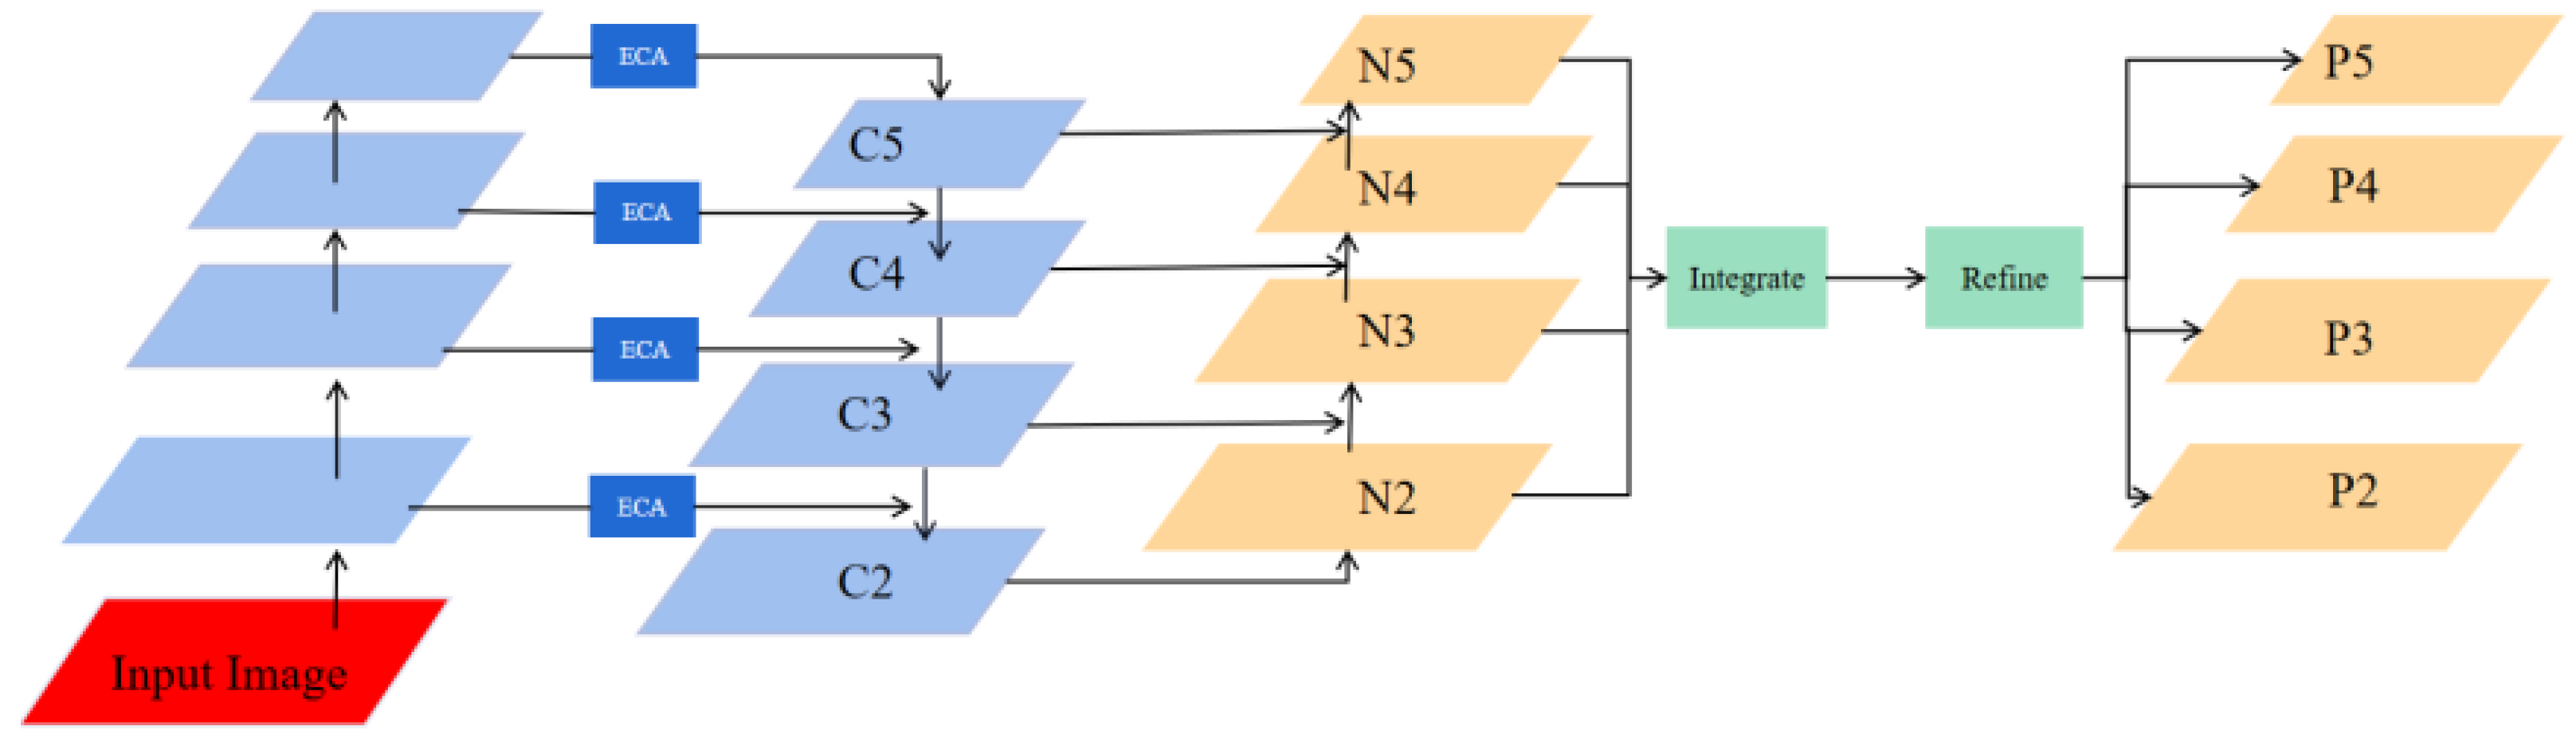
Figure 6 illustrates the workflow of HFPN. Firstly, semantic information is propagated through a top-down pathway. Subsequently, location information is propagated through a bottom-up pathway to facilitate feature fusion. Additionally, an Efficient Channel Attention (ECA) block [
56] is incorporated into the input part of HFPN to adjust the weight of features adaptively. Finally, a balanced integration of features from layers N2, N3, N4, and N5 is performed.
The following are the processes to balance the features at each level: The first step is to generate balanced semantic features. Assuming that the resolution of the features has four levels
, with
having the highest resolution. Then,
are adjusted to have the same size as
using interpolation, and the maximum pooling and balanced semantic features are achieved using the formula:
where
L is the number of feature levels, and
and
represent the index of the highest and lowest feature level, respectively. The refined feature is then used to enrich the feature details using non-local operation. To obtain both low-level and high-level features, the extracted features are rescaled using the same procedure but in reverse to output
,
,
, and
.
4.2.3. Cascade Detection Head
A cascade detection head was suggested to address the limitation of traditional networks in improving accuracy, arising from the use of a single threshold setting. The cascade detection head converts the traditional bounding box regression task into a cascaded regression task, and multiple detectors are cascaded after the Region Proposal Network (RPN). This work adopts the cascade detection head as the detection head of RDBNet. The structure is shown in
Figure 7.
5. Experiment and Analysis
In this section, ablation experiments are executed to analyze the contributions of the APL module. Then, the proposed HFPN is compared with the baseline FPNs. Afterwards, this study verified the effectiveness of the proposed semi-supervised method by comparing it with the fully supervised method and other semi-supervised methods. Then, DGMB-Net is compared with several baseline networks. Finally, this study visualized the performance of DGMB-Net.
5.1. Dataset and Experiment Settings
All experimental evaluations were carried out using the State Farm dataset and the Bayonet-Drivers dataset. Given that the State Farm dataset is primarily tailored for classification tasks, this work carried out the annotation of images depicting risky driving behaviors. Specifically, these behaviors included right-handed and left-handed cellphone use, both in texting and phone use scenarios, annotated in the COCO format. Ultimately, the State Farm dataset used in this study contained 9256 images, with 2776 of them labeled. The Bayonet-Drivers dataset comprised 10,000 images, with 3000 labeled images.
The experimental setup included the use of an Nvidia Geforce 1080Ti 11GB graphics processing unit. The operating system and deep learning frameworks employed were Ubuntu18.04 and PyTorch 1.7.0, respectively. The parameters for the experiments were set as follows: the first 500 iterations adopted a linear learning rate strategy, where the initial learning rate was set at 0.001. Following this, the learning rate was adjusted to 0.01 and was subsequently reduced by a factor of 0.1 every 40,000 iterations. In the context of supervised learning, the batch size was fixed at 4. For semi-supervised learning, the batch size was increased to 5, maintaining a ratio of labeled to unlabeled images of 1:4. The total number of iterations performed was 180,000.
5.2. Metrics
This study used the COCO metrics [
57] as evaluation metrics, which is a common evaluation standard for object detection. Among COCO metrics, this study employed
,
,
,
, and
to evaluate the performance of the model, and their calculation formulas are detailed as follow:
represents true positives, signifying actual positives correctly classified by the classifier. stands for false positives, denoting actual negatives incorrectly classified as positives. represents false negatives, indicating actual positives incorrectly classified as negatives. denotes true negatives, representing actual negatives correctly classified as negatives by the classifier. , calculated as the area enclosed by the curve when precision is plotted against recall, serves as a pivotal metric in object detection. A higher signifies superior performance. represents the mean average precision, calculated as the average of the AP values for all classes. It serves as a common metric for measuring the overall performance of an algorithm. In the calculation formula, represents the value for the class with index i, and N denotes the number of classes. denotes the average precision when the Intersection over Union (IoU) is set to 0.5. denotes the average precision when the Intersection over Union (IoU) is set to 0.75. and are selected as the evaluation indices for medium and large targets, respectively.
5.3. Results and Analysis
5.3.1. Ablation Experiments of Adaptive Perceptual Learning (APL) Module
We conducted ablation experiments on the proposed Adaptive Perceptual Learning (APL) Module. The ablation experiments adopt the semi-supervised learning method mentioned in
Section 4.1. The results of ablation experiments on two datasets are shown in
Table 3 and
Table 4. The ablation experimental results show that the newly added GC (Global Context) module significantly improves the
metric. This is attributed to the potent global modeling capabilities of the GC module, which optimizes feature representation. Additionally, the inclusion of deformable convolution contributes to the enhancement of the
value. This is attributed to the deformable convolution’s ability to flexibly adjust the receptive field, allowing for better adaptation to changes in the target, such as seat belts. This study conducted experiments on different CNNs to select the most appropriate CNN. The experimental results show that the
of ResNet50 and ResNeXt101 are very close, while the network parameters of ResNeXt exceed ResNet50. So this work chose ResNet50 as the backbone.
5.3.2. Effects of Hierarchical Feature Pyramid Network (HFPN)
This section compared the effect of HFPN and several FPN baselines with excellent performance, specifically, FPN [
58], BiFPN [
59], PAFPN [
54], and BFP [
55]. FPN is the most primitive architecture, BiFPN, PAFPN, and BFP are all developed on it. Among them, BiFPN is a weighted bidirectional feature pyramid network. Compared with ordinary FPN, PAFPN adds a bottom-up path to enhance the positioning ability on multiple scales. The main innovation of BFP is to use the same deeply integrated balanced semantic features to enhance multi-level features. The semi-supervised learning method mentioned in
Section 4.1 is applied in this section.
Table 5 and
Table 6 tabulate the experimental results on Bayonet-Drivers and State Farm datasets, respectively. It shows that HFPN outperforms BFP by 3.3 AP points on Bayonet-Drivers with only a 3.54 M parameter increase. Moreover, there is a notable improvement in both
and
values, with an increase of 0.9 and 2.5, respectively. This improvement is attributed to HFPN’s capacity to not only focus on crucial feature channels but also effectively integrate multi-scale features from different levels, thereby enhancing the model’s ability in object detection.
5.3.3. Comparison of DGMB-Net with Other Semi-Supervised Methods
In this section, we undertook a comparison between DGMB-Net and other semi-supervised methodologies. RDB-Net is utilized as the detection model. Experiments were conducted using varying labeled ratios on both the Bayonet-Drivers and State Farm datasets. The ratios of 1%, 5%, 10%, 20%, and 30% represent the proportion of labeled images in relation to the total dataset.
Table 7 presents the
values of both DGMB-Net and other semi-supervised learning methodologies.
As can be discerned from the experimental results in
Table 7, all the semi-supervised methods showed a significant improvement over the supervised method. DGMB-Net outperforms the supervised method by 26.7 points, 25.2 points, and 11.8 points when there are 1%, 5%, and 10% labeled data, respectively. Moreover, it becomes evident that the proposed semi-supervised learning method has led to improvements in the
value when compared to other state-of-the-art methods. This can be attributed to the design of the Nonlinear Weighted Pseudo Boxes Generation algorithm, which aligns the generated pseudo boxes with the ground truth, thereby enhancing the accuracy of pseudo labels. Specifically, DGMB-Net outperforms the E2E by 3.5 points, 2.2 points, and 1.1 points when there are 1%, 5%, and 10% labeled data on Bayonet-Drivers, respectively. Notably, the semi-supervised learning methodology demonstrates a greater advantage when the label ratio is smaller. When the entire dataset is employed for training, DGMB-Net attains
values of 54.5 and 72.3 on the Bayonet-Drivers and State Farm datasets, respectively.
5.3.4. Comparison with Mainstream Detectors
Several classic detection networks, single-stage Yolox [
63] and Retinanet [
64] and two-stage Fast R-CNN [
65], Faster R-CNN [
66], and Cascade R-CNN [
67], were compared with DGMB-Net on Bayonet-Drivers and State Farm datasets.
Table 8 and
Table 9 report the experimental results. As for two-stage methods, the
of RDB-Net on Bayonet-Drivers is 14.9 percentage points, 4.3 percentage points, and 2.7 percentage points higher than Fast R-CNN, Faster R-CNN, and Cascade R-CNN, respectively. As for single-stage methods, the
of RDB-Net on Bayonet-Drivers is 9.8 percentage points, 1.0 percentage points higher than Yolox and Retinanet. Although early algorithms (Fast R-CNN and Faster R-CNN) had fewer parameters, their
value can only achieve 36.3 and 46.9 on Bayonet-Drivers. However, the parameters of the RDB-Net only increased by 5.89 M compared to Cascade R-CNN. At the same time, after introducing semi-supervised learning, the performance of RDB-Net has been further improved. DGMB-Net boasts the highest detection precision and the most optimal comprehensive detection performance.
5.3.5. Visualization Results of DGMB-Net
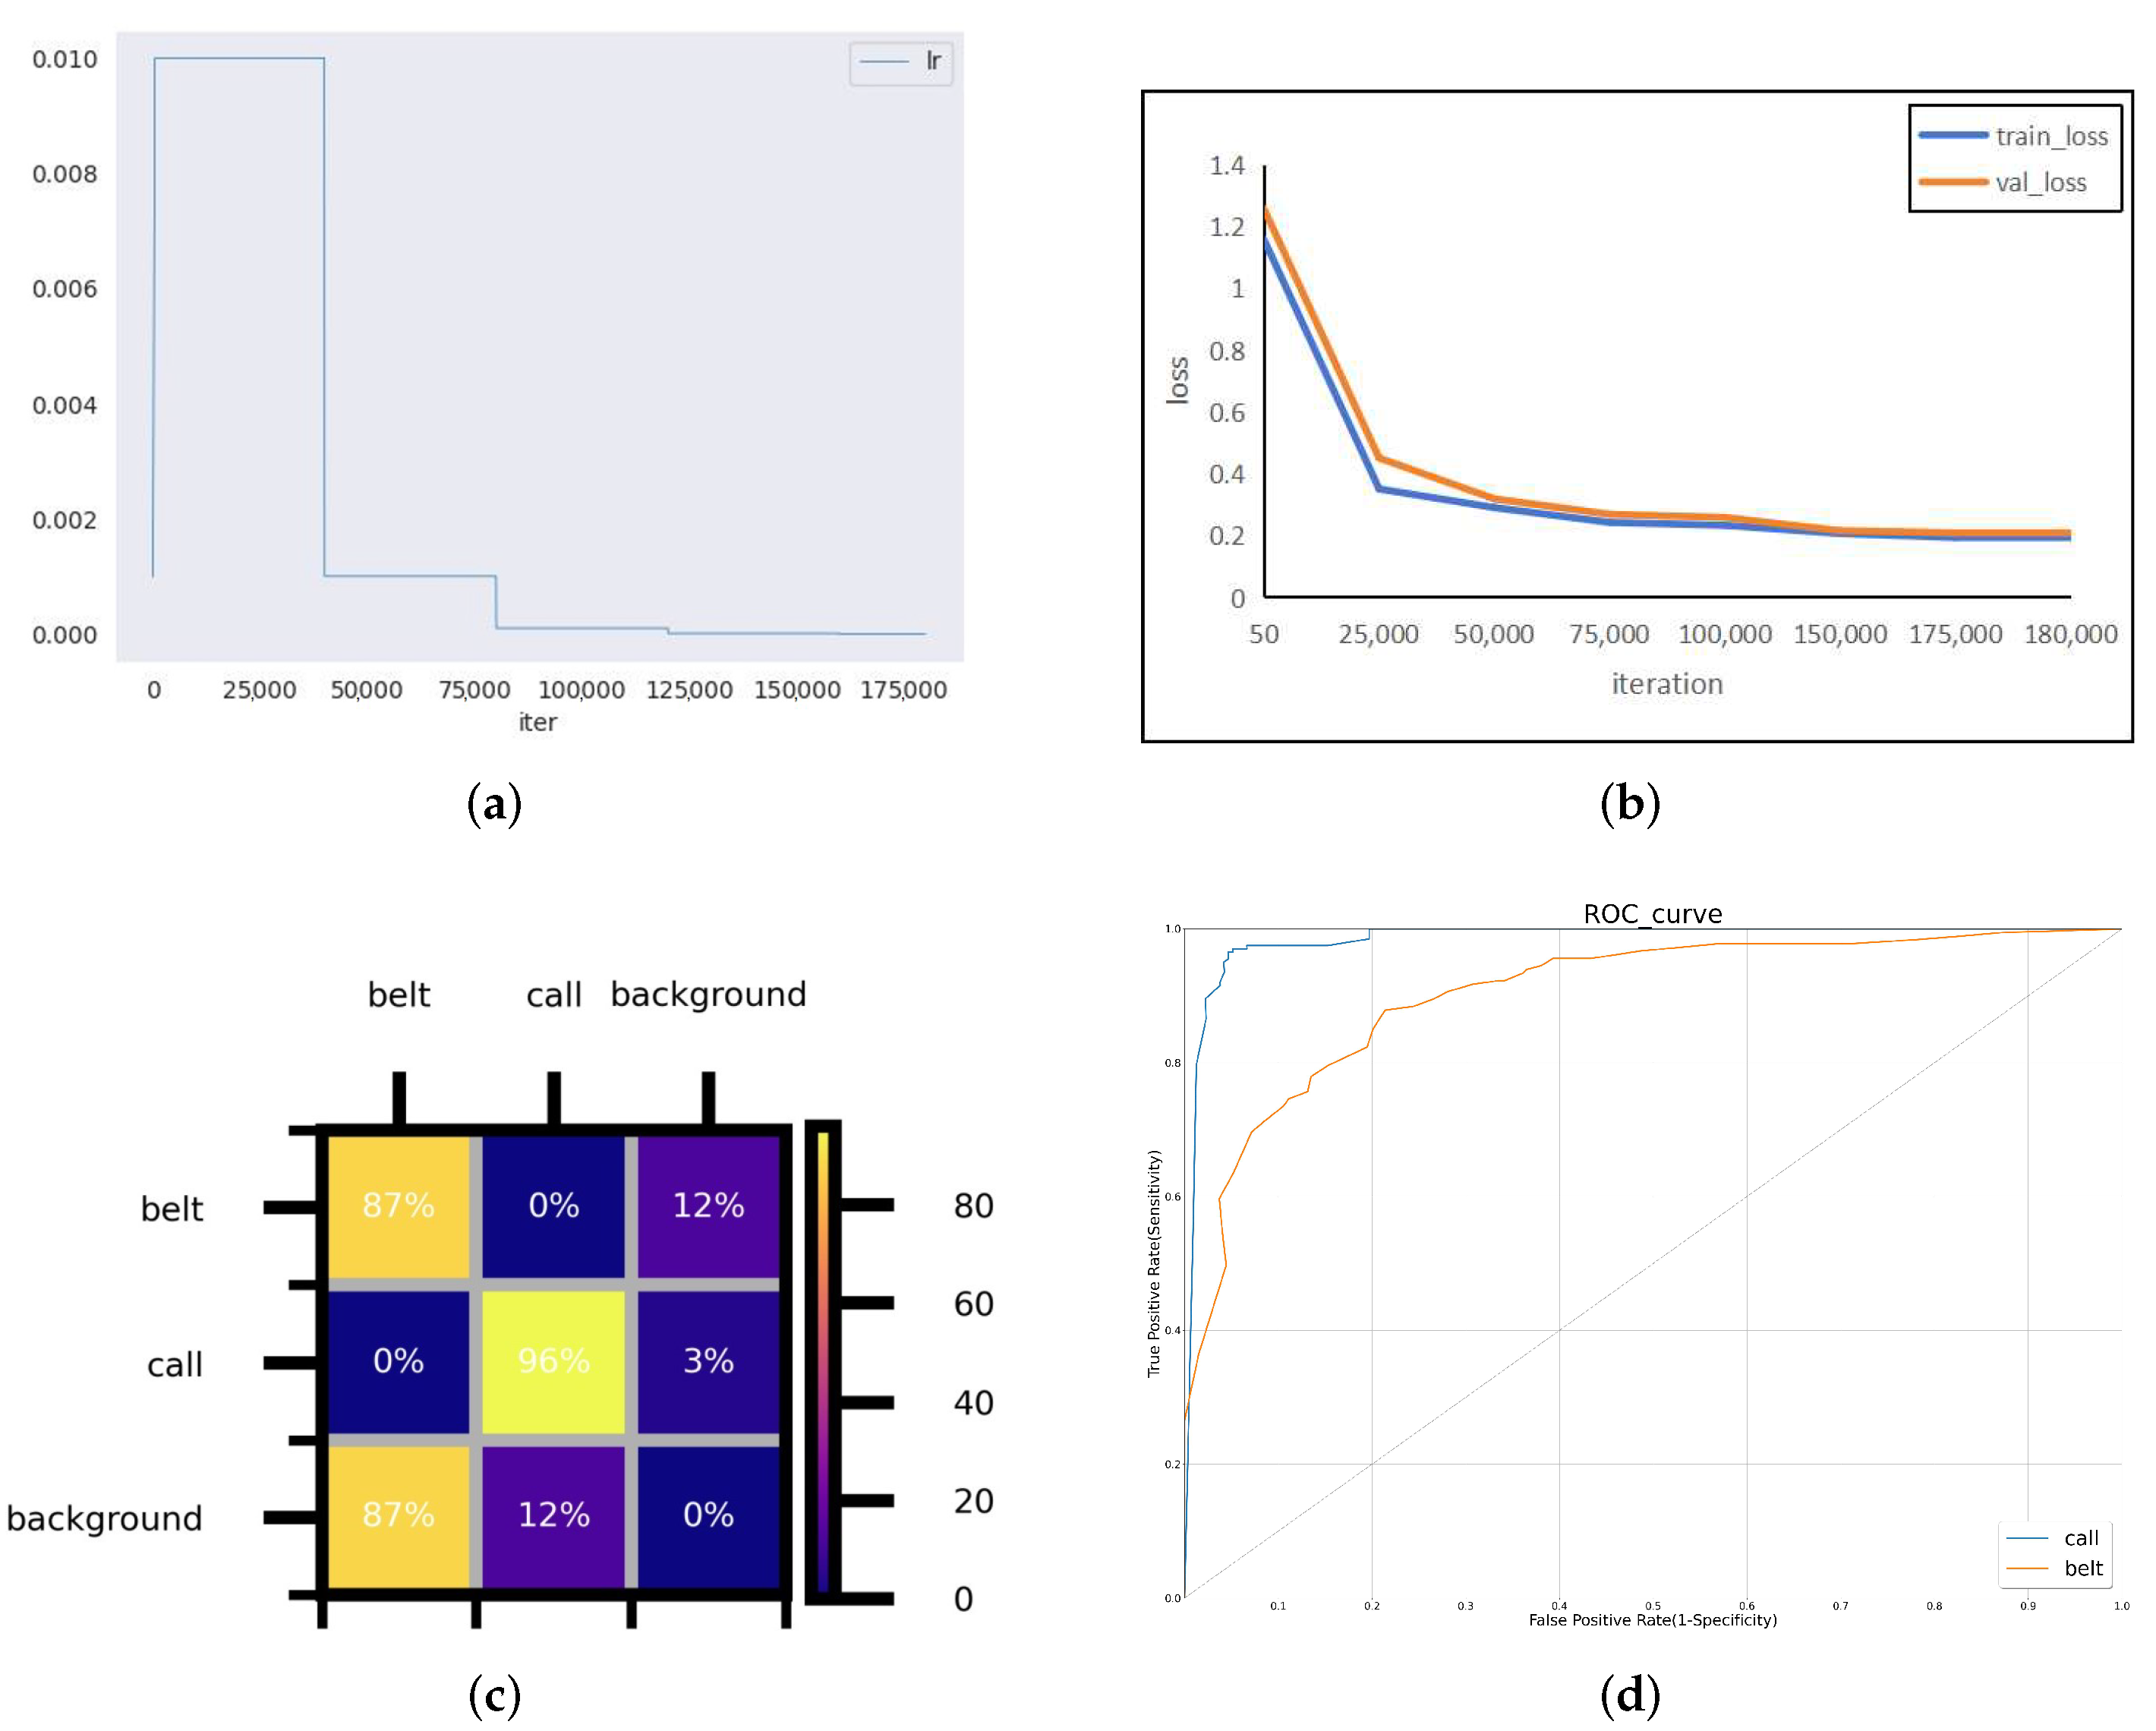
This section performed a visual analysis of DGMB-Net.
Figure 8 shows performance diagrams for DGMB-Net on the Bayonet-Drivers dataset. The confusion matrix shows that some errors occur; for example, belt and call were misclassified into background categories, resulting in missed detection. The ROC curve for the DGMB-Net is given in
Figure 8d. The ROC curve showed that DGMB-Net achieved good results in both belt and call categories.
Figure 9 shows the precision–recall curves (PR Curve) for different datasets and different categories. As is demonstrated in Bayonet-Drivers, DGMB-Net performed better on the detection of phone call than that of belt. One possible cause is the deformation of belt during the driving. In addition, the background information such as the color of clothes can interfere with the detection.
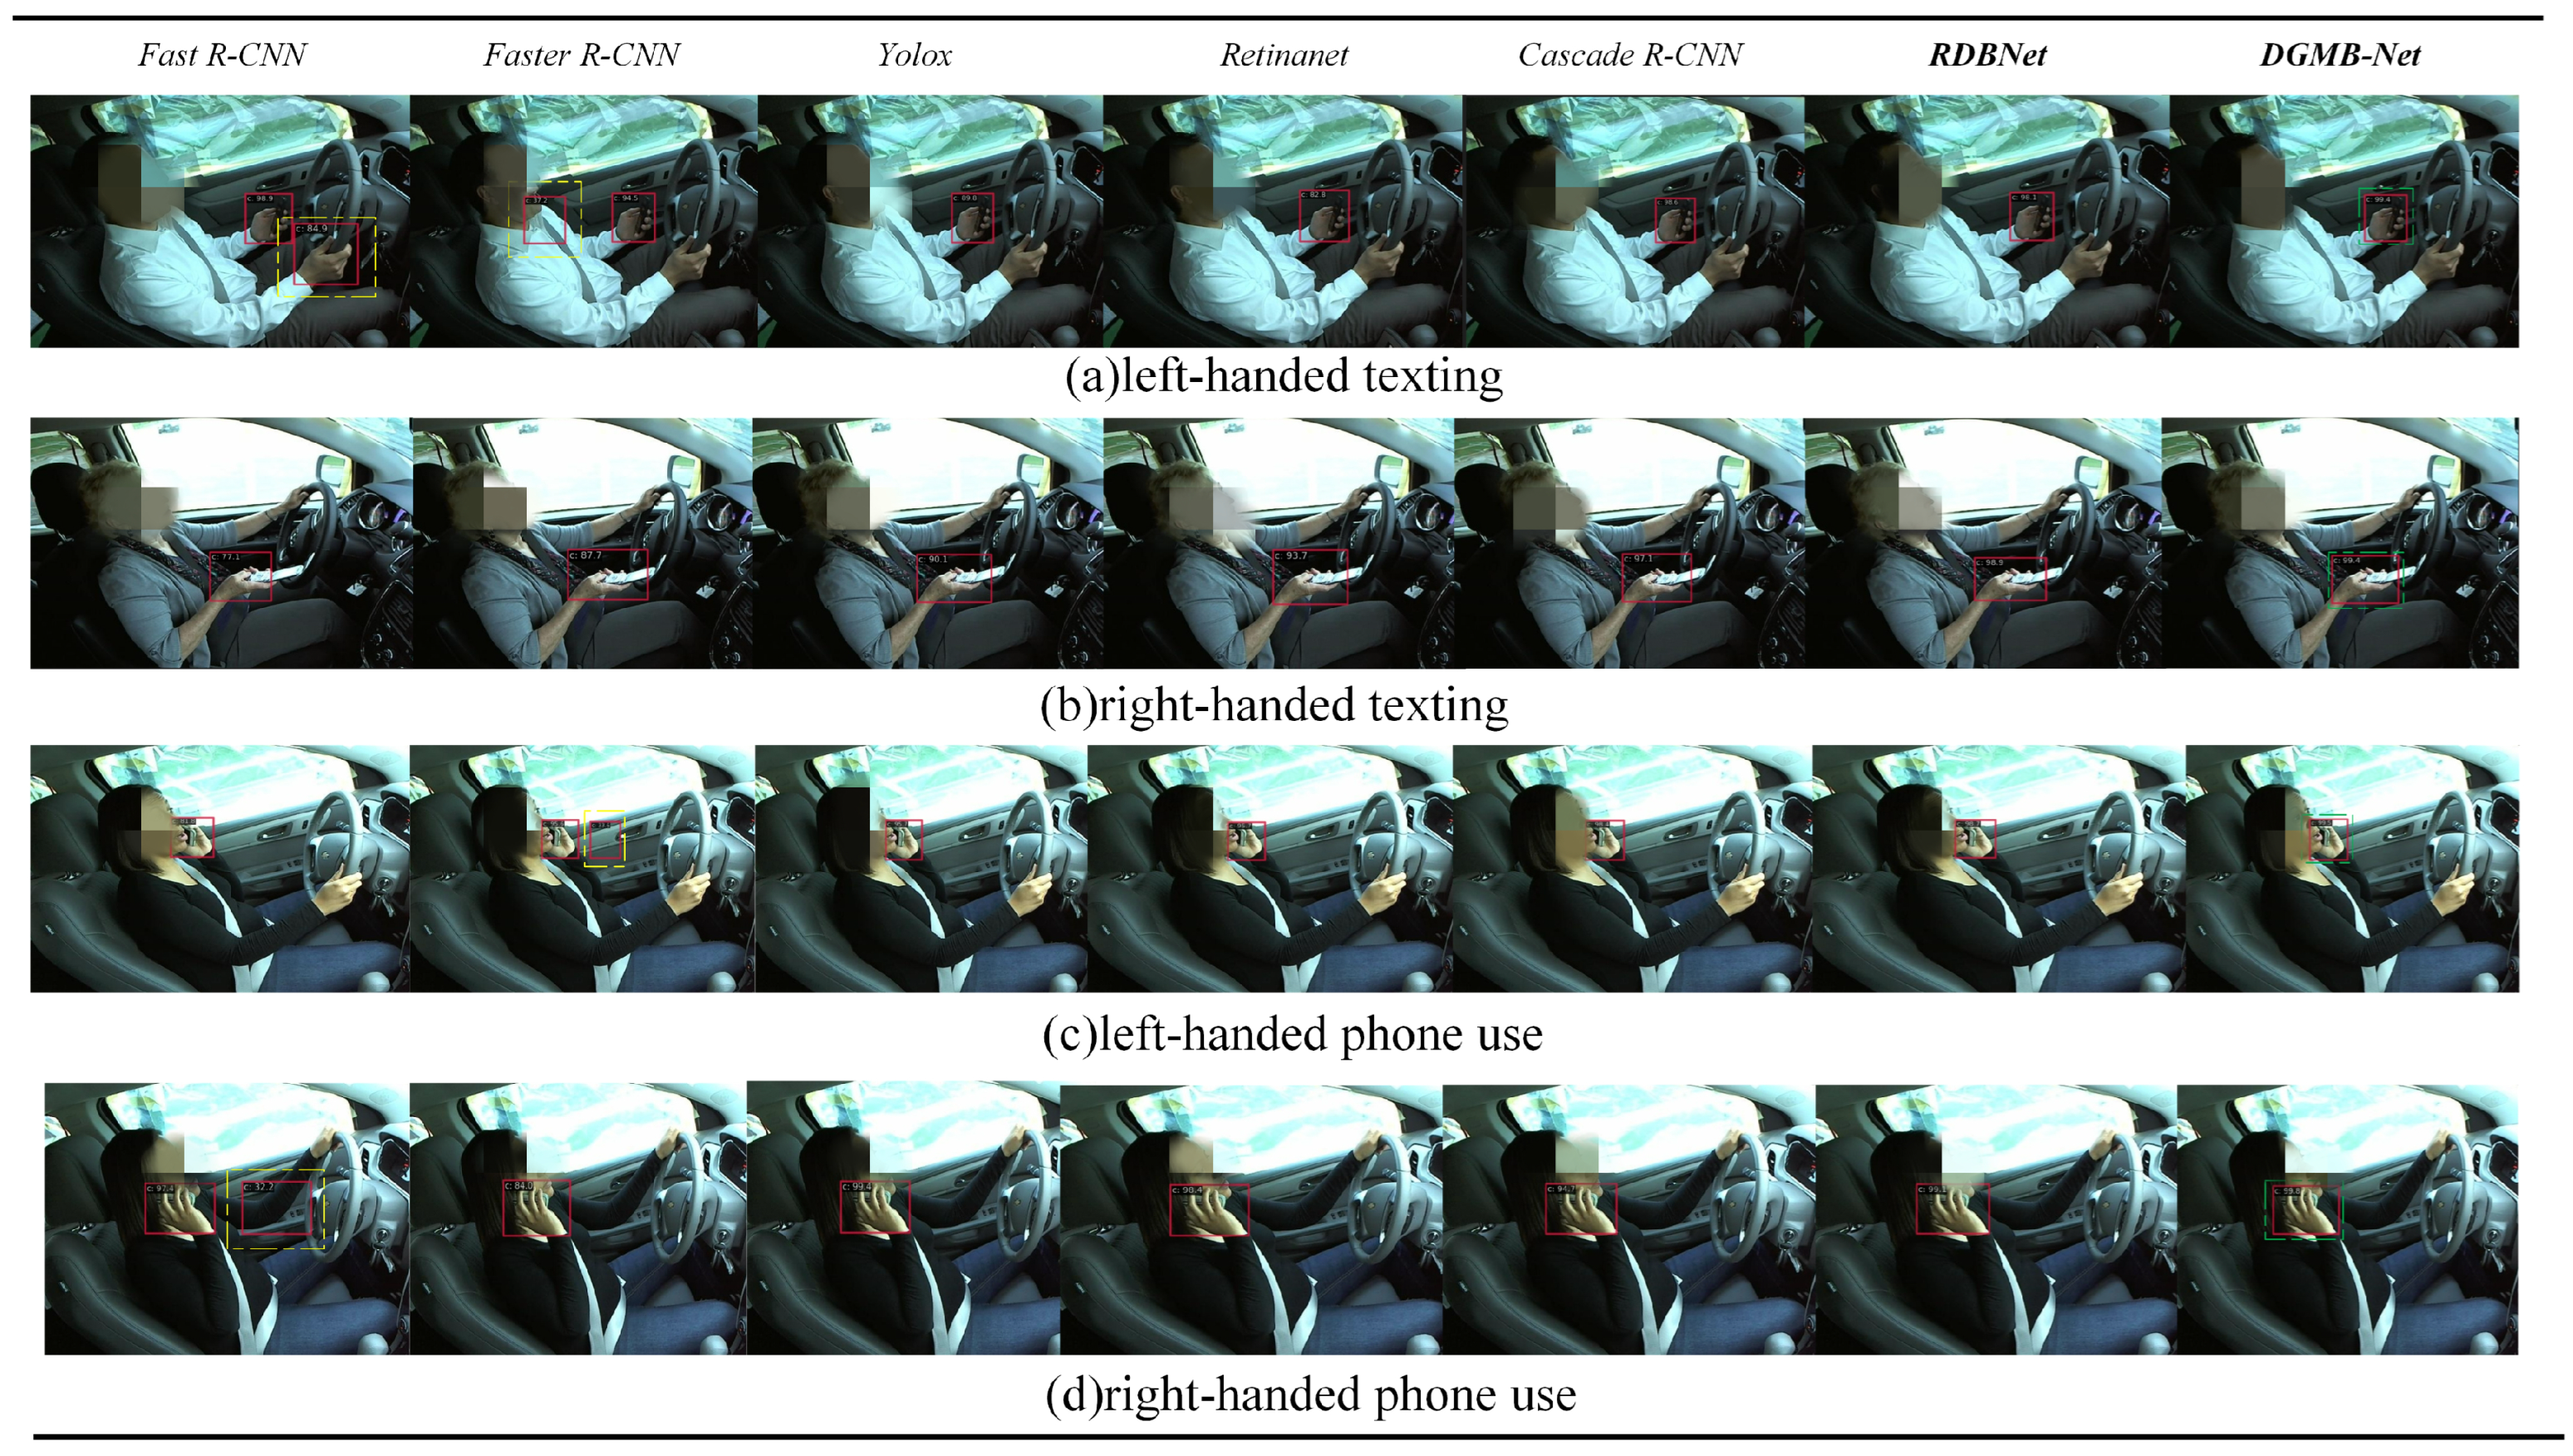
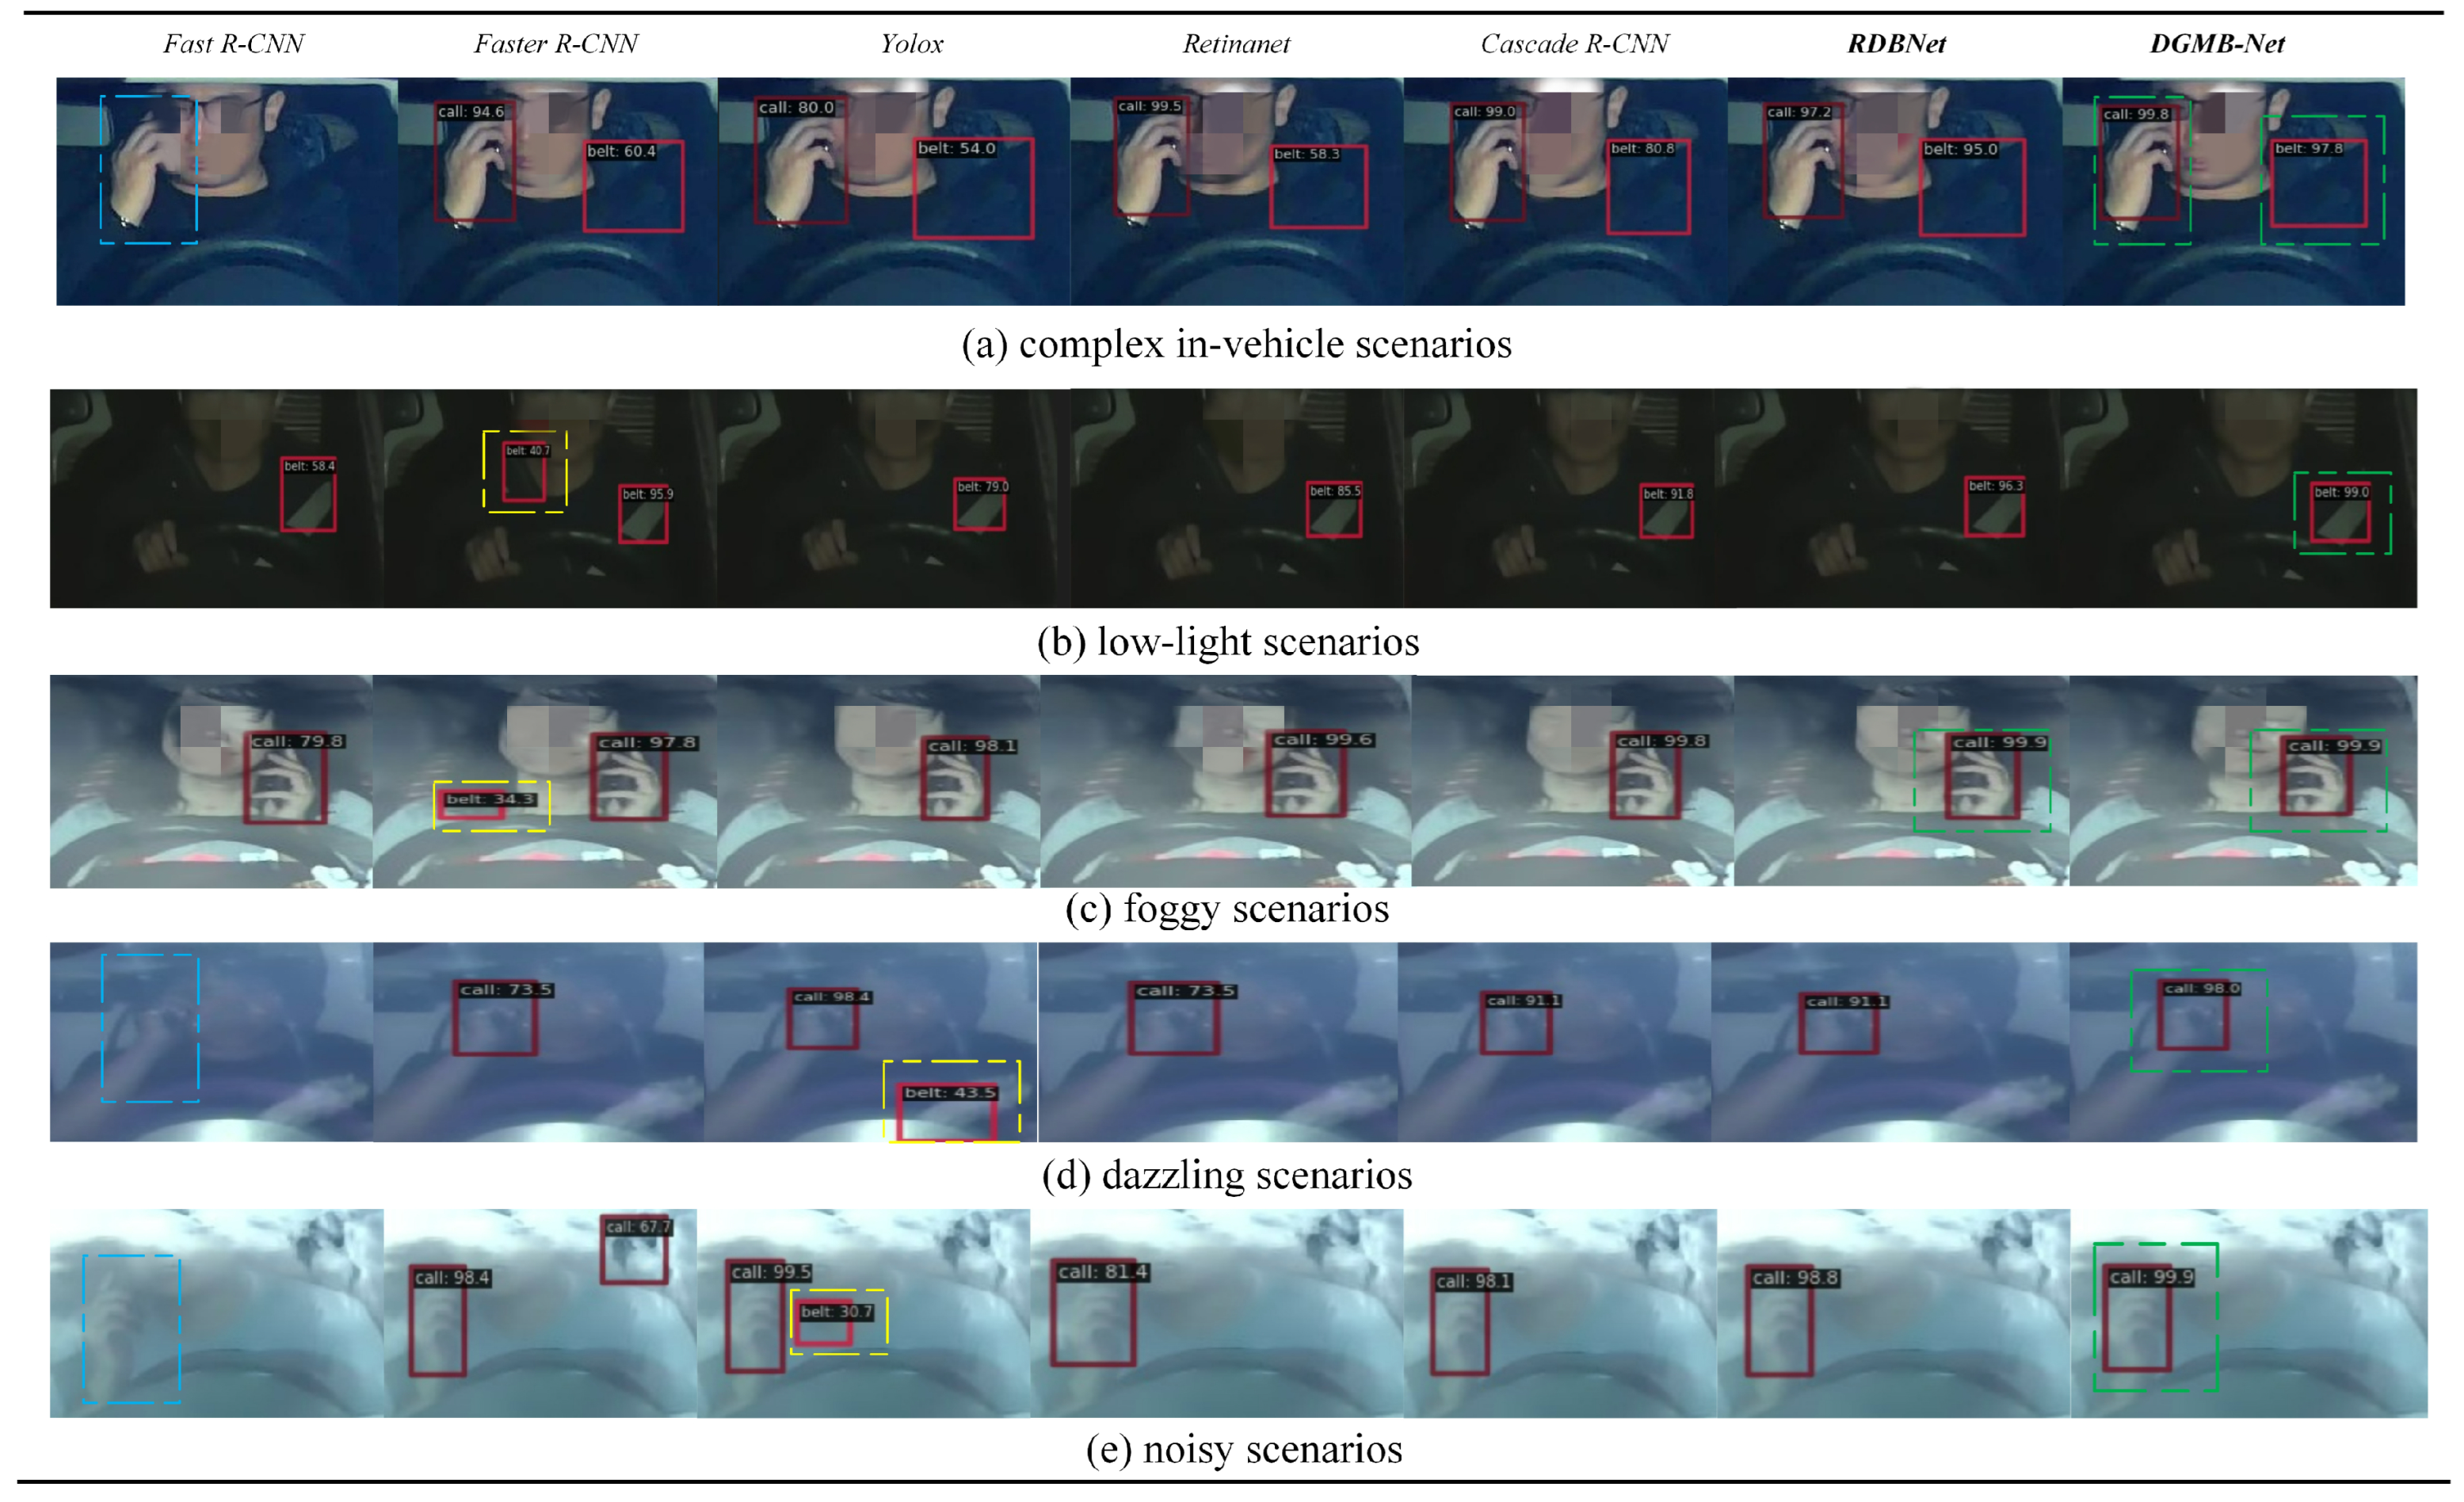
Figure 10 and
Figure 11 show examples of detection visualization results of images on Bayonet-Drivers and State Farm datasets, respectively. The dashed boxes in blue, yellow, and green represent missed detection, wrong detection, and correct detection with the highest confidence, respectively. It is shown that the proposed DGMB-Net successfully addresses the aforementioned challenges. As shown in
Figure 10a, in complex in-vehicle background (the color of clothes and the color of seat belt are very similar), Fast R-CNN missed detection. Furthermore, Faster R-CNN, Yolox, and Retinanet exhibited low confidence, whereas DGMB-Net achieved the highest confidence. To verify the generalization capability of DGMB-Net, this study also conducted visualization experiments on the State Farm dataset. It is evident that DGMB-Net demonstrates outstanding detection results in the in-vehicle environment. Simultaneously, it effectively addresses the occlusion challenge posed by left-hand phone usage.
7. Conclusions and Prospect
This study introduces Bayonet-Drivers, the pioneering benchmark for detecting risky driving behaviors in traffic surveillance contexts. This comprehensive framework comprises many challenging scenarios, providing an invaluable standard for both the evolution and appraisal of methodologies aimed at detecting risky driving behaviors. In addition, DGMB-Net—a novel semi-supervised network architecture—is proposed specifically for the detection of risky driving behaviors. The DGMB-Net incorporates an enhanced semi-supervised learning approach designed to navigate the costly challenge of data labeling. It also integrates an Adaptive Perceptual Learning Module and a Hierarchical Feature Pyramid Network to preserve detection accuracy. This study undertook a rigorous evaluation of DGMB-Net’s performance and benchmarked it against several baseline models. The experimental outcomes provided unequivocal validation of the effectiveness and robustness of DGMB-Net.
Bayonet-Drivers provides a new benchmark and suitable data for the development of the transport industry. Simultaneously, DGMB-Net can effectively reduce the workload of human monitoring and labeling for traffic management departments by means of semi-supervision. Looking forward, on the one hand, a lightweight network design will be incorporated to enhance DGMB-Net’s efficiency. On the other hand, additional types of risky driving behaviors, such as drowsy driving, drunk driving, smoking, and eating, among others, will be added to broaden the scope of the research. Additionally, the application of unsupervised learning will be applied in the identification of risky behaviors. This expanded focus will undoubtedly bolster the applicability of the detection network within Intelligent Transportation Systems.


