

Mechanical Behavior Monitoring and Load Inversion Analysis of Large-Diameter Underwater Shield Tunnel during Construction


Abstract
1. Introduction
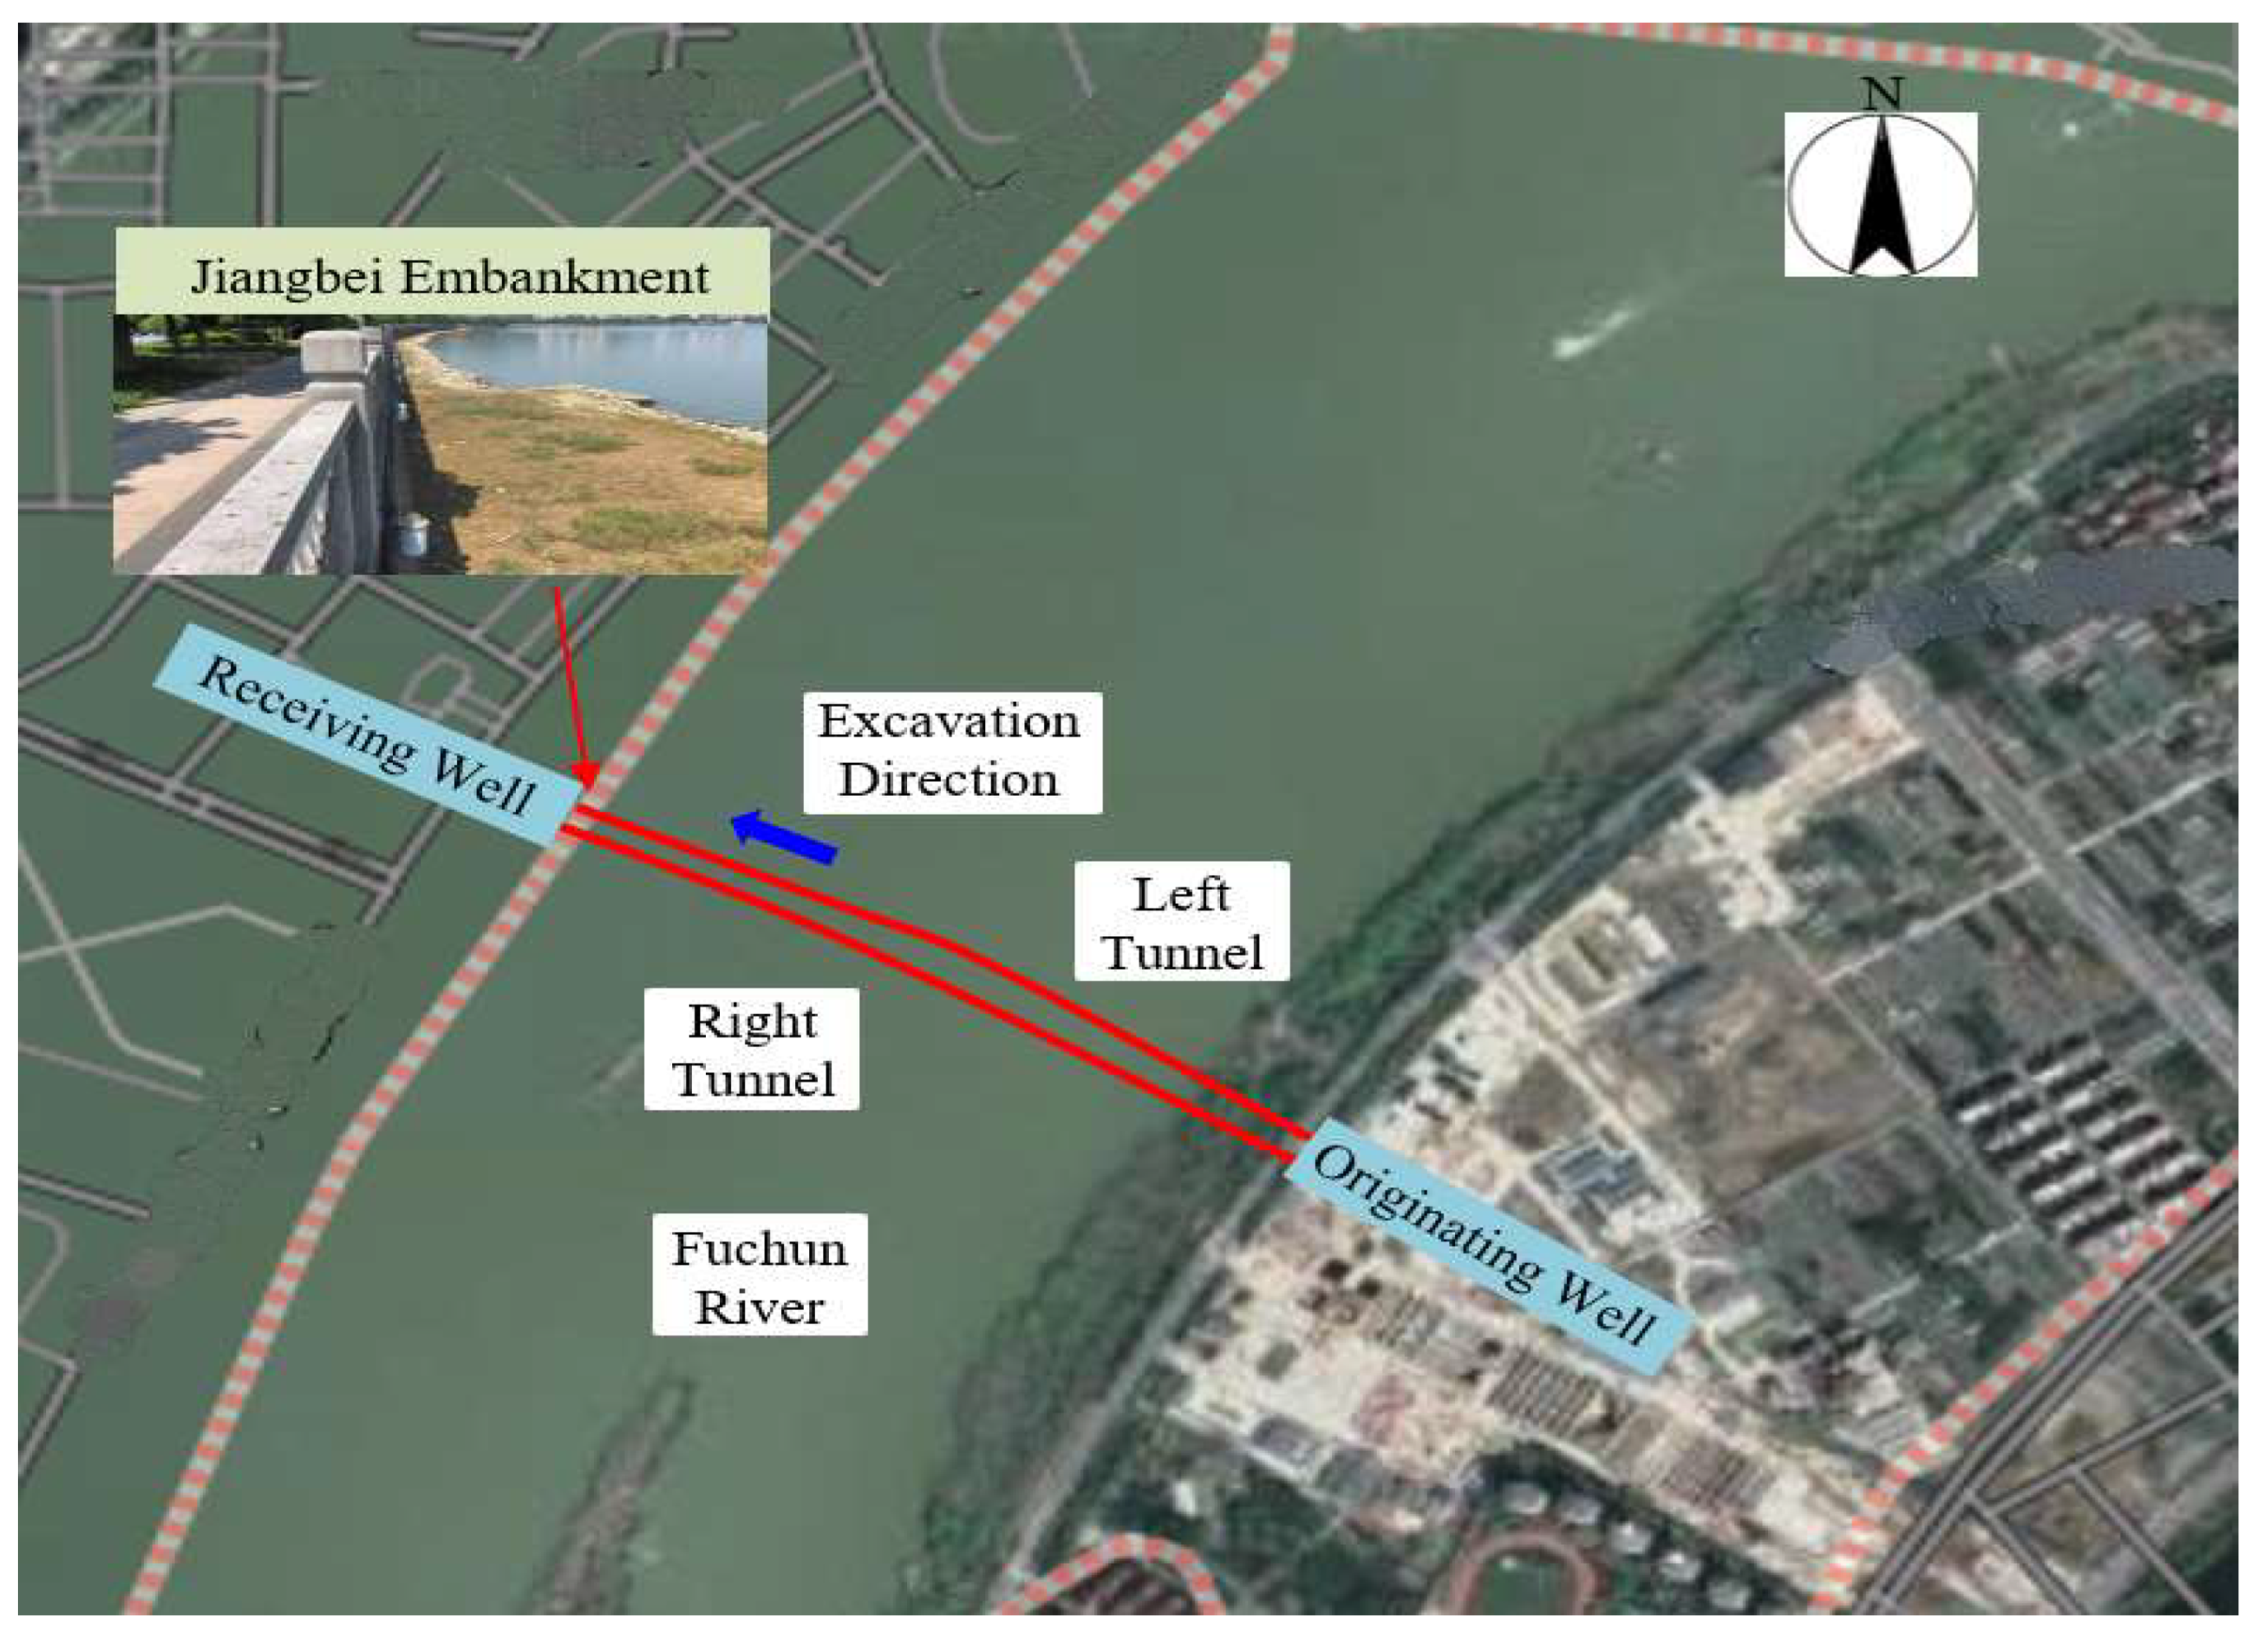
2. Project Overview
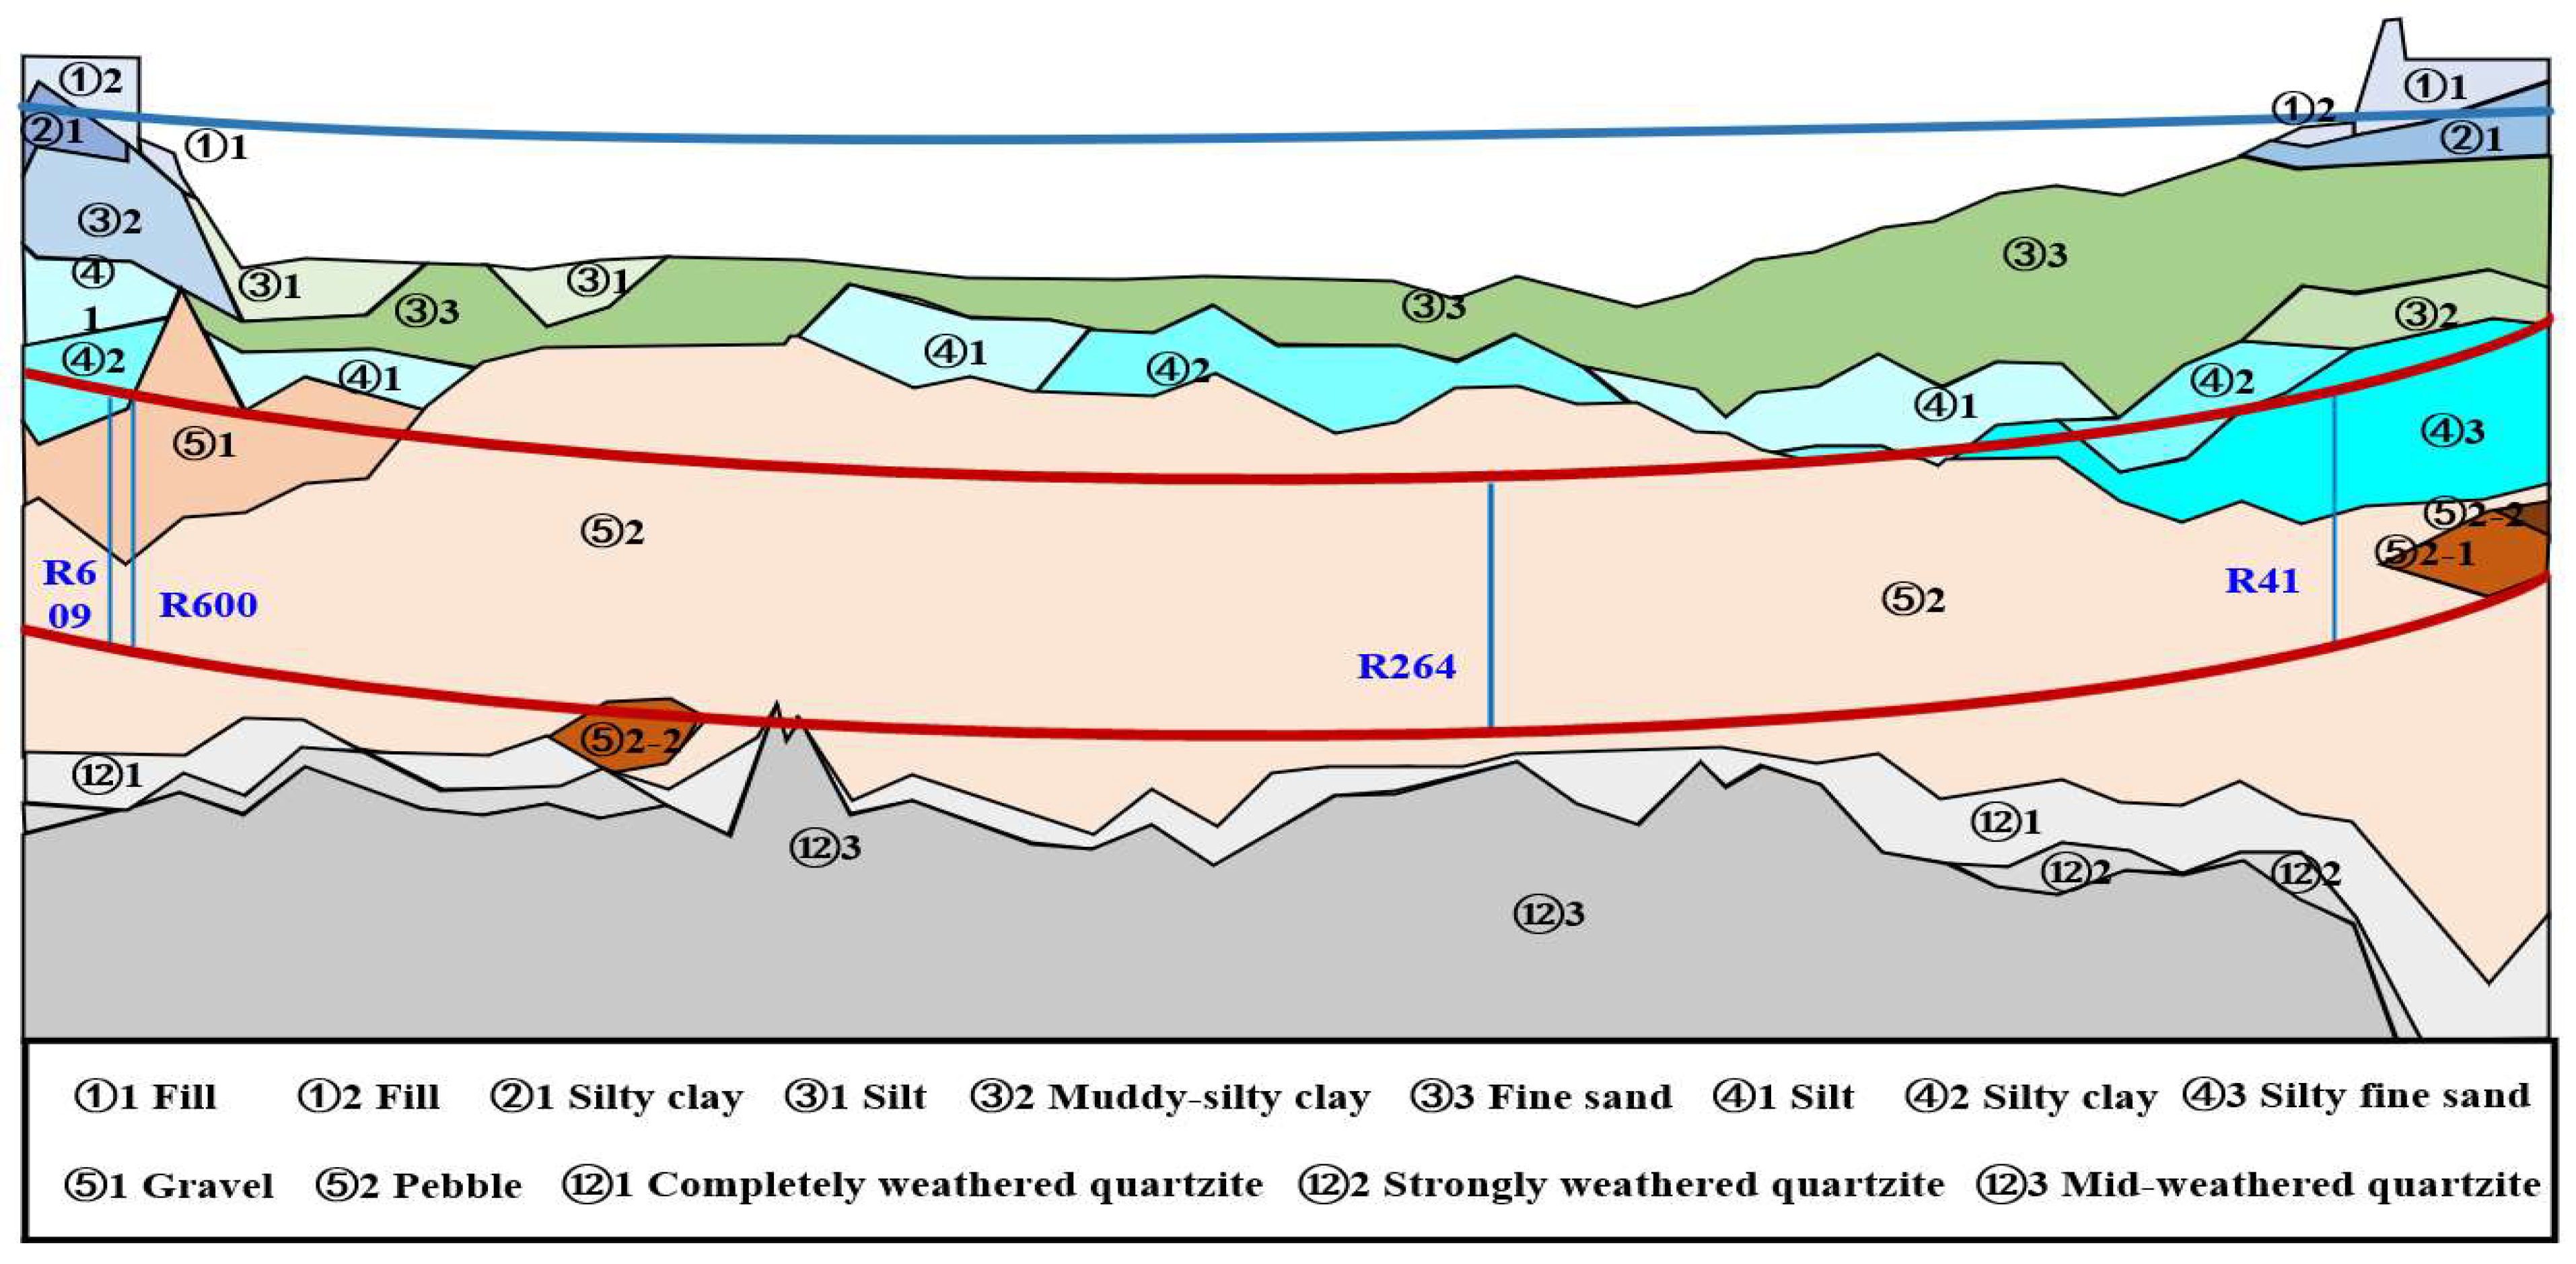
2.1. Project Background
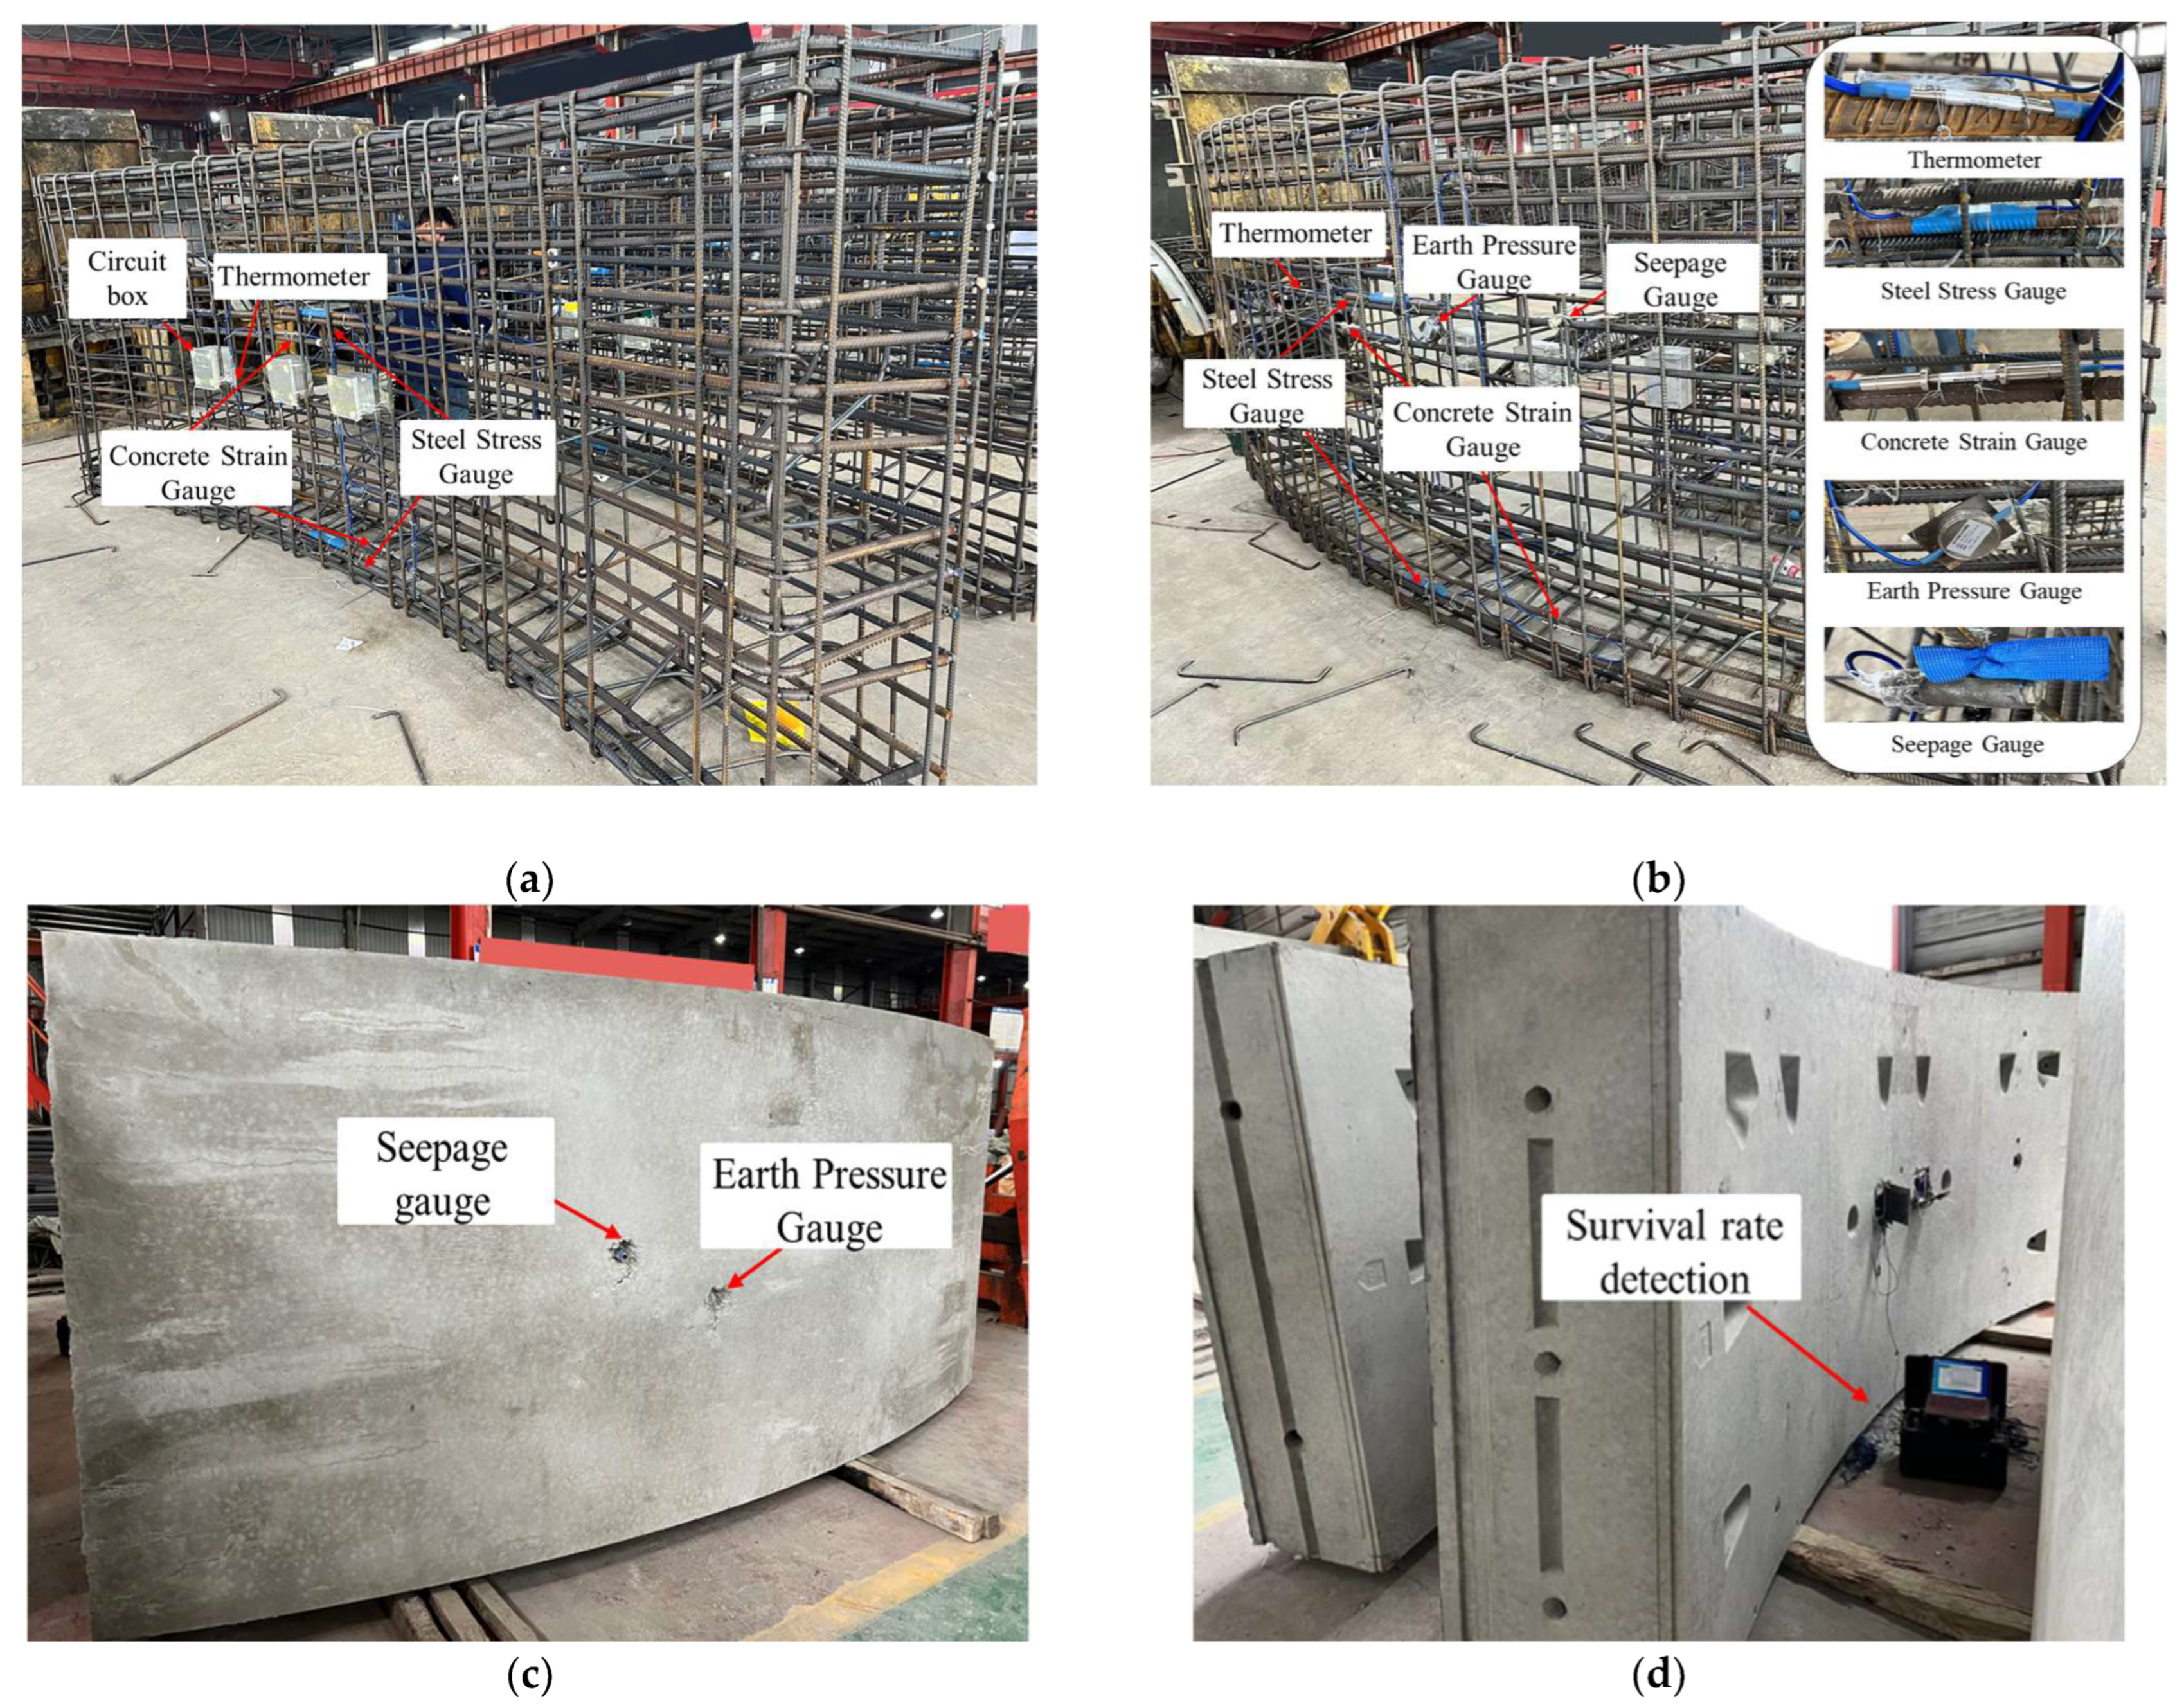
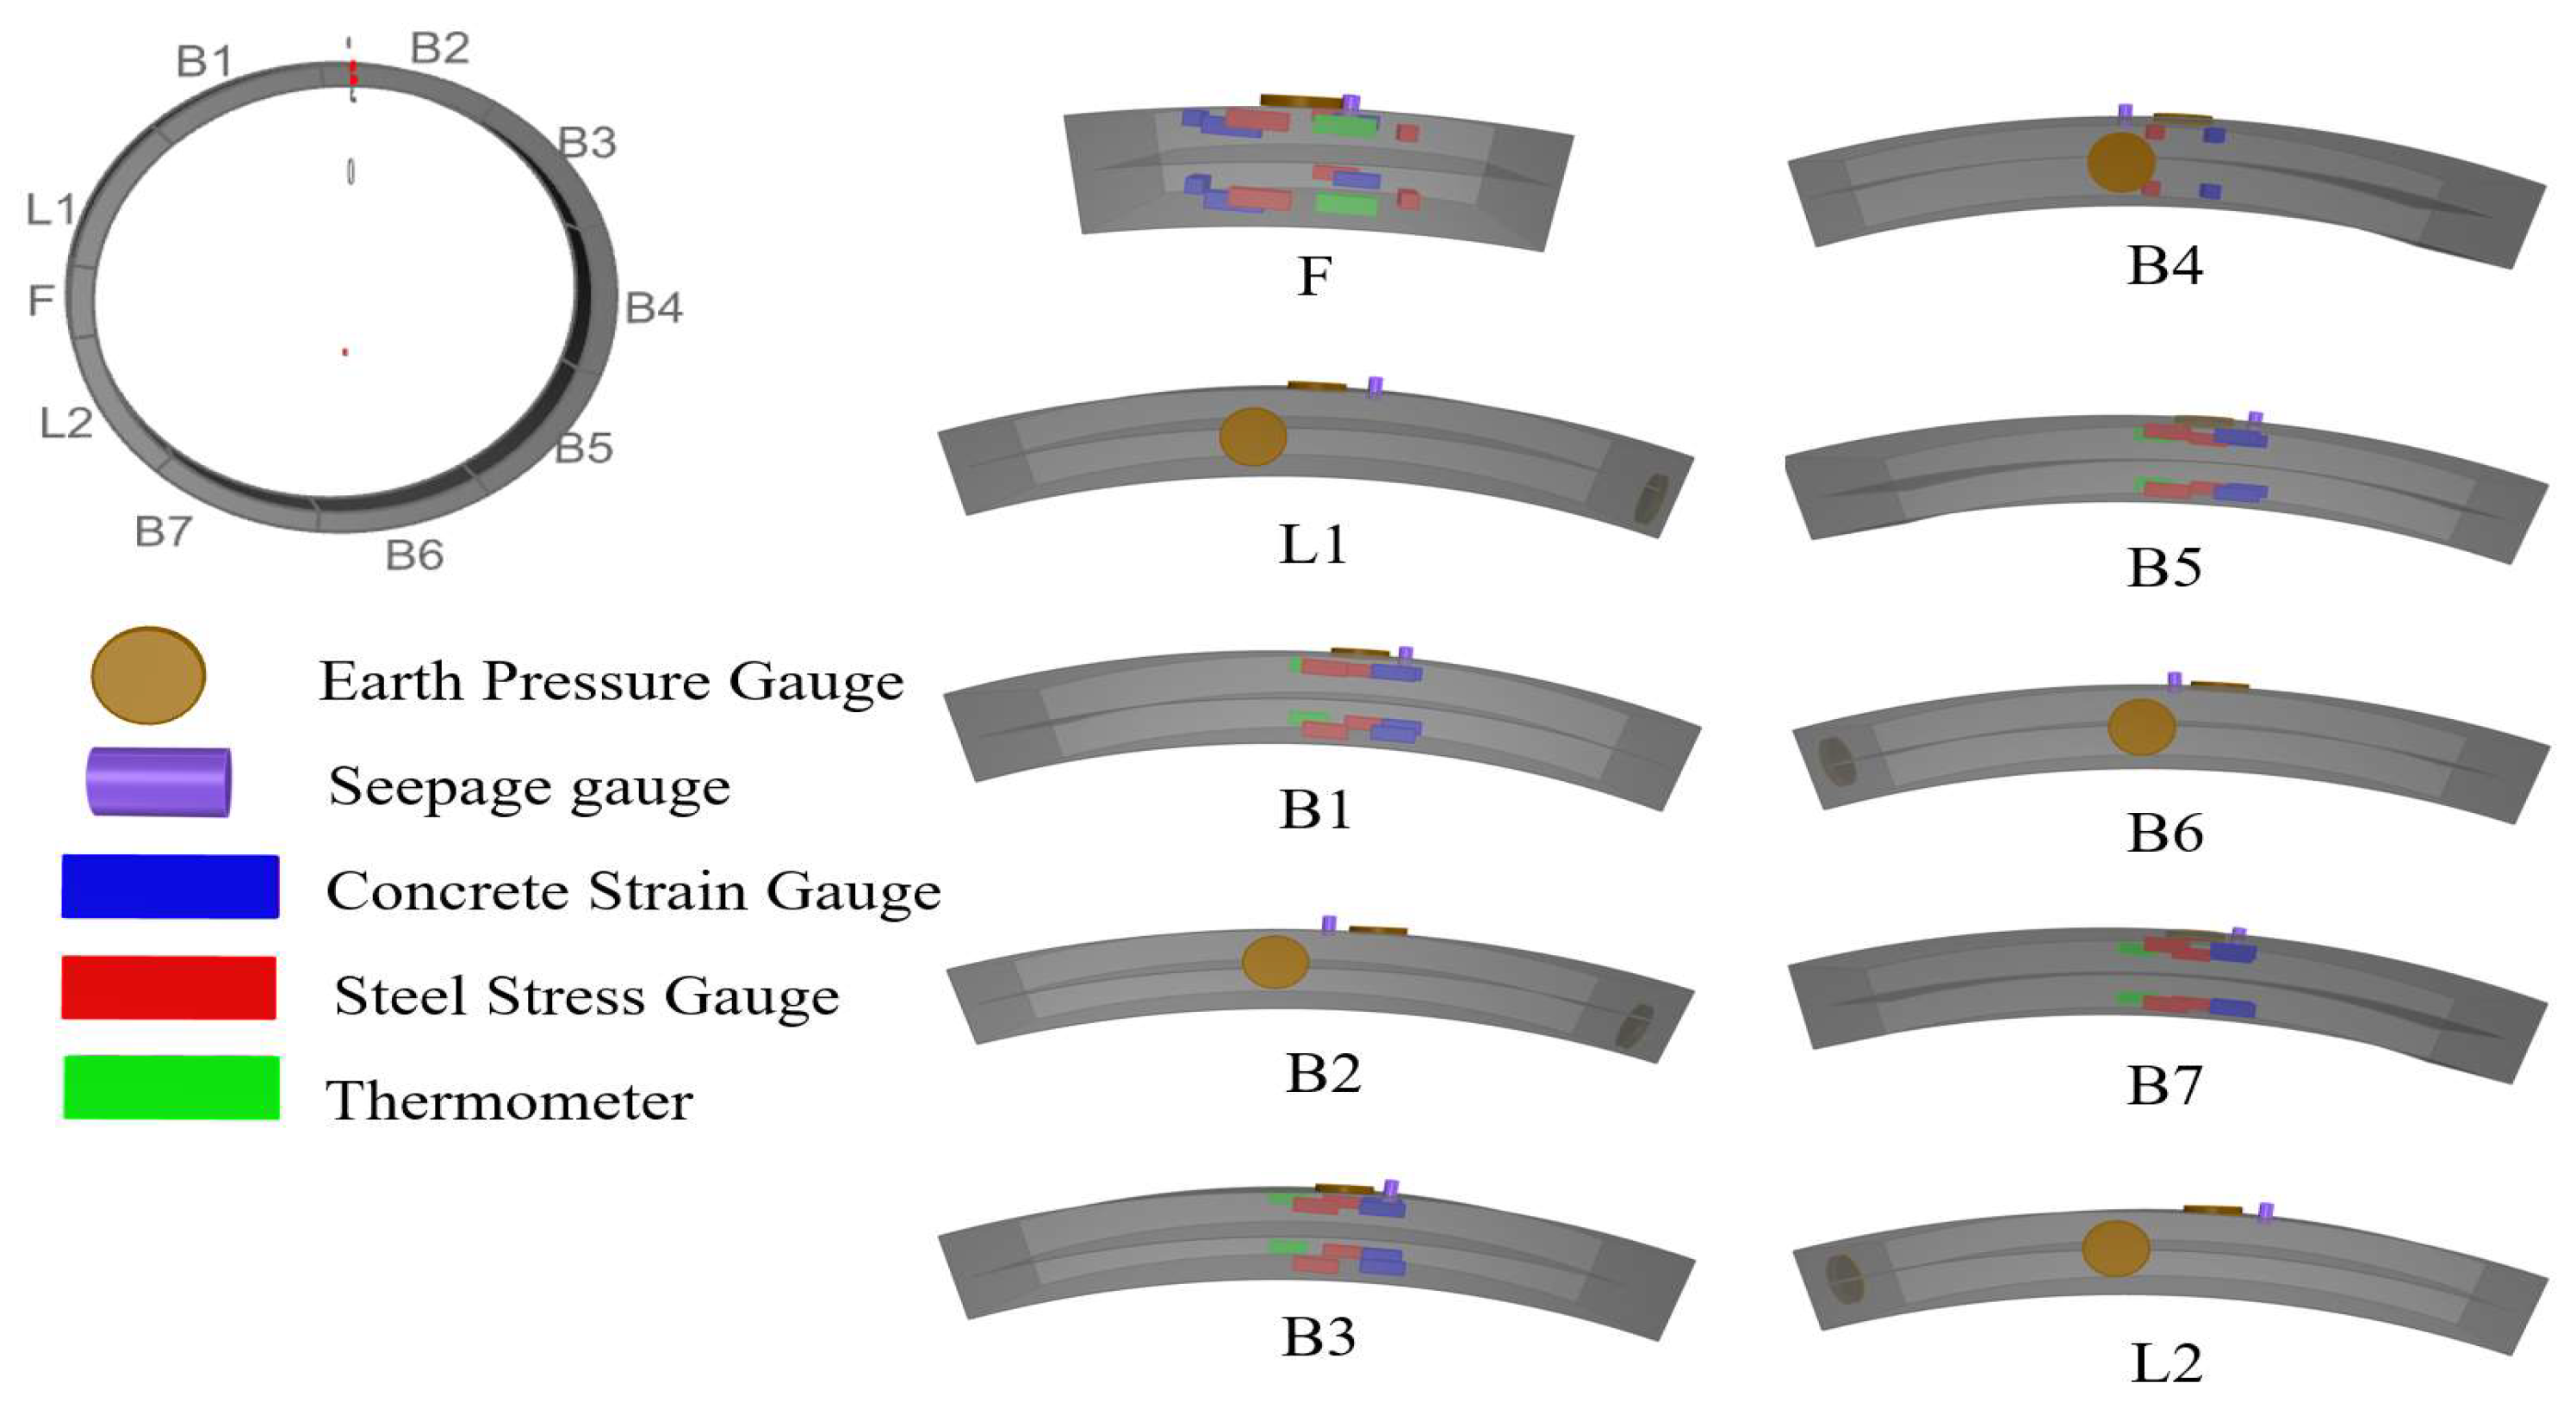
2.2. Design and Implementation of Monitoring System
3. Monitoring Results
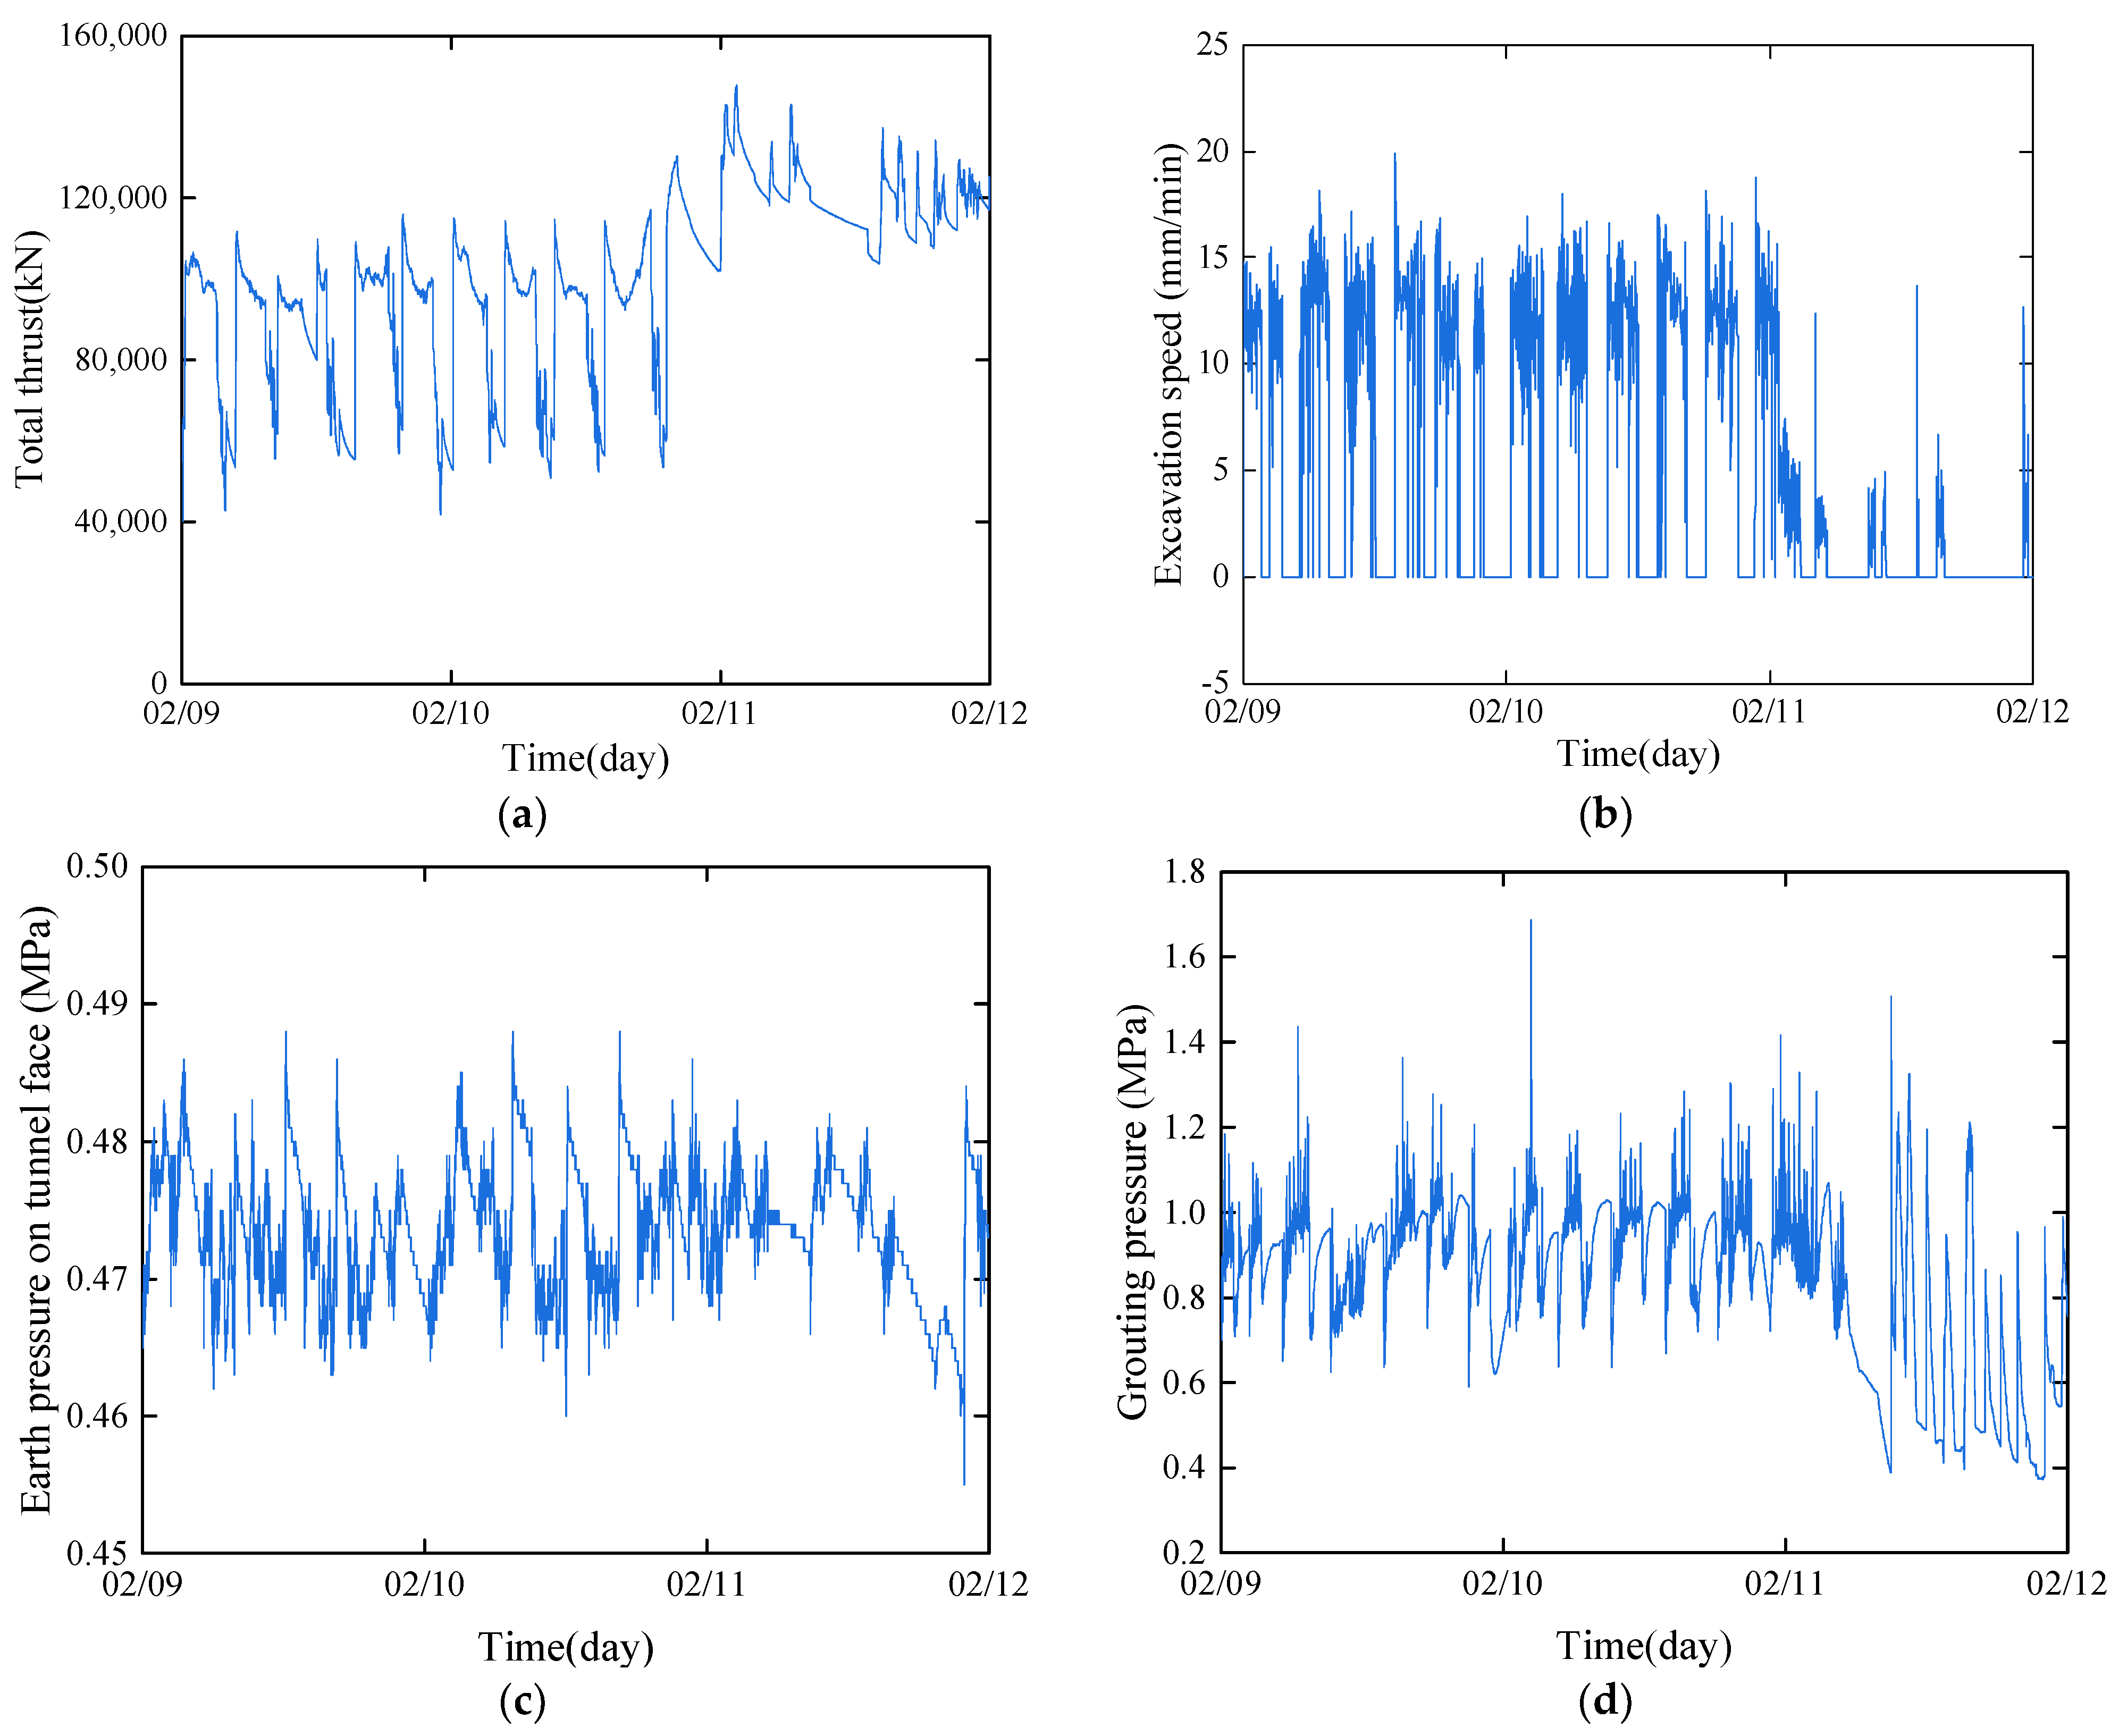
3.1. Shield Tunneling Parameters
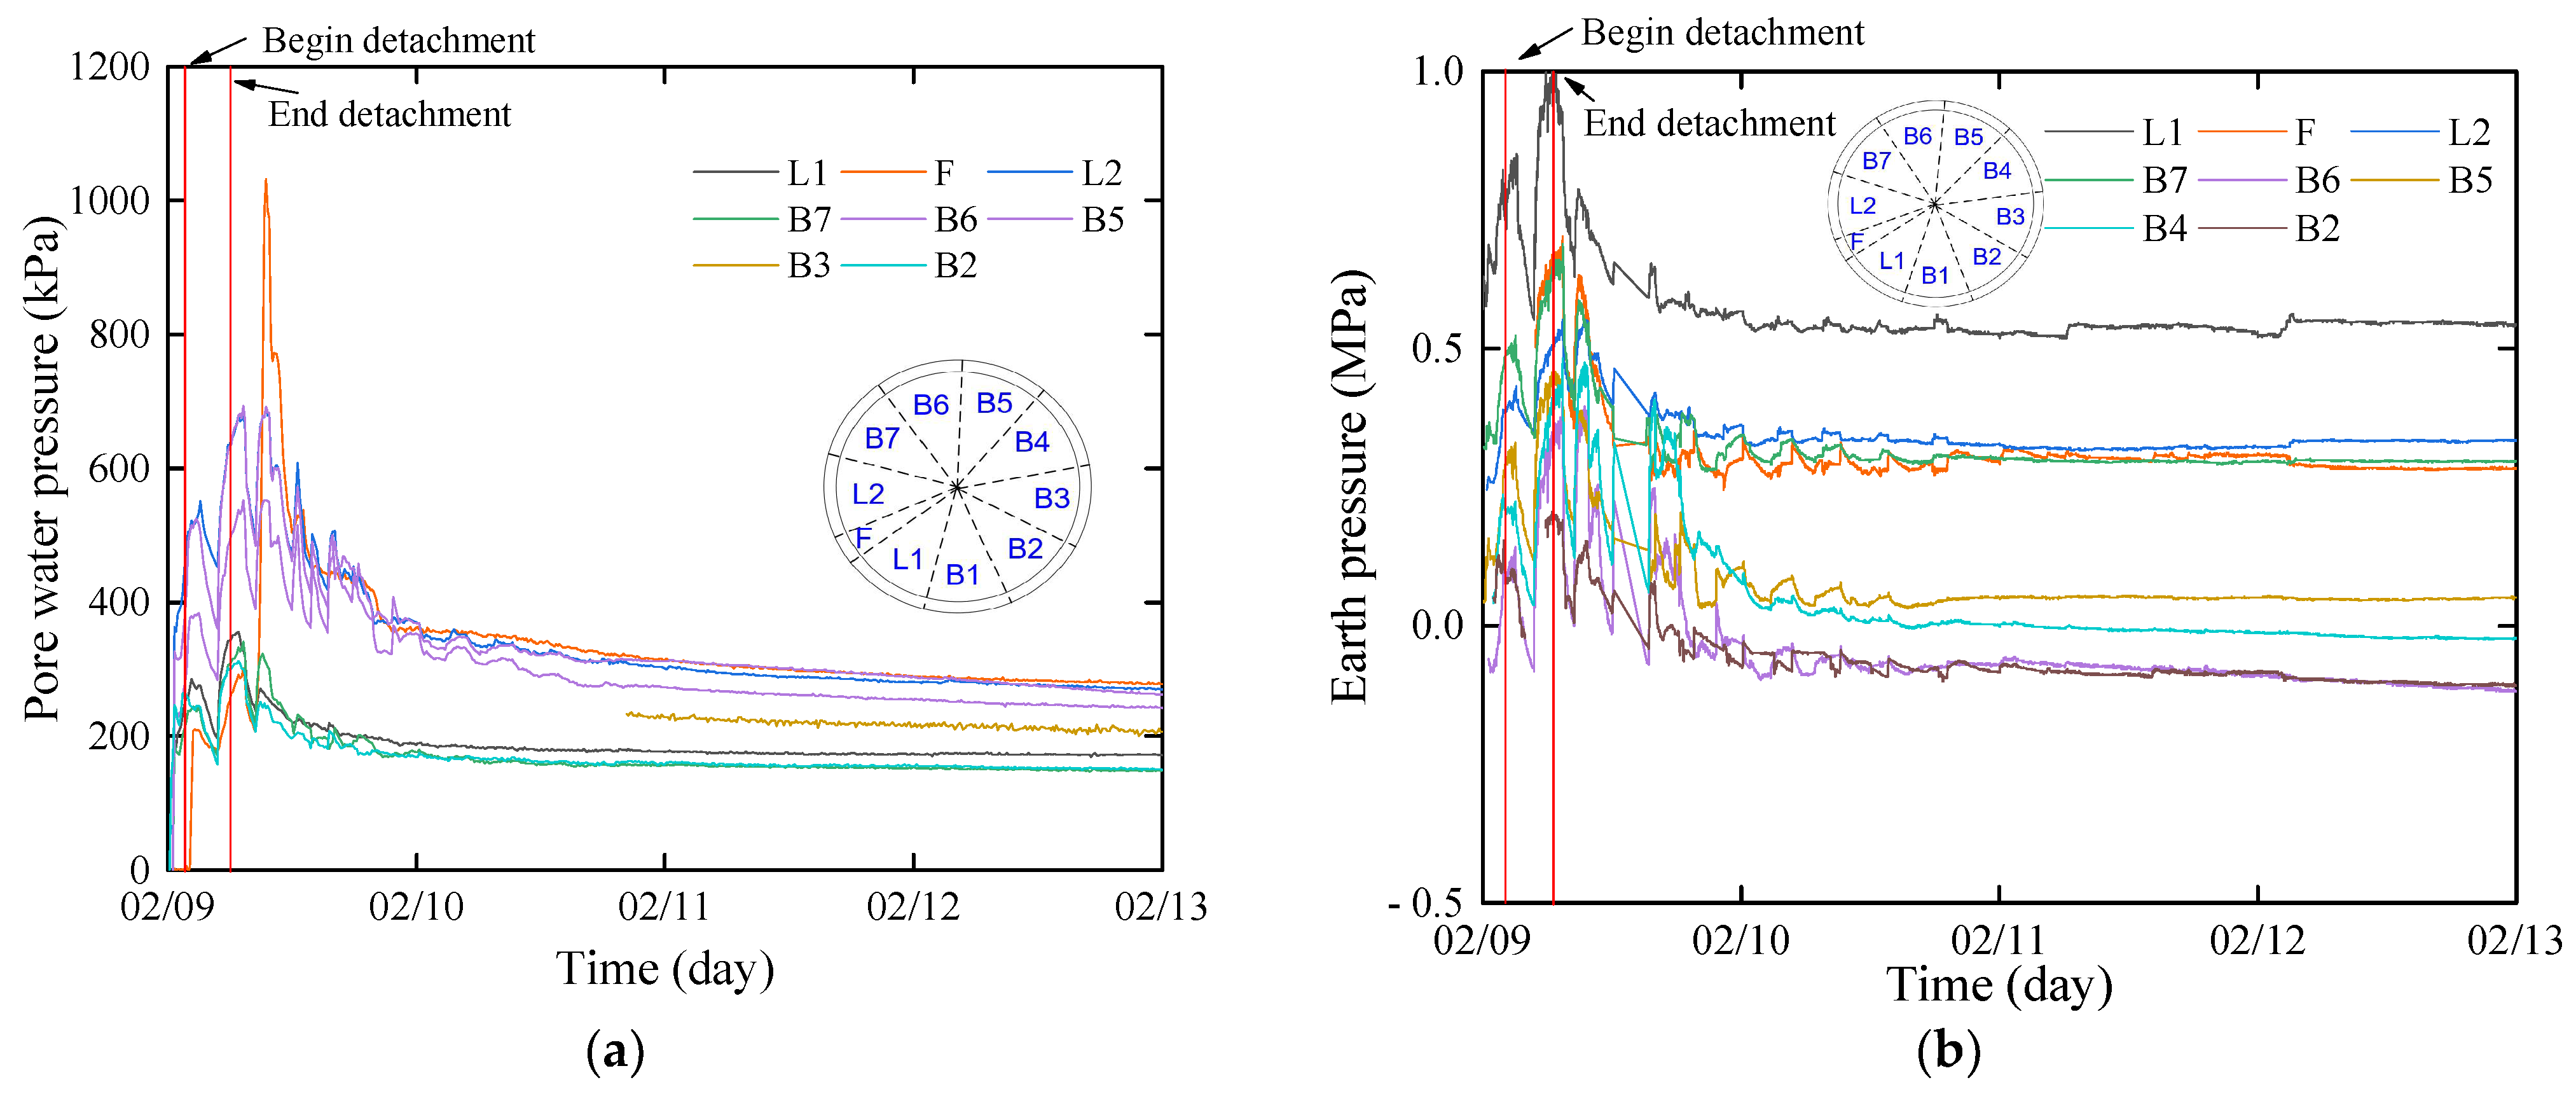
3.2. Water and Earth Pressure
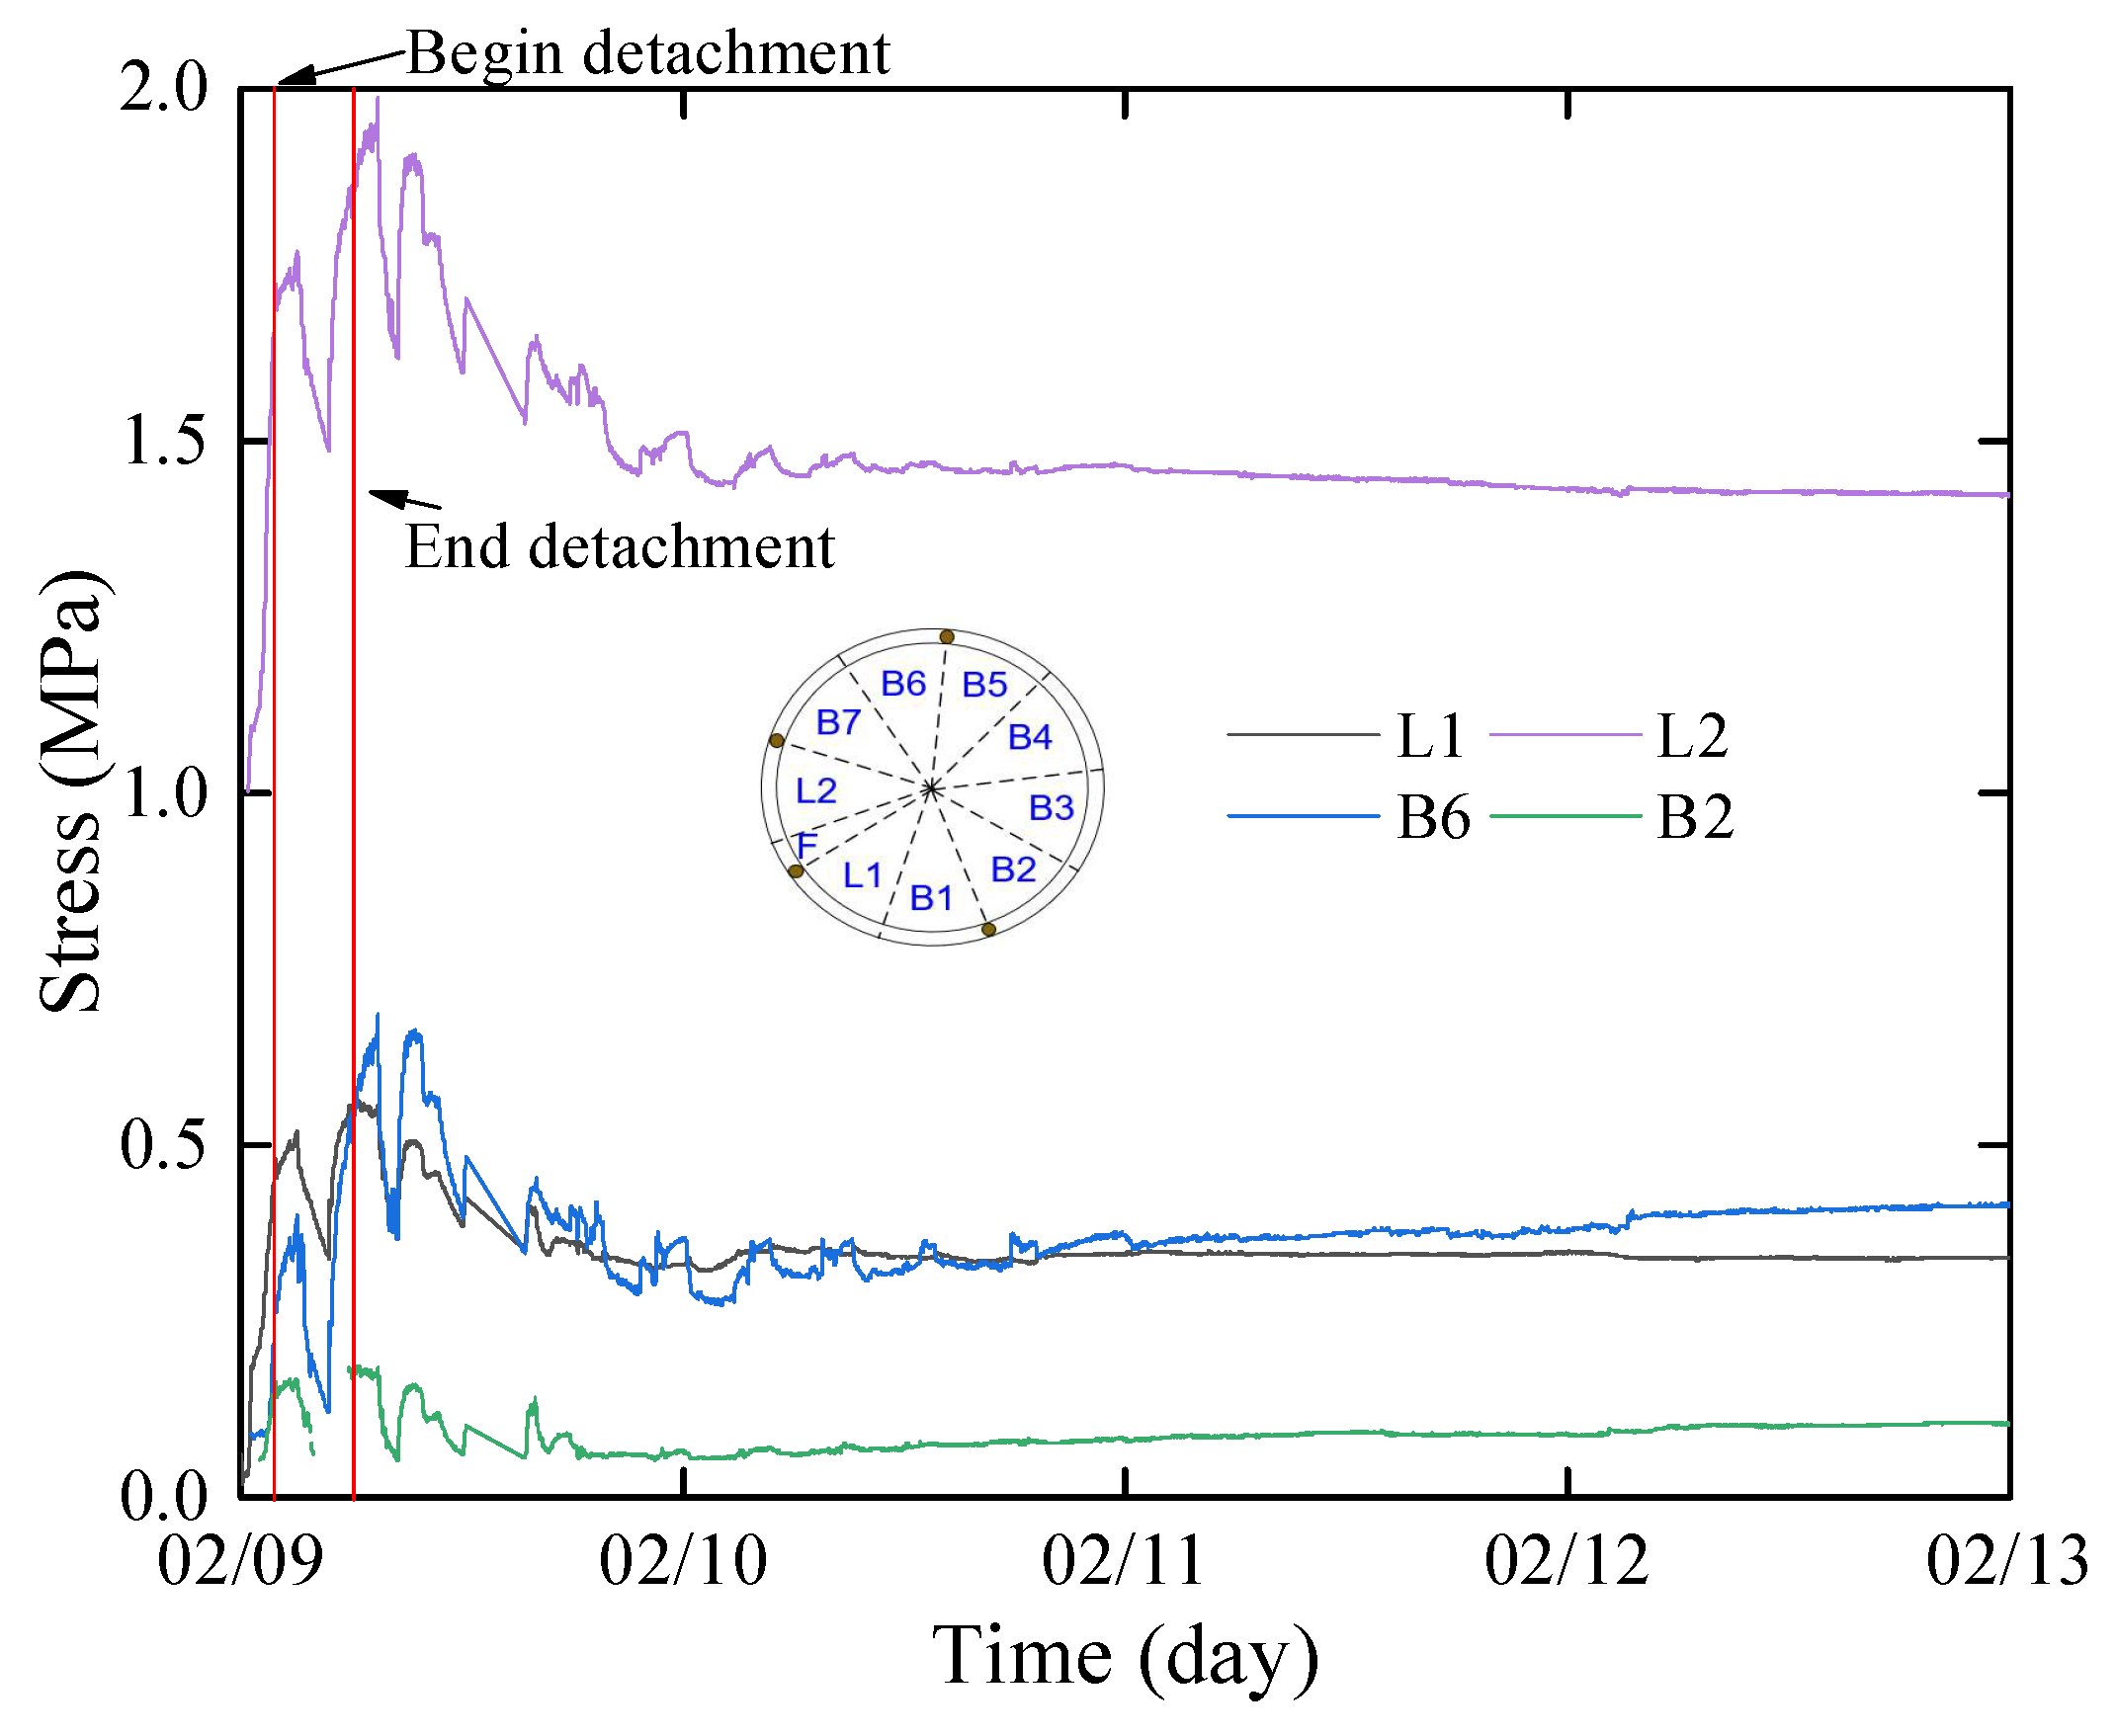
3.3. Stress between Blocks
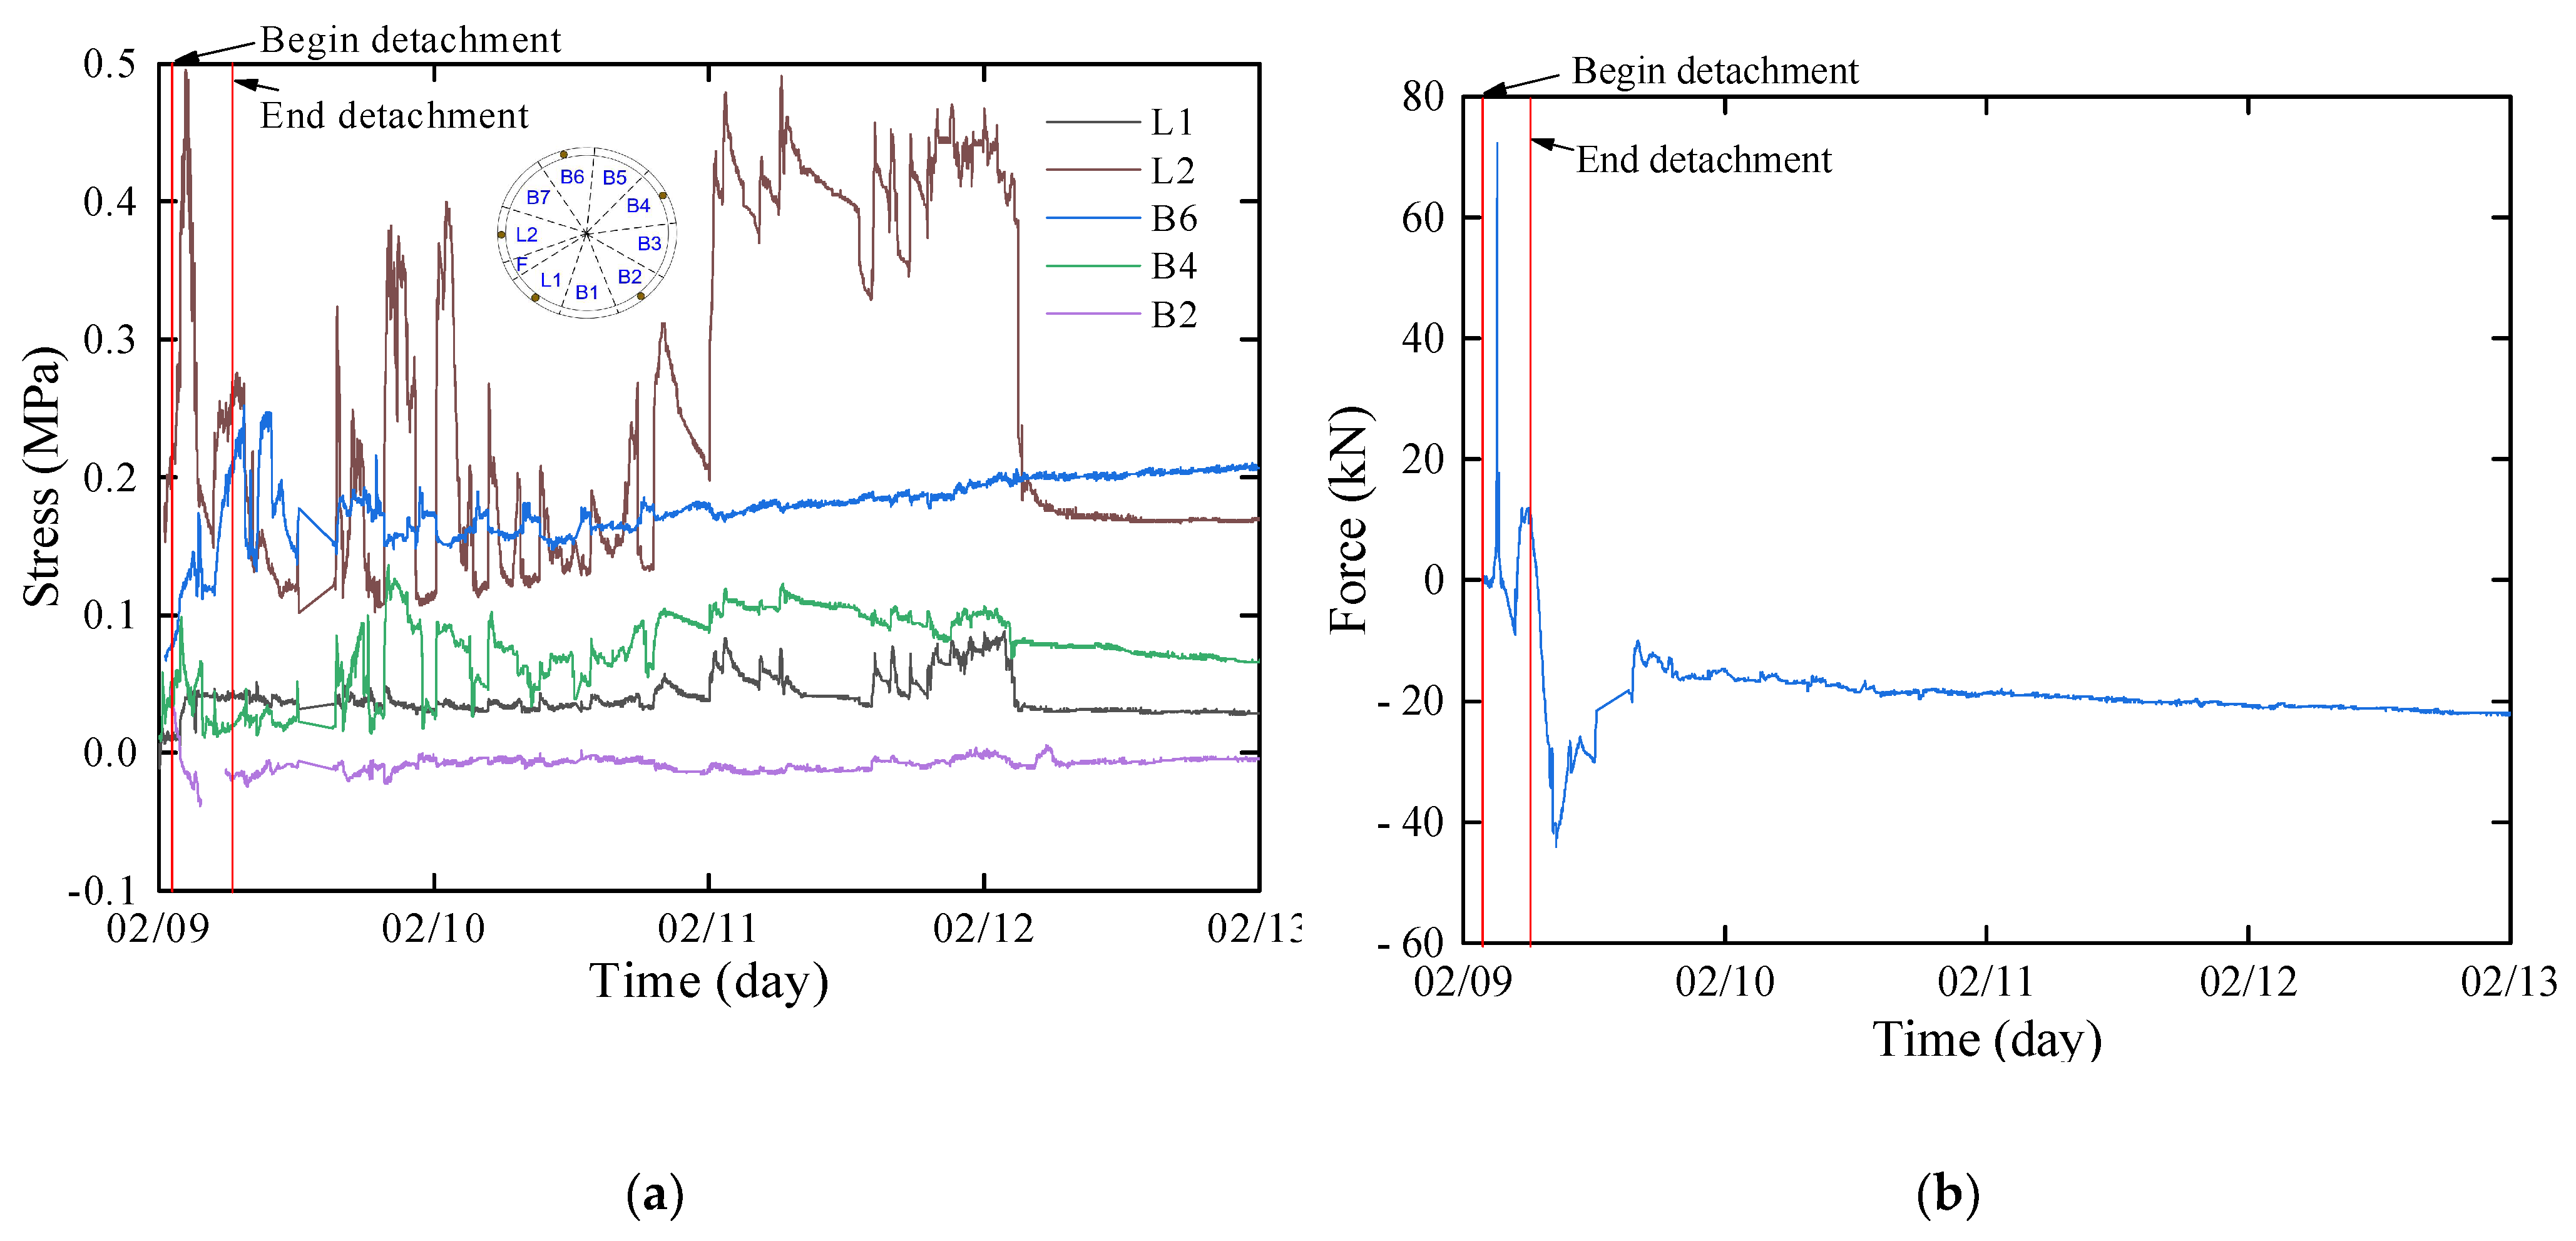
3.4. Stress between Segments
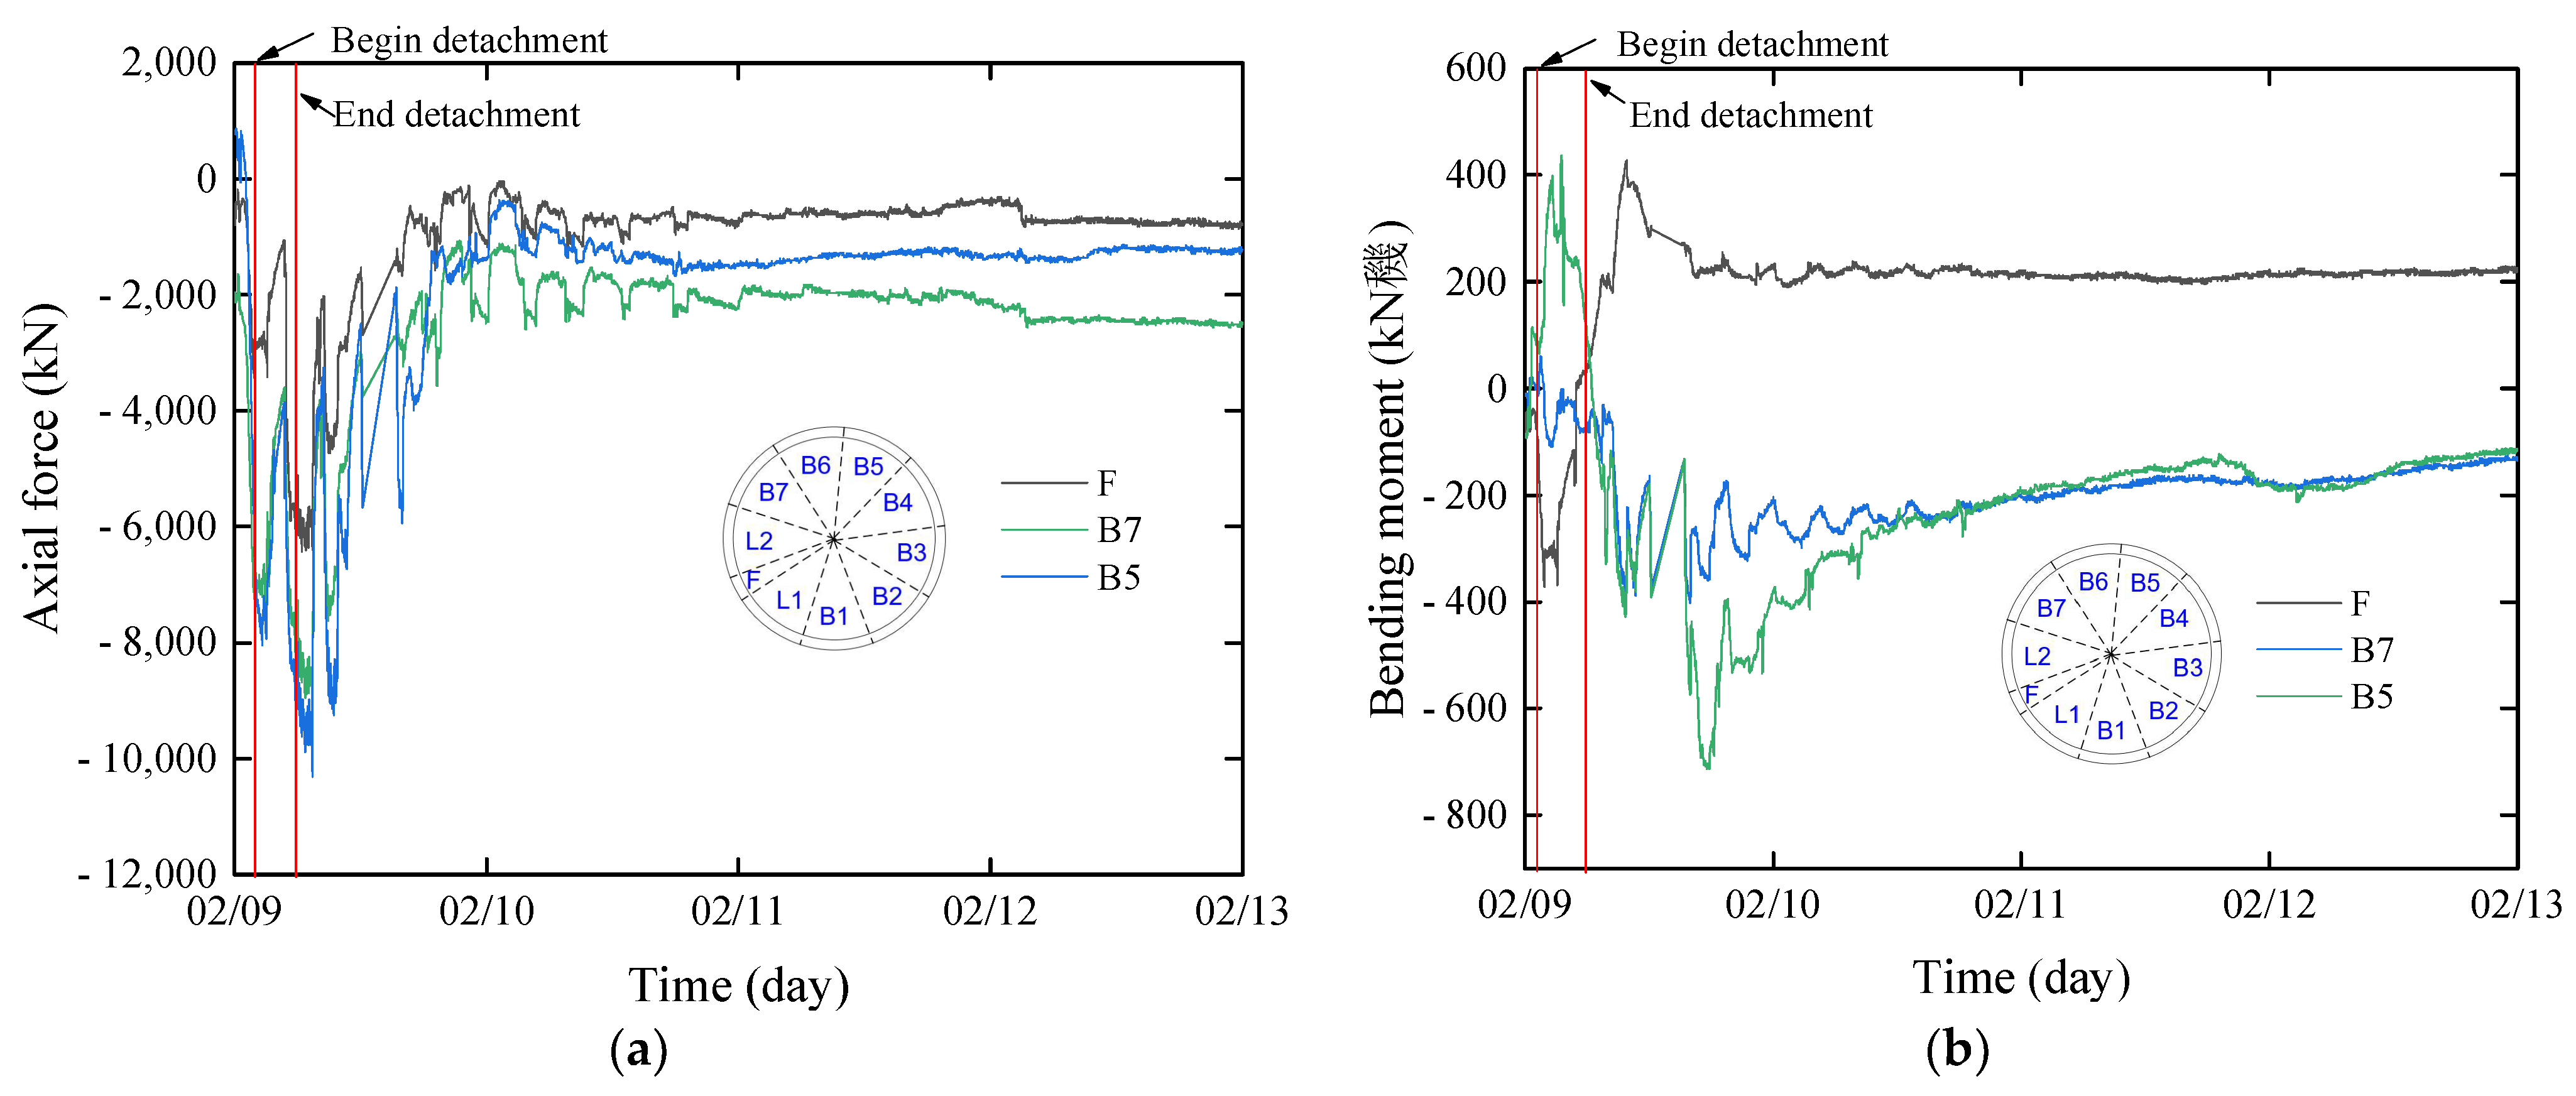
3.5. Internal Force of Segment
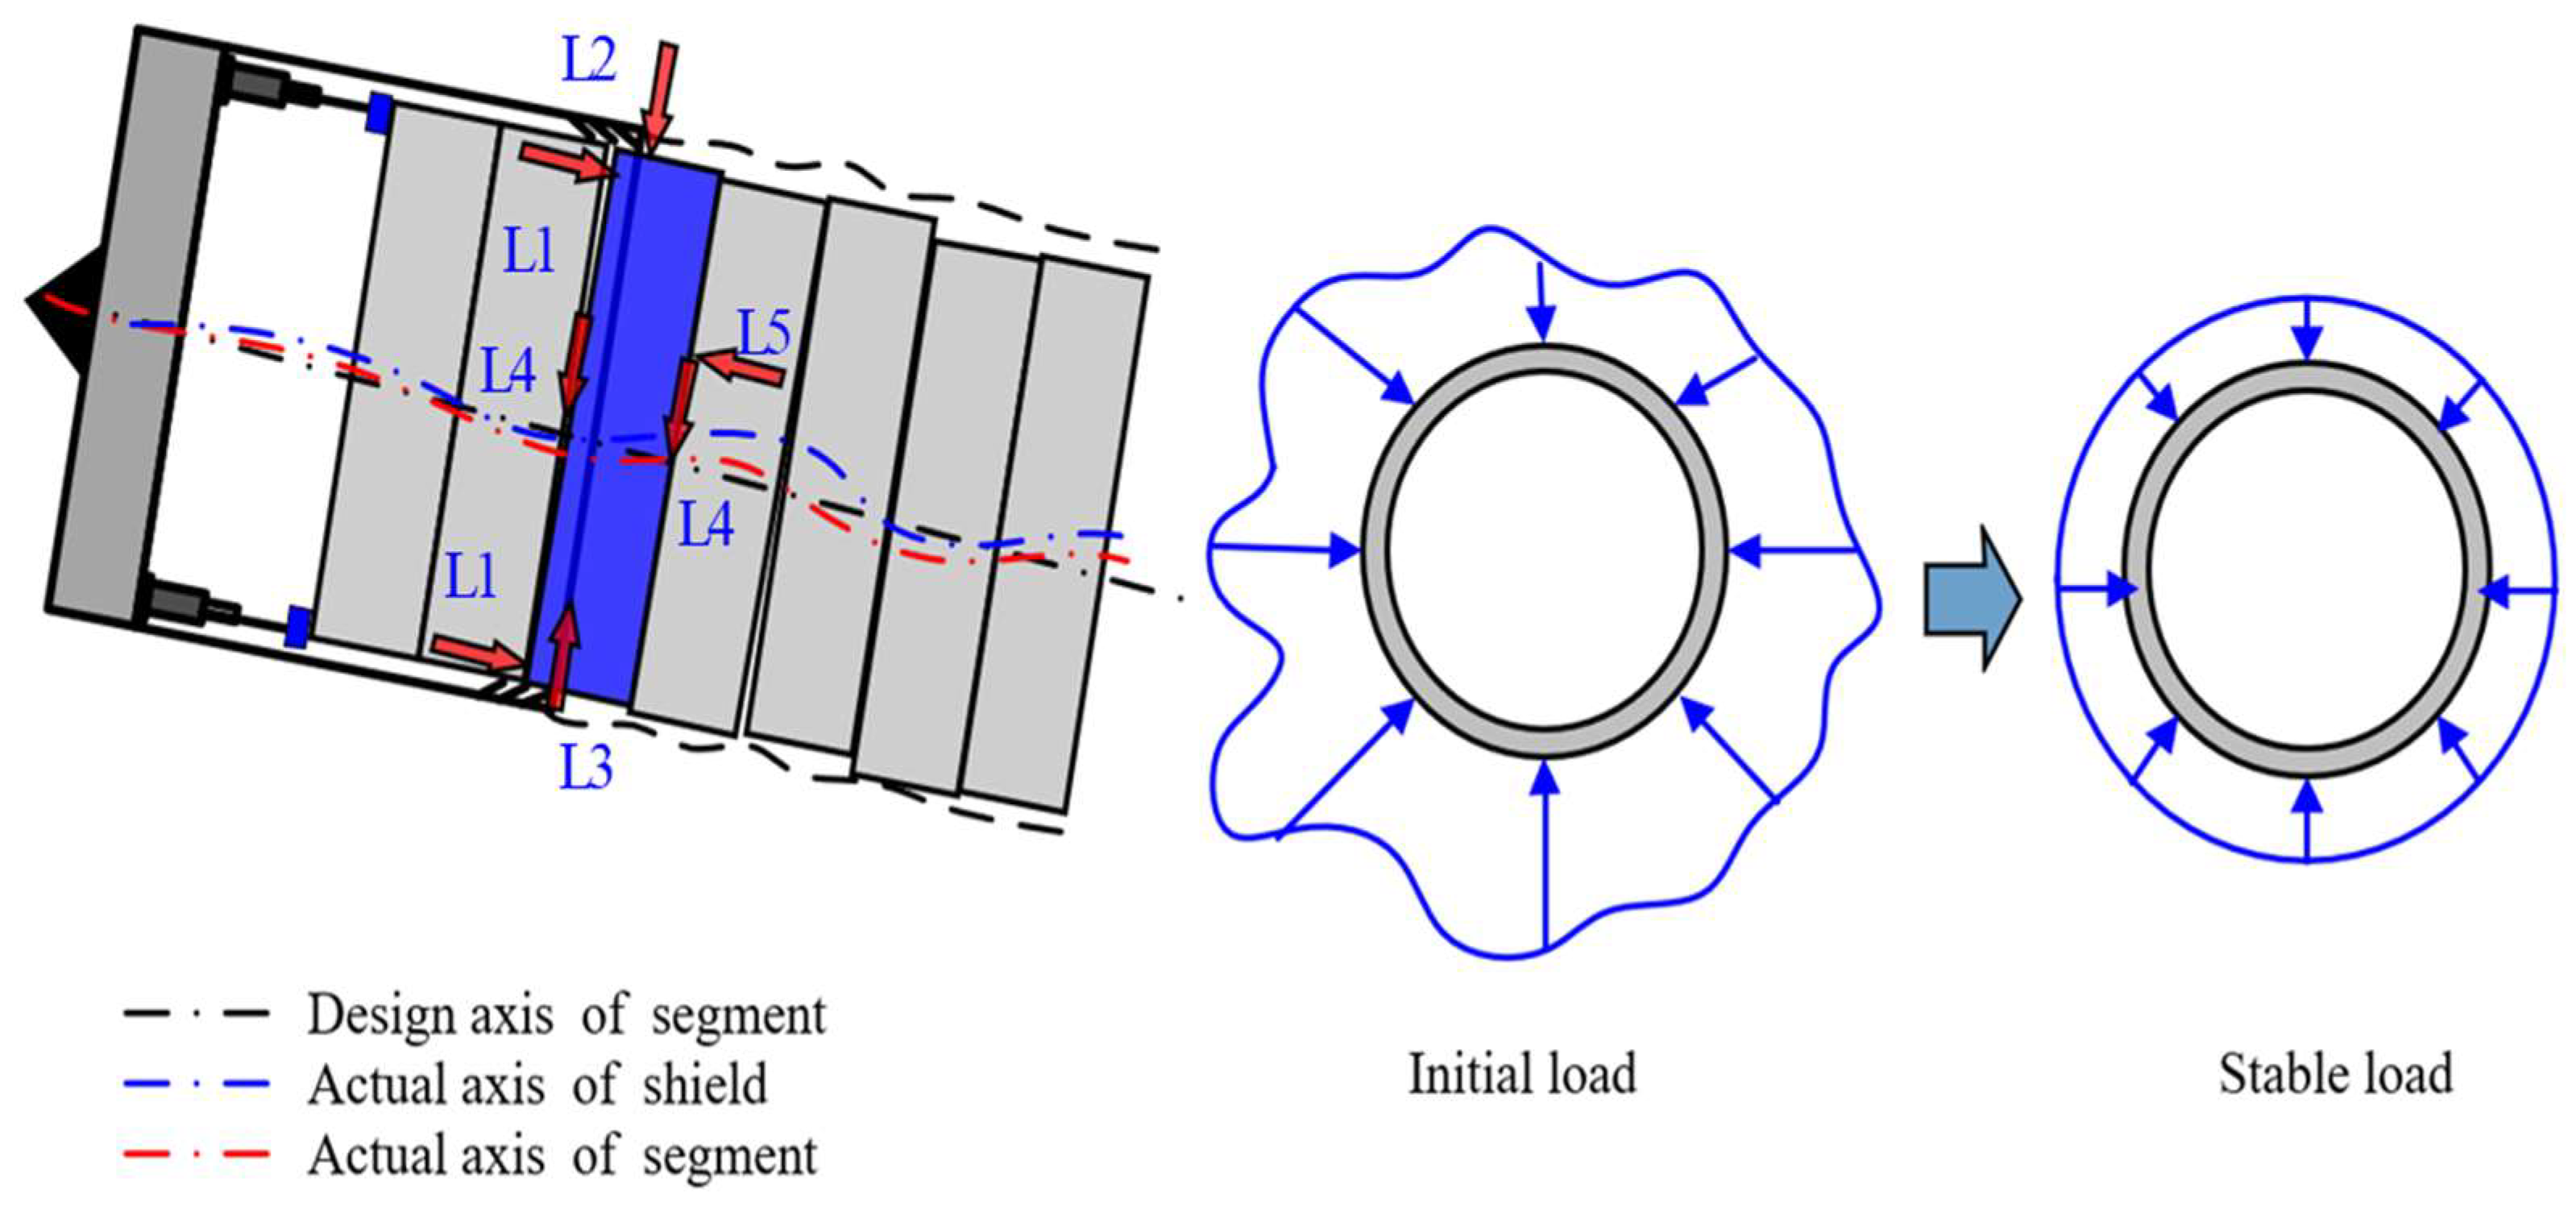
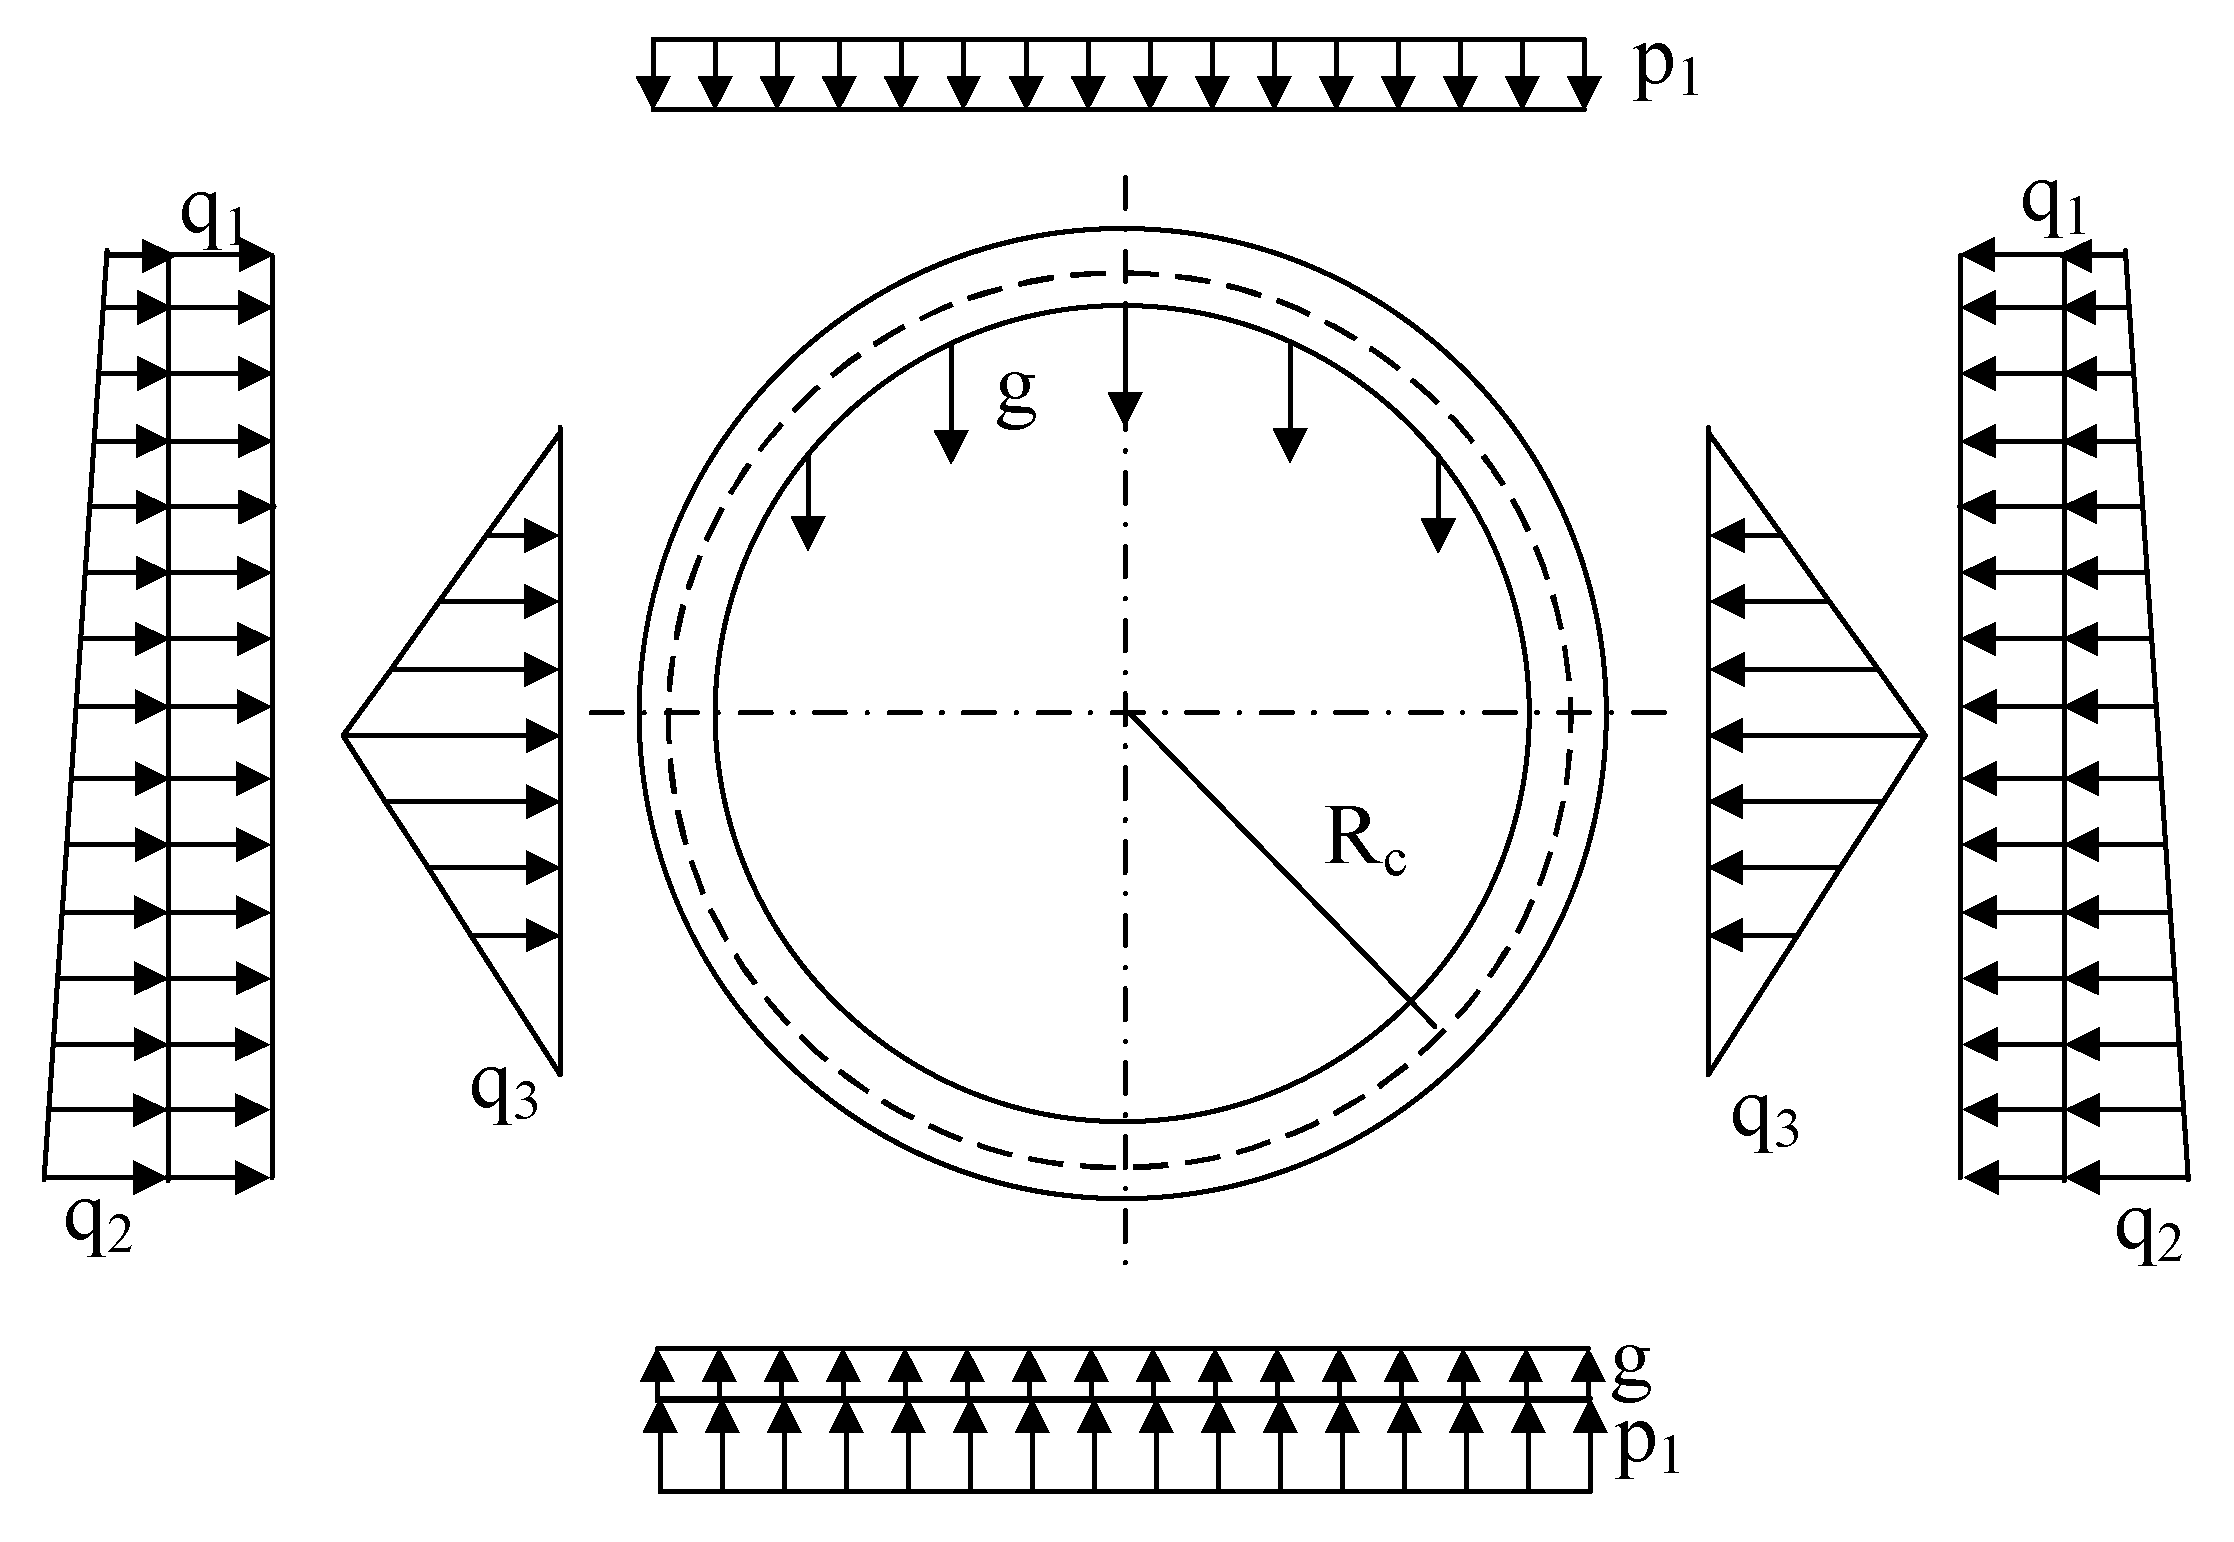
4. Inversion Analysis of Load
4.1. Objective Function of Inversion Analysis
4.2. Bayesian-Genetic Algorithm Inversion Analysis Model
4.3. Result of Inversion Analysis
5. Conclusions
Author Contributions
Funding
Institutional Review Board Statement
Informed Consent Statement
Data Availability Statement
Conflicts of Interest
References
- Jiang, H.; Cheng, J.G.; Zhang, J.X.; Zhang, J.L.; Su, Y.R.; Zheng, Y.F. Principle and application of in-situ monitoring system for ground displacement induced by shield tunnelling. Tunn. Undergr. Space Technol. 2021, 112, 103905. [Google Scholar] [CrossRef]
- Cui, Z.D.; Tan, J. Analysis of long-term settlements of Shanghai Subway Line 1 based on the in situ monitoring data. Nat. Hazards 2014, 75, 465–472. [Google Scholar] [CrossRef]
- Huang, X.; Liu, Q.S.; Liu, H.; Zhang, P.L.; Pan, S.L.; Zhang, X.P.; Fang, J.N. Development and in-situ application of a real-time monitoring system for the interaction between TBM and surrounding rock. Tunn. Undergr. Space Technol. 2018, 81, 187–208. [Google Scholar] [CrossRef]
- Zheng, G.; Cui, T.; Cheng, X.S.; Diao, Y.; Zhang, T.Q.; Sun, J.B.; Ge, L.B. Study of the collapse mechanism of shield tunnels due to the failure of segment in sandy ground. Eng. Fail. Anal. 2017, 79, 464–490. [Google Scholar] [CrossRef]
- Hu, Y.; Lei, H.Y.; Zheng, G.; Shi, L.; Zhang, T.Q.; Shen, Z.C.; Jia, R. Assessing the deformation response of double-track overlapped tunnels using numerical simulation and field monitoring. J. Rock Mech. Geotech. Eng. 2022, 14, 436–447. [Google Scholar] [CrossRef]
- Gue, C.Y.; Wilcock, M.J.; Alhaddad, M.M.; Elshafie, M.Z.E.B.; Soga, K.; Mair, R.J. Tunnelling close beneath an existing tunnel in clay—Perpendicular undercrossing. Géotechnique 2017, 67, 795–807. [Google Scholar] [CrossRef]
- Clayton, C.R.I.; Van Der Berg, J.P.; Thomas, A.H. Monitoring and displacements at Heathrow Express Terminal 4 station tunnels. Géotechnique 2006, 6, 323–334. [Google Scholar] [CrossRef]
- Wang, L.Z.; Sun, L.W.; Wang, Z.; Zhang, J. Field monitoring of a subsea shield tunnel during standpipe lifting. Tunn. Undergr. Space Technol. 2015, 45, 52–62. [Google Scholar] [CrossRef]
- Guo, W.; Wang, G.Q.; Bao, Y.; Li, P.F.; Zhang, M.J.; Gong, Q.M.; Li, R.; Gao, Y.; Zhao, R.B.; Shen, S.L. Detection and Monitoring of Tunneling-Induced Riverbed Deformation Using GPS and BeiDou: A Case Study. Appl. Sci. 2019, 9, 2759. [Google Scholar] [CrossRef]
- Wang, Y.Y.; Gu, Y.; Liu, J.L. A domain-decomposition generalized finite difference method for stress analysis in three-dimensional composite materials. Appl. Math. Lett. 2020, 104, 106226. [Google Scholar] [CrossRef]
- Kabir, H.; Aghdam, M.M. A robust Bézier based solution for nonlinear vibration and post-buckling of random checkerboard graphene nano-platelets reinforced composite beams. Compos. Struct. 2019, 212, 184–198. [Google Scholar] [CrossRef]
- Bert, C.W.; Malik, M. Differential quadrature: A powerful new technique for analysis of composite structures. Compos. Struct. 1997, 39, 179–189. [Google Scholar] [CrossRef]
- Callisto, L.; Ricci, C. Interpretation and back-analysis of the damage observed in a deep tunnel after the 2016 Norcia earthquake in Italy. Tunn. Undergr. Space Technol. 2019, 89, 238–248. [Google Scholar] [CrossRef]
- Fakhimi, A.; Salehi, D.; Mojtabai, N. Numerical back analysis for estimation of soil parameters in the Resalat Tunnel project. Tunn. Undergr. Space Technol. 2004, 19, 57–67. [Google Scholar] [CrossRef]
- Kim, J.; Kim, J.; Kim, M.; Yoo, H. Prediction of ground load by performing back analysis using composite support model in concrete lining design. KSCE J. Civ. Eng. 2015, 19, 1697–1706. [Google Scholar] [CrossRef]
- Sharifzadeh, M.; Tarifard, A.; Moridi, M.A. Time-dependent behavior of tunnel lining in weak rock mass based on displacement back analysis method. Tunn. Undergr. Space Technol. 2013, 38, 348–356. [Google Scholar] [CrossRef]
- Lee, J.K.; Yoo, H.; Ban, H.; Park, W. Estimation of Rock Load of Multi-Arch Tunnel with Cracks Using Stress Variable Method. Appl. Sci. 2020, 10, 3285. [Google Scholar] [CrossRef]
- Li, C.; Jiang, S.H.; Li, J.H.; Huang, J.S. Bayesian Approach for Sequential Probabilistic Back Analysis of Uncertain Geomechanical Parameters and Reliability Updating of Tunneling-Induced Ground Settlements. Adv. Civ. Eng. 2020, 2020, 8528304. [Google Scholar] [CrossRef]
- Yan, Q.X.; Zhang, W.L.; Zhang, C.; Chen, H.; Dai, Y.W.; Zhou, H.Y. Back Analysis of Water and Earth Loads on Shield Tunnel and Structure Ultimate Limit State Assessment: A Case Study. Arab. J. Sci. Eng. 2018, 44, 4839–4853. [Google Scholar] [CrossRef]
- Ye, X.W.; Zhang, X.L.; Chen, Y.M.; Wei, Y.J.; Ding, Y. Prediction of maximum upward displacement of shield tunnel linings during construction using particle swarm optimization-random forest algorithm. J. Zhejiang Univ.-Sci. A 2023, 41, 101002. [Google Scholar] [CrossRef]
- Ye, X.W.; Jin, T.; Chen, Y.M. Machine learning-based forecasting of soil settlement induced by shield tunneling construction. Tunn. Undergr. Space Technol. 2022, 124, 104452. [Google Scholar] [CrossRef]
- Ye, X.W.; Zhang, X.L.; Zhang, H.Q.; Ding, Y.; Chen, Y.M. Prediction of lining upward movement during shield tunneling using machine learning algorithms and field monitoring data. Transp. Geotech. 2023, 41, 101002. [Google Scholar] [CrossRef]
- Niu, H.S.; Weng, X.L.; Tian, C.; Wang, D.; Hao, X. Model Test and Back Analysis of Shield Tunnel Load Distribution in Soft Clay. Adv. Mater. Sci. Eng. 2021, 2021, 9992348. [Google Scholar] [CrossRef]
- Vardakos, S.; Gutierrez, M.; Xia, C. Back-Analysis of Tunnel Response from Field Monitoring Using Simulated Annealing. Rock Mech. Rock Eng. 2016, 49, 4833–4852. [Google Scholar] [CrossRef]
- Yu, F.W.; Peng, X.Z.; Su, L.J. A back-propagation neural-network-based displacement back analysis for the identification of the geomechanical parameters of the Yonglang landslide in China. J. Mt. Sci. 2017, 14, 1739–1750. [Google Scholar] [CrossRef]
- Zhao, Y.; Feng, S.J. Integrated analysis of in situ stress for tunneling underneath a municipal solid waste landfill. Bull. Eng. Geol. Environ. 2023, 82, 424. [Google Scholar] [CrossRef]
- Wang, M.N.; Huang, H.B.; Cao, J.W.; Liu, D.G. Field Tests on Mechanical Behavior of Segmental Linings Inside Shell of Large Diameter Shield Tunnel. J. Railw. Eng. Soc. 2021, 43, 175–182. [Google Scholar]
- Wu, S.Z.; Hu, X.Y.; Fu, W.; Li, K.J. Evaluation of segmental lining response during shield tunnel construction based on field measurements and 3D FEM simulation. Transp. Geotech. 2024, 44, 101135. [Google Scholar] [CrossRef]
- Mo, H.H.; Chen, J.S. Study on inner force and dislocation of segments caused by shield machine attitude. Tunn. Undergr. Space Technol. 2008, 23, 281–291. [Google Scholar] [CrossRef]
- Liao, S.M.; Men, Y.Q.; Zhang, D.; Xu, Y. Field tests on mechanical behaviors during assembly of segmental linings of Qianjiang tunnel. Chin. J. Geotech. 2015, 1, 156–164. [Google Scholar]
- Ding, W.Q.; Yue, Z.Q.; Tham, L.G.; Zhu, H.H.; Lee, C.F.; Hashimoto, T. Analysis of shield tunnel. Int. J. Numer. Anal. Methods Geomech. 2004, 28, 57–91. [Google Scholar] [CrossRef]
- Feng, K.; Li, M.R.; Cao, X.P.; Peng, Z.Z.; Xu, K. Load Inversion Analysis of Underwater Full-Section Sandstone Shield Tunnel Based on Genetic Algorithm. Railw. Stand. Des. 2023, 67, 107–115. [Google Scholar]
- Zhong, X.C.; Zhu, W. Back analysis of soil pressure acting on shield lining segment. Rock Soil Mech. 2006, 10, 1743–1748. [Google Scholar]
- Ghamisi, P.; Benediktsson, J.A. Feature Selection Based on Hybridization of Genetic Algorithm and Particle Swarm Optimization. IEEE Geosci. Remote Sens. Lett. 2015, 12, 309–313. [Google Scholar] [CrossRef]
- Gong, D.W.; Sun, J.; Miao, Z. A Set-Based Genetic Algorithm for Interval Many-Objective Optimization Problems. IEEE Trans. Evol. Comput. 2018, 22, 47–60. [Google Scholar] [CrossRef]
- Katoch, S.; Chauhan, S.S.; Kumar, V. A review on genetic algorithm: Past, present, and future. Multimed Tools Appl. 2021, 80, 8091–8126. [Google Scholar] [CrossRef]
- Kou, G.; Xiao, H.; Cao, M.H.; Lee, L.H. Optimal computing budget allocation for the vector evaluated genetic algorithm in multi-objective simulation optimization. Automatica 2021, 129, 109599. [Google Scholar] [CrossRef]
- Sun, D.L.; Wen, H.J.; Wang, D.Z.; Xu, J.H. A random forest model of landslide susceptibility mapping based on hyperparameter optimization using Bayes algorithm. Geomorphology 2020, 362, 107201. [Google Scholar] [CrossRef]
- Yang, L.; Shami, A. On hyperparameter optimization of machine learning algorithms: Theory and practice. Neurocomputing 2020, 415, 295–316. [Google Scholar] [CrossRef]


| Measuring Content | Sensors | Range | Resolution | Accuracy |
|---|---|---|---|---|
| Earth pressure and segment pressure | Earth pressure gauge | 0~2000 kPa | 1 kPa | 10 kPa |
| Concrete stress | Concrete strain gauge | −1500~1500 με | 0.1 με | ±1 με |
| Steel stress | Steel stress gauge | 0~400 MPa | 2 kPa | 10 kPa |
| Internal force of bolts | Bolt stress gauge | 0~550 kN | 0.5 kN | 3 kN |
| Pore water pressure | Seepage gauge | 0~1000 kPa | 0.25 kPa | 1 kPa |
| Soil | Unit Weight (kN/m2) | Cohesion (kPa) | Friction (°) | Earth Pressure Coefficient | Thickness (m) |
|---|---|---|---|---|---|
| Fill | 19 | 10 | 10 | 0.6 | 5.25 |
| Muddy–silty clay | 18.3 | 14 | 13.2 | 0.7 | 7.12 |
| Silt | 19.2 | 16.25 | 16.98 | 0.5 | 3.35 |
| Silty clay | 19.6 | 31.34 | 16.45 | 0.55 | 4.4 |
| Gravel | 20 | 0 | 31 | 0.35 | 1.96 |
| Pebble | 20 | 0 | 31 | 0.35 | 8.2 |
| Load Type | Calculation Range | ||
|---|---|---|---|
| Measured | 163.96 | 161.58 | / | / |
| Theoretical | 419.80 | 170.61 | / | / |
| Inversion analysis value | 288.91 | 190.44 | 0.46 | 1217.89 |
Disclaimer/Publisher’s Note: The statements, opinions and data contained in all publications are solely those of the individual author(s) and contributor(s) and not of MDPI and/or the editor(s). MDPI and/or the editor(s) disclaim responsibility for any injury to people or property resulting from any ideas, methods, instructions or products referred to in the content. |
© 2024 by the authors. Licensee MDPI, Basel, Switzerland. This article is an open access article distributed under the terms and conditions of the Creative Commons Attribution (CC BY) license (https://creativecommons.org/licenses/by/4.0/).
Share and Cite
Ma, S.-Y.; Ye, X.-W.; Liu, Z.-X.; Ding, Y.; Zhang, D.; Sun, F. Mechanical Behavior Monitoring and Load Inversion Analysis of Large-Diameter Underwater Shield Tunnel during Construction. Sensors 2024, 24, 1310. https://doi.org/10.3390/s24041310
Ma S-Y, Ye X-W, Liu Z-X, Ding Y, Zhang D, Sun F. Mechanical Behavior Monitoring and Load Inversion Analysis of Large-Diameter Underwater Shield Tunnel during Construction. Sensors. 2024; 24(4):1310. https://doi.org/10.3390/s24041310
Chicago/Turabian StyleMa, Si-Yuan, Xiao-Wei Ye, Zhi-Xiong Liu, Yang Ding, Di Zhang, and Feng Sun. 2024. "Mechanical Behavior Monitoring and Load Inversion Analysis of Large-Diameter Underwater Shield Tunnel during Construction" Sensors 24, no. 4: 1310. https://doi.org/10.3390/s24041310
APA StyleMa, S.-Y., Ye, X.-W., Liu, Z.-X., Ding, Y., Zhang, D., & Sun, F. (2024). Mechanical Behavior Monitoring and Load Inversion Analysis of Large-Diameter Underwater Shield Tunnel during Construction. Sensors, 24(4), 1310. https://doi.org/10.3390/s24041310