
Intensity Thresholds for External Workload Demands in Basketball: Is Individualization Based on Playing Positions Necessary?


Abstract
1. Introduction
2. Materials and Methods
2.1. Study Design
2.2. Participants and Sample
2.3. Variables and Equipment
- Velocity: the speed at which a player moves across the court, measured in kilometers per hour (km/h).
- Acceleration: the rate at which a player increases his velocity, measured in meters per second squared (m/s2).
- Deceleration: the rate at which a player decreases his velocity, measured in meters per second squared (m/s2).
- Impacts/min: the number of times a player makes contact with another player or with the ground with a g-force higher than 1 g per minute. It is measured in counts per minute (n/min).
- Player load/min: measurement derived from the accelerometer of the total body load in its 3 axes of movement (vertical, anteroposterior, and mediolateral), calculated as the square root of the sum of the accelerations divided by sampling frequency [30]. It is a sum of distance covered, accelerations and decelerations, and impacts and is measured in arbitrary units per minute (a.u./min).
2.4. Procedures
2.5. Statistical Analysis
3. Results
3.1. Velocity by Playing Positions
3.2. Changes in Speed by Playing Positions
3.3. Impacts per Minute by Playing Position
3.4. Player Load per Minute by Playing Position
4. Discussion
5. Conclusions
- Using the thresholds as guidelines in training drills to expose players to competition intensity by position. During training, tasks will be designed to address specific demands per position, accounting for work thresholds and action quantities within each work range. For example, guards would perform more running and sprinting tasks, while large amounts of screening contact are implemented in center drills.
- Considering the thresholds when interpreting external loads from monitoring devices. A certain volume of impacts may signal high intensity for a guard but a normal range for centers during games due to different standards. Targeted thresholds facilitate more sensitive alert systems to prompt interventions around excessive loads and guide return-to-play protocols.
- Individualizing post-game recovery programming by prescribing active rest for positions accruing heavy accelerations/decelerations versus more passive modalities for those incurring extensive impacts. In this sense, tailored fitness programs will be created to enable players to recover from competition demands, compensating for produced imbalances.
Author Contributions
Funding
Institutional Review Board Statement
Informed Consent Statement
Data Availability Statement
Conflicts of Interest
References
- Stojanović, E.; Stojiljković, N.; Scanlan, A.T.; Dalbo, V.J.; Berkelmans, D.M.; Milanović, Z. The Activity Demands and Physiological Responses Encountered During Basketball Match-Play: A Systematic Review. Sports Med. 2018, 48, 111–135. [Google Scholar] [CrossRef]
- García, F.; Vázquez-Guerrero, J.; Castellano, J.; Casals, M.; Schelling, X. Differences in Physical Demands between Game Quarters and Playing Positions on Professional Basketball Players during Official Competition. J. Sports Sci. Med. 2020, 19, 256–263. [Google Scholar]
- Petway, A.J.; Freitas, T.T.; Calleja-González, J.; Leal, D.M.; Alcaraz, P.E. Training load and match-play demands in basketball based on competition level: A systematic review. PLoS ONE 2020, 15, e0229212. [Google Scholar] [CrossRef]
- Bianchi, F.; Facchinetti, T.; Zuccolotto, P. Role Revolution: Towards a New Meaning of Positions in Basketball. Electron. J. Appl. Stat. Anal. 2017, 10, 712–734. [Google Scholar]
- Alagappan, M. From 5 to 13 Redefining the Positions in Basketball; Ayasdi Inc.: Boston, MA, USA, 2012. [Google Scholar]
- Cheng, A. Using Machine Learning to Find the 8 Types of Players in the NBA. Available online: https://medium.com/fastbreak-data/classifying-the-modern-nba-player-with-machine-learning-539da03bb824 (accessed on 19 April 2021).
- Fernández-Cortes, J.A.; Mandly, M.G.; García-Rubio, J.; Ibáñez, S.J. Contribution of Professional Basketball Players According to the Specific Position and the Competition Phase. E-Balonmano Com 2021, 17, 223–232. [Google Scholar]
- Sampaio, J.; Janeira, M.; Ibáñez, S.; Lorenzo, A. Discriminant analysis of game-related statistics between basketball guards, forwards and centres in three professional leagues. Eur. J. Sport Sci. 2006, 6, 173–178. [Google Scholar] [CrossRef]
- Gómez-Carmona, C.D.; Mancha-Triguero, D.; Pino-Ortega, J.; Ibáñez, S.J. Exploring Physical Fitness Profile of Male and Female Semiprofessional Basketball Players through Principal Component Analysis—A Case Study. J. Funct. Morphol. Kinesiol. 2021, 6, 67. [Google Scholar] [CrossRef]
- Zhang, S.; Lorenzo, A.; Gómez, M.-A.; Liu, H.; Gonçalves, B.; Sampaio, J. Players’ technical and physical performance profiles and game-to-game variation in NBA. Int. J. Perform. Anal. Sport 2017, 17, 466–483. [Google Scholar] [CrossRef]
- Salazar, H.; Castellano, J.; Svilar, L. Differences in External Load Variables between Playing Positions in Elite Basketball Match-Play. J. Hum. Kinet. 2020, 75, 257–266. [Google Scholar] [CrossRef]
- Reina, M.; García-Rubio, J.; Ibáñez, S.J. Training and Competition Load in Female Basketball: A Systematic Review. Int. J. Environ. Res. Public Health 2020, 17, 2639. [Google Scholar] [CrossRef]
- Figueira, B.; Mateus, N.; Esteves, P.; Dadelienė, R.; Paulauskas, R. Physiological Responses and Technical-Tactical Performance of Youth Basketball Players: A Brief Comparison between 3 × 3 and 5 × 5 Basketball. J. Sports Sci. Med. 2022, 21, 332–340. [Google Scholar] [CrossRef]
- Castagna, C.; Chaouachi, A.; Rampinini, E.; Chamari, K.; Impellizzeri, F. Aerobic and Explosive Power Performance of Elite Italian Regional-Level Basketball Players. J. Strength Cond. Res. 2009, 23, 1982–1987. [Google Scholar] [CrossRef]
- Staunton, C.; Wundersitz, D.; Gordon, B.; Kingsley, M. Accelerometry-Derived Relative Exercise Intensities in Elite Women’s Basketball. Int. J. Sports Med. 2018, 39, 822–827. [Google Scholar] [CrossRef]
- Delextrat, A.; Badiella, A.; Saavedra, V.; Matthew, D.; Schelling, X.; Torres-Ronda, L. Match activity demands of elite Spanish female basketball players by playing position. Int. J. Perform. Anal. Sport 2015, 15, 687–703. [Google Scholar] [CrossRef]
- Puente, C.; Abián-Vicén, J.; Areces, F.; López, R.; Del Coso, J. Physical and Physiological Demands of Experienced Male Basketball Players During a Competitive Game. J. Strength Cond. Res. 2017, 31, 956–962. [Google Scholar] [CrossRef]
- Edwards, T.; Spiteri, T.; Piggott, B.; Bonhotal, J.; Haff, G.G.; Joyce, C. Monitoring and Managing Fatigue in Basketball. Sports 2018, 6, 19. [Google Scholar] [CrossRef]
- Russell, J.L.; McLean, B.D.; Impellizzeri, F.M.; Strack, D.S.; Coutts, A.J. Measuring Physical Demands in Basketball: An Explorative Systematic Review of Practices. Sports Med. 2021, 51, 81–112. [Google Scholar] [CrossRef]
- Fox, J.L.; Scanlan, A.T.; Stanton, R. A Review of Player Monitoring Approaches in Basketball: Current Trends and Future Directions. J. Strength Cond. Res. 2017, 31, 2021–2029. [Google Scholar] [CrossRef]
- Vázquez-Guerrero, J.; Jones, B.; Fernández-Valdés, B.; Moras, G.; Reche, X.; Sampaio, J. Physical demands of elite basketball during an official U18 international tournament. J. Sports Sci. 2019, 37, 2530–2537. [Google Scholar] [CrossRef]
- Caparrós, T.; Casals, M.; Solana, A.; Peña, J. Low External Workloads Are Related to Higher Injury Risk in Professional Male Basketball Games. J. Sports Sci. Med. 2018, 17, 289–297. [Google Scholar]
- Clemente, F.; Ramirez-Campillo, R.; Beato, M.; Moran, J.; Kawczynski, A.; Makar, P.; Sarmento, H.; Afonso, J. Arbitrary absolute vs. individualized running speed thresholds in team sports: A scoping review with evidence gap map. Biol. Sport 2023, 40, 919–943. [Google Scholar] [CrossRef]
- Polglaze, T.; Hogan, C.; Dawson, B.; Buttfield, A.; Osgnach, C.; Lester, L.; Peeling, P. Classification of Intensity in Team Sport Activity. Med. Sci. Sports Exerc. 2018, 50, 1487–1494. [Google Scholar] [CrossRef]
- Sweeting, A.J.; Cormack, S.J.; Morgan, S.; Aughey, R.J. When Is a Sprint a Sprint? A Review of the Analysis of Team-Sport Athlete Activity Profile. Front. Physiol. 2017, 8, 432. [Google Scholar] [CrossRef]
- Ibáñez, S.J.; Gómez-Carmona, C.D.; Mancha-Triguero, D. Individualization of Intensity Thresholds on External Workload Demands in Women’s Basketball by K-Means Clustering: Differences Based on the Competitive Level. Sensors 2022, 22, 324. [Google Scholar] [CrossRef]
- Ibáñez, S.J.; López-Sierra, P.; Lorenzo, A.; Feu, S. Kinematic and Neuromuscular Ranges of External Loading in Professional Basketball Players during Competition. Appl. Sci. 2023, 13, 11936. [Google Scholar] [CrossRef]
- Leroy, A.; Marc, A.; Dupas, O.; Rey, J.L.; Gey, S. Functional Data Analysis in Sport Science: Example of Swimmers’ Progression Curves Clustering. Appl. Sci. 2018, 8, 1766. [Google Scholar] [CrossRef]
- Ato, M.; López-García, J.J.; Benavente, A. Un sistema de clasificación de los diseños de investigación en psicología. Anal. Psicol. 2013, 29, 1038–1059. [Google Scholar] [CrossRef]
- Gómez-Carmona, C.D.; Bastida-Castillo, A.; García-Rubio, J.; Ibáñez, S.J.; Pino-Ortega, J. Static and Dynamic Reliability of WIMU PROTM Accelerometers according to Anatomical Placement. Proc. Inst. Mech. Eng. Part P J. Sports Eng. Technol. 2019, 233, 238–248. [Google Scholar]
- Pino-Ortega, J.; Bastida-Castillo, A.; Gómez-Carmona, C.D.; Rico-González, M. Validity and reliability of an eight antennae ultra-wideband local positioning system to measure performance in an indoor environment. Sports Biomech. 2024, 23, 145–155. [Google Scholar] [CrossRef]
- Fox, J.L.; Stanton, R.; Scanlan, A.T. A Comparison of Training and Competition Demands in Semiprofessional Male Basketball Players. Res. Q. Exerc. Sport 2018, 89, 103–111. [Google Scholar] [CrossRef]
- Kozina, Z.L.; Prusik, K.; Prusik, K. The Concept of Individual Approach in Sport. Pedagog. Psychol. Med.-Biol. Probl. Phys. Train. Sports 2015, 19, 28–38. [Google Scholar] [CrossRef]
- Pion, J.; Segers, V.; Stautemas, J.; Boone, J.; Lenoir, M.; Bourgois, J.G. Position-specific performance profiles, using predictive classification models in senior basketball. Int. J. Sports Sci. Coach. 2018, 13, 1072–1080. [Google Scholar] [CrossRef]
- Duman, E.A.; Sennaroğlu, B.; Tuzkaya, G. A cluster analysis of basketball players for each of the five traditionally defined positions. Proc. Inst. Mech. Eng. Part P J. Sports Eng. Technol. 2021. ahead of print. [Google Scholar] [CrossRef]
- Mateus, N.; Esteves, P.; Gonçalves, B.; Torres, I.; Gomez, M.A.; Arede, J.; Leite, N. Clustering performance in the European Basketball according to players’ characteristics and contextual variables. Int. J. Sports Sci. Coach. 2020, 15, 405–411. [Google Scholar] [CrossRef]
- Cui, Y.; Liu, F.; Bao, D.; Liu, H.; Zhang, S.; Gómez, M. Key Anthropometric and Physical Determinants for Different Playing Positions during National Basketball Association Draft Combine Test. Front. Psychol. 2019, 10, 2359. [Google Scholar] [CrossRef]
- Scanlan, A.T.; Dascombe, B.J.; Reaburn, P.; Dalbo, V.J. The physiological and activity demands experienced by Australian female basketball players during competition. J. Sci. Med. Sport 2012, 15, 341–347. [Google Scholar] [CrossRef]
- Fox, J.L.; Stanton, R.; Sargent, C.; Wintour, S.-A.; Scanlan, A.T. The Association between Training Load and Performance in Team Sports: A Systematic Review. Sports Med. 2018, 48, 2743–2774. [Google Scholar] [CrossRef]

| Role | Speed (km/h) | Low/Walking | Moderate/Jogging | High/Sprinting |
|---|---|---|---|---|
| Guard | Cluster Centers | 1.75 | 8.82 | |
| Ranges | <4.75 | >4.76 | ||
| % | 68.8% | 31.2% | ||
| Distribution | 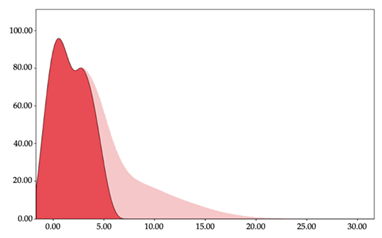 |  | ||
| Forward | Centers | 0.84 | 4.92 | 12.87 |
| Ranges | <2.74 | 2.75 to 8.81 | >8.82 | |
| % | 49.1% | 37.1% | 13.9% | |
| Distribution |  |  |  | |
| Center | Centers | 0.80 | 4.86 | 12.74 |
| Ranges | <2.70 | 2.71 to 8.69 | >8.70 | |
| % | 50.4% | 36.8% | 12.7% | |
| Distribution |  |  |  |
| Role | Speed (km/h) | Very Low/ Standing | Low/ Walking | Moderate/ Jogging | High/ Running | Very High/ Sprinting |
|---|---|---|---|---|---|---|
| Guard | Centers | 0.70 | 4.12 | 8.26 | 12.61 | 17.33 |
| Ranges | <2.46 | 2.47 to 6.34 | 6.35 to 10.67 | 10.68 to 15.22 | >15.23 | |
| % | 43.77% | 35.35% | 12.47% | 6.39% | 2.01% | |
| Forward | Centers | 0.81 | 4.40 | 9.09 | 13.81 | 18.57 |
| Ranges | <2.67 | 2.68 to 6.93 | 6.94 to 11.74 | 11.75 to 16.50 | >16.51 | |
| % | 48.33% | 32.56% | 11.26% | 6.02% | 1.83% | |
| Centers | Centers | 0.87 | 4.67 | 9.88 | 15.17 | 20.06 |
| Ranges | <2.86 | 2.87 to 7.51 | 7.52 to 12.97 | 12.98 to 18.42 | >18.43 | |
| % | 52.27% | 31.98% | 10.52% | 4.54% | 0.69% | |
| Total | Centers | 0.92 | 4.73 | 9.85 | 14.70 | 19.35 |
| Ranges | <2.95 | 2.96 to 7.58 | 7.59 to 12.71 | 12.72 to 17.50 | >17.51 | |
| % | 51.7% | 32.0% | 10.60% | 4.60% | 1.00% |
| Accelerations | ||||||
|---|---|---|---|---|---|---|
| Role | Acc (m/s2) | Very Low | Low | Moderate | High | Very High |
| Guard | Centers | 0.12 | 0.49 | 0.88 | 1.63 | 3.57 |
| Ranges | <0.31 | 0.32 to 0.68 | 0.69 to 1.23 | 1.24 to 2.44 | >2.45 | |
| % | 34.5% | 23.1% | 34.8% | 6.4% | 1.3% | |
| Distribution |  |  |  | 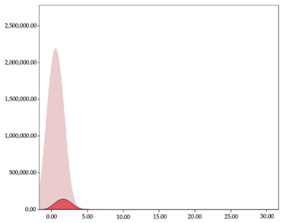 |  | |
| Forward | Centers | 0.20 | 0.78 | 1.5 | 3.59 | |
| Ranges | <0.50 | 0.51 to 1.10 | 1.11 to 2.45 | >2.46 | ||
| % | 43.5% | 47.0% | 8.4% | 1.1% | ||
| Distribution |  |  |  |  | ||
| Centers | Centers | 0.21 | 0.85 | 2.03 | ||
| Ranges | <0.55 | 0.56 to 1.34 | >1.35 | |||
| % | 47.3% | 46.6% | 6.1% | |||
| Distribution | 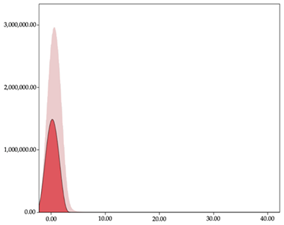 |  |  | |||
| Decelerations | ||||||
| Role | Dec (m/s2) | Very Low | Low | Moderate | High | Very High |
| Guard | Centers | −0.22 | −0.77 | −1.86 | ||
| Ranges | −0.48 to −0.00 | −1.28 to −0.49 | <−1.29 | |||
| % | 58.2% | 37.8% | 4.0% | |||
| Distribution |  |  |  | |||
| Forward | Centers | −0.16 | −0.55 | −1.01 | −2.20 | |
| Ranges | −0.35 to −0.00 | −0.79 to −0.36 | −1.64 to −0.80 | <−1.65 | ||
| % | 42.7% | 37.0% | 18.2% | 2.1% | ||
| Distribution |  |  |  |  | ||
| Centers | Centers | −0.13 | −0.46 | −0.88 | −1.72 | |
| Ranges | −0.29 to −0.00 | −0.67 to −0.30 | −1.26 to −0.68 | <−1.27 | ||
| % | 37.4% | 36.4% | 22.5% | 3.7% | ||
| Distribution |  |  |  |  | ||
| Accelerations | ||||||
|---|---|---|---|---|---|---|
| Role | Acc (m/s2) | Very Low | Low | Moderate | High | Very High |
| Guard | Centers | 0.45 | 1.36 | 3.49 | 6.80 | 13.84 |
| Ranges | <0.96 | 0.94 to 2.64 | 2.65 to 5.53 | 5.54 to 12.00 | >12.01 | |
| % | 85.31% | 13.66% | 0.92% | 0.10% | 0.01% | |
| Forward | Centers | 0.39 | 1.09 | 2.86 | 5.53 | 9.19 |
| Ranges | <0.84 | 0.85 to 2.18 | 2.19 to 4.51 | 4.52 to 7.86 | >7.87 | |
| % | 72.30% | 26.20% | 1.31% | 0.18% | 0.01% | |
| Centers | Centers | 0.44 | 1.24 | 3.40 | 6.84 | 25.33 |
| Ranges | <0.93 | 0.94 to 2.56 | 2.57 to 5.67 | 5.68 to 14.61 | >14.61 | |
| % | 80.40% | 18.63% | 0.90% | 0.06% | 0.01% | |
| Total | Centers | 0.46 | 1.29 | 3.34 | 6.49 | 14.23 |
| Ranges | <0.95 | 0.96 to 2.53 | 2.54 to 5.31 | 5.32 to 12.25 | >12.26 | |
| % | 83.49% | 15.49% | 0.93% | 0.11% | 0.06% | |
| Decelerations | ||||||
| Role | Dec (m/s2) | Very Low | Low | Moderate | High | Very High |
| Guard | Centers | −0.27 | −0.86 | −2.27 | −4.39 | −9.21 |
| Ranges | −0.59 to −0.00 | −1.55 to −0.60 | −3.51 to −1.59 | −7.40 to −3.52 | −18.99 to −7.41 | |
| % | 67.56% | 30.01% | 2.30% | 0.12% | 0.01% | |
| Forward | Centers | −0.26 | −0.86 | −1.96 | −4.27 | −9.17 |
| Ranges | −0.59 to −0.00 | −1.51 to −0.60 | −3.44 to −1.52 | −7.37 to −3.45 | −19.45 to −7.38 | |
| % | 66.58% | 30.76% | 2.55% | 0.10% | 0.01% | |
| Centers | Centers | −0.27 | −0.87 | −2.05 | −5.62 | −13.84 |
| Ranges | −0.59 to −0.00 | −1.58 to −0.60 | −4.32 to −1.59 | −11.50 to −4.33 | −26.03 to −11.51 | |
| % | 68.28% | 30.04% | 1.64% | 0.03% | 0.01% | |
| Total | Centers | −0.26 | −0.82 | −1.78 | −3.72 | −7.91 |
| Ranges | −0.56 to 0.0 | −1.37 to −0.57 | −2.98 to −1.38 | −6.27 to −2.99 | −14.55 to −6.28 | |
| % | 64.34% | 32.41% | 3.07% | 0.17% | 0.01% | |
| Role | Imp (n/min) | Low | Moderate | High | Very High |
|---|---|---|---|---|---|
| Guard | Centers | 42.58 | 119.60 | 160.63 | |
| Ranges | <57.65 | 88.63 to 139.27 | >143.11 | ||
| % | 3.8% | 54.7% | 41.5% | ||
| Distribution |  |  |  | ||
| Forwards | Centers | 111.78 | 142.22 | 174.85 | |
| Ranges | <125.52 | 128.10 to 158.09 | >161.83 | ||
| % | 31.3% | 53.5% | 15.2% | ||
| Distribution |  |  |  | ||
| Centers | Centers | 114.81 | 168.64 | ||
| Ranges | <142.00 | >143.45 | |||
| % | 55.2% | 44.8% | |||
| Distribution |  |  |
| Role | Imp (n/min) | Very Low | Low | Moderate | High | Very High |
|---|---|---|---|---|---|---|
| Guard | Centers | 27.50 | 57.65 | 88.63 | 139.27 | 188.10 |
| Ranges | <27.50 | 57.65 to 88.62 | 88.63 to 127.14 | 129.04 to 157.44 | 160.31 to 188.10 | |
| % | 1.89% | 1.89% | 12.47% | 41.51% | 16.98% | |
| Forward | Centers | 49.27 | 93.75 | 125.52 | 163.78 | 186 |
| Ranges | <49.27 | 93.75 to 119.23 | 120.56 to 139.67 | 140.63 to 163.78 | 171.75 to 186.00 | |
| % | 1.01% | 21.21% | 33.33% | 32.32% | 12.12% | |
| Centers | Centers | 45.33 | 78 | 123.09 | 188.1 | 223.47 |
| Ranges | <45.33 | 68.77 to 104.44 | 108.33 to 142.00 | 143.45 to 177.67 | 181.41 to 223.47 | |
| % | 0.95% | 11.43% | 42.86% | 34.29% | 10.48% | |
| Total | Centers | 57.45 | 107.4 | 132.01 | 155.1 | 182.69 |
| Ranges | <78.00 | 83.22 to 119.60 | 120.53 to 143.60 | 143.81 to 169.14 | 169.43 to 223.47 | |
| % | 2.72% | 23.74% | 33.07% | 26.46% | 14.01% |
| Role | PL (a.u./min) | Moderate | High |
|---|---|---|---|
| Guards | Centers | 0.89 | 1.37 |
| Ranges | 0.19 to 1.10 | 1.11 to 1.88 | |
| % | 35.8% | 64.2% | |
| Distribution |  |  | |
| Forwards | Centers | 1.06 | 1.44 |
| Ranges | 0.38 to 1.25 | 1.26 to 1.93 | |
| % | 64.6% | 35.4% | |
| Distribution |  |  | |
| Centers | Centers | 0.92 | 1.33 |
| Ranges | 0.27 to 1.11 | 1.12 to 1.83 | |
| % | 56.2% | 43.8% | |
| Distribution |  |  |
| Role | Imp (n/min) | Very Low | Low | Moderate | High | Very High |
|---|---|---|---|---|---|---|
| Guard | Centers | 0.19 | 0.47 | 0.93 | 1.21 | 1.52 |
| Ranges | 0.19 to 0.47 | 0.48 to 1.06 | 1.07 to 1.33 | 1.34 to 1.64 | 1.65 to 1.88 | |
| % | 1.89% | 1.89% | 28.30% | 35.85% | 32.08% | |
| Forward | Centers | 0.38 | 0.96 | 1.21 | 1.43 | 1.77 |
| Ranges | 0.38 to 0.38 | 0.39 to 1.03 | 1.04 to 1.25 | 1.26 to 1.48 | 1.49 to 1.93 | |
| % | 1.01% | 31.31% | 43.43% | 19.19% | 5.05% | |
| Centers | Centers | 0.56 | 0.93 | 1.20 | 1.49 | 1.83 |
| Ranges | 0.27 to 0.50 | 0.51 to 0.91 | 0.92 to 1.14 | 1.15 to 1.40 | 1.41 to 1.83 | |
| % | 5.71% | 40.95% | 39.05% | 13.33% | 0.95% | |
| Total | Centers | 0.36 | 0.89 | 1.14 | 1.40 | 1.72 |
| Ranges | 0.19 to 0.50 | 0.51 to 1.01 | 1.02 to 1.27 | 1.28 to 1.56 | 1.57 to 1.93 | |
| % | 1.95% | 27.24% | 39.30% | 26.85% | 4.67% |
Disclaimer/Publisher’s Note: The statements, opinions and data contained in all publications are solely those of the individual author(s) and contributor(s) and not of MDPI and/or the editor(s). MDPI and/or the editor(s) disclaim responsibility for any injury to people or property resulting from any ideas, methods, instructions or products referred to in the content. |
© 2024 by the authors. Licensee MDPI, Basel, Switzerland. This article is an open access article distributed under the terms and conditions of the Creative Commons Attribution (CC BY) license (https://creativecommons.org/licenses/by/4.0/).
Share and Cite
Ibáñez, S.J.; Gómez-Carmona, C.D.; López-Sierra, P.; Feu, S. Intensity Thresholds for External Workload Demands in Basketball: Is Individualization Based on Playing Positions Necessary? Sensors 2024, 24, 1146. https://doi.org/10.3390/s24041146
Ibáñez SJ, Gómez-Carmona CD, López-Sierra P, Feu S. Intensity Thresholds for External Workload Demands in Basketball: Is Individualization Based on Playing Positions Necessary? Sensors. 2024; 24(4):1146. https://doi.org/10.3390/s24041146
Chicago/Turabian StyleIbáñez, Sergio J., Carlos D. Gómez-Carmona, Pablo López-Sierra, and Sebastián Feu. 2024. "Intensity Thresholds for External Workload Demands in Basketball: Is Individualization Based on Playing Positions Necessary?" Sensors 24, no. 4: 1146. https://doi.org/10.3390/s24041146
APA StyleIbáñez, S. J., Gómez-Carmona, C. D., López-Sierra, P., & Feu, S. (2024). Intensity Thresholds for External Workload Demands in Basketball: Is Individualization Based on Playing Positions Necessary? Sensors, 24(4), 1146. https://doi.org/10.3390/s24041146