
Applying Multi-Purpose Commercial Inertial Sensors for Monitoring Equine Locomotion in Equestrian Training


Abstract
1. Introduction
2. Materials and Methods
2.1. Inertial Measurement Units (IMUs)
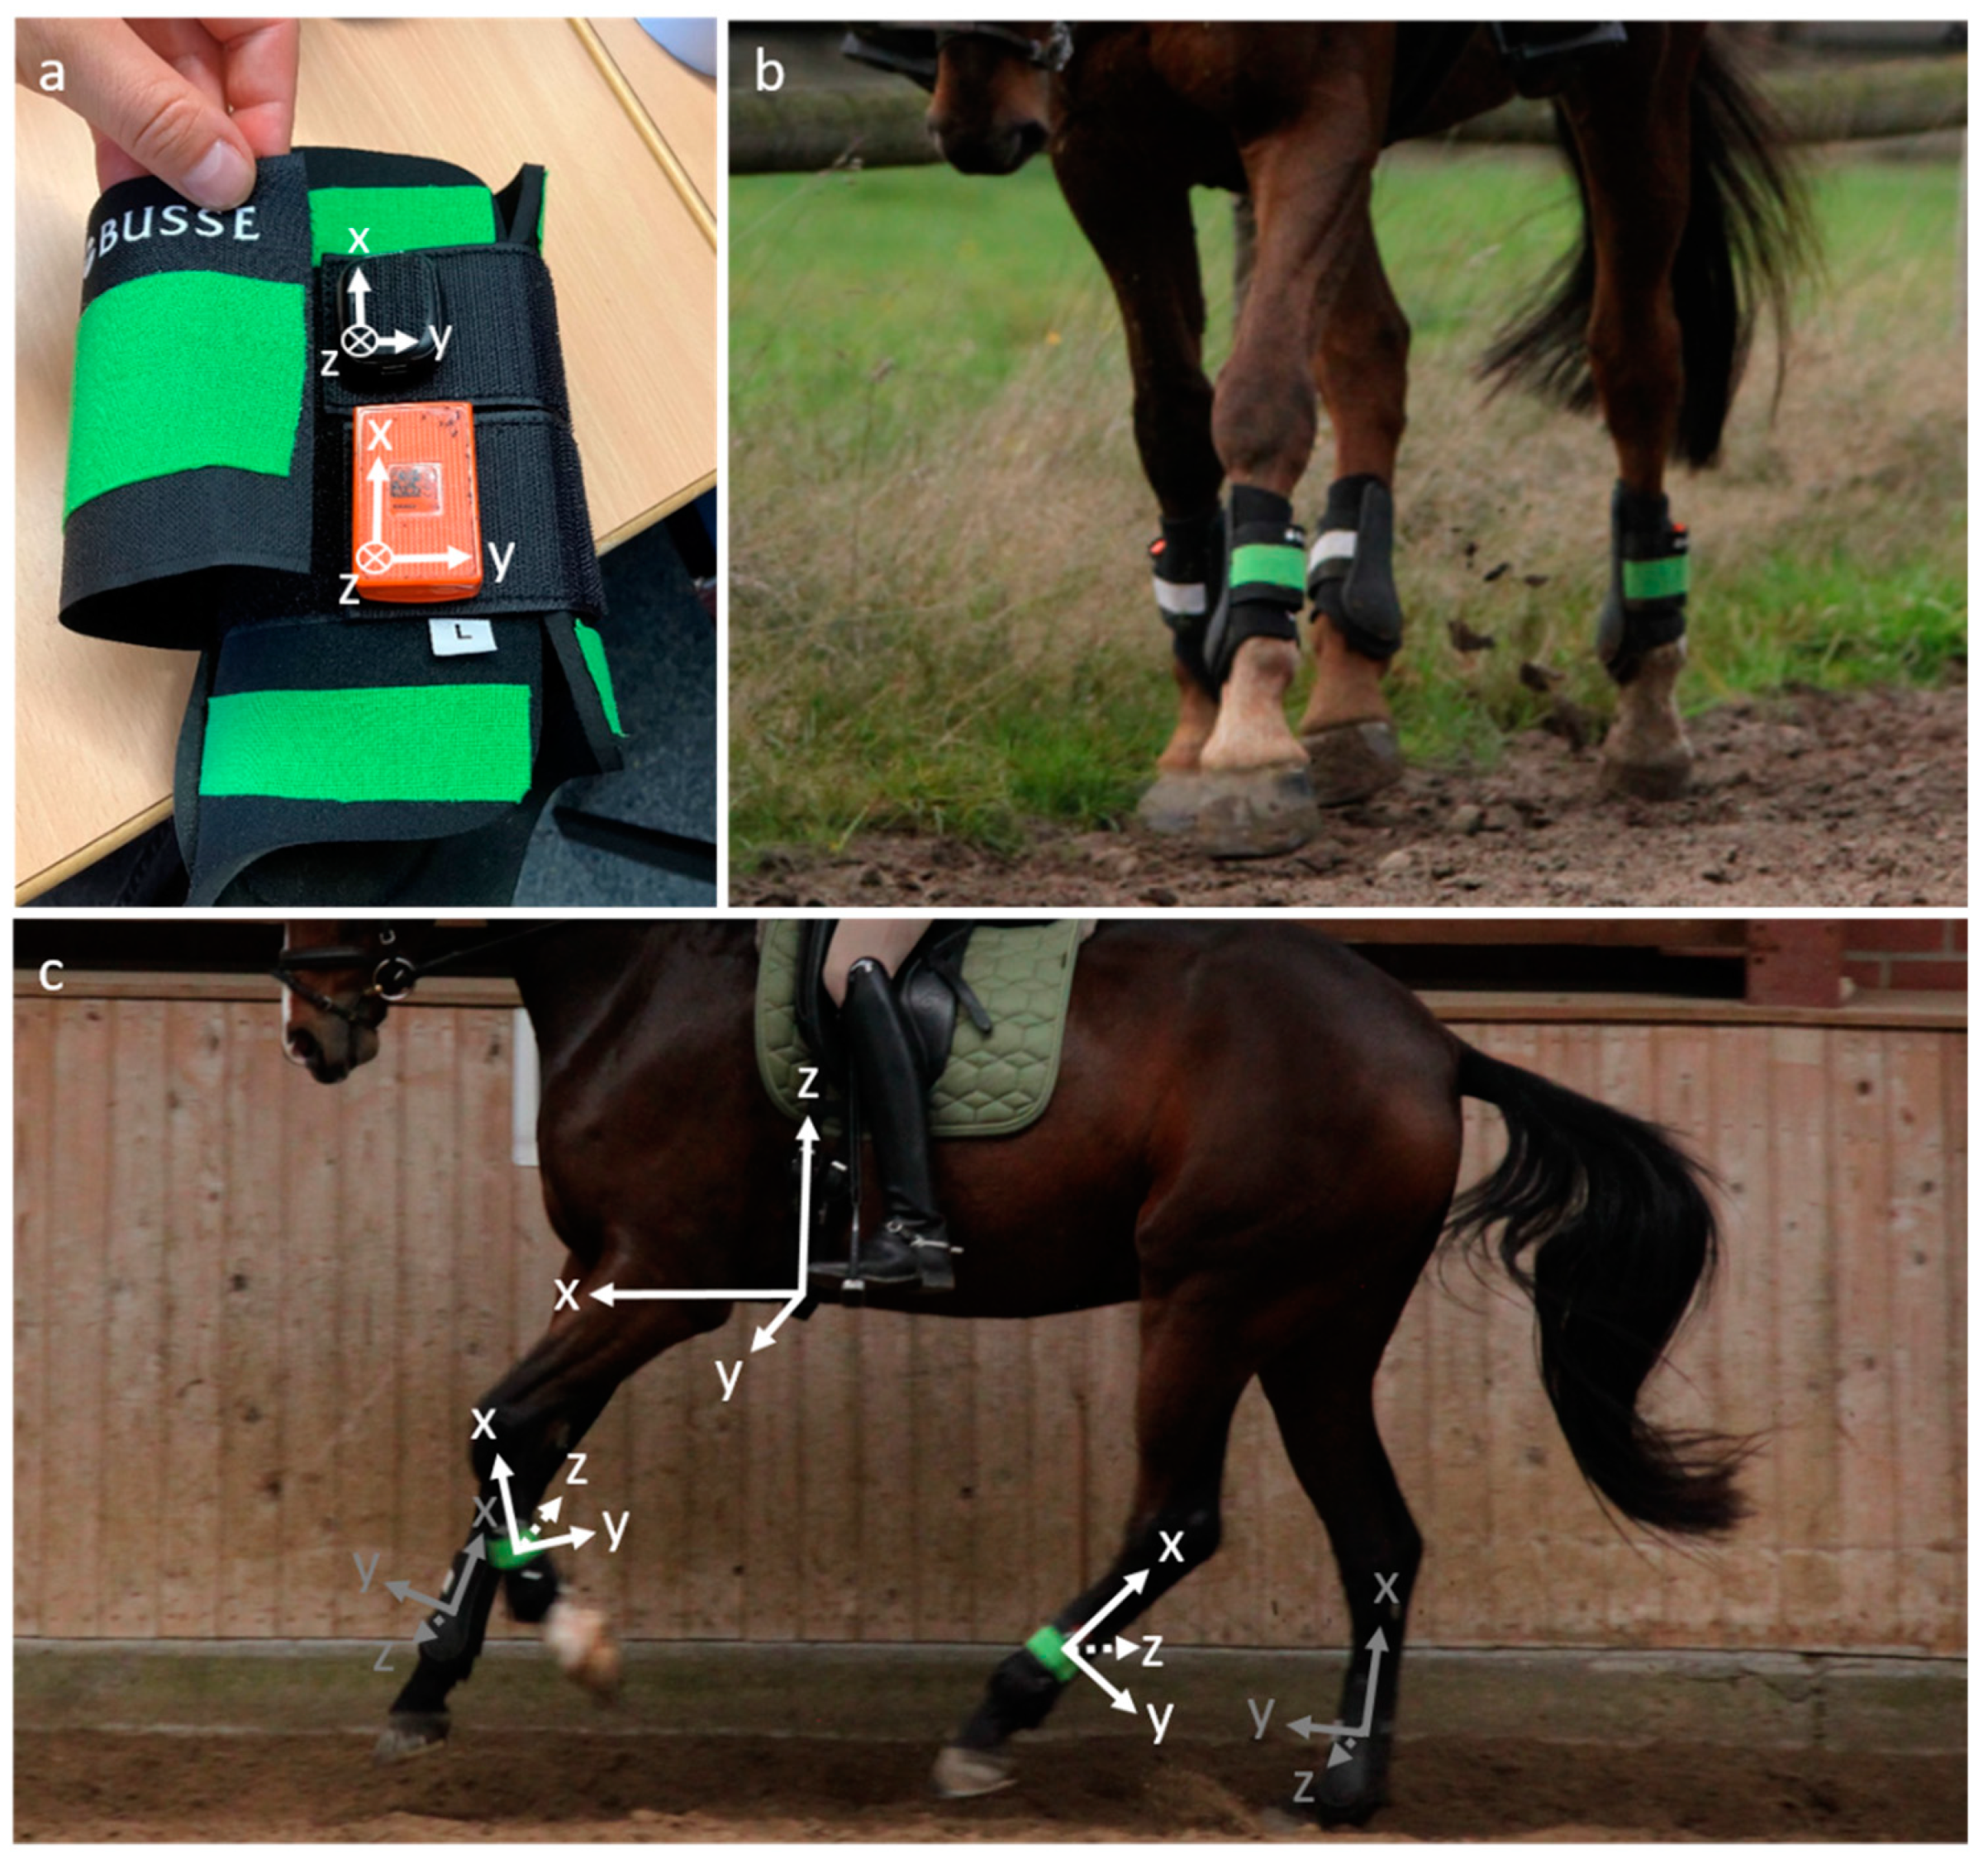
2.2. Sensor Positioning
2.3. Study Design
2.4. Horses
2.5. Data Analysis
2.6. Statistical Analysis
3. Results
4. Discussion
5. Conclusions
Author Contributions
Funding
Institutional Review Board Statement
Informed Consent Statement
Data Availability Statement
Acknowledgments
Conflicts of Interest
References
- Serra Braganca, F.M.; Broome, S.; Rhodin, M.; Bjornsdottir, S.; Gunnarsson, V.; Voskamp, J.P.; Persson-Sjodin, E.; Back, W.; Lindgren, G.; Novoa-Bravo, M.; et al. Improving gait classification in horses by using inertial measurement unit (IMU) generated data and machine learning. Sci. Rep. 2020, 10, 17785. [Google Scholar] [CrossRef] [PubMed]
- Abourachid, A. A new way of analysing symmetrical and asymmetrical gaits in quadrupeds. Comptes Rendus Biol. 2003, 326, 625–630. [Google Scholar] [CrossRef]
- Clayton, H.M. Comparison of the stride kinematics of the collected, working, medium and extended trot in horses. Equine Vet. J. 1994, 26, 230–234. [Google Scholar] [CrossRef]
- Clayton, H.M. Comparison of the stride kinematics of the collected, medium, and extended walks in horses. Am. J. Vet. Res. 1995, 56, 849–852. [Google Scholar] [CrossRef]
- Clayton, H.M. Comparison of the collected, working, medium and extended canters. Equine Vet. J. 1994, 26, 16–19. [Google Scholar] [CrossRef]
- Deuel, N.R.; Park, J.-J. The Gait Patterns of Olympic Dressage Horses. Int. J. Sport Biomech. 1990, 6, 198–226. [Google Scholar] [CrossRef]
- Clayton, H.M.; Hobbs, S.J. A Review of Biomechanical Gait Classification with Reference to Collected Trot, Passage and Piaffe in Dressage Horses. Animals 2019, 9, 763. [Google Scholar] [CrossRef] [PubMed]
- Fercher, C. Biomechanische Verfahren zur objektivierten Analyse der Sprungbewegung von Springpferden im Hochleistungssport. Ph.D. Dissertation, University of Giessen, Giessen, Germany, 2023. [Google Scholar]
- Clayton, H.M.; Hobbs, S.J. Ground Reaction Forces: The Sine Qua Non of Legged Locomotion. J. Equine Vet. Sci. 2019, 76, 25–35. [Google Scholar] [CrossRef]
- Dyson, S. Recognition of lameness: Man versus machine. Vet. J. 2014, 201, 245–248. [Google Scholar] [CrossRef] [PubMed]
- Crevier-Denoix, N.; Falala, S.; Holden-Douilly, L.; Camus, M.; Martino, J.; Ravary-Plumioen, B.; Vergari, C.; Desquilbet, L.; Denoix, J.M.; Chateau, H.; et al. Comparative kinematic analysis of the leading and trailing forelimbs of horses cantering on a turf and a synthetic surface. Equine Vet. J. 2013, 45, 54–61. [Google Scholar] [CrossRef] [PubMed]
- Darbandi, H.; Bragança, F.S.; Zwaag, B.J.v.d.; Havinga, P. Accurate Horse Gait Event Estimation Using an Inertial Sensor Mounted on Different Body Locations. In Proceedings of the 2022 IEEE International Conference on Smart Computing (SMARTCOMP), Helsinki, Finland, 20–24 June 2022. [Google Scholar]
- Hatrisse, C.; Macaire, C.; Sapone, M.; Hebert, C.; Hanne-Poujade, S.; De Azevedo, E.; Marin, F.; Martin, P.; Chateau, H. Stance Phase Detection by Inertial Measurement Unit Placed on the Metacarpus of Horses Trotting on Hard and Soft Straight Lines and Circles. Sensors 2022, 22, 703. [Google Scholar] [CrossRef] [PubMed]
- Briggs, E.V.; Mazzà, C. Automatic methods of hoof-on and-off detection in horses using wearable inertial sensors during walk and trot on asphalt, sand and grass. PLoS ONE 2021, 16, e0254813. [Google Scholar] [CrossRef] [PubMed]
- Tijssen, M.; Hernlund, E.; Rhodin, M.; Bosch, S.; Voskamp, J.; Nielen, M.; Serra Braganςa, F. Automatic hoof-on and-off detection in horses using hoof-mounted inertial measurement unit sensors. PLoS ONE 2020, 15, e0233266. [Google Scholar]
- Tijssen, M.; Hernlund, E.; Rhodin, M.; Bosch, S.; Voskamp, J.P.; Nielen, M.; Serra Braganςa, F.M. Automatic detection of break-over phase onset in horses using hoof-mounted inertial measurement unit sensors. PLoS ONE 2020, 15, e0233649. [Google Scholar]
- Sapone, M.; Martin, P.; Ben Mansour, K.; Chateau, H.; Marin, F. Comparison of Trotting Stance Detection Methods from an Inertial Measurement Unit Mounted on the Horse’s Limb. Sensors 2020, 20, 2983. [Google Scholar] [CrossRef]
- Parmentier, J.I.M.; Bosch, S.; van der Zwaag, B.J.; Weishaupt, M.A.; Gmel, A.I.; Havinga, P.J.M.; van Weeren, P.R.; Braganca, F.M.S. Prediction of continuous and discrete kinetic parameters in horses from inertial measurement units data using recurrent artificial neural networks. Sci. Rep. 2023, 13, 740. [Google Scholar] [CrossRef] [PubMed]
- Hildebrand, M. Symmetrical Gaits of Horses: Gaits can be expressed numerically and analyzed graphically to reveal their nature and relationships. Science 1965, 150, 701–708. [Google Scholar] [CrossRef] [PubMed]
- Witte, T.H.; Knill, K.; Wilson, A.M. Determination of peak vertical ground reaction force from duty factor in the horse (Equus caballus). J. Exp. Biol. 2004, 207, 3639–3648. [Google Scholar] [CrossRef] [PubMed]
- Dyson, S. Can lameness be graded reliably? Equine Vet. J. 2011, 43, 379–382. [Google Scholar] [CrossRef] [PubMed]
- Calle-González, N.; Lo Feudo, C.M.; Ferrucci, F.; Requena, F.; Stucchi, L.; Muñoz, A. Objective Assessment of Equine Locomotor Symmetry Using an Inertial Sensor System and Artificial Intelligence: A Comparative Study. Animals 2024, 14, 921. [Google Scholar] [CrossRef] [PubMed]
- Rhodin, M.; Egenvall, A.; Haubro Andersen, P.; Pfau, T. Head and pelvic movement asymmetries at trot in riding horses in training and perceived as free from lameness by the owner. PLoS ONE 2017, 12, e0176253. [Google Scholar] [CrossRef] [PubMed]
- Greve, L.; Dyson, S. What can we learn from visual and objective assessment of non-lame and lame horses in straight lines, on the lunge and ridden? Equine Vet. Educ. 2020, 32, 479–491. [Google Scholar] [CrossRef]
- Clayton, H.M.; Sha, D.H. Head and body centre of mass movement in horses trotting on a circular path. Equine Vet. J. 2006, 38, 462–467. [Google Scholar] [CrossRef] [PubMed]
- Greve, L.; Pfau, T.; Dyson, S. Thoracolumbar movement in sound horses trotting in straight lines in hand and on the lunge and the relationship with hind limb symmetry or asymmetry. Vet. J. 2017, 220, 95–104. [Google Scholar] [CrossRef]
- Rhodin, M.; Roepstorff, L.; French, A.; Keegan, K.G.; Pfau, T.; Egenvall, A. Head and pelvic movement asymmetry during lungeing in horses with symmetrical movement on the straight. Equine Vet. J. 2016, 48, 315–320. [Google Scholar] [CrossRef] [PubMed]
- Hobbs, S.J.; Licka, T.; Polman, R. The difference in kinematics of horses walking, trotting and cantering on a flat and banked 10 m circle. Equine Vet. J. 2011, 43, 686–694. [Google Scholar] [CrossRef] [PubMed]
- Ueberschär, O.; Fleckenstein, D.; Warschun, F.; Kränzler, S.; Walter, N.; Hoppe, M.W. Measuring biomechanical loads and asymmetries in junior elite long-distance runners through triaxial inertial sensors. Sports Orthop. Traumatol. 2019, 35, 296–308. [Google Scholar] [CrossRef]
- Chambers, R.; Gabbett, T.J.; Cole, M.H.; Beard, A. The Use of Wearable Microsensors to Quantify Sport-Specific Movements. Sports Med. 2015, 45, 1065–1081. [Google Scholar] [CrossRef]
- Al-Amri, M.; Nicholas, K.; Button, K.; Sparkes, V.; Sheeran, L.; Davies, J.L. Inertial measurement units for clinical movement analysis: Reliability and concurrent validity. Sensors 2018, 18, 719. [Google Scholar] [CrossRef]
- Warner, S.M.; Koch, T.O.; Pfau, T. Inertial sensors for assessment of back movement in horses during locomotion over ground. Equine Vet. J. 2010, 42, 417–424. [Google Scholar] [CrossRef]
- Olsen, E.; Haubro Andersen, P.; Pfau, T. Accuracy and precision of equine gait event detection during walking with limb and trunk mounted inertial sensors. Sensors 2012, 12, 8145–8156. [Google Scholar] [CrossRef] [PubMed]
- Olsen, E.; Pfau, T.; Ritz, C. Functional limits of agreement applied as a novel method comparison tool for accuracy and precision of inertial measurement unit derived displacement of the distal limb in horses. J. Biomech. 2013, 46, 2320–2325. [Google Scholar] [CrossRef] [PubMed]
- Starke, S.D.; Witte, T.H.; May, S.A.; Pfau, T. Accuracy and precision of hind limb foot contact timings of horses determined using a pelvis-mounted inertial measurement unit. J. Biomech. 2012, 45, 1522–1528. [Google Scholar] [CrossRef] [PubMed]
- Bosch, S.; Serra Bragança, F.; Marin-Perianu, M.; Marin-Perianu, R.; Van der Zwaag, B.J.; Voskamp, J.; Back, W.; Van Weeren, R.; Havinga, P. Equimoves: A wireless networked inertial measurement system for objective examination of horse gait. Sensors 2018, 18, 850. [Google Scholar] [CrossRef]
- Buchner, H.H.F.; Savelberg, H.H.C.M.; Schamhardt, H.C.; Barneveld, A. Inertial properties of Dutch Warmblood horses. J. Biomech. 1997, 30, 653–658. [Google Scholar] [CrossRef]
- Pavel, J.; Fercher, C.; Herold, F.; Becker, M. Der Einsatz maschinellen lernens zur inertialen Bewegungsanalyse am Pferderumpf für das digitale Trainingsmonitoring im Leistungssport. In Proceedings of the SKILL 2020—Studierendenkonferenz Informatik, Bonn, Germany, 30 September–1 October 2020; Gesellschaft für Informatik e.V.: Bonn, Germany, 2020; p. 149. [Google Scholar]
- Barrey, E.; Galloux, P. Analysis of the equine jumping technique by accelerometry. Equine Vet. J. 1997, 29, 45–49. [Google Scholar] [CrossRef] [PubMed]
- Warschun, F.; Fercher, C.; Schleichardt, A.; Ueberschär, O. Reliabilität von Xsens MTw Awinda Motion Trackern im Springreiten. In Proceedings of the 24. dvs-Hochschultag, Berlin, Germany, 18–20 September 2019; Arampatzis, A., Braun, S., Schmitt, K., Wolfarth, B., Eds.; 422 S. Feldhaus, Edition Czwalina (Verlag): Hamburg, Germany; Lit: Berlin, Germany, 2019. [Google Scholar]
- Doncaster, C.P.; Davey, A.J. Analysis of Variance and Covariance: How to Choose and Construct Models for the Life Sciences; Cambridge University Press: Cambridge, UK, 2007. [Google Scholar]
- Cohen, J. Statistical Power Analysis for the Behavioral Sciences, 2nd ed.; Lawrence Erlbaum Associates: Hillsdale, NJ, USA, 1988. [Google Scholar]
- Bragança, F.M.; Bosch, S.; Voskamp, J.P.; Marin-Perianu, M.; Van der Zwaag, B.J.; Vernooij, J.C.M.; van Weeren, P.R.; Back, W. Validation of distal limb mounted inertial measurement unit sensors for stride detection in Warmblood horses at walk and trot. Equine Vet. J. 2017, 49, 545–551. [Google Scholar] [CrossRef] [PubMed]
- Serra Bragança, F.M.; Roepstorff, C.; Rhodin, M.; Pfau, T.; van Weeren, P.R.; Roepstorff, L. Quantitative lameness assessment in the horse based on upper body movement symmetry: The effect of different filtering techniques on the quantification of motion symmetry. Biomed. Signal Process. Control 2020, 57, 101674. [Google Scholar] [CrossRef]


| Walk | Trot | Canter | ||||
|---|---|---|---|---|---|---|
| Mean | ±SD | Mean | ±SD | Mean | ±SD | |
| Number of trials | 80 | 80 | 80 | |||
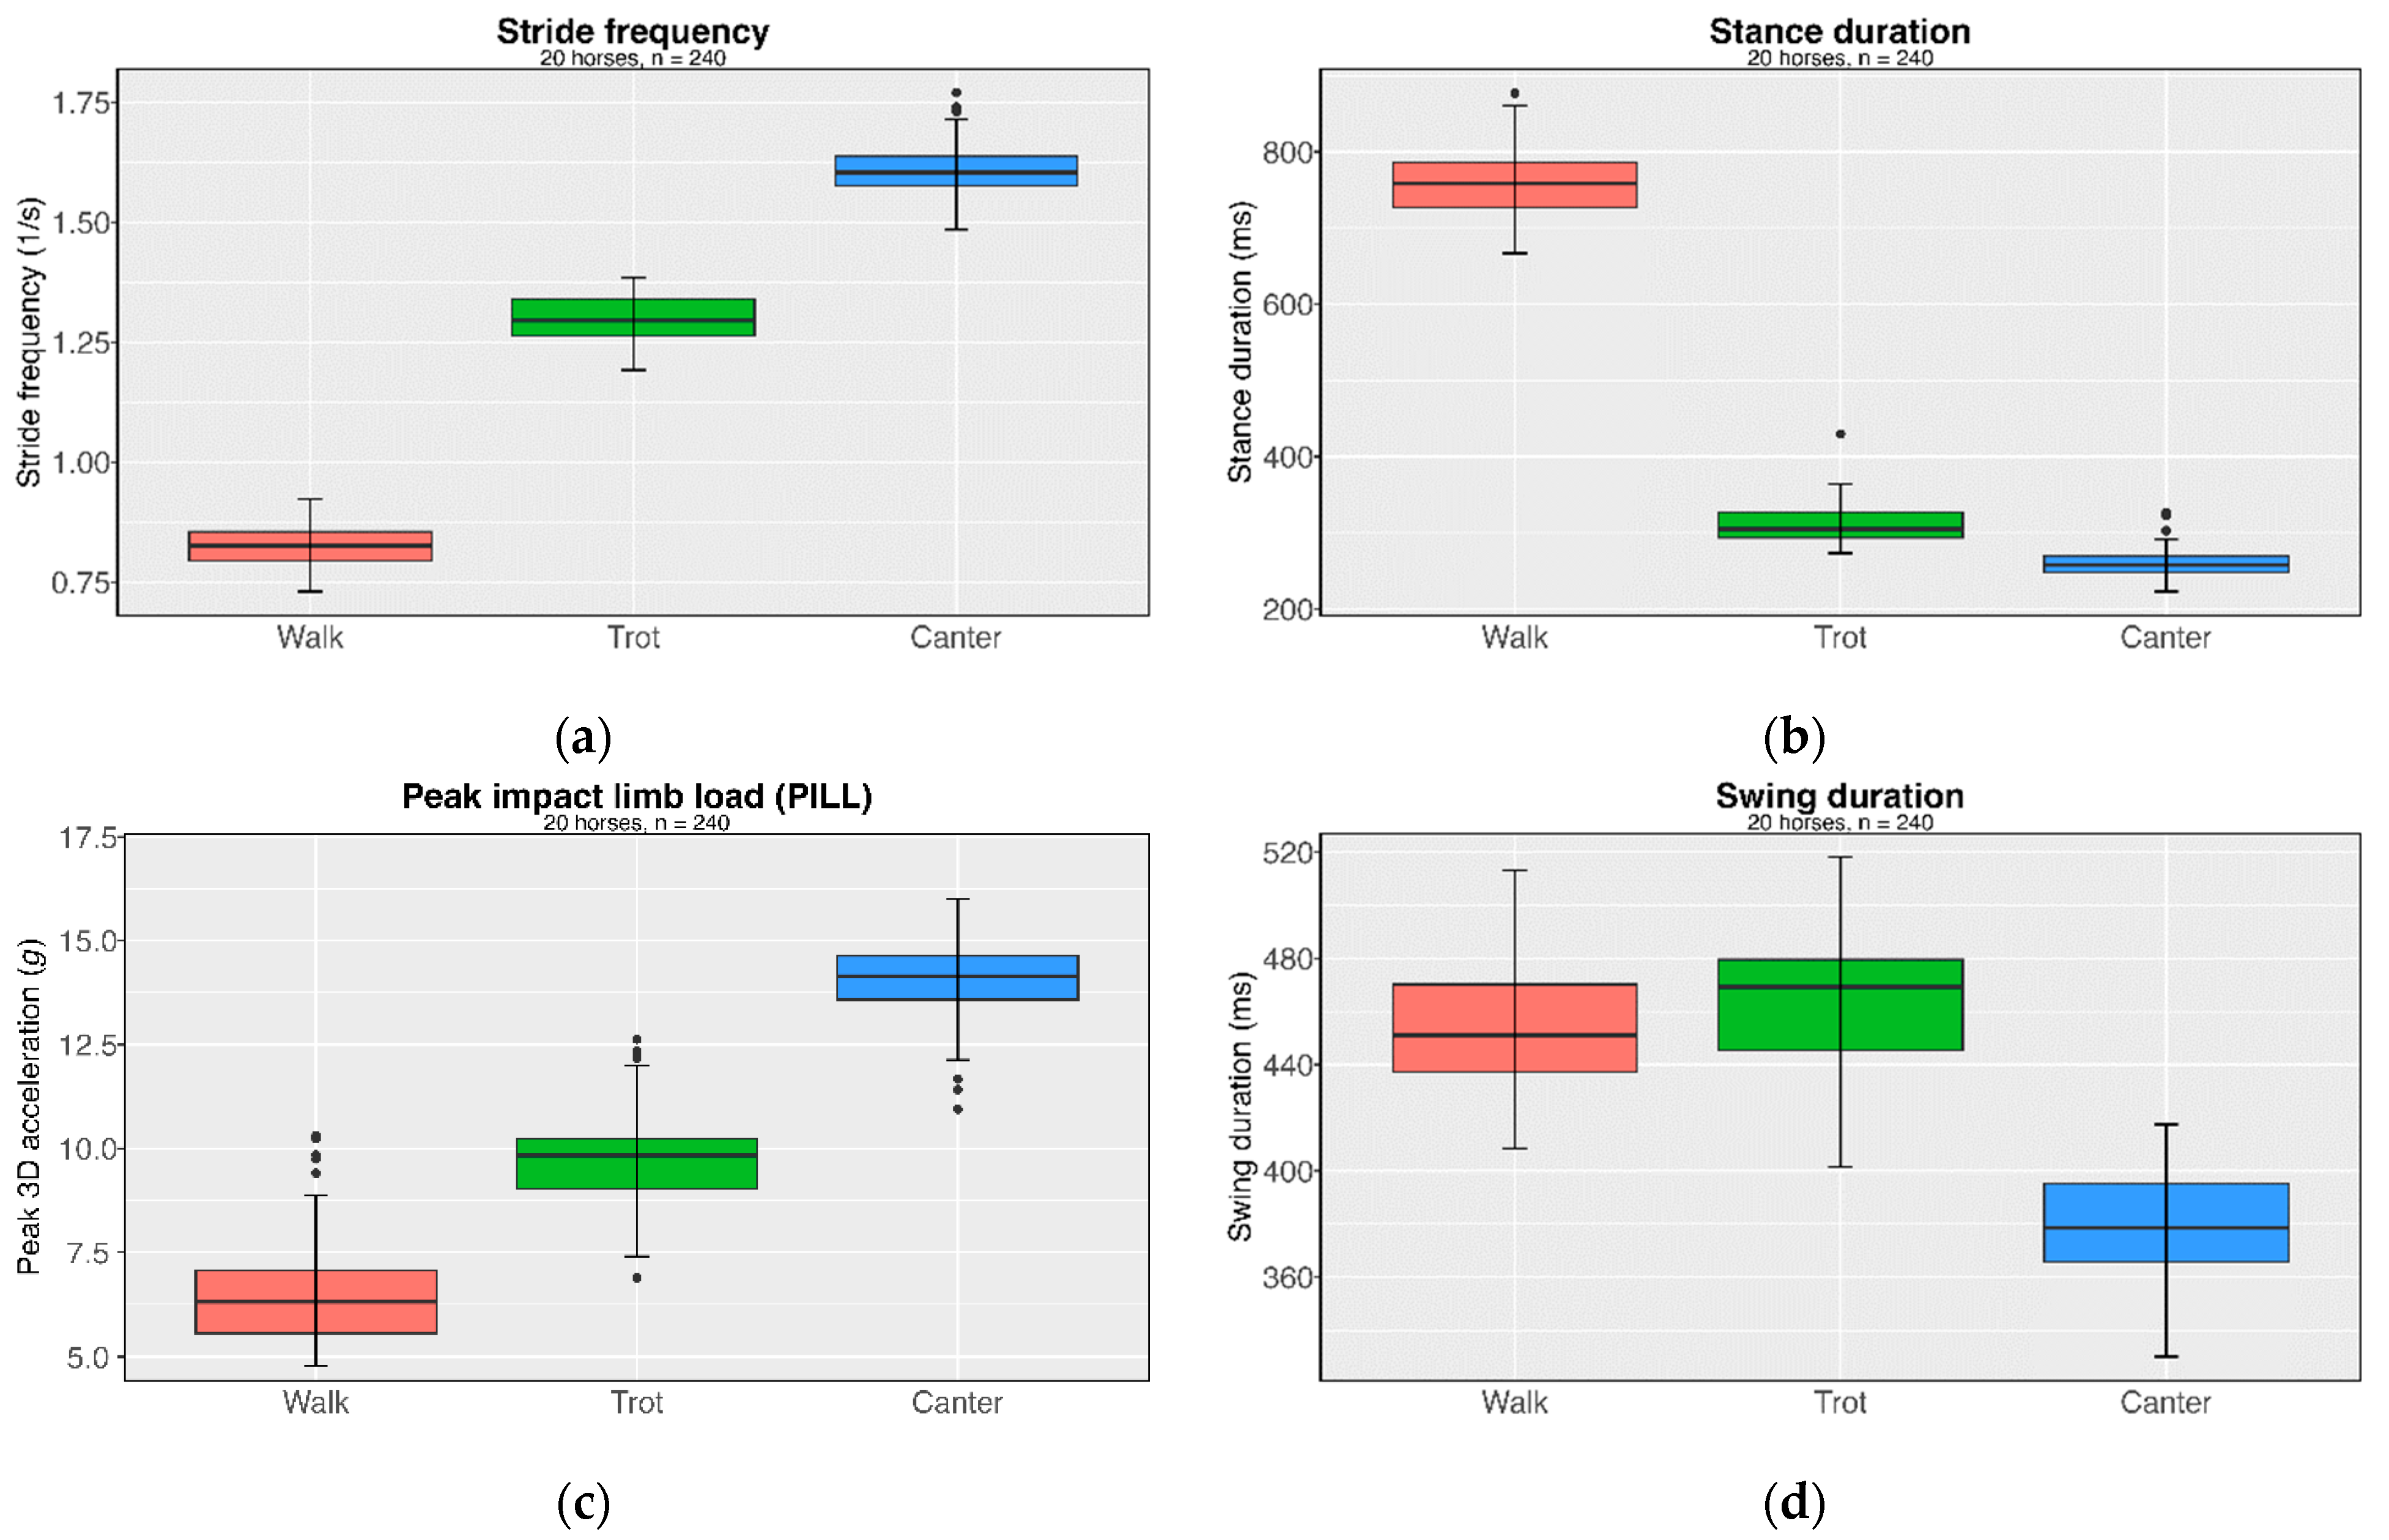
| Stride frequency (1/s) | 0.83 | 0.05 | 1.30 | 0.05 | 1.61 | 0.06 |
| Stride duration (s) | 1.21 | 0.07 | 0.78 | 0.03 | 0.63 | 0.02 |
| Stance duration (ms) | 757.69 | 49.70 | 313.18 | 26.87 | 260.46 | 20.80 |
| Swing duration (ms) | 454.09 | 24.47 | 463.60 | 25.90 | 378.53 | 19.53 |
| Peak impact limb load (PILL) (g) | 6.55 | 1.28 | 9.77 | 1.04 | 14.03 | 0.93 |
| Walk | Trot | Canter | ||||
|---|---|---|---|---|---|---|
| Mean | ±SD | Mean | ±SD | Mean | ±SD | |
| Number of trials | 80 | 80 | 80 | |||
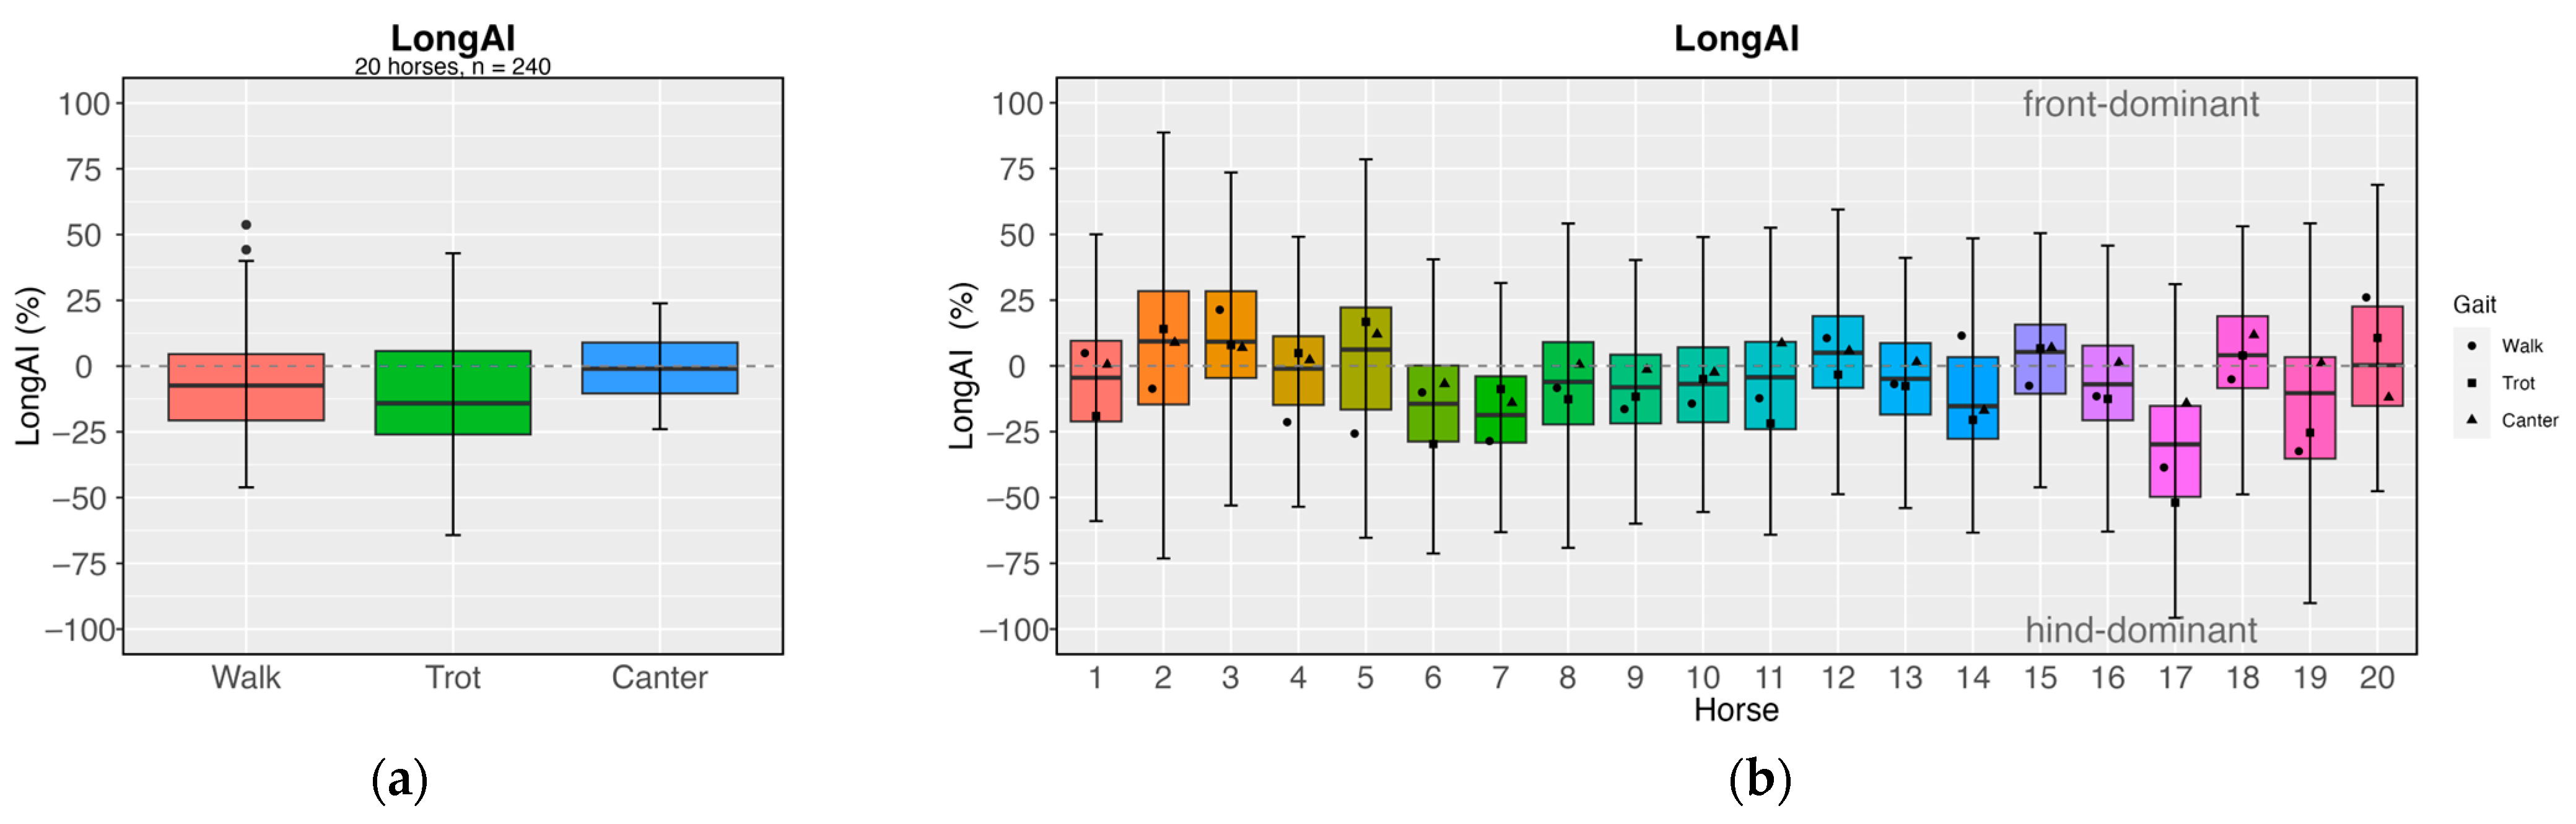
| LongAI (%) | −6.24 | 20.99 | −11.53 | 23.87 | −0.72 | 12.13 |
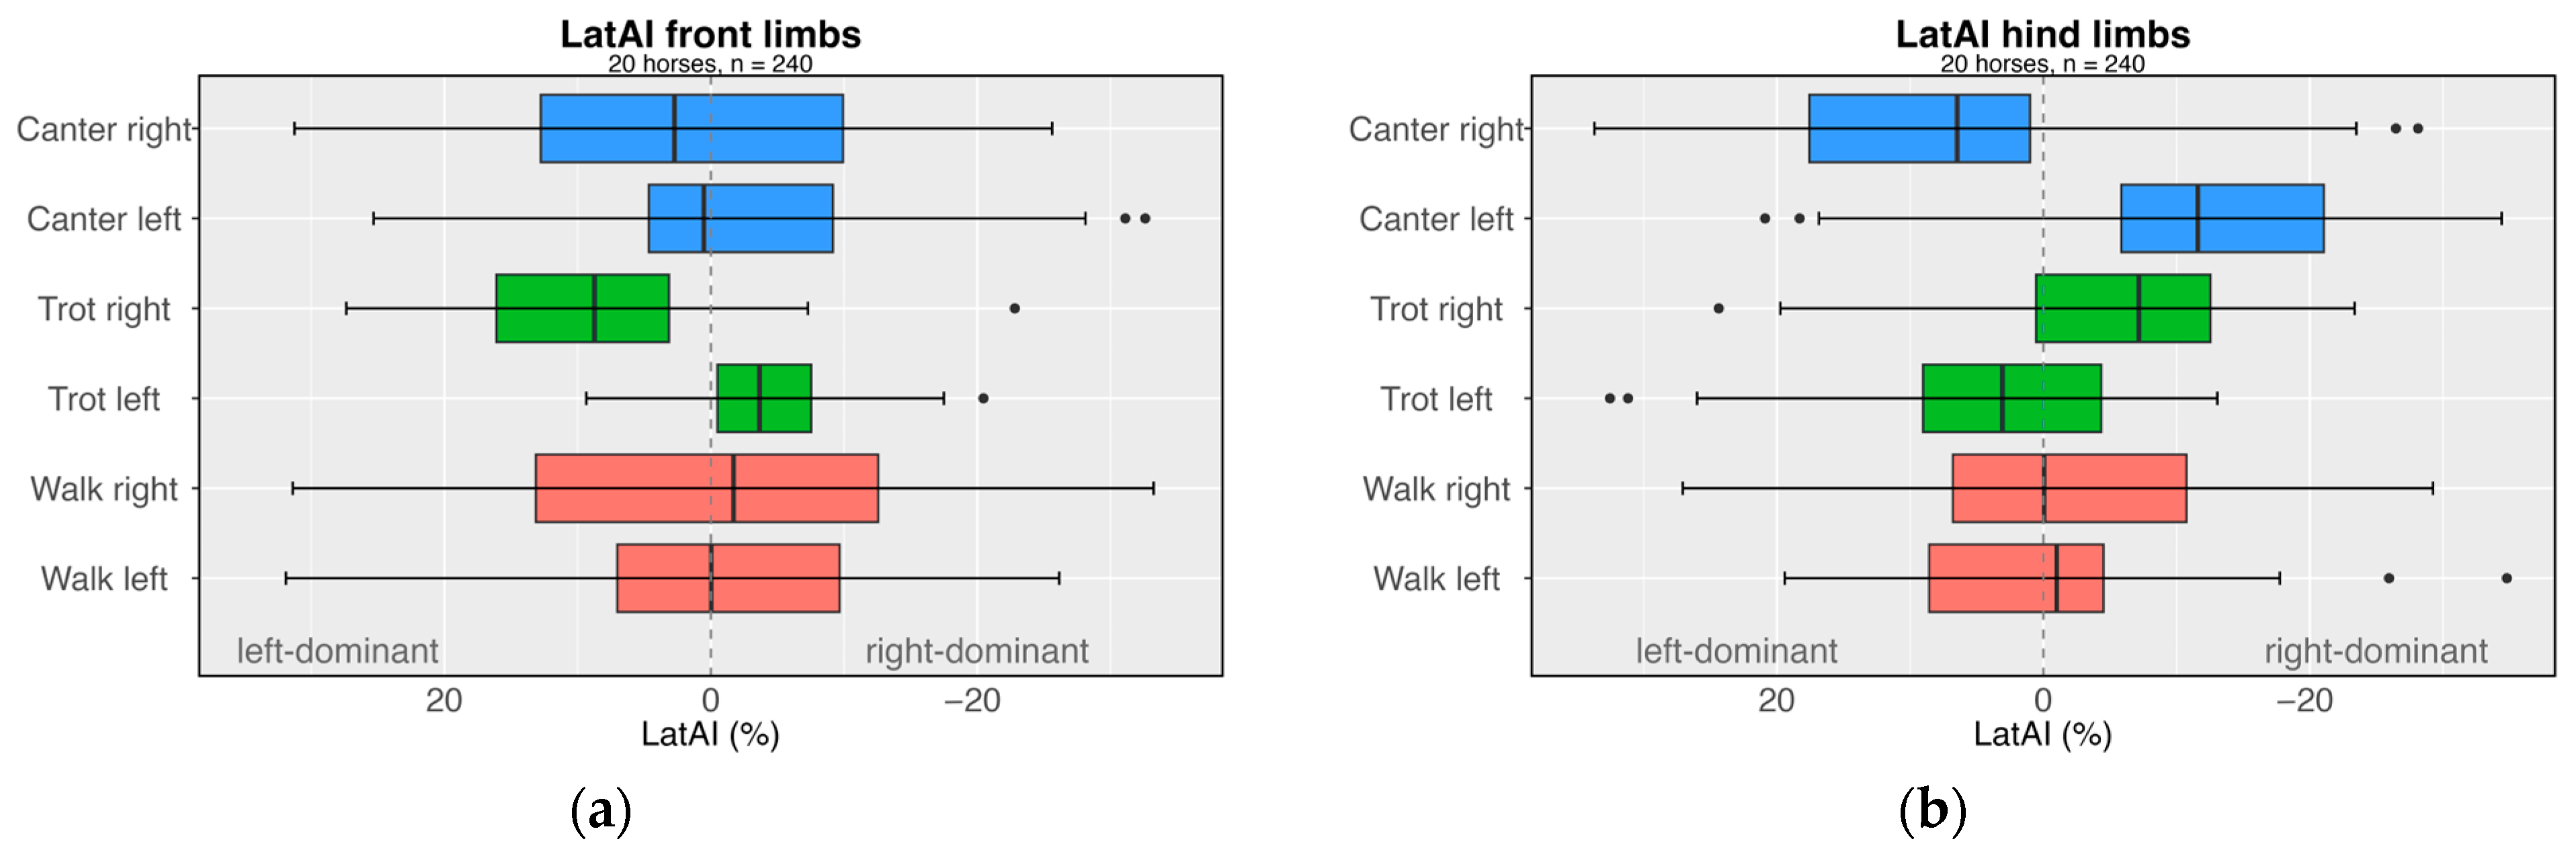
| LatAI | ||||||
| Number of trials | 40/40 | 40/40 | 40/40 | |||
| Forelimbs (%) | 1.20/−0.40 | 16.22/16.71 | −4.10/7.67 | 6.60/12.02 | −2.54/3.07 | 14.73/15.71 |
| Hindlimbs (%) | −0.74/−0.67 | 11.36/12.43 | 6.15/−6.91 | 15.04/14.84 | −12.04/9.51 | 13.44/17.01 |
Disclaimer/Publisher’s Note: The statements, opinions and data contained in all publications are solely those of the individual author(s) and contributor(s) and not of MDPI and/or the editor(s). MDPI and/or the editor(s) disclaim responsibility for any injury to people or property resulting from any ideas, methods, instructions or products referred to in the content. |
© 2024 by the authors. Licensee MDPI, Basel, Switzerland. This article is an open access article distributed under the terms and conditions of the Creative Commons Attribution (CC BY) license (https://creativecommons.org/licenses/by/4.0/).
Share and Cite
Fercher, C.; Bartsch, J.; Kluge, S.; Schneider, F.; Liedtke, A.M.; Schleichardt, A.; Ueberschär, O. Applying Multi-Purpose Commercial Inertial Sensors for Monitoring Equine Locomotion in Equestrian Training. Sensors 2024, 24, 8170. https://doi.org/10.3390/s24248170
Fercher C, Bartsch J, Kluge S, Schneider F, Liedtke AM, Schleichardt A, Ueberschär O. Applying Multi-Purpose Commercial Inertial Sensors for Monitoring Equine Locomotion in Equestrian Training. Sensors. 2024; 24(24):8170. https://doi.org/10.3390/s24248170
Chicago/Turabian StyleFercher, Christina, Julia Bartsch, Steffen Kluge, Franziska Schneider, Anna M. Liedtke, Axel Schleichardt, and Olaf Ueberschär. 2024. "Applying Multi-Purpose Commercial Inertial Sensors for Monitoring Equine Locomotion in Equestrian Training" Sensors 24, no. 24: 8170. https://doi.org/10.3390/s24248170
APA StyleFercher, C., Bartsch, J., Kluge, S., Schneider, F., Liedtke, A. M., Schleichardt, A., & Ueberschär, O. (2024). Applying Multi-Purpose Commercial Inertial Sensors for Monitoring Equine Locomotion in Equestrian Training. Sensors, 24(24), 8170. https://doi.org/10.3390/s24248170