Smart Concrete Using Optical Sensors Based on Bragg Gratings Embedded in a Cementitious Mixture: Cure Monitoring and Beam Test

 , and
, and 
Abstract
1. Introduction
2. Materials and Methods
2.1. Fiber Bragg Gratings
2.1.1. FBG Strain Sensor
2.1.2. FBG Hygrometer Sensor
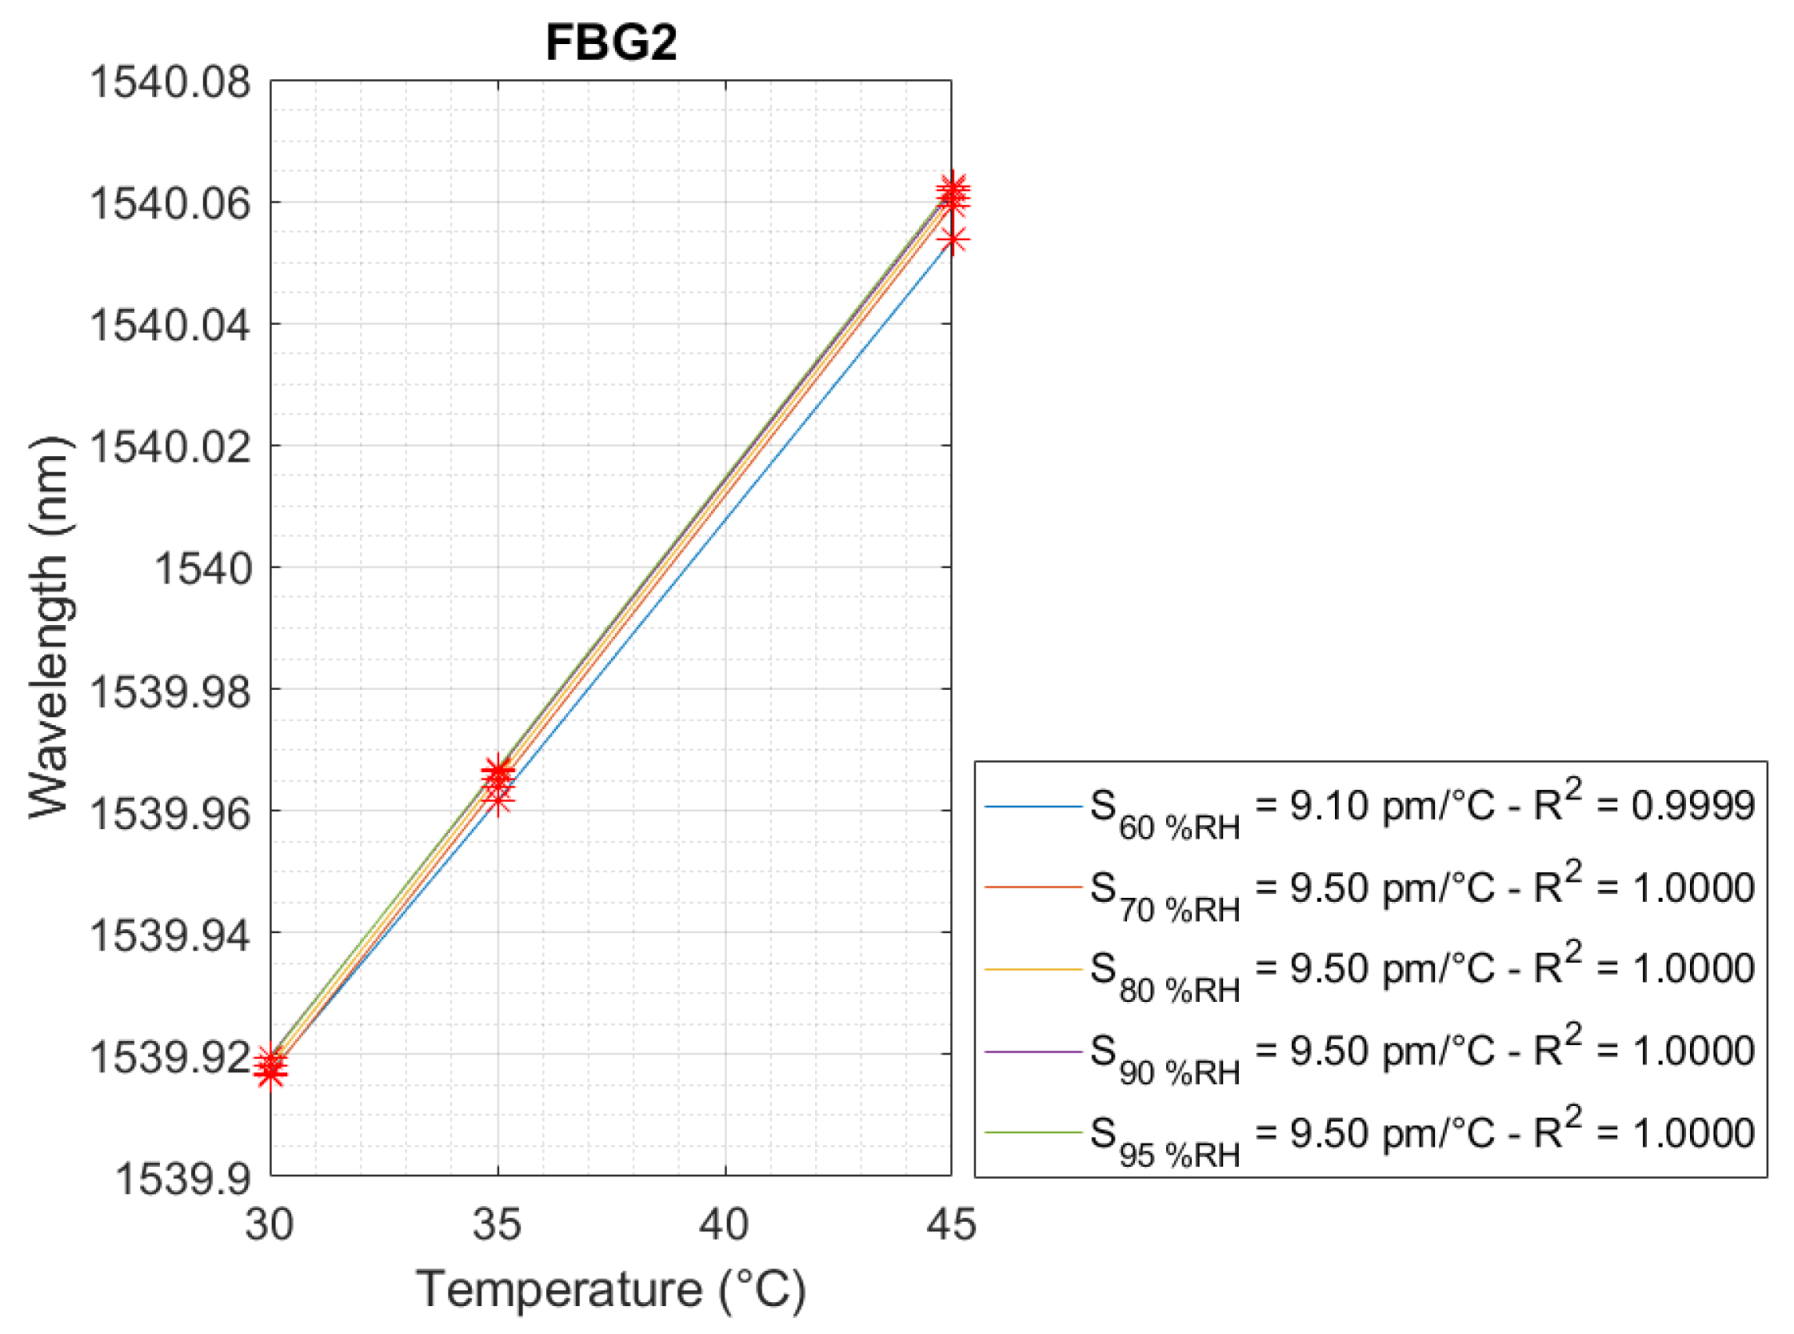
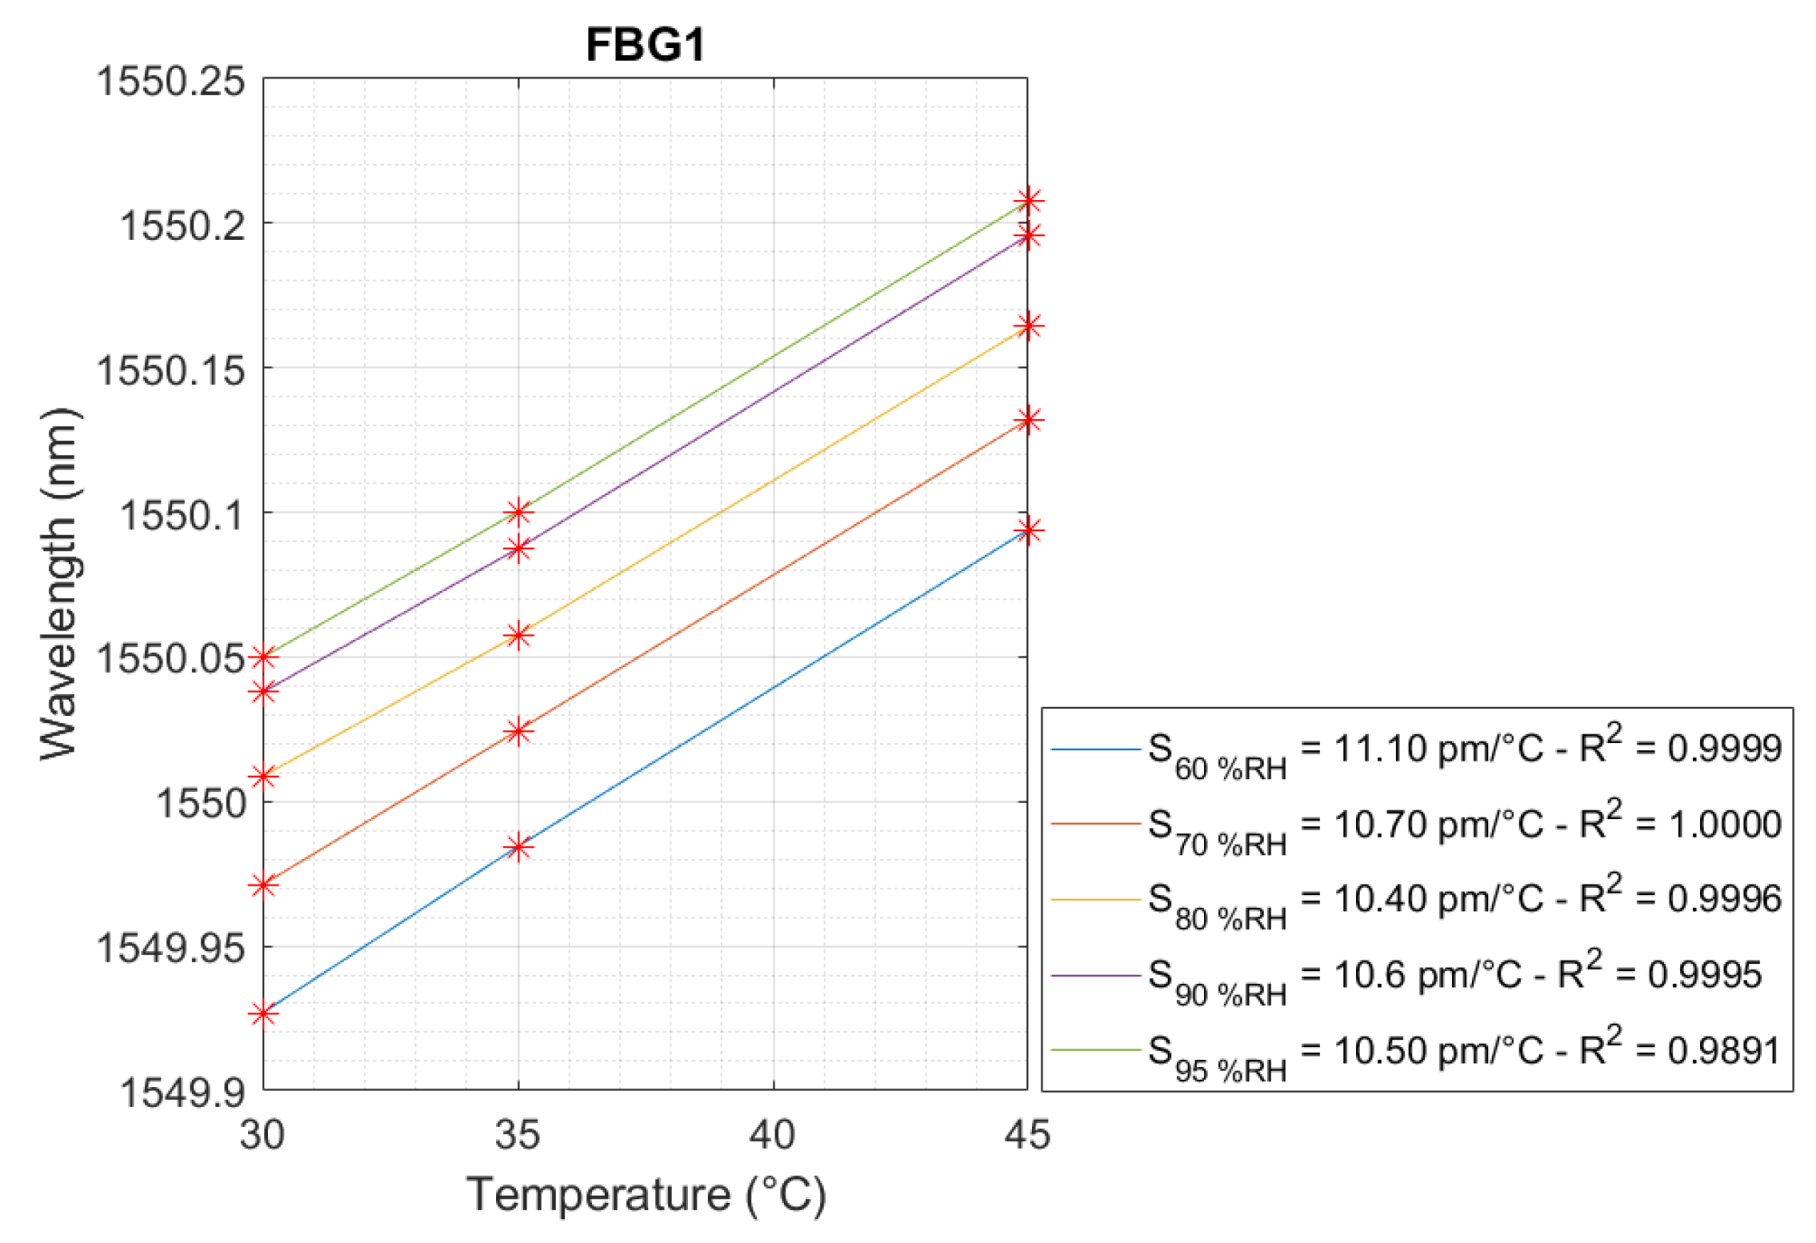
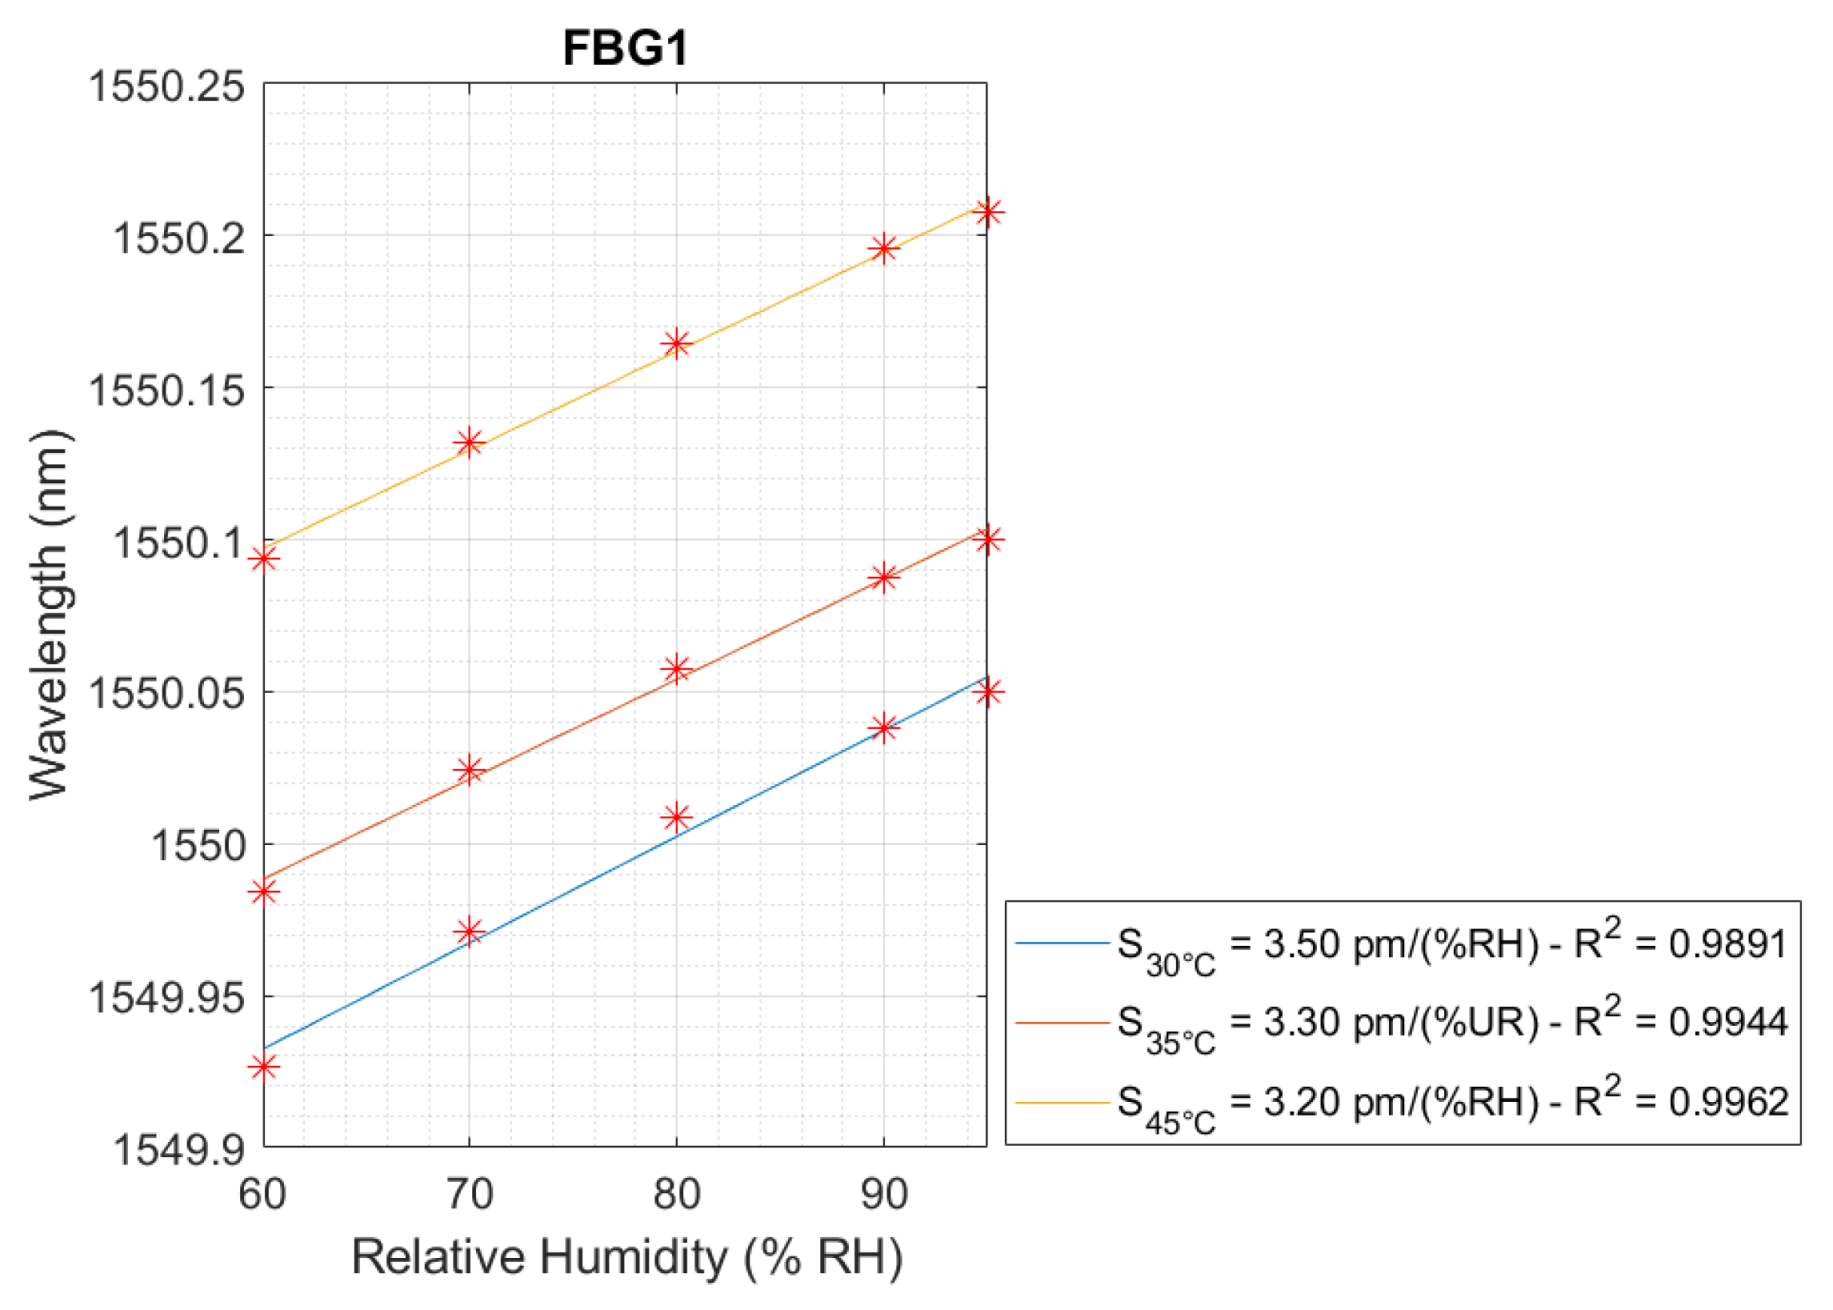
2.2. Calibration Test
2.3. Concrete Mixture
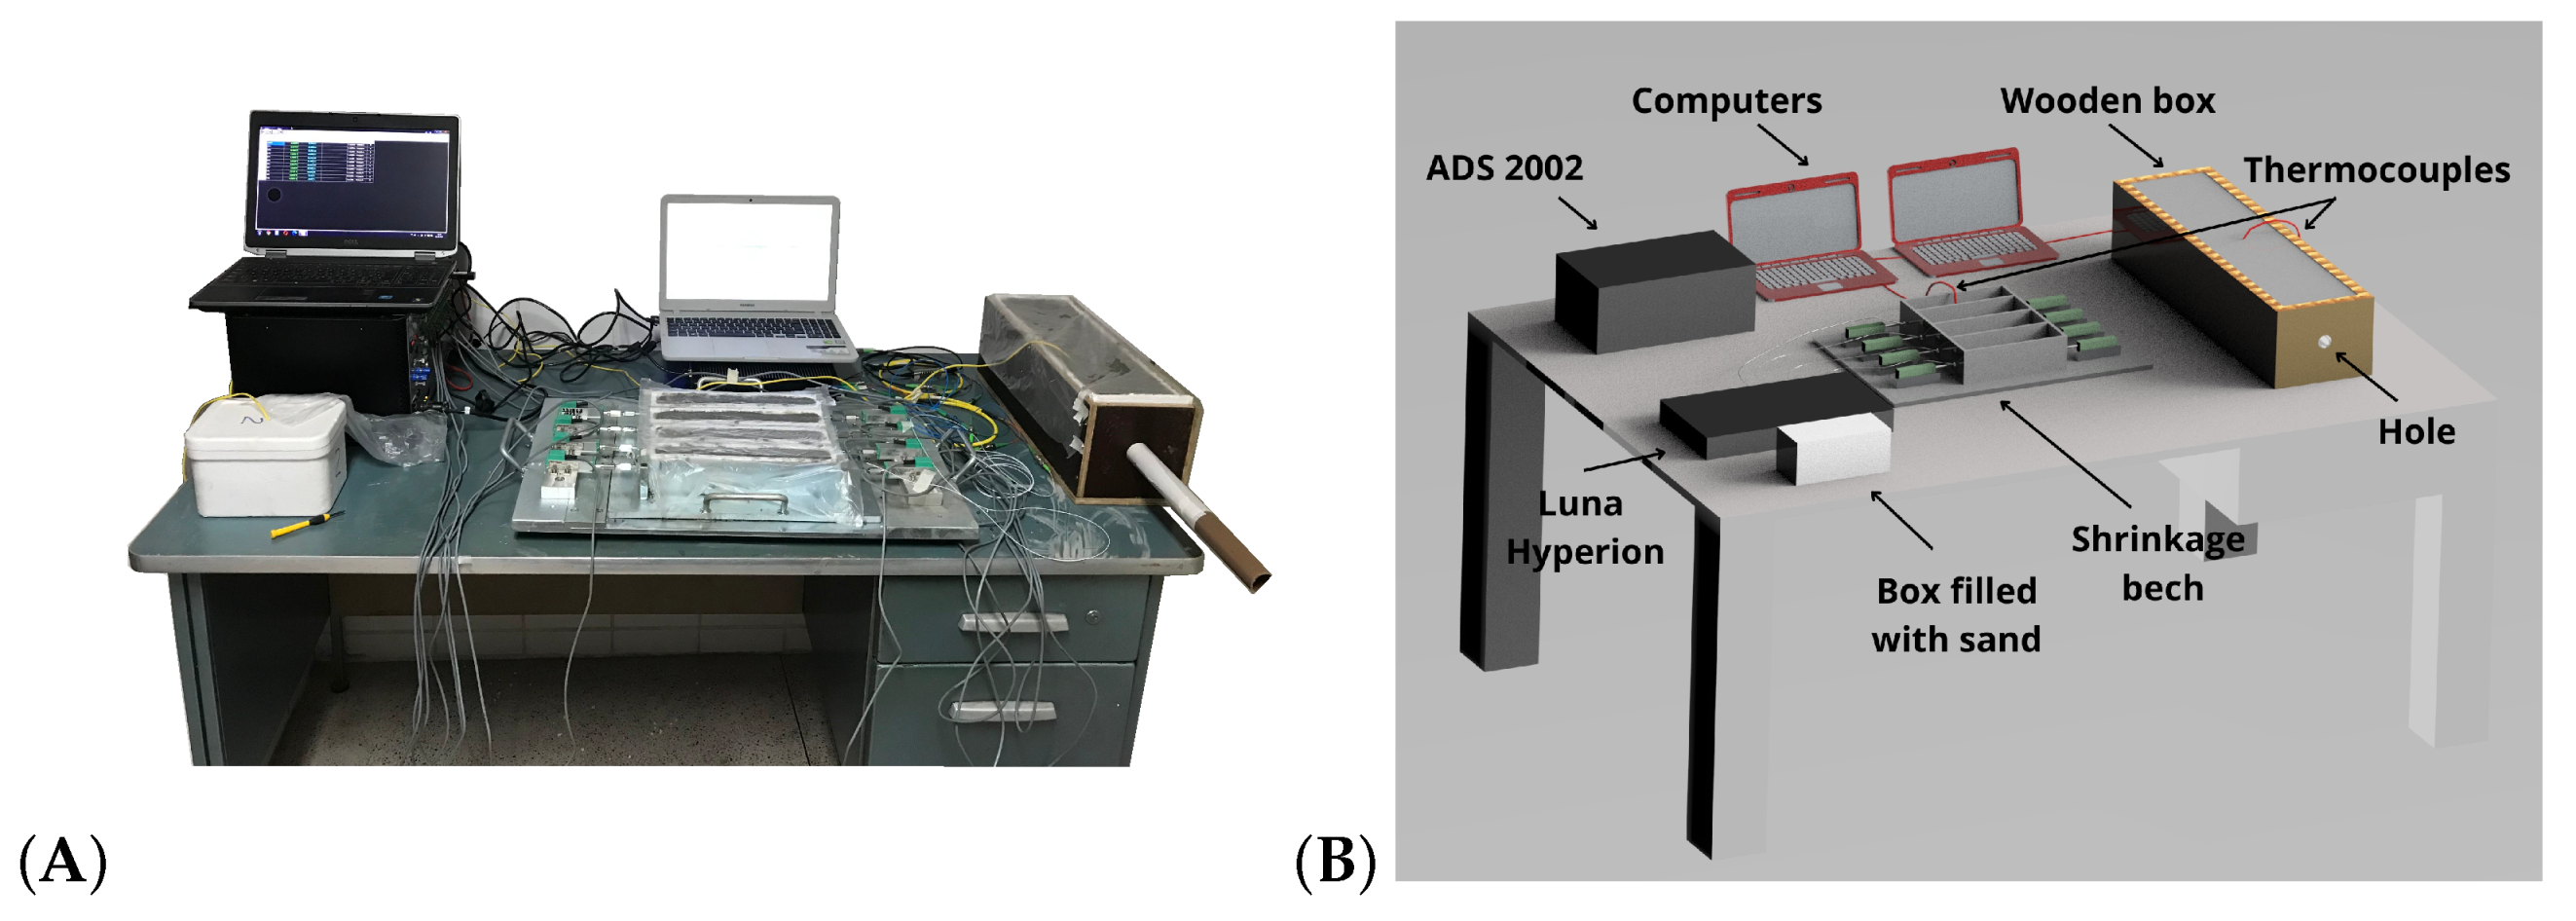
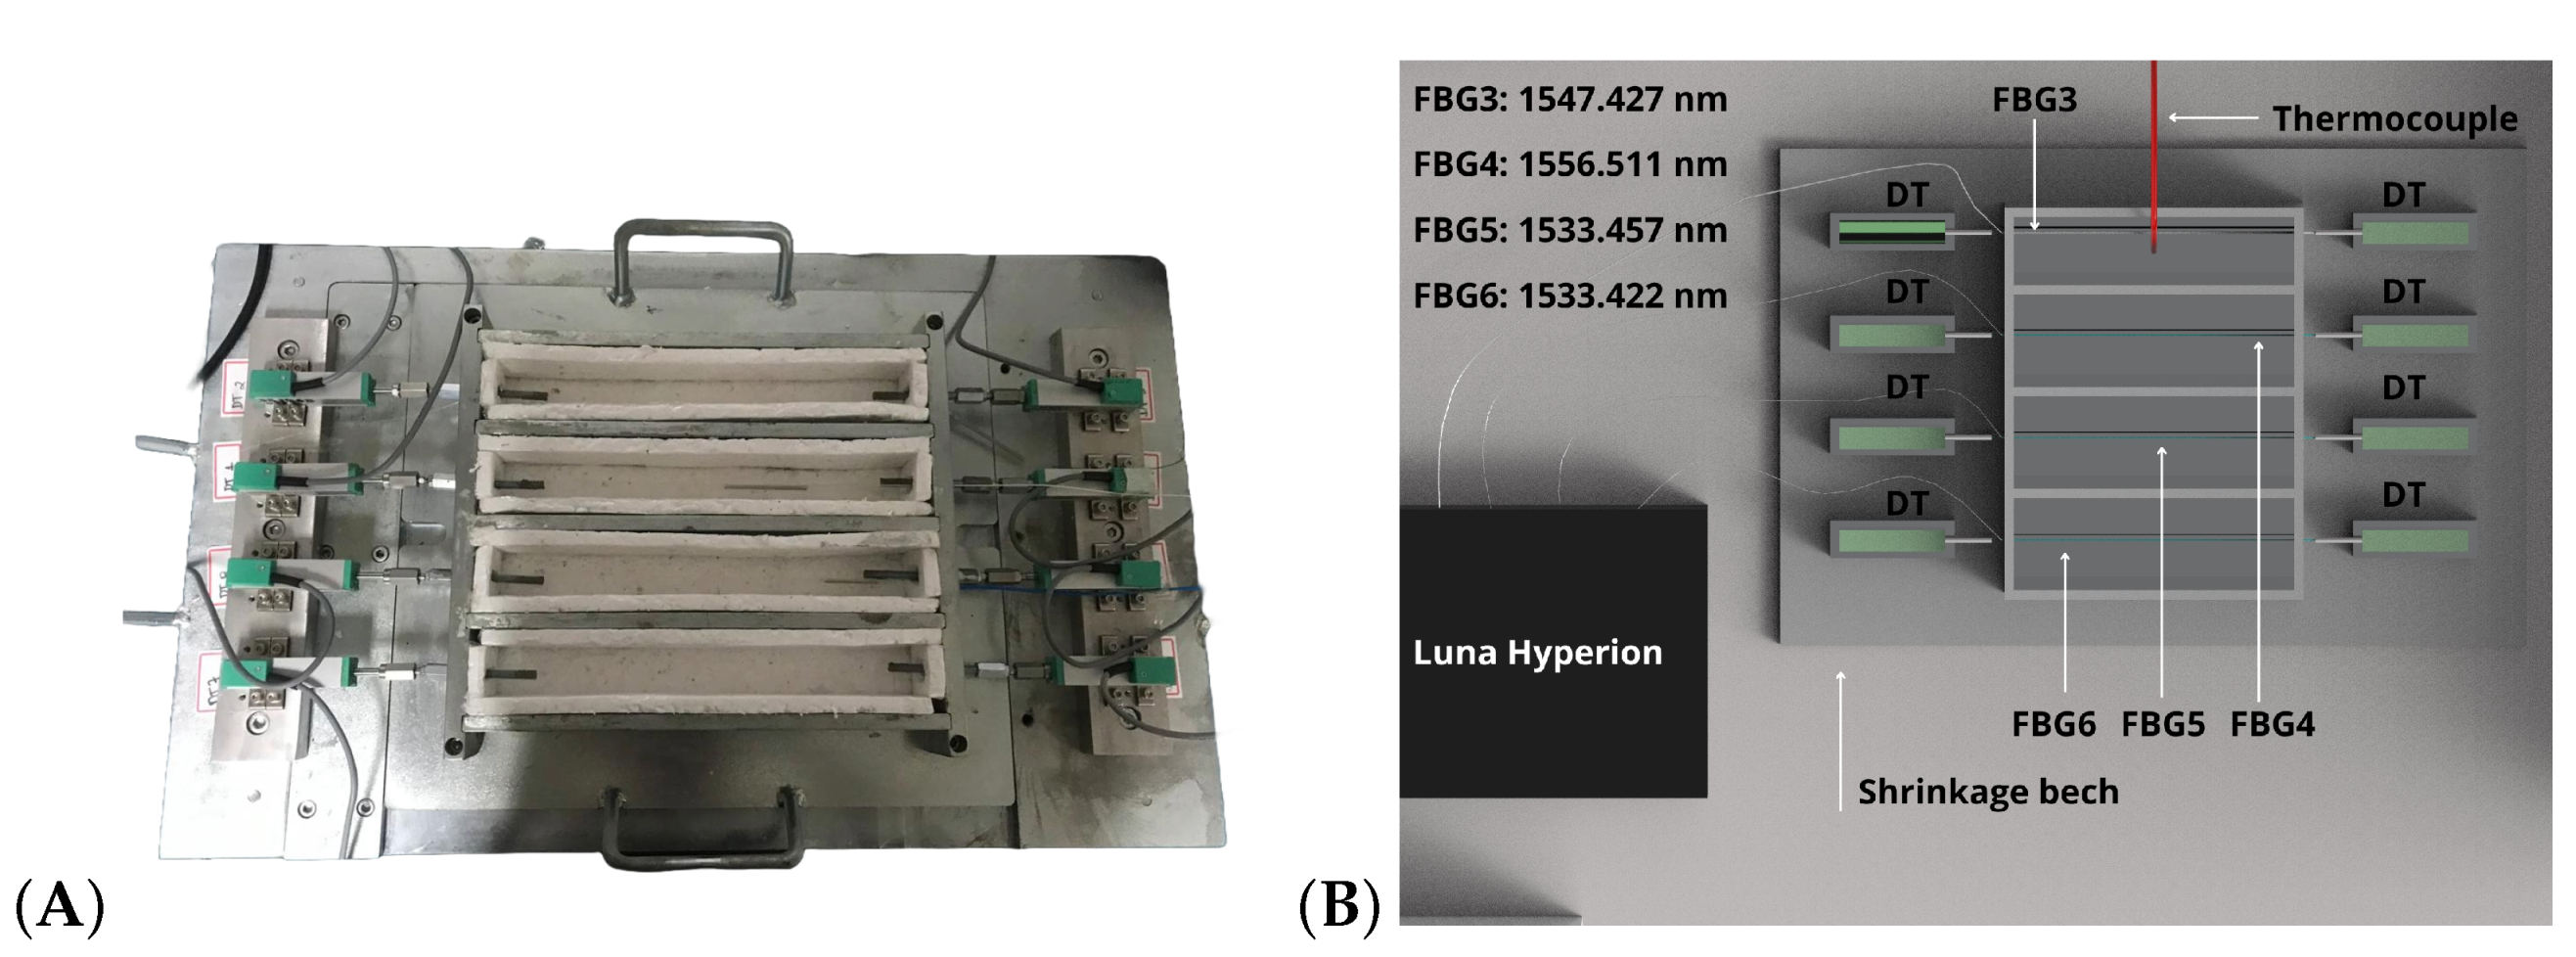
2.4. Monitoring Curing Concrete
Experimental Setup
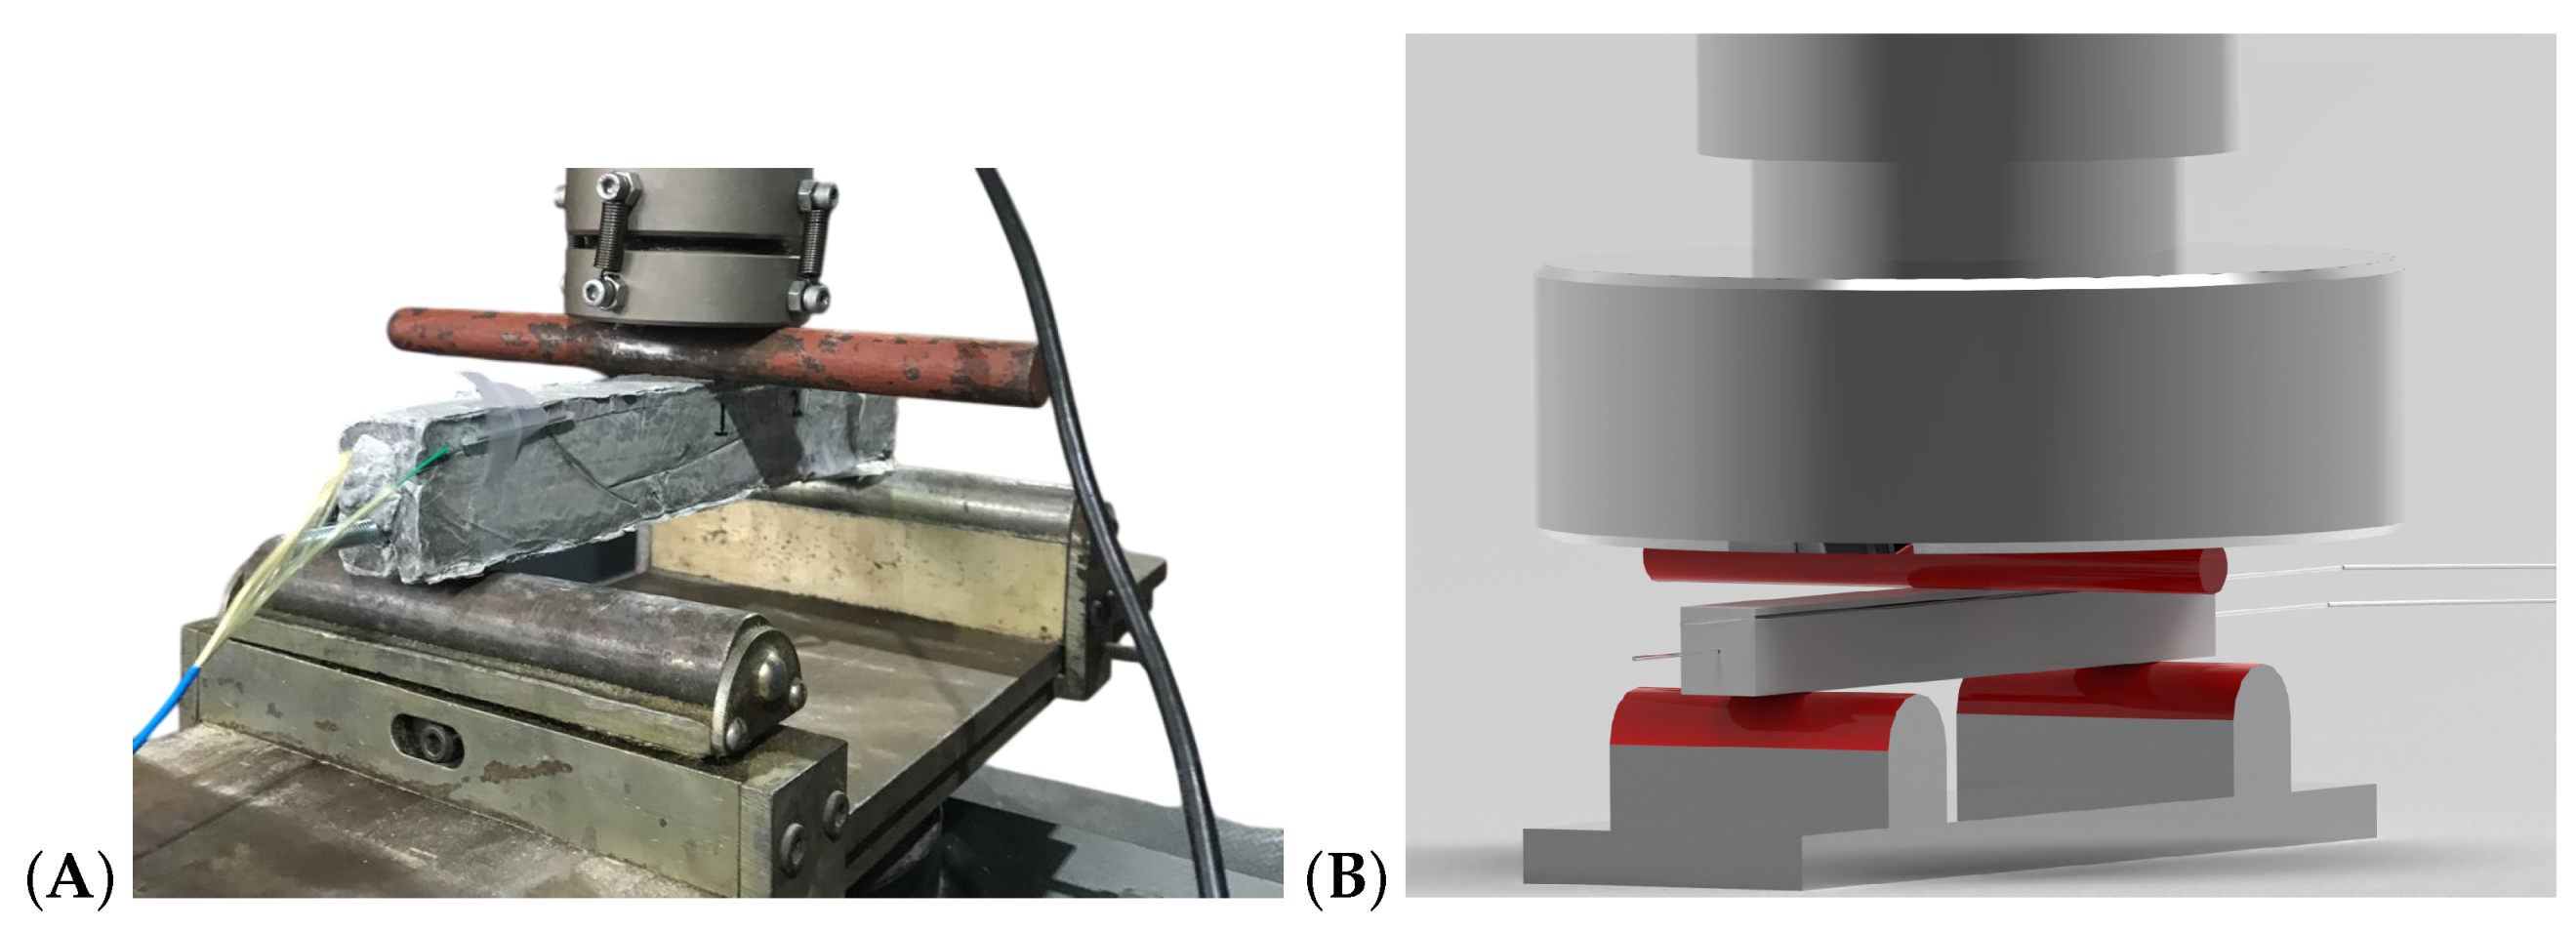
2.5. Beam Test
Experimental Setup
3. Results and Discussions
3.1. Calibratrion Test
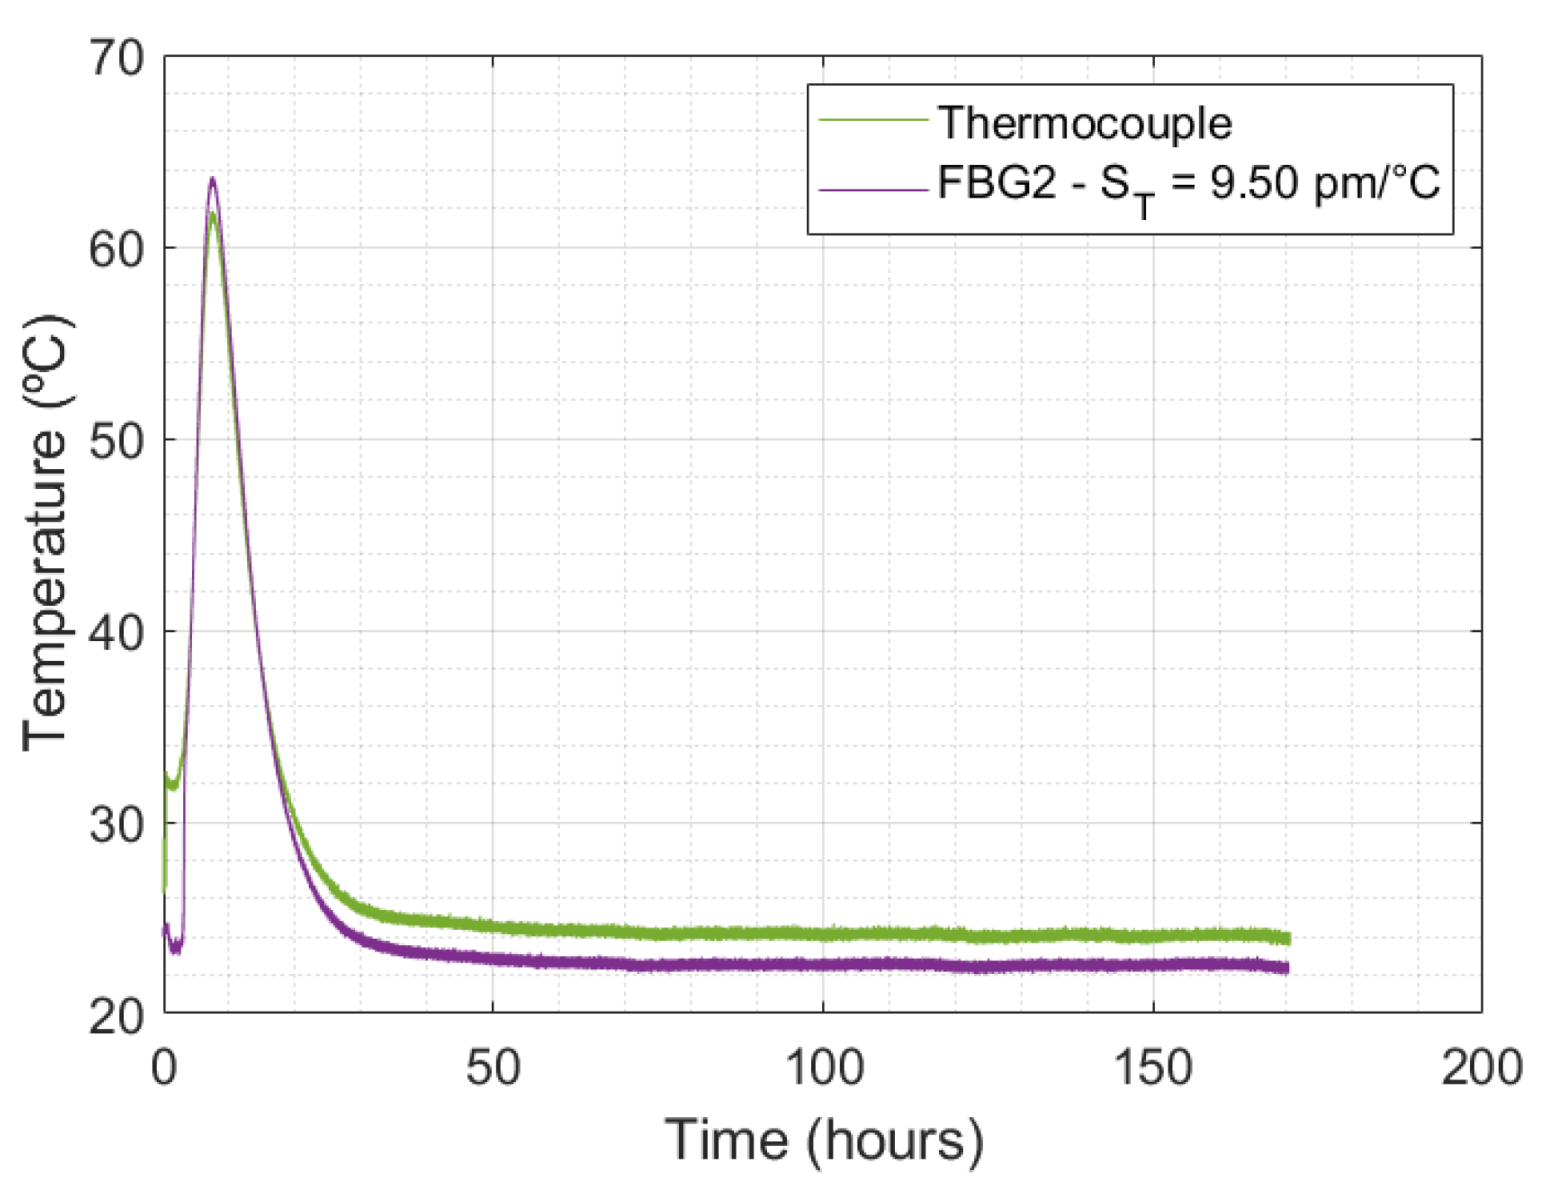
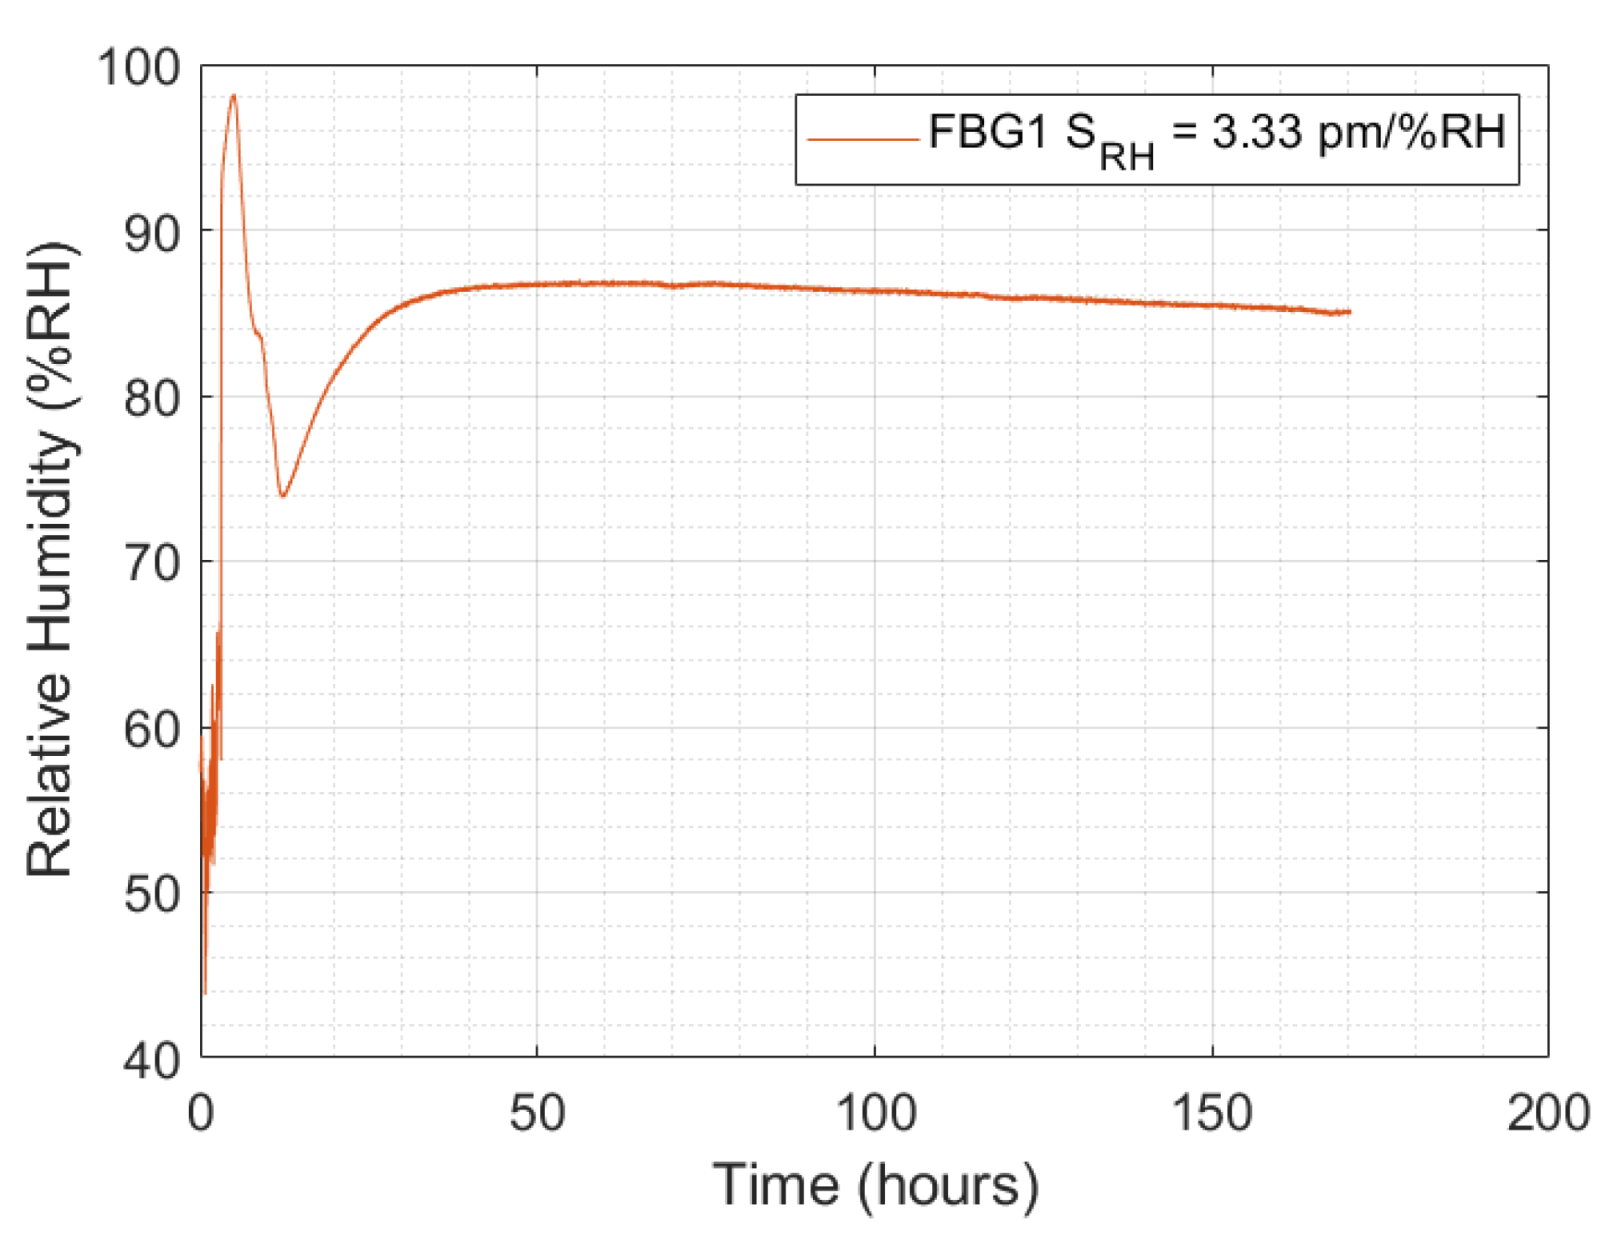
3.2. Concrete Curing Monitoring Test
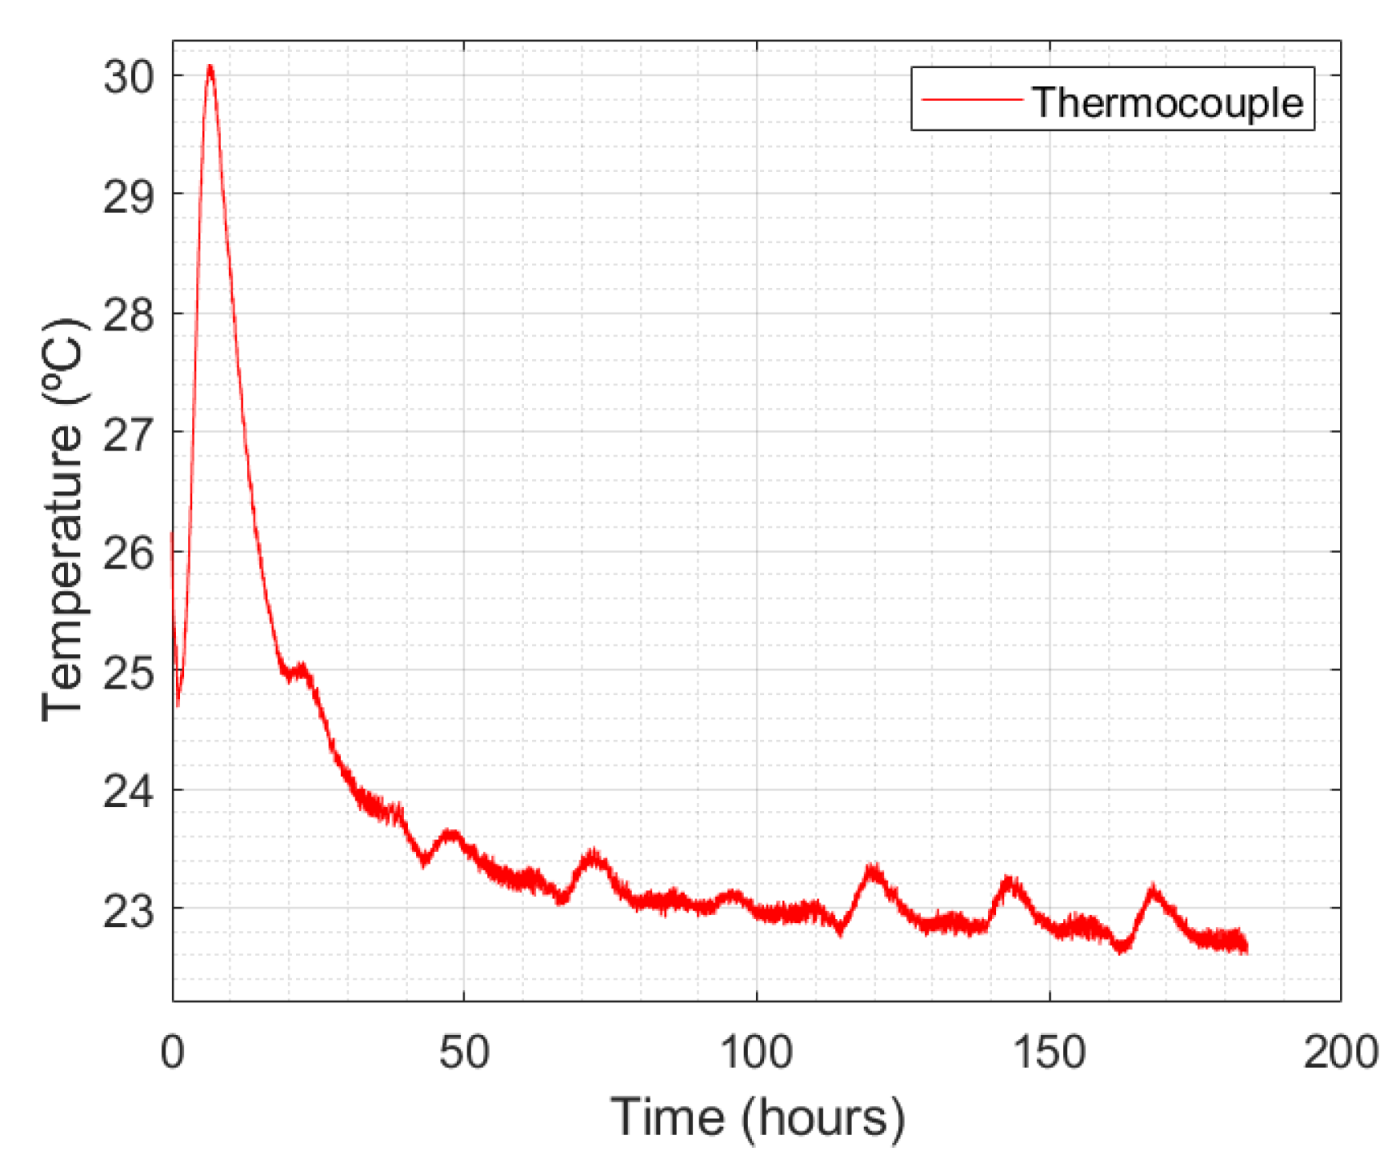
3.2.1. Temperature and Relative Humidity
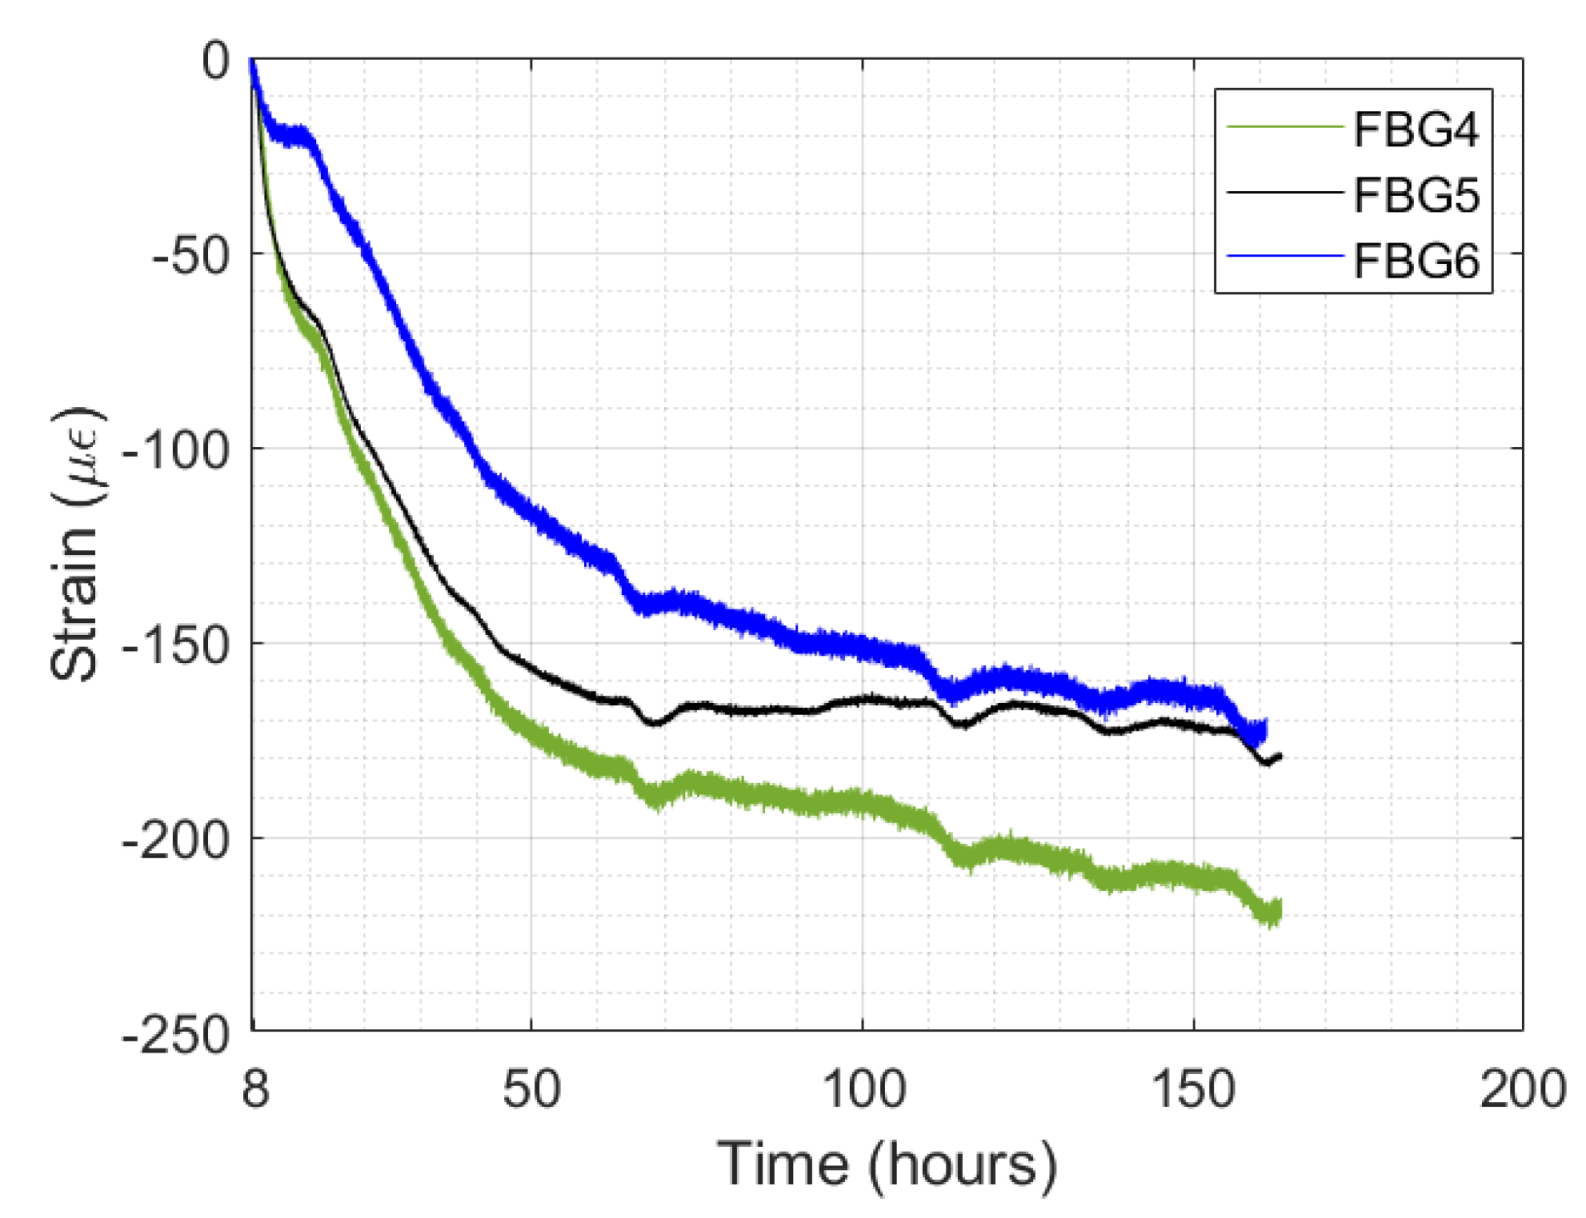
3.2.2. Autogenous Shrinkage Strain
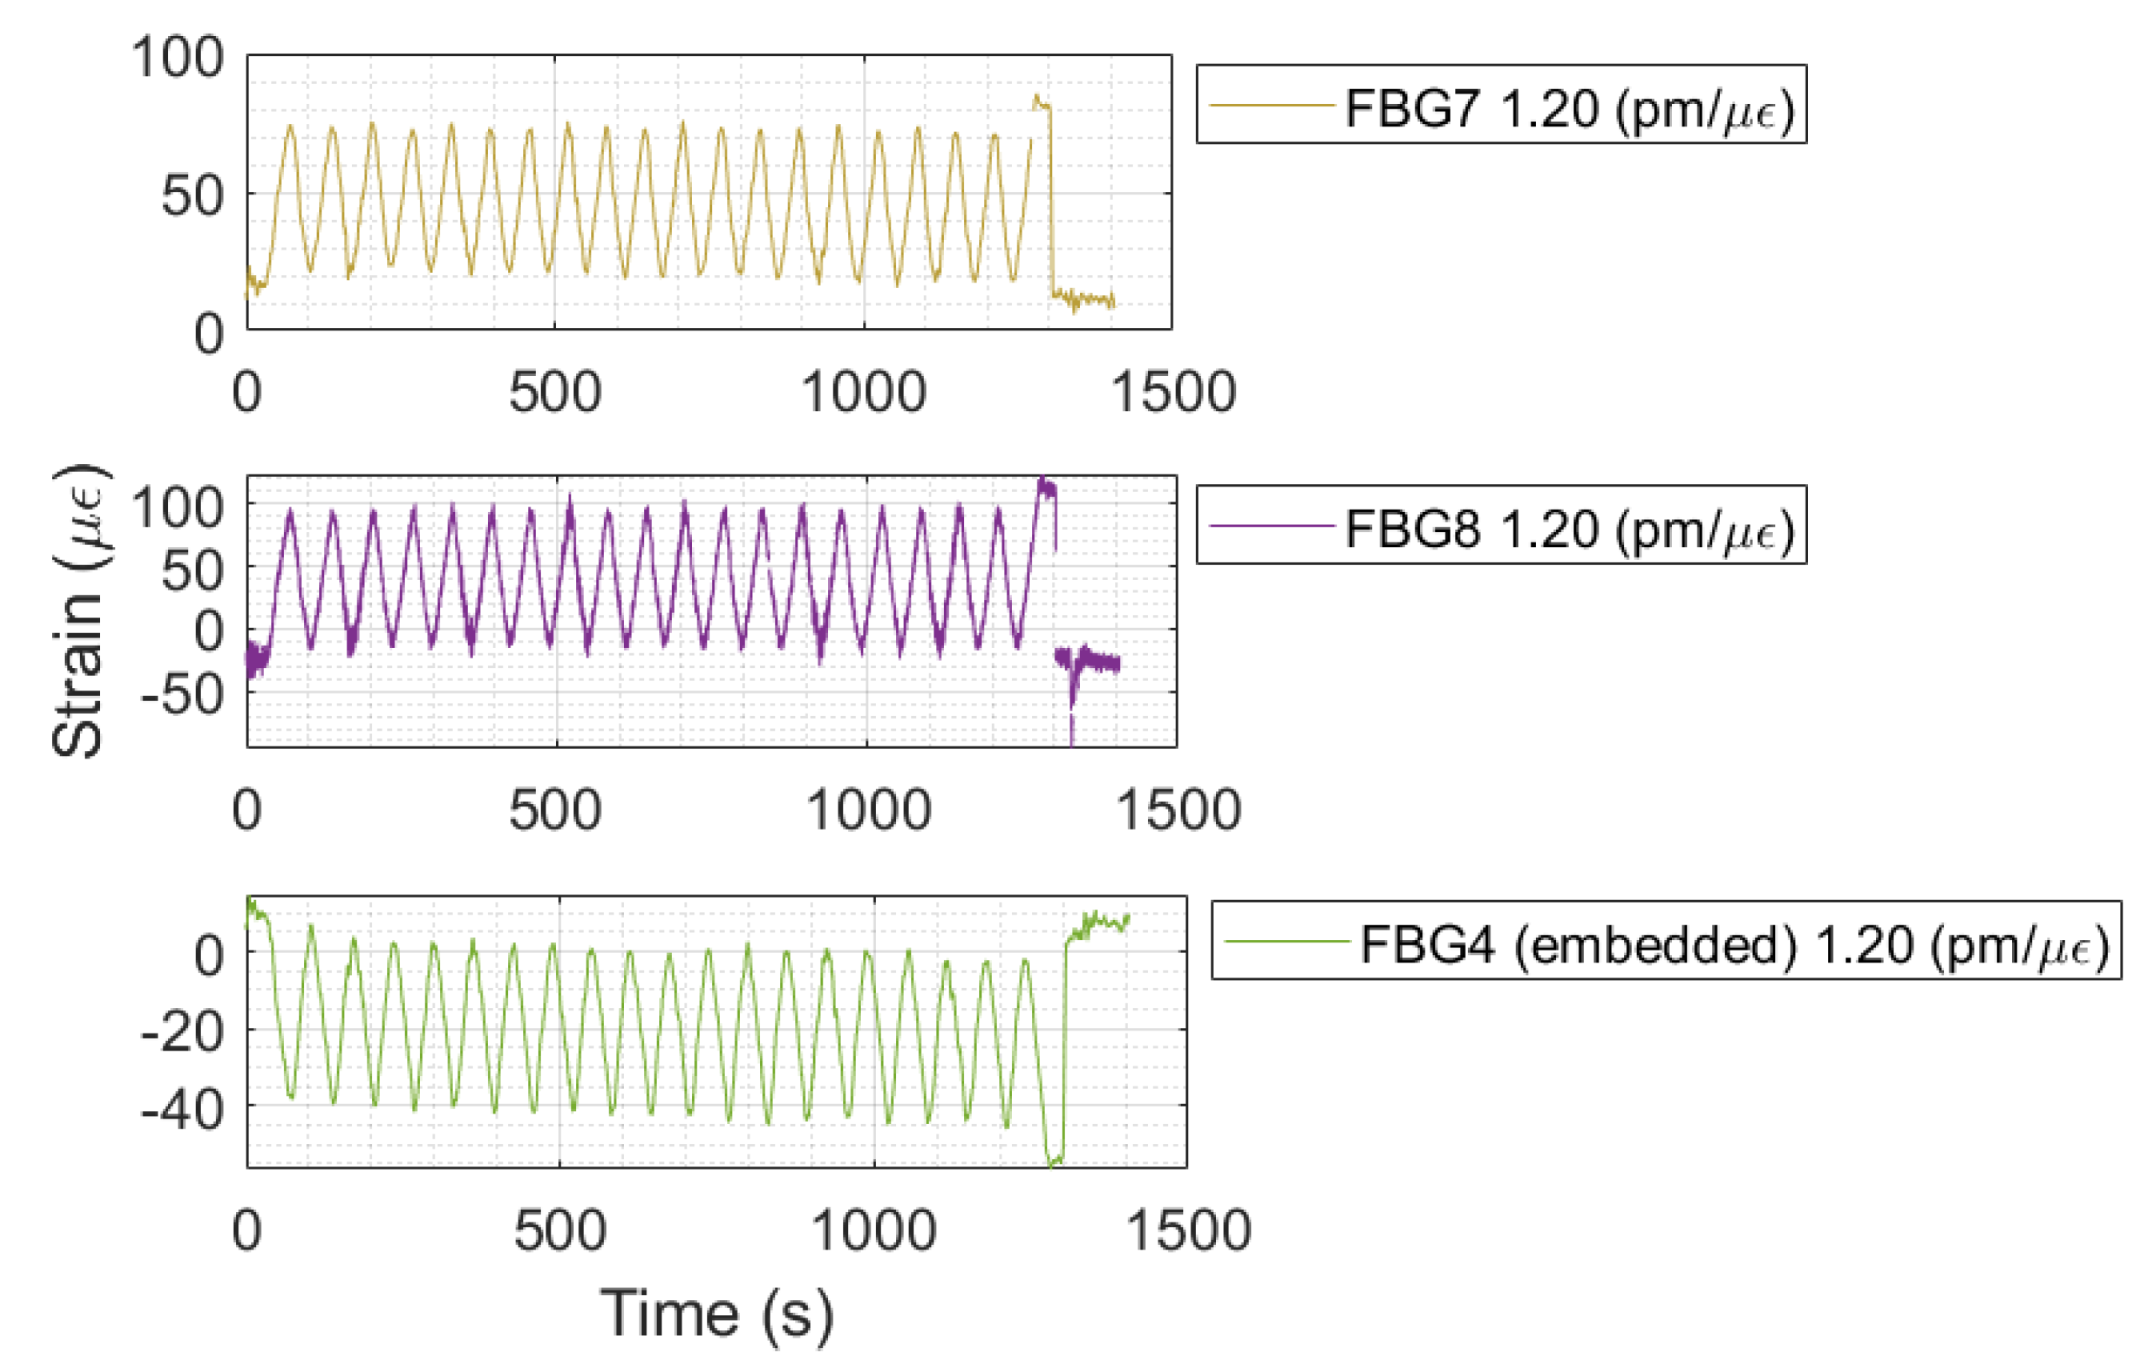
3.3. Beam Test
4. Conclusions
Author Contributions
Funding
Institutional Review Board Statement
Informed Consent Statement
Data Availability Statement
Conflicts of Interest
References
- Fang, B.; Yu, J.; Chen, Z.; Osman, A.I.; Farghali, M.; Ihara, I.; Hamza, E.H.; Rooney, D.W.; Yap, P.S. Artificial intelligence for waste management in smart cities: A review. Environ. Chem. Lett. 2023, 21, 1959–1989. [Google Scholar] [CrossRef]
- Adenekan, O.A.; Ezeigweneme, C.; Chukwurah, E.G. The evolution of smart cities: Integrating technology, governance, and sustainable development. Int. J. Appl. Res. Soc. Sci. 2024, 6, 891–902. [Google Scholar] [CrossRef]
- Berglund, E.Z.; Monroe, J.G.; Ahmed, I.; Noghabaei, M.; Do, J.; Pesantez, J.E.; Khaksar Fasaee, M.A.; Bardaka, E.; Han, K.; Proestos, G.T.; et al. Smart infrastructure: A vision for the role of the civil engineering profession in smart cities. J. Infrastruct. Syst. 2020, 26, 03120001. [Google Scholar] [CrossRef]
- Rajaram, M.L.; Kougianos, E.; Mohanty, S.P.; Sundaravadivel, P. A wireless sensor network simulation framework for structural health monitoring in smart cities. In Proceedings of the 2016 IEEE 6th International Conference on Consumer Electronics-Berlin (ICCE-Berlin), Berlin, Germany, 5–7 September 2016; pp. 78–82. [Google Scholar]
- Lim, Y.Y.; Smith, S.T.; Padilla, R.V.; Soh, C.K. Monitoring of concrete curing using the electromechanical impedance technique: Review and path forward. Struct. Health Monit. 2021, 20, 604–636. [Google Scholar] [CrossRef]
- Taheri, S. A review on five key sensors for monitoring of concrete structures. Constr. Build. Mater. 2019, 204, 492–509. [Google Scholar] [CrossRef]
- Singh, T.; Solanki, A.; Sharma, S.K.; Nayyar, A.; Paul, A. A Decade Review on Smart Cities: Paradigms, Challenges and Opportunities. IEEE Access 2022, 10, 68319–68364. [Google Scholar] [CrossRef]
- Liu, Y. WSN-Based SHM Optimisation Algorithm for Civil Engineering Structures. Processes 2022, 10, 2113. [Google Scholar] [CrossRef]
- Hingorani, R.; Tanner, P.; Prieto, M.; Lara, C. Consequence classes and associated models for predicting loss of life in collapse of building structures. Struct. Saf. 2020, 85, 101910. [Google Scholar] [CrossRef]
- Lim, Y.Y.; Smith, S.T.; Soh, C.K. Wave propagation based monitoring of concrete curing using piezoelectric materials: Review and path forward. NDT E Int. 2018, 99, 50–63. [Google Scholar] [CrossRef]
- Li, S.; Liang, Z.; Guo, P. A FBG pull-wire vertical displacement sensor for health monitoring of medium-small span bridges. Meas. J. Int. Meas. Confed. 2023, 211, 112613. [Google Scholar] [CrossRef]
- Jensen, O.M.; Hansen, P.F. Water-entrained cement-based materials: II. Experimental observations. Cem. Concr. Res. 2002, 32, 973–978. [Google Scholar] [CrossRef]
- Jensen, O.M.; Hansen, P.F. Water-entrained cement-based materials: I. Principles and theoretical background. Cem. Concr. Res. 2001, 31, 647–654. [Google Scholar] [CrossRef]
- Qiao, H.; Lin, Z.; Sun, X.; Li, W.; Zhao, Y.; Guo, C. Fiber optic-based durability monitoring in smart concrete: A state-of-art review. Sensors 2023, 23, 7810. [Google Scholar] [CrossRef]
- Jo, H.J.; Park, D.Y.; Kim, K.W.; Ahn, T.J. Real-time monitoring of concrete curing using fiber Bragg grating sensors: Strain and temperature measurement. Sens. Actuators A Phys. 2023, 362, 114650. [Google Scholar] [CrossRef]
- Chen, H.P. Structural Health Monitoring of Large Civil Engineering Structures; John Wiley & Sons: Hoboken, NJ, USA, 2018. [Google Scholar]
- Katam, R.; Pasupuleti, V.D.K.; Kalapatapu, P. A review on structural health monitoring: Past to present. Innov. Infrastruct. Solut. 2023, 8, 248. [Google Scholar] [CrossRef]
- Pandya, S.; Srivastava, G.; Jhaveri, R.; Babu, M.R.; Bhattacharya, S.; Maddikunta, P.K.R.; Mastorakis, S.; Piran, M.J.; Gadekallu, T.R. Federated learning for smart cities: A comprehensive survey. Sustain. Energy Technol. Assess. 2023, 55, 102987. [Google Scholar] [CrossRef]
- Pires-Junior, R.; Leal-Junior, A.; Frizera, A. Multifunctional Structure for Temperature Measurement in Different Environmental Conditions. In Proceedings of the 2024 Latin American Workshop on Optical Fiber Sensors (LAWOFS), Campinas, Brazil, 20–22 May 2024; pp. 1–2. [Google Scholar]
- Alias, M.A.; Ahmad, H.; Zaini, M.K.A.; Samion, M.Z.; Sa’ad, M.S.M.; Sing, L.K.; Grattan, K.T.; Rahman, B.A.; Brambilla, G.; Reduan, S.A.; et al. Optical fiber Bragg grating (FBG)-based strain sensor embedded in different 3D-printed materials: A comparison of performance. Measurement 2024, 225, 114060. [Google Scholar] [CrossRef]
- Theodosiou, A.; Savva, P.; Mendoza, E.; Petrou, M.F.; Kalli, K. In-situ relative humidity sensing for ultra-high-performance concrete using polymer fiber Bragg gratings. IEEE Sens. J. 2021, 21, 16086–16092. [Google Scholar] [CrossRef]
- Hao, H.; Bi, K.; Chen, W.; Pham, T.M.; Li, J. Towards next generation design of sustainable, durable, multi-hazard resistant, resilient, and smart civil engineering structures. Eng. Struct. 2023, 277, 115477. [Google Scholar] [CrossRef]
- Zhaobo, Z.; Sheng, L.; Yibo, W.; Hongnan, L. Structural health monitoring for bridge crane based on low temperature-sensitivity FBG sensors. Front. Phys. 2021, 9, 678263. [Google Scholar] [CrossRef]
- Chen, G.; Li, J.; Zhu, H.; Wang, Y.; Ji, H.; Meng, F. Optical fiber gas sensor with multi-parameter sensing and environmental anti-interference performance. J. Ind. Inf. Integr. 2024, 38, 100565. [Google Scholar] [CrossRef]
- Kok, S.P.; Go, Y.; Wang, X.; Wong, M.D. Advances in Fibre Bragg Grating (FBG) Sensing: A Review of Conventional and New Approaches and Novel Sensing Materials in Harsh and Emerging Industrial Sensing. IEEE Sens. J. 2024, 24, 29485–29505. [Google Scholar] [CrossRef]
- Suryandi, A.A.; Sarma, N.; Mohammed, A.; Peesapati, V.; Djurović, S. Fiber optic fiber bragg grating sensing for monitoring and testing of electric machinery: Current state of the art and outlook. Machines 2022, 10, 1103. [Google Scholar] [CrossRef]
- Kersey, A.D. Distributed and multiplexed fiber optic sensors. In Fiber Optic Sensors: An Introduction for Engineers and Scientists; John Wiley & Sons: Hoboken, NJ, USA, 2024; pp. 263–291. [Google Scholar]
- Souza, E.A.; Macedo, L.C.; Frizera, A.; Marques, C.; Leal-Junior, A. Fiber bragg grating array for shape reconstruction in structural elements. Sensors 2022, 22, 6545. [Google Scholar] [CrossRef] [PubMed]
- Dey, K.; Vangety, N.; Roy, S. Machine learning approach for simultaneous measurement of strain and temperature using FBG sensor. Sens. Actuators A Phys. 2022, 333, 113254. [Google Scholar] [CrossRef]
- Guo, J.Y.; Shi, B.; Sun, M.Y.; Zhang, C.C.; Wei, G.Q.; Liu, J. Characterization of an ORMOCER®-coated FBG sensor for relative humidity sensing. Measurement 2021, 171, 108851. [Google Scholar] [CrossRef]
- Guo, J.Y.; Shi, B.; Sun, M.Y.; Cheng, W.; Zhang, C.C.; Wei, G.Q.; Wang, X. Application of PI-FBG sensor for humidity measurement in unsaturated soils. Measurement 2022, 188, 110415. [Google Scholar] [CrossRef]
- Shakir, A.D. Optical Fiber Sensors for Biomedical Applications of Optical Fibers, Fiber Sensors, Impact of Light and Healthcare Industry Trends. J. Curr. Med Res. Opin. 2023, 6, 1849–1855. [Google Scholar]
- Lazaro, R.C.; Souza, E.; Frizera, A.; Marques, C.; Leal-Junior, A. Optical fiber sensors systems in oil tanks: Toward structural health monitoring and liquid-level estimation. IEEE Sens. J. 2023, 23, 10437–10443. [Google Scholar] [CrossRef]
- Makul, N. Advanced smart concrete-A review of current progress, benefits and challenges. J. Clean. Prod. 2020, 274, 122899. [Google Scholar] [CrossRef]
- Yazdizadeh, Z.; Marzouk, H.; Hadianfard, M.A. Monitoring of concrete shrinkage and creep using Fiber Bragg Grating sensors. Constr. Build. Mater. 2017, 137, 505–512. [Google Scholar] [CrossRef]
- Mohapatra, A.G.; Khanna, A.; Gupta, D.; Mohanty, M.; de Albuquerque, V.H.C. An experimental approach to evaluate machine learning models for the estimation of load distribution on suspension bridge using FBG sensors and IoT. Comput. Intell. 2022, 38, 747–769. [Google Scholar] [CrossRef]
- Li, R.; Tan, Y.; Chen, Y.; Hong, L.; Zhou, Z. Investigation of sensitivity enhancing and temperature compensation for fiber Bragg grating (FBG)-based strain sensor. Opt. Fiber Technol. 2019, 48, 199–206. [Google Scholar] [CrossRef]
- Wang, K.; Guo, H.; Zhou, C.; Zheng, B.; Xu, T.; Fan, D. Humidity characteristics of a weak fiber Bragg grating array coated with polyimide. Opt. Fiber Technol. 2023, 77, 103259. [Google Scholar] [CrossRef]
- de Matos, P.R.; Pilar, R.; Bromerchenkel, L.H.; Schankoski, R.A.; Gleize, P.J.; de Brito, J. Self-compacting mortars produced with fine fraction of calcined waste foundry sand (WFS) as alternative filler: Fresh-state, hydration and hardened-state properties. J. Clean. Prod. 2020, 252, 119871. [Google Scholar] [CrossRef]
- Self-Compacting Concrete European Project Group. The European Guidelines for Self-Compacting Concrete: Specification, Production and Use; International Bureau for Precast Concrete (BIBM): Dhaka, Bangladesh, 2005; Volume 22, p. 563. [Google Scholar]


| Strain | Temperature | Relative Humidity | |
|---|---|---|---|
| Souza et al. | 1.20 pm/ | 9.50 pm/°C | 3.33 pm/%RH |
| Theodosiou et al. [21] | 18.87 pm/%RH | ||
| Yaszdizadeh et al. [35] | 1.20 pm/ | ||
| Jo et al. [15] | 1.10 pm/ | 28.50 pm/°C |
Disclaimer/Publisher’s Note: The statements, opinions and data contained in all publications are solely those of the individual author(s) and contributor(s) and not of MDPI and/or the editor(s). MDPI and/or the editor(s) disclaim responsibility for any injury to people or property resulting from any ideas, methods, instructions or products referred to in the content. |
© 2024 by the authors. Licensee MDPI, Basel, Switzerland. This article is an open access article distributed under the terms and conditions of the Creative Commons Attribution (CC BY) license (https://creativecommons.org/licenses/by/4.0/).
Share and Cite
Souza, E.; Pinheiro, P.; Coutinho, F.; Dias, J.; Pilar, R.; Pontes, M.J.; Leal-Junior, A. Smart Concrete Using Optical Sensors Based on Bragg Gratings Embedded in a Cementitious Mixture: Cure Monitoring and Beam Test. Sensors 2024, 24, 7998. https://doi.org/10.3390/s24247998
Souza E, Pinheiro P, Coutinho F, Dias J, Pilar R, Pontes MJ, Leal-Junior A. Smart Concrete Using Optical Sensors Based on Bragg Gratings Embedded in a Cementitious Mixture: Cure Monitoring and Beam Test. Sensors. 2024; 24(24):7998. https://doi.org/10.3390/s24247998
Chicago/Turabian StyleSouza, Edson, Pâmela Pinheiro, Felipe Coutinho, João Dias, Ronaldo Pilar, Maria José Pontes, and Arnaldo Leal-Junior. 2024. "Smart Concrete Using Optical Sensors Based on Bragg Gratings Embedded in a Cementitious Mixture: Cure Monitoring and Beam Test" Sensors 24, no. 24: 7998. https://doi.org/10.3390/s24247998
APA StyleSouza, E., Pinheiro, P., Coutinho, F., Dias, J., Pilar, R., Pontes, M. J., & Leal-Junior, A. (2024). Smart Concrete Using Optical Sensors Based on Bragg Gratings Embedded in a Cementitious Mixture: Cure Monitoring and Beam Test. Sensors, 24(24), 7998. https://doi.org/10.3390/s24247998