3.1. Delay Time of Green a-Wave Peak from Near-Infrared a-Wave Peak
The photoplethysmograms of the near-infrared light and green light measured at the same measurement point were second-order differentiated, and their a-wave peak times were compared. The results illustrated that a delay occurred in the green a-wave peak relative to the near-infrared a-wave peak. It is suggested that green light is strongly absorbed by the body and that the LED–PD distance is short (approximately 2.4 mm). Therefore, the information contained in the green light photoplethysmogram was primarily that of the capillaries in the superficial skin area, whereas the near-infrared light was weakly absorbed by the body and reached the deep skin area. Therefore, the information included the arterioles at a depth of approximately 0.3 mm or more. The proposed design increases the LED–PD distance to approximately 8.9 mm for near-infrared light. It would be difficult for information in superficial regions to reach the PD, and the ratio of information in the deep regions would increase. In other words, the time delay between the green light and near-infrared light a-wave peaks corresponds to the time required for the pulse wave to reach the superficial region of the skin.
Figure 5 illustrates the optical paths of the green and near-infrared lights received by the PD. Skin tissue is a light scatterer, and LED light incident on the skin spreads in all directions as it is scattered within the skin. The arrows in
Figure 5 do not represent the light emitted from the LED but rather the penetration depth of the light received by the PD.
Figure 6 illustrates an example of an acceleration plethysmogram obtained by calculating the time delay between the green light and near-infrared light
a-wave peaks. The maximum value of the acceleration plethysmogram is the
a-wave peak, and the length of the arrow in
Figure 6 represents the time delay between the green light and near-infrared light
a-wave peaks. As illustrated in
Figure 6, the time delay between the green light and near-infrared light
a-wave peaks varies considerably during the measurement process.
Figure 6a,b show the waveforms when the time delays between the green and near-infrared light
a-wave peaks are large and small, respectively. When the time delay between the green light and near-infrared light
a-wave peaks in (a) is long, the amplitude of the green light acceleration pulse is smaller than that in (b), and the waveform shape differs considerably.
Figure 7 compares the time delay between the green and near-infrared light
a-wave peaks and the reciprocal (1/
S) of the green light photoplethysmogram amplitude (
S) in this measurement. It is evident that the time delay between the green and near-infrared light
a-wave peaks correlates with 1/
S. A large 1/
S value (i.e., a small
S) signifies low blood flow. In this example, it is speculated that 1/
S increases because of a decrease in the capillary blood flow owing to a temporary decrease in the stroke volume. From this example, it can be speculated that the pulse wave transit time increases as the blood flow in the capillaries decreases. Additionally, the photoplethysmogram amplitude (
S) varies depending on the contact state and the pressure between the sensor and skin; consequently, it can be difficult to use the absolute value of 1/
S to estimate the hemodynamics of capillaries because of variations in each measurement.
3.2. 1/FWHMVPG
Blood pressure in large arteries is typically measured using a cuff-type sphygmomanometer. Blood pressure in blood vessels decreases as blood progresses from arteries to arterioles to capillaries [
17], and the blood flow velocity decreases as it progresses from the aorta to the capillaries. The extent of the decrease in blood pressure and blood flow velocity varies depending on the measurement site, individual vascular condition (arteriosclerosis), mental condition (autonomic nerve condition), the environment (temperature and noise), and clothing worn. Moreover, 1/FWHM
VPG was related to the hemodynamics in arterioles, particularly in capillaries. The following two aspects were confirmed as features of 1/FWHM
VPG:
Measurements in adult males and females who had not been diagnosed with or treated for diabetes, hypertension, or cardiovascular disease showed an almost proportional relationship with wrist blood pressure under conditions where the vascular resistance did not change.
The value decreased when the blood vessels contracted owing to the cooling in the vicinity of the measurement site. The brachial and wrist blood pressures increased in certain cases.
In addition to the values of features (1) and (2), the following three feature values were obtained:
a/S;
(a-b)/(a-d);
1/ab time.
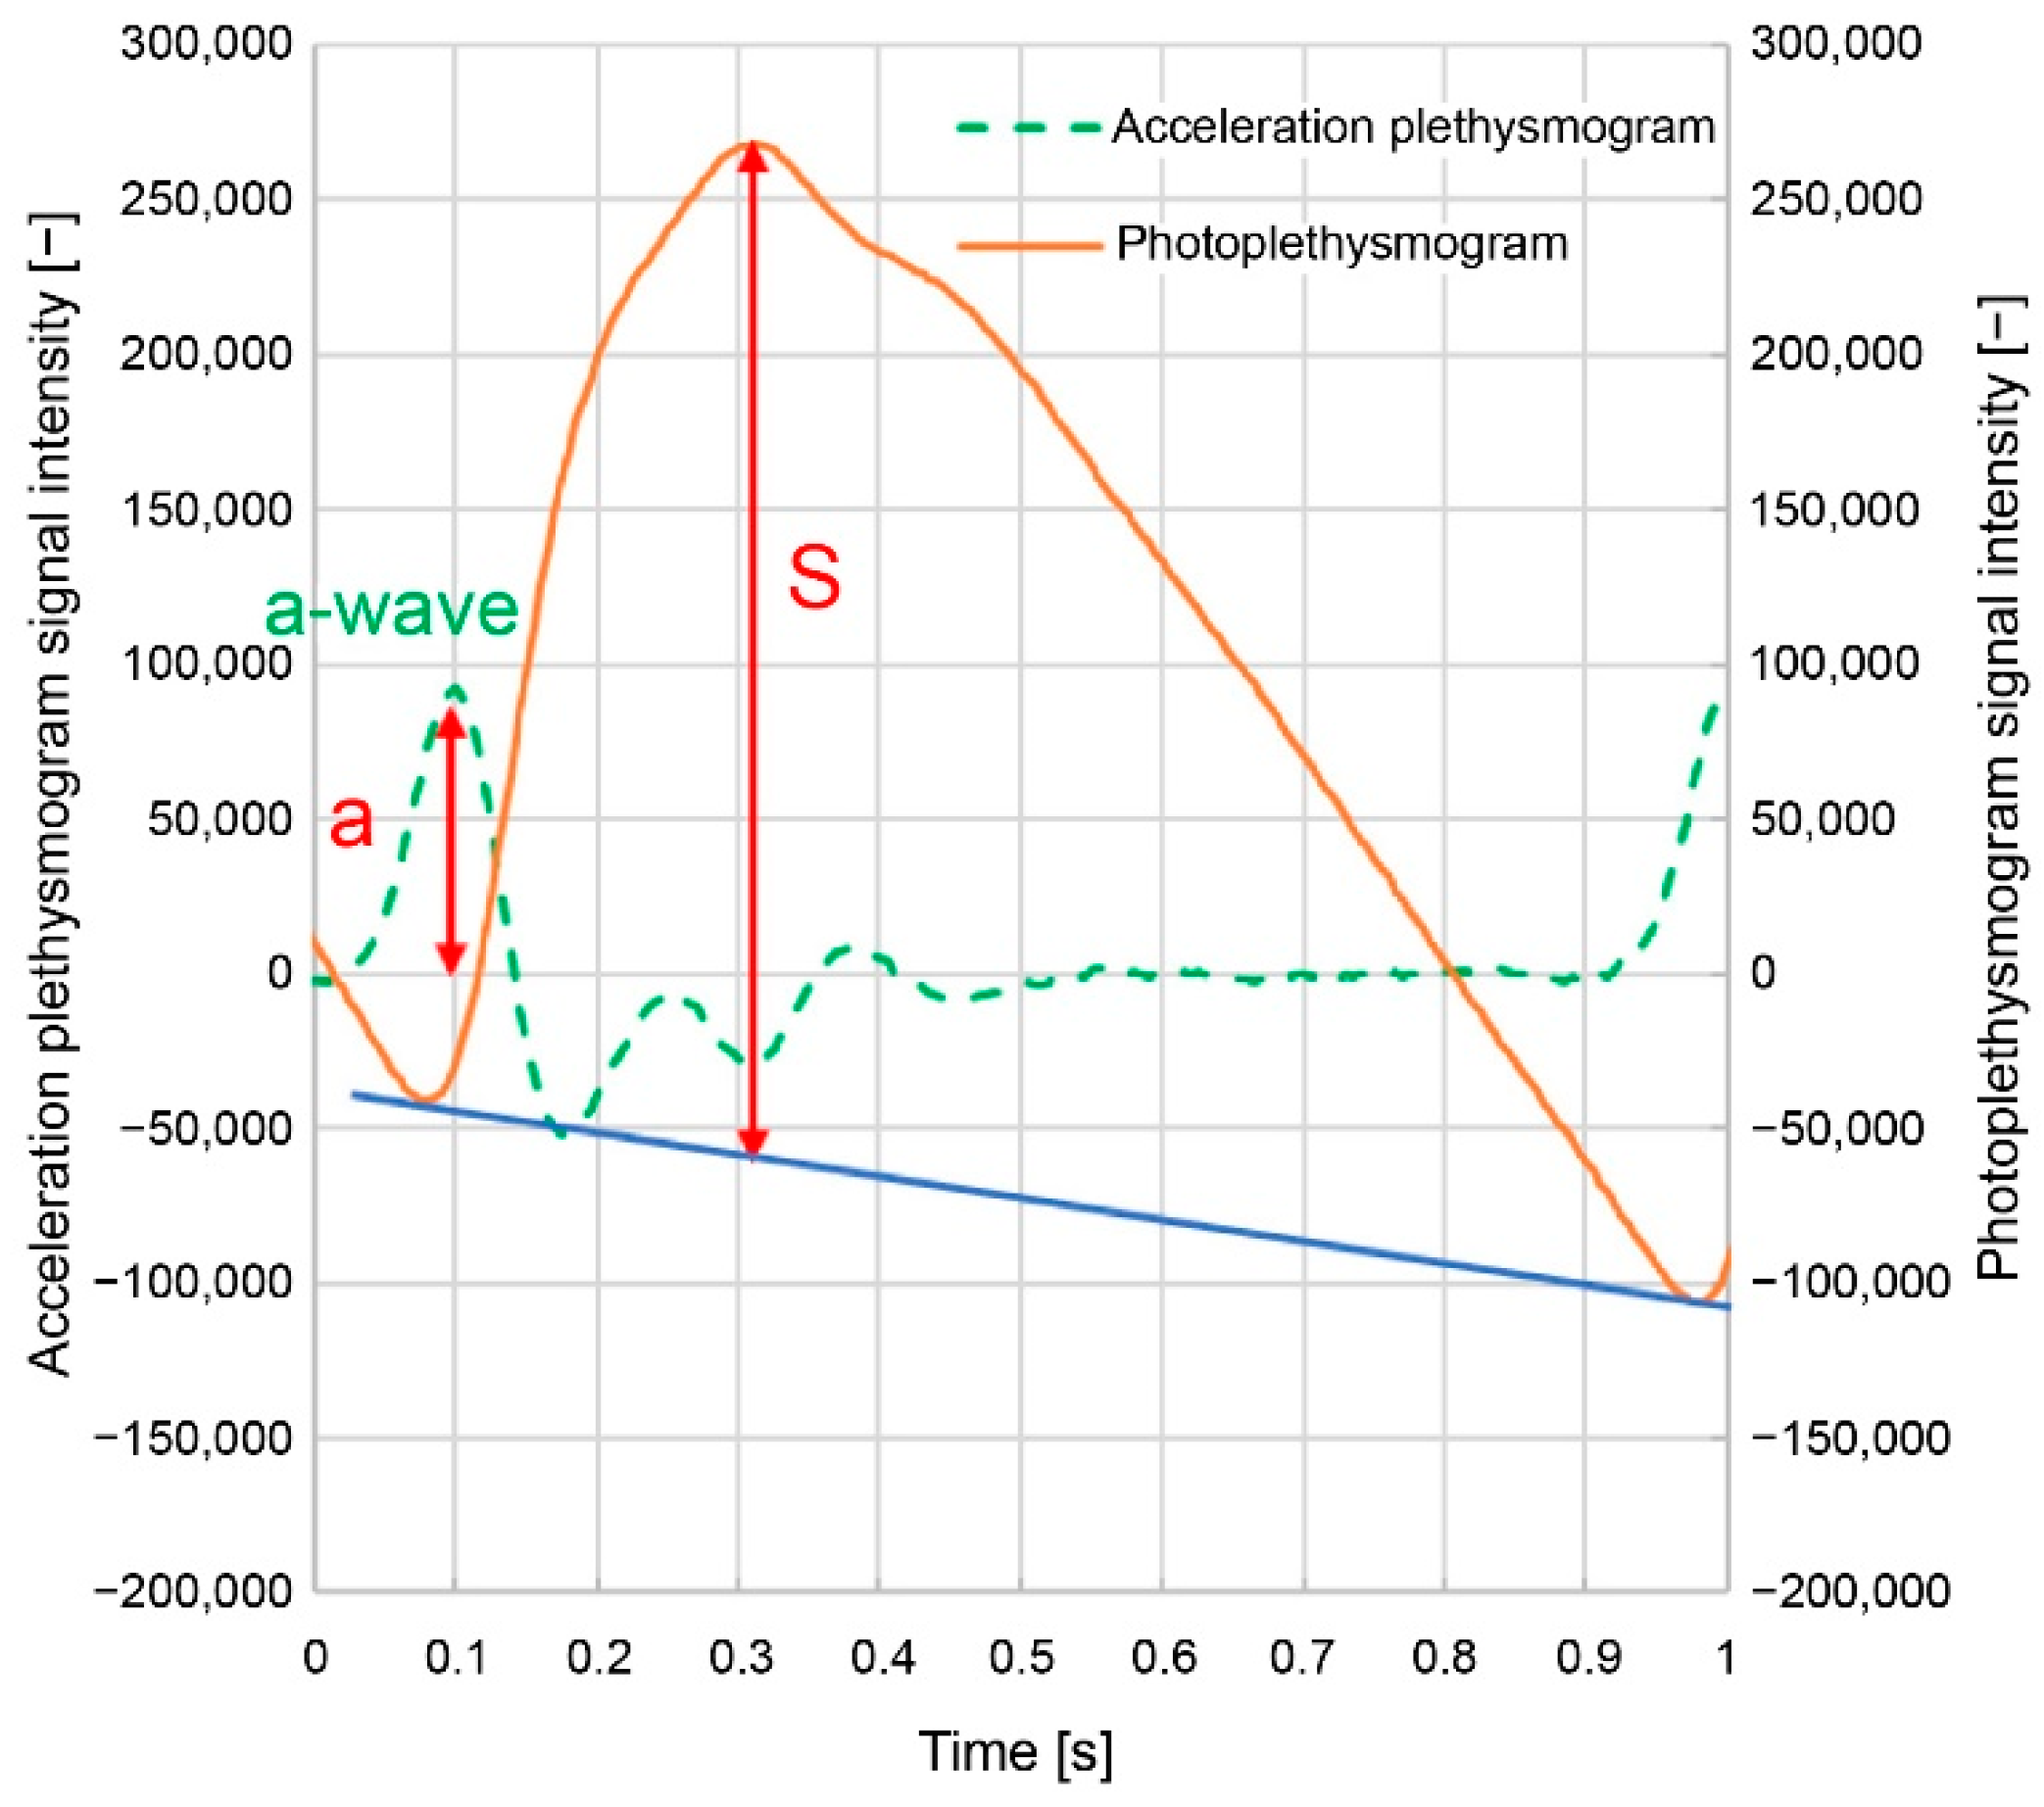
Here,
a/S is the acceleration plethysmogram
a-wave peak height (
a) divided by the photoplethysmogram height (
S) (
Figure 3); (
a-b)/(
a-d) are the normalized
a-b divided by the normalized
a-d (
Figure 4); and 1/
ab time is the difference between the
a- and
b-wave peak times (
Figure 4). These feature values, including 1/FWHM
VPG, are related to the sharpness of the increase in the photoplethysmogram waveform.
Figure 8 and
Figure 9 illustrate the relationship between wrist systolic blood pressure and each feature value in adult men and women who have not been diagnosed or treated for diabetes, hypertension, or cardiovascular disease. When changing the height of the measurement site (finger) from the heart, the area near the elbow on the side where the finger is located (i.e., the measurement site at chest height) is cooled (plotted for subjects
A,
B, and
C). The orange line denotes subject
A, blue line denotes subject
B, and green line denotes subject
C.
Figure 8a shows 1/FWHM
VPG (green light),
Figure 8b shows
a/
S (green light),
Figure 8c shows (
a-b)/(
a-d) (green light),
Figure 8d shows the 1/
ab time (green light),
Figure 9a shows 1/FWHM
VPG (near-infrared light),
Figure 9b shows
a/
S (near-infrared light),
Figure 9c shows (
a-b)/(
a-d) (near-infrared light), and
Figure 9d shows the 1/
ab time (near-infrared light).
As illustrated in
Figure 8a–c, the wrist systolic blood pressure and each feature value tended to be proportional when the height changed (solid line). It is also evident that cooling reduces each feature value and increases the systolic blood pressure of the wrist (dashed line).
Compared with
Figure 8a–c,
Figure 8d shows that the 1/
ab time exhibits less dependence on the wrist systolic blood pressure.
Figure 8a–d shows the feature values calculated from the photoplethysmogram measured using the green light LED, and the results of the feature values calculated from the photoplethysmogram measured using the near-infrared light LED are illustrated in
Figure 9a–d. The aforementioned trends are unclear, particularly for subject
B in
Figure 9b–d, when compared to those for the green light.
Figure 10 illustrates that the feature values are related to the steep increase in the photoplethysmogram waveform. Examples of waveforms with the same waveform length but different rising slopes in the photoplethysmograms are shown, which were collected from the same subject. Of the two photoplethysmogram waveforms illustrated in
Figure 10a, the solid line increases sharply (slope: large). As shown in
Figure 10b, the 1/FWHM
VPG and
a/S changed. In
Figure 10c, the times (
a-b)/(
a-d) and 1/
ab changed. Therefore, waveforms with large slopes have considerably larger feature values and are related to the sharp increase in the photoplethysmogram waveform. However, for (
a-b)/(
a-d), the ratio of “slope: small” to “slope: large” was slightly different from the other feature values. This is because (
a-b)/(
a-d) includes the features of the d-wave; consequently, it is a feature value that includes information other than the steepness of the rising slope.
The 1/FWHMVPG value acquired using green light is more applicable to features (1) and (2). It can be speculated that this is because green light has a high bio-absorption rate and is absorbed before reaching the deep skin regions, resulting in only superficial region information being included (i.e., only capillary information). Similarly, near-infrared light includes not only information on capillaries but also information on arterioles; therefore, it can be speculated that it is susceptible to measurement conditions and individual differences.
Of the four feature values, a/S and (a-b)/(a-d) are susceptible to pressure and body-motion noise because the values of b, d, and S are more susceptible to them. Furthermore, (a-b)/(a-d) contains d-wave information other than the rising slope. Additionally, the 1/ab time value tended to be less dependent on the wrist systolic blood pressure. Consequently, it can be speculated that the extent of matching features (1) and (2) is lower for the other feature values than for 1/FWHMVPG (green light).
The following section presents the experimental results, with a focus on two feature values: the time delay between the green and near-infrared light a-wave peaks and 1/FWHMVPG (green light).
The use of LEDs or lasers with wavelengths in the vicinity of blue to yellowish-green light (500–550 nm), which are highly absorbed by the body, is suitable for acquiring information on shallow-skin regions. Furthermore, the distance between the light source and the light receiver should be as short as possible, specifically, 1–3 mm.
The measurement sites of the photoplethysmogram were the wrist, neck, face, and ears. Although the fingers were preferred, as the epidermis of the finger is relatively thin, making it easier to measure photoplethysmograms, the paths from the arterioles to the capillaries are less complicated than those of the face, and the values of each feature tended to be stable.
A ring-shaped wearable device equipped with an optical sensor worn on a finger is suitable for measuring photoplethysmograms because there is little discomfort during continuous and intermittent measurements, even when worn for lengthy periods.
3.3. Comparison with People with Diabetes
Angiopathy is a well-known complication of diabetes; therefore, patients with diabetes were selected to compare the hemodynamics of the capillaries and arterioles with those of healthy subjects. Patients with diabetes were selected from among inpatients or outpatients at Kanai Hospital between November 2021 and June 2022. The control group consisted of adult males and females who met the following criteria: they had not been diagnosed with or treated for diabetes, hypertension, or cardiovascular disease; they were employees of Murata Manufacturing Co., Ltd.; they satisfied the specified conditions; and they provided consent from May 2021 to July 2021. This study was approved by the Ethics Committee of the Kanai Hospital (approval no. 121). Measurements were conducted indoors at a controlled room temperature to exclude the influence of outside temperatures.
There were 36 subjects (14 males and 22 females) in the group with diabetes and 39 (26 males and 13 females) in the control group. Measurements were performed a minimum of once per person, up to eight times, and the number of acquired data points was 111 for the group with diabetes and 40 for the control group. The control group tended to be younger and had more males than the group with diabetes.
Data that satisfied the following exclusion criteria among these gathered data were excluded from the analysis—that is, when the blood pressure could not be measured using a wrist-cuff-type sphygmomanometer, when the signal-to-noise ratio of the photoplethysmogram signal was less than 200, and when feature values (such as 1/FWHMVPG) could not be calculated from the photoplethysmogram signal. This was because when the signal-to-noise ratio of the photoplethysmogram signal was less than 200, the apex of the peak of the acceleration plethysmogram was buried in noise, resulting in a large drop in peak detection accuracy. A confirmed example in which the feature value could not be calculated from a photoplethysmogram signal was one in which body-motion noise was present.
In this study, the signal intensity was defined as the photoplethysmogram height (
S) in
Figure 3, the noise intensity was defined as the root mean square of the remaining components after removing the photoplethysmogram component from the signal, and the ratio of these two values was defined as the signal-to-noise ratio.
The data that remained after the abovementioned exclusion process (50 datasets from 25 patients with diabetes (6 males and 19 females) and 21 datasets from 21 individuals (17 males and 4 females) in the control group) were used for analysis.
Figure 11 shows a graph of the green light 1/FWHM
VPG versus the systolic blood pressure measured at the wrist. It is evident that 1/FWHM
VPG was concentrated in a smaller range in the group with diabetes than in the control group. Conversely, the systolic blood pressure in the group with diabetes tended to be higher than that in the control group.
The 1/FWHMVPG ranges from 4.1 [1/s] to 9.6 [1/s], with a mean of 5.6 [1/s], in the group with diabetes and from 5.2 [1/s] to 14.1 [1/s], with a mean of 7.9 [1/s], in the control group. The 1/FWHMVPG differed significantly between the group with diabetes and the control group (p = 0.00016).
Figure 12 illustrates a graph of the time delay between the green and near-infrared light
a-wave peaks against the systolic blood pressure measured at the wrist. In the control group, the time delay between the green and near-infrared
a-wave peaks was concentrated within a small range, whereas in the group with diabetes, the time delay was also widely distributed.
The time delay between the green and near-infrared light a-wave peaks ranged from 0.006 [s] to 0.073 [s] with a mean of 0.028 [s] in the group with diabetes and from 0.003 [s] to 0.021 [s] with a mean of 0.012 [s] in the control group. The time delay between the green and near-infrared light a-wave peaks differed significantly between the group with diabetes and the control group (p = 1.3 × 10⁻⁷).
Figure 13 illustrates a graph of the time delay between the green and near-infrared light
a-wave peaks against the green light 1/FWHM
VPG. In the group with diabetes, the green light 1/FWHM
VPG tended to be smaller than that in the control group, and the time delay between the green and near-infrared light
a-wave peaks tended to be longer.
Figure 14 illustrates a graph of the change in the green light 1/FWHM
VPG, where the time delay between the green
a-wave peak and the near-infrared
a-wave peak when the photoplethysmogram and the blood pressure were measured by holding the left hand with the measurement tool at navel, chest, and forehead height against the wrist-cuff-type sphygmomanometer measurements.
Plotting all the data resulted in considerable data overlap, making it difficult to observe changes; therefore, six datasets were extracted for each of the groups with diabetes and the control group. The extraction criteria were as follows: blood pressure measurements and feature value calculations were conducted at the navel, chest, and forehead heights; wrist blood pressure measurement values were in the descending order of navel height > chest height > forehead height; and those with minimal overlap with other data were extracted.
As illustrated in
Figure 14, the green light 1/FWHMVPG shows an approximately proportional positive correlation with wrist blood pressure in the control group. In the group with diabetes, the absolute value of 1/FWHM
VPG for green light was low and tended not to be significantly high with respect to wrist blood pressure. It can be speculated that this behavior is due to the following: in the control group, the low vascular resistance from the radial artery to the arterioles and capillaries results in capillary blood pressure following changes in wrist blood pressure, whereas in the group with diabetes, there is vascular resistance. Consequently, even if wrist blood pressure increases, intracapillary blood pressure does not readily increase.
Figure 15 illustrates a graph of the time delay between the green and near-infrared light
a-wave peaks instead of the 1/FWHM
VPG (green light) value for the data plotted in
Figure 14. For the same subject, the time delay tended to increase as the wrist blood pressure decreased.
Figure 16 shows a graph of the time delay between the green and near-infrared light
a-wave peaks with respect to 1/FWHM
VPG (green light) for the data plotted in
Figure 14. It is evident that a decrease in 1/FWHM
VPG (green light) tends to increase the time delay.

