Article

Respiratory Rate Monitoring via a Fibre Bragg Grating-Embedded Respirator Mask with a Wearable Miniature Interrogator

1
Optics and Photonics Research Group, Faculty of Engineering, University of Nottingham, Nottingham NG7 2RD, UK
2
Biomedical and Clinical Research Theme, School of Human Sciences, University of Derby, Derby DE22 1GB, UK
*
Author to whom correspondence should be addressed.
Sensors 2024, 24(23), 7476; https://doi.org/10.3390/s24237476
Submission received: 28 October 2024 / Revised: 17 November 2024 / Accepted: 21 November 2024 / Published: 23 November 2024
(This article belongs to the Section Biosensors)

Abstract

:
A respiration rate (RR) monitoring system was created by integrating a Fibre Bragg Grating (FBG) optical fibre sensor into a respirator mask. The system exploits the sensitivity of an FBG to temperature to identify an individual’s RR by measuring airflow temperature variation near the nostrils and mouth. To monitor the FBG response, a portable, battery-powered, wireless miniature interrogator system was developed to replace a relatively bulky benchtop interrogator used in previous studies. A healthy volunteer study was conducted to evaluate the performance of the developed system (10 healthy volunteers). Volunteers were asked to perform normal breathing whilst simultaneously wearing the system and a reference spirometer for 120 s. Individual breaths are then identified using a peak detection algorithm. The result showed that the number of breaths detected by both devices matched exactly (100%) across all volunteer trials.

1. Introduction

Respiration rate (RR), a measure of the number of breaths taken per minute, is a vital sign that plays a crucial role in assessing a person’s overall health. It can provide valuable information for medical diagnosis, patient monitoring, and performance assessment in sports [1,2]. RR monitoring can serve as a means of early detection of respiratory complications. For example, this is important for workers in harsh environments such as factories and mines. Other health monitoring cases include acute exacerbation of COPD [3]; dyspnea of workers due to exposure to volatile organic compounds in automobile manufacturing factories or nuclear waste disposal; and asthma or pneumoconiosis due to inhalation of dust and particles in textile industry workers or miners [4,5]. Presently, RR measurements in these environments typically rely on wearable piezoresistive/piezoelectric strain sensors integrated into a belt to detect breathing [6,7].
Table 1 summarises the principles and limitations of recent advancements in RR monitoring methods. These compute RR by measuring respiration-induced changes in the torso and nostrils, i.e., torso strain, sound, and temperature, whose magnitude varies proportionately with inhalation and exhalation volume [8,9,10,11,12,13,14,15]. Sensing respiration-induced torso strains and imaging body movements are the most popular [9,10,11,13,16,17] as they are used in commercially available RR monitoring devices, i.e., Go Direct Respiration Belt (Vernier, Beaverton, OR, USA) via load cell monitoring of changes due to respiration [18] and BioHarness 3.0 (Medtronic, Minneapolis, MN, USA) utilising a pressure sensor [19] and motion capture systems (e.g., Vicon Motion Systems Ltd., Oxford, UK) [20]. Performance errors in these sensors stem from varying signal quality due to noise from respiration-irrelevant factors that affect the sensing elements, such as camera obstructions (imaging systems) and body motions (pressure sensors). Furthermore, as the load cell and pressure sensors are based on conductive materials, they can be affected by electromagnetic interferences (EMIs) that limit their usage in environments such as factories and coal mines or during magnetic resonance imaging (MRI) [21,22,23,24].
Optical fibre sensor (OFS) technology has also gained in popularity in RR monitoring [25]. Table 2 summarises the characteristics of recently published OFS RR sensors. The capabilities of OFS and conductive/electronic sensors are comparable as both can measure respiration-induced torso strain and breath temperature near the nostril [26,27,28,29,30]. Similar issues are faced, for example, by its conventional conductive sensor counterpart, a strain-based OFS (i.e., Fibre Bragg Grating (FBG)), which can be affected by respiration-irrelevant motions [29,30,31,32]. Furthermore, when performing physically demanding tasks, such as exercises and factory/mining activities, the fibre risks damage. Despite this, OFS technology offers a significant advantage over conductive sensors as it is immune to EMI. This can be useful during MRI [27] or in harsh environments. Conventional sensors require both the electronics and sensing elements to be shielded [21,33].
In this paper, an ambulatory FBG-based RR monitoring system is demonstrated. An FBG optical fibre sensor is embedded in an adjustable respirator mask for comfort as well as to avoid motion artifacts associated with strain-based torso sensors. Exploiting the sensitivity of an FBG to temperature [36], the difference between an individual’s breath and ambient air is compared to instantaneously detect inhalation and exhalation. Previously, we have demonstrated a similar method of RR monitoring using an FBG embedded in oxygen delivery devices [30]. Thus, the novelty of this work is the incorporation of a portable, battery-powered miniature interrogator as a means of data acquisition to facilitate usage during daily life and occupational activities, as well as featuring real-time data display for breath-temperature-based OFS RR monitoring. The performance of the developed system is evaluated against a reference spirometer (Easy On-PC Spirometer, ndd Medizintechnik AG, Zürich, Switzerland) in a volunteer study involving 10 healthy individuals in a controlled environment. The results are then used as the basis of discussion for performance analysis and future plans.

2. Materials and Methods

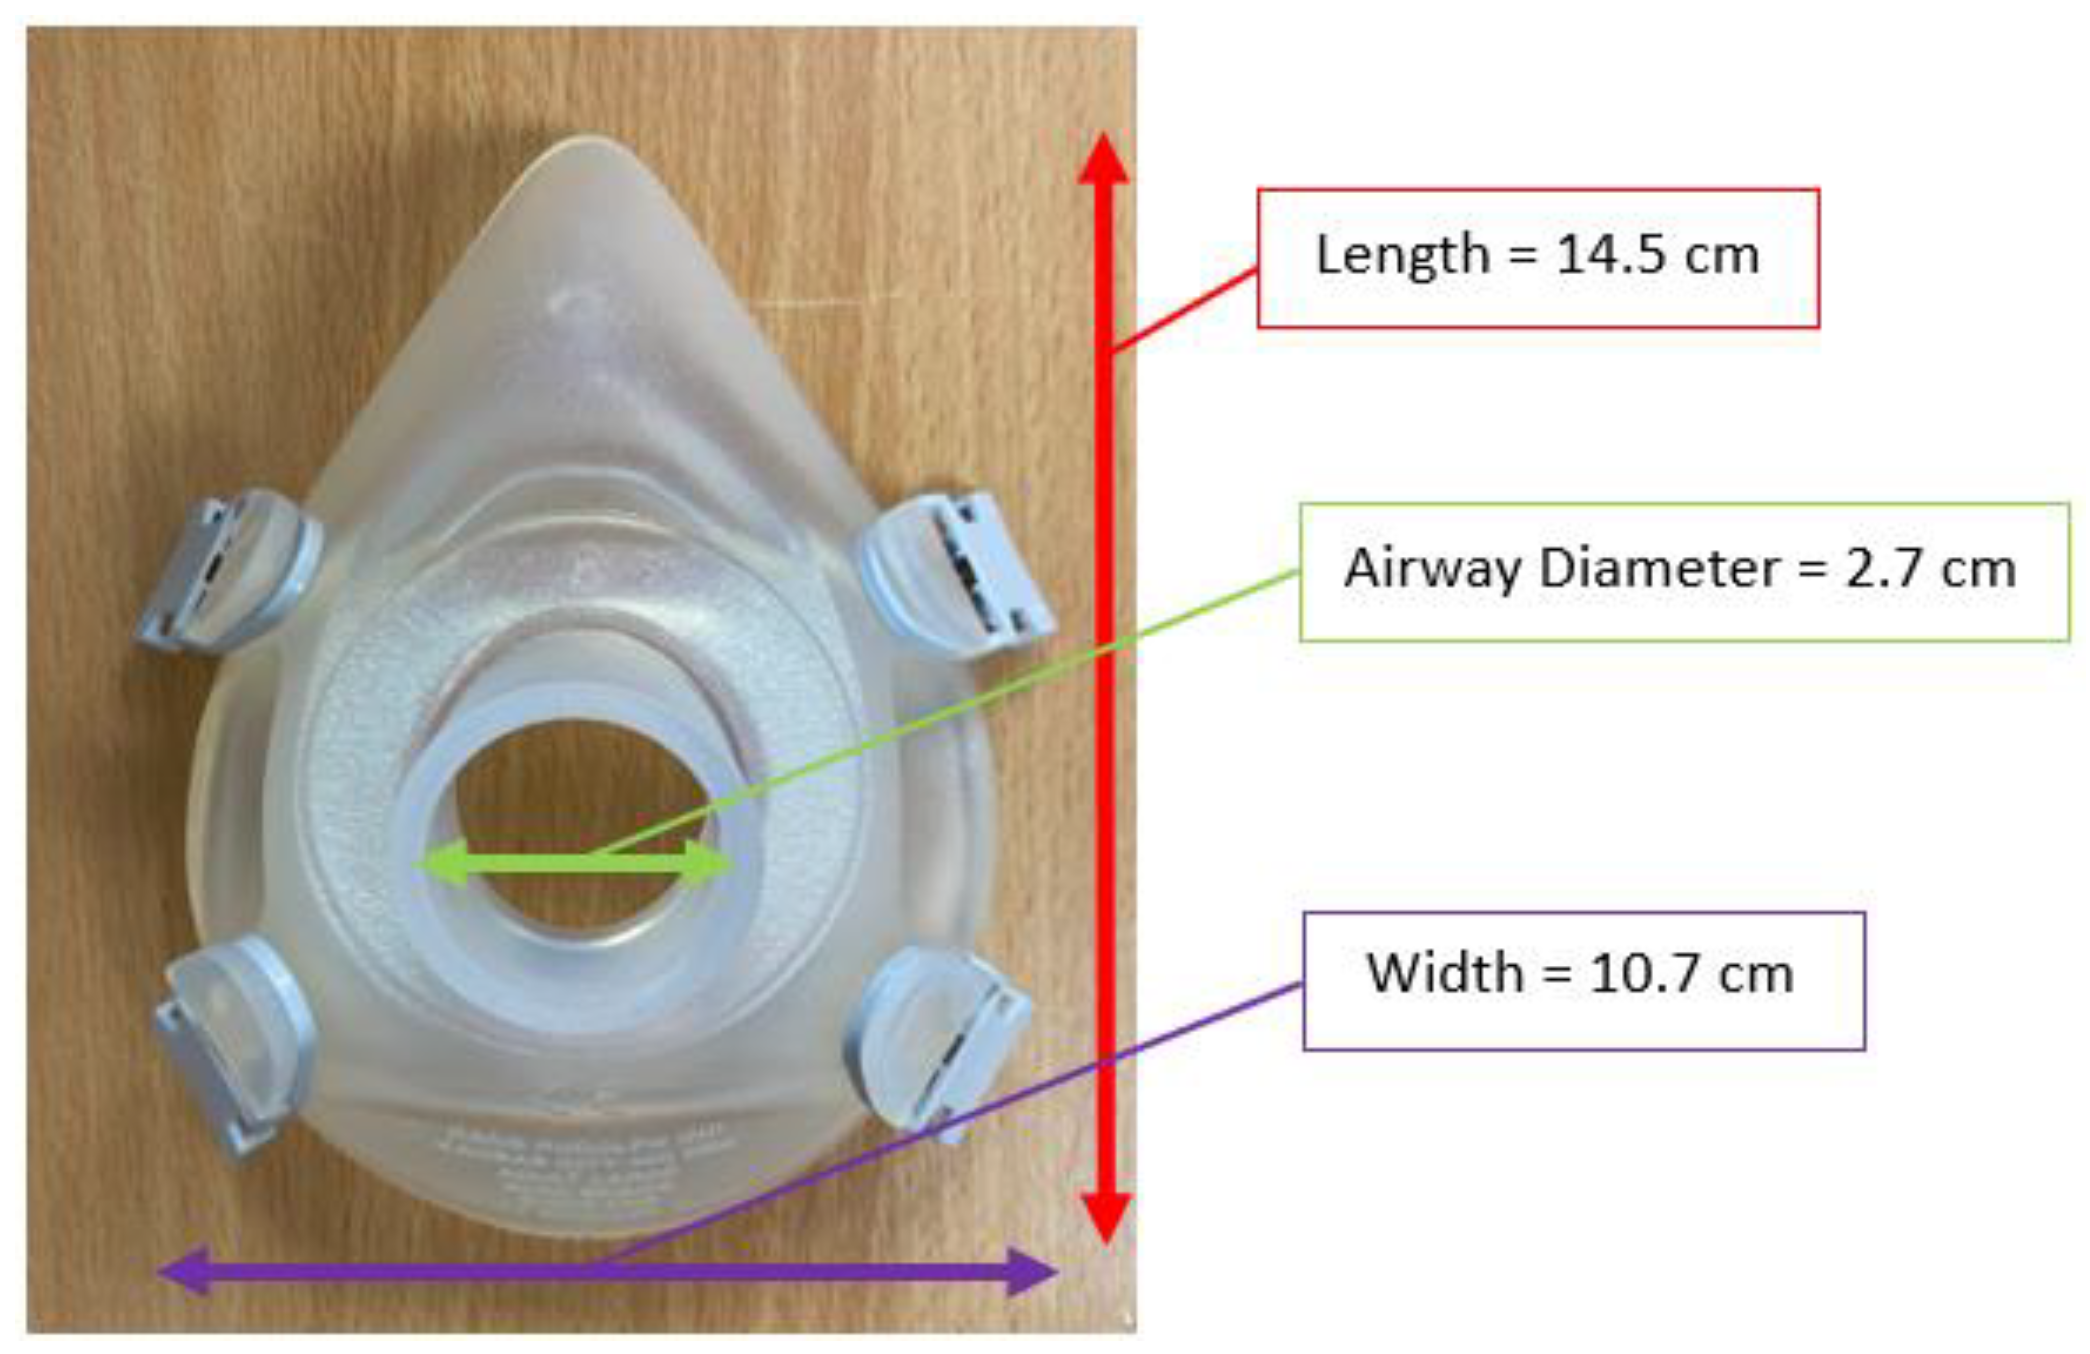
2.1. FBG Respirator Mask Design

The developed system employs a respirator mask with an unobstructed open airway channel (8920 Series, Hans Rudolph Inc., Shawnee, KS, USA) (Figure 1). An optical fibre containing an FBG is placed in the open airway so that the grating element is perpendicular to the opening (Figure 2) to maximise the surface area between the FBG element and breathing airflow. This is achieved by drilling 2 holes (~3 mm diameter) across the airway wall and inserting the FBG, which is then secured such that the fibre is slightly curved to minimise strain and resealed using UV curable epoxy (Norland Optical Adhesive 68, Ultraviolet Curing, Norland Products Inc., Jamesburg, NJ, USA) (Figure 2). The position and orientation of the FBG maximises its sensitivity to airflow temperature variation during breathing.

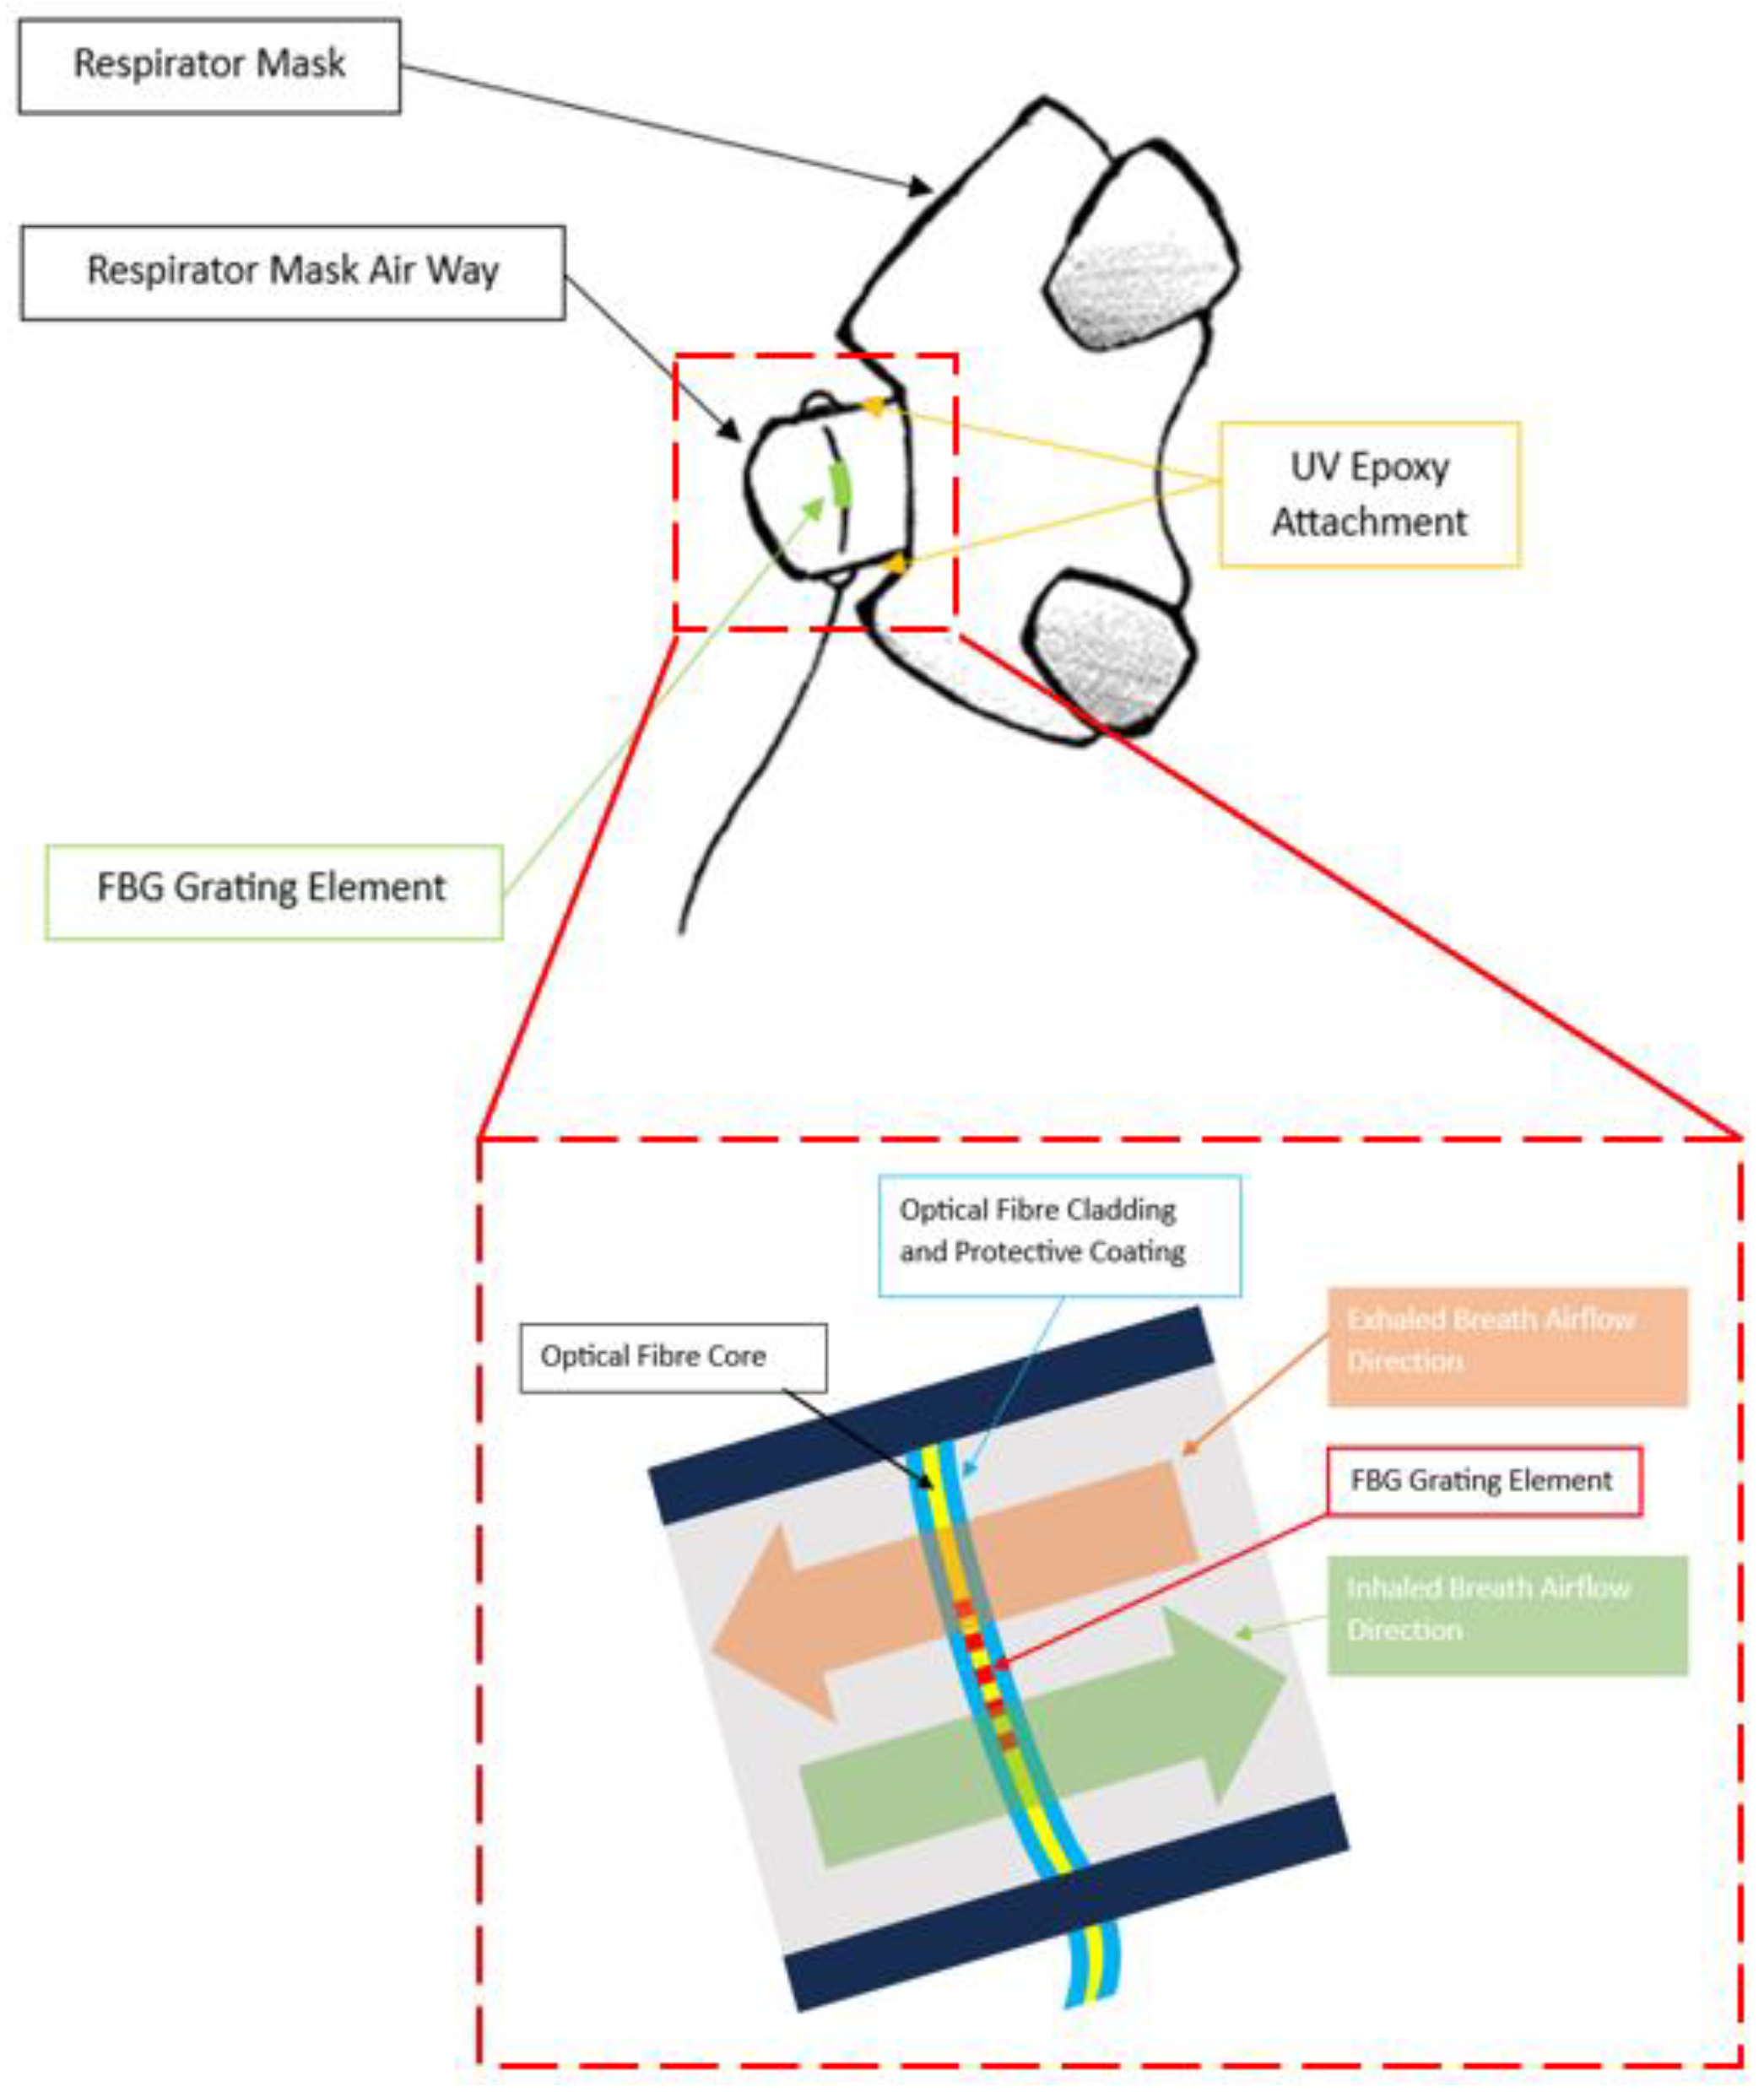
2.2. Sensing Principle

Fibre Bragg Grating (FBG) is a type of optical sensor that is inscribed into a segment of optical fibre. It works by reflecting specific wavelengths of light based on periodic variations in the refractive index within the fibre. These variations create a “grating” that reflects light at a particular wavelength, called the Bragg wavelength ( λ B ) . When external factors like temperature and strain change, the Bragg wavelength shifts, allowing FBG sensors to monitor these conditions [36]. Additionally, FBG sensors, unless modified, are insensitive to humidity [37], making them suitable for measuring breathing rates through breath-induced air temperature changes. In this work, the detection of inhalation and exhalation relies on the FBG’s sensitivity to temperature variations. This is reflected by variations in the Bragg wavelength, which can be expressed as seen in Equation (1) [34,38,39].
λ B = 2 ( Λ   n   l + n   Λ l )   l + 2 ( Λ   n   T +   n   Λ T )   T
where λ B = FBG Bragg wavelength (m); T = temperature (°C); l = length (m); Λ = grating period (m); n = refractive index [36,37,38].
According to Equation (1), the term “ 2 ( Λ   n   T +   n   Λ T )   T ” represents the sensitivity of the FBG to temperature variation [36]. Upon heating, the length of the optical fibre changes due to thermal expansion. This induces variation in the FBG grating period ( Λ ), as well as the refractive index (n) [36,39]. This causes λ B to increase. The reverse applies when the FBG is cooled. Assuming no strain is applied, the Bragg wavelength shift (∆ λ B ) due to temperature can be mathematically written as Equation (2) [36,39].
λ B = λ B ( α + ζ ) T
where α = thermal expansion coefficient (approx. 0.55 × 10⁻⁶ for silica optical fibre; ζ = thermo-optic coefficient (approx. 8.6 × 10⁻⁶/°C for germanium-doped silica core optical fibre) [36].

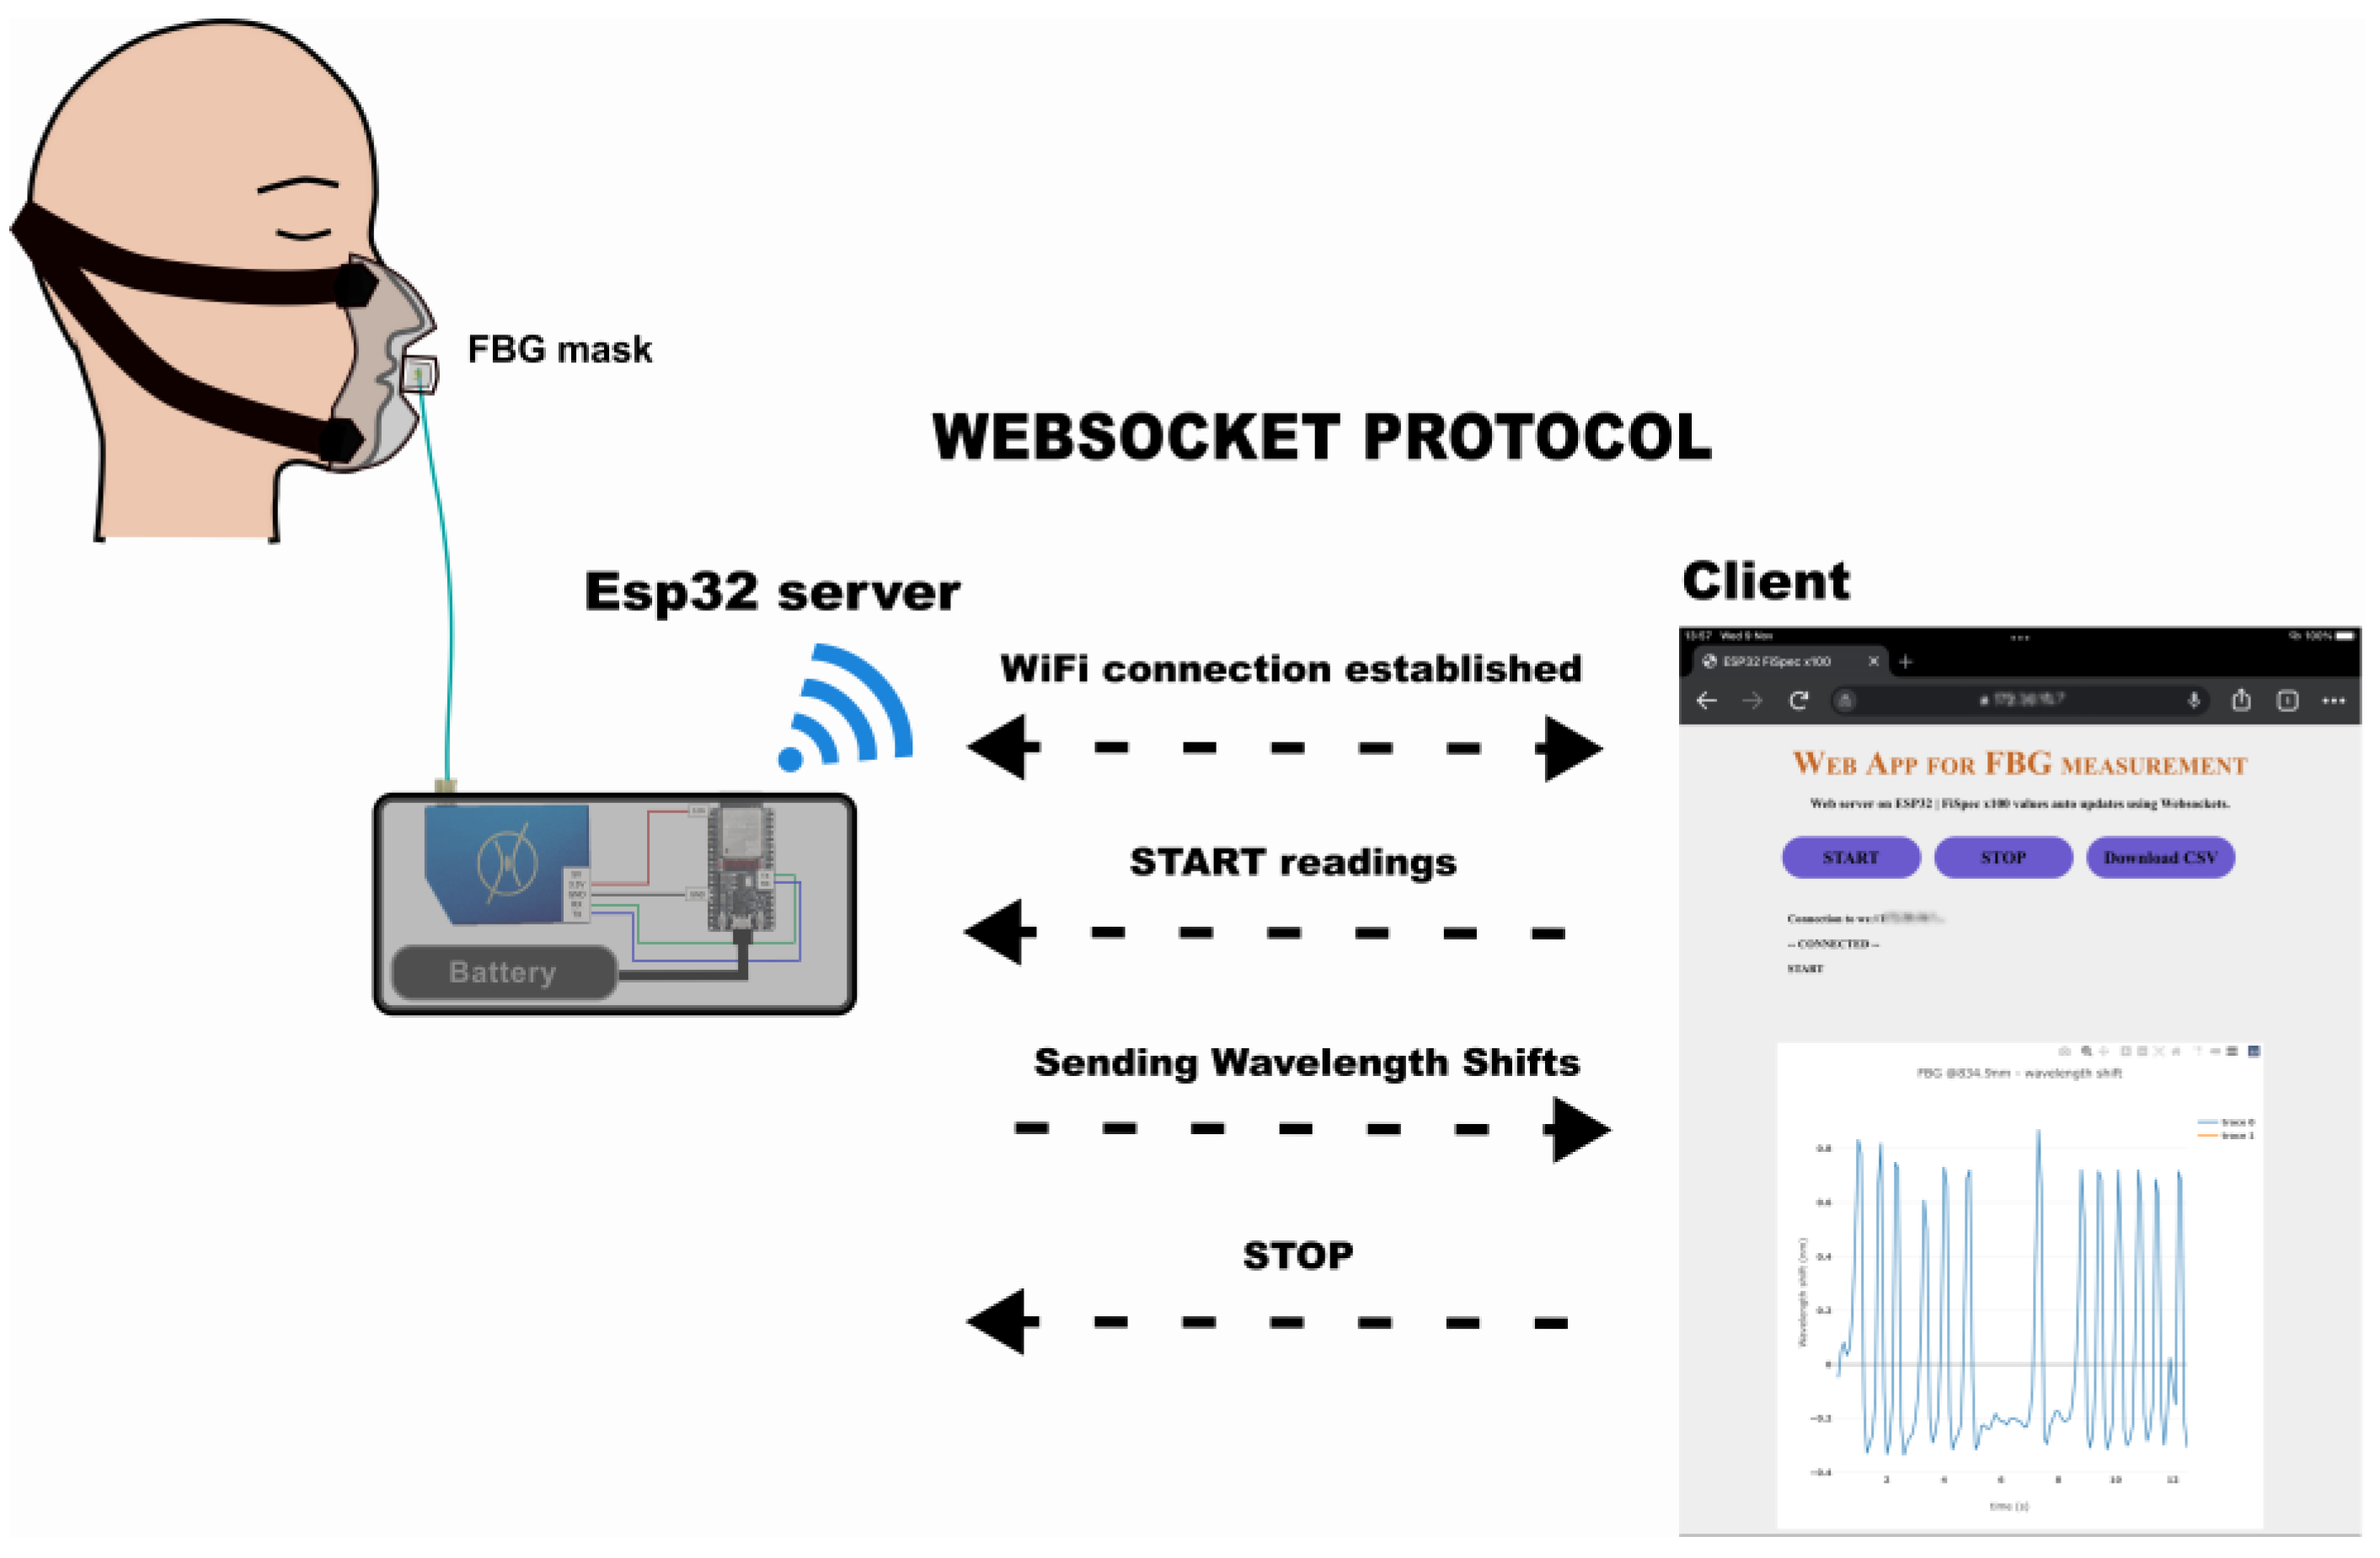
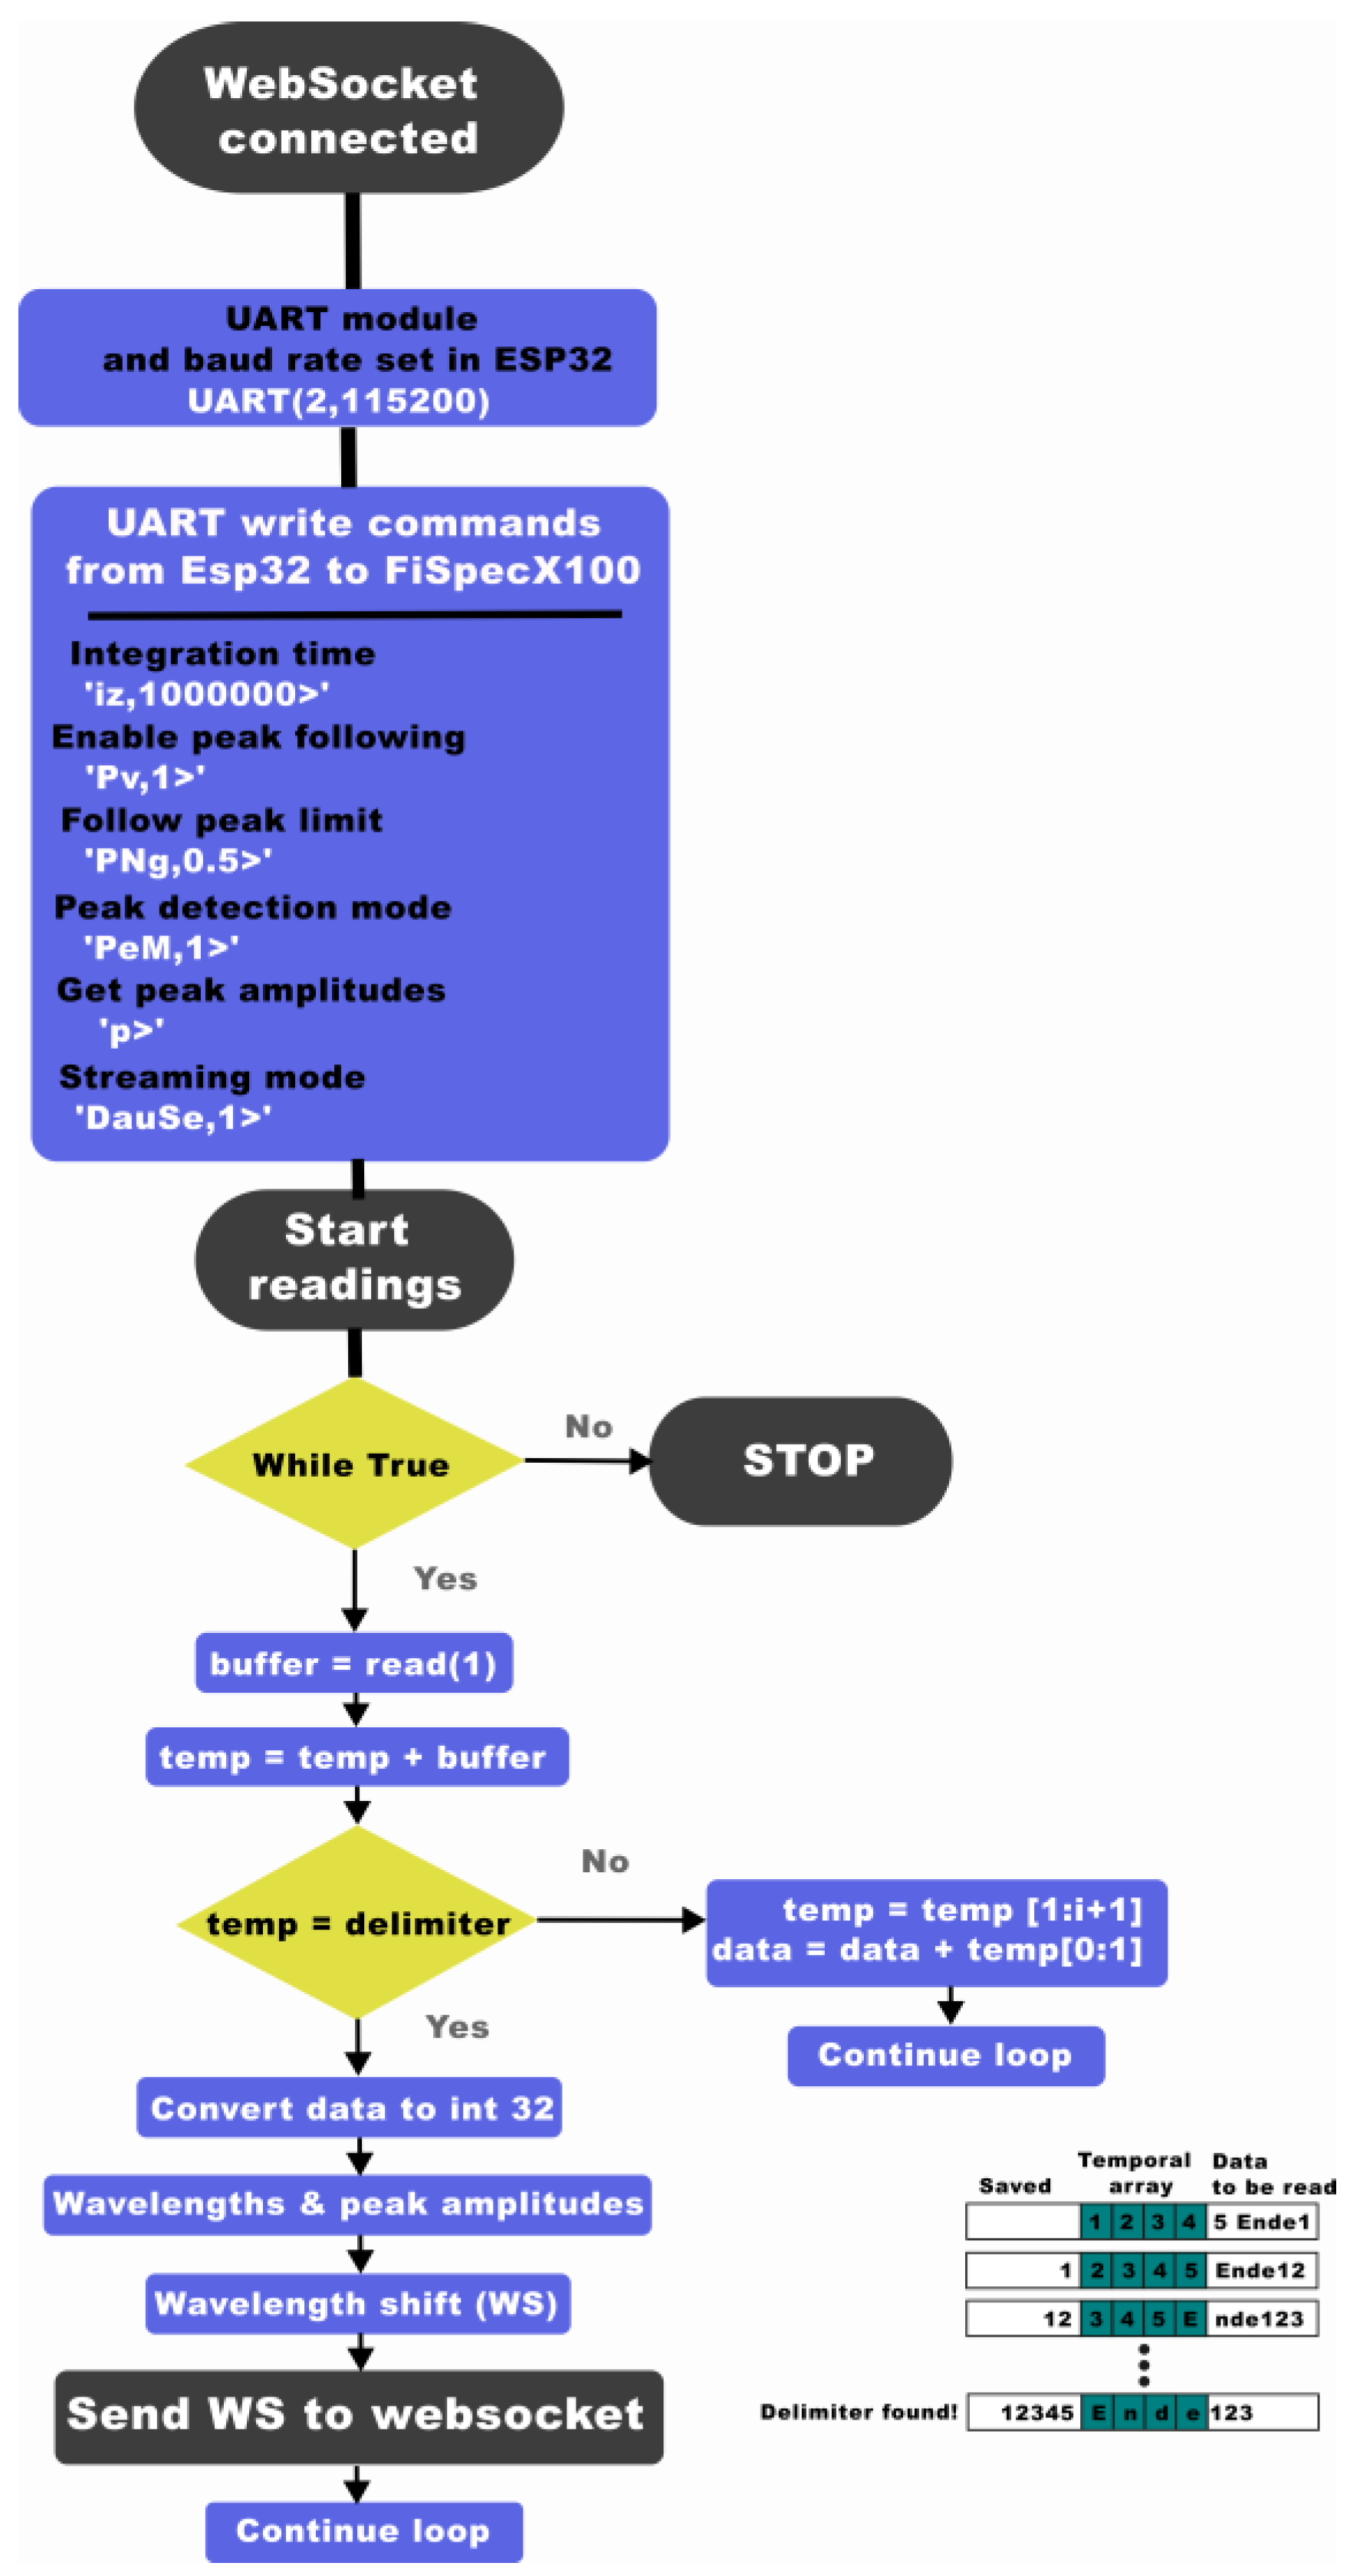
2.3. Miniature Interrogator Instrumentation

In this research, the FBG data are collected using a portable, battery-powered miniature interrogator (FiSpec FBG X100, FiSens GmbH, Braunschweig, Germany) with a precision measurement of 0.1 °C|1 με (10 Hz). This miniature interrogator measures the reflected spectrum of the guided light in the optical fibre with the FBG sensor. This measurement is achieved in a very limited space by integrating a tilted FBG in the core of the optical fibre through inscribing microscopic structures using a proprietary femtosecond laser process. This produces a combination of scattering and diffraction, coupling out the light and breaking it down into wavelengths onto a plane where the image sensor (CCD) collects this light spectrum to be read by the embedded microprocessor of the miniature interrogator. This miniature interrogator was connected to a microcontroller (ESP32-WROOM-32D, Espressif Systems, Shanghai, China) (Figure 3) and powered by a battery. The whole system is referred to collectively as a “mini-interrogator”. The mini-interrogator is placed inside a 3D-printed box (6.5 cm × 15.5 cm × 8.5 cm). Overall, the apparatus weighs 374 g and has a 17.64 h battery lifetime after a full charge (AAA battery, 1100 mAh). Two communication protocols, WebSocket and UART protocol, are utilised. The WebSocket enables communication between the client, the web application that enables the real-time display of the FBG data, and the server of the microcontroller, which processes the FBG data from the interrogator. Meanwhile, the UART protocol establishes the connection between the microcontroller and the interrogator to read the FBG data.
The operation diagram of the interrogator with the microprocessor is depicted in Figure 3, and the process pipeline to acquire the FBG data from the interrogator using the microprocessor is shown in Figure 4.
The integration time of the mini-interrogator was set to 100 ms. This integration time equals a sampling rate of around 10 Hz, which was the maximum allowed by the external UART connection of FiSpecX100, as it is limited to a baud rate of 115,200. However, it is sufficient to measure breathing rate because its normal value in healthy adults ranges between 0.20 and 0.33 Hz [40]. The follow peak function was enabled with the FiSens interface command “Pv,1>” with a follow peak limit of 50%, and the peak detection mode was set to extreme detection using the 1st derivative. Once the intensity and wavelength values were obtained, the Bragg wavelength at rest is measured, which corresponds to the maximum amplitude peak in the reflected spectrum at rest position. When the temperature changes, the Bragg wavelength will shift, and it is recorded relative to the Bragg wavelength at rest.
Following the calculation of the wavelength shift from the FBG sensor, data are sent through the WebSocket until the client stops it. Additionally, the displayed data can be downloaded in a “.csv” file for further processing.

2.4. Volunteer Study
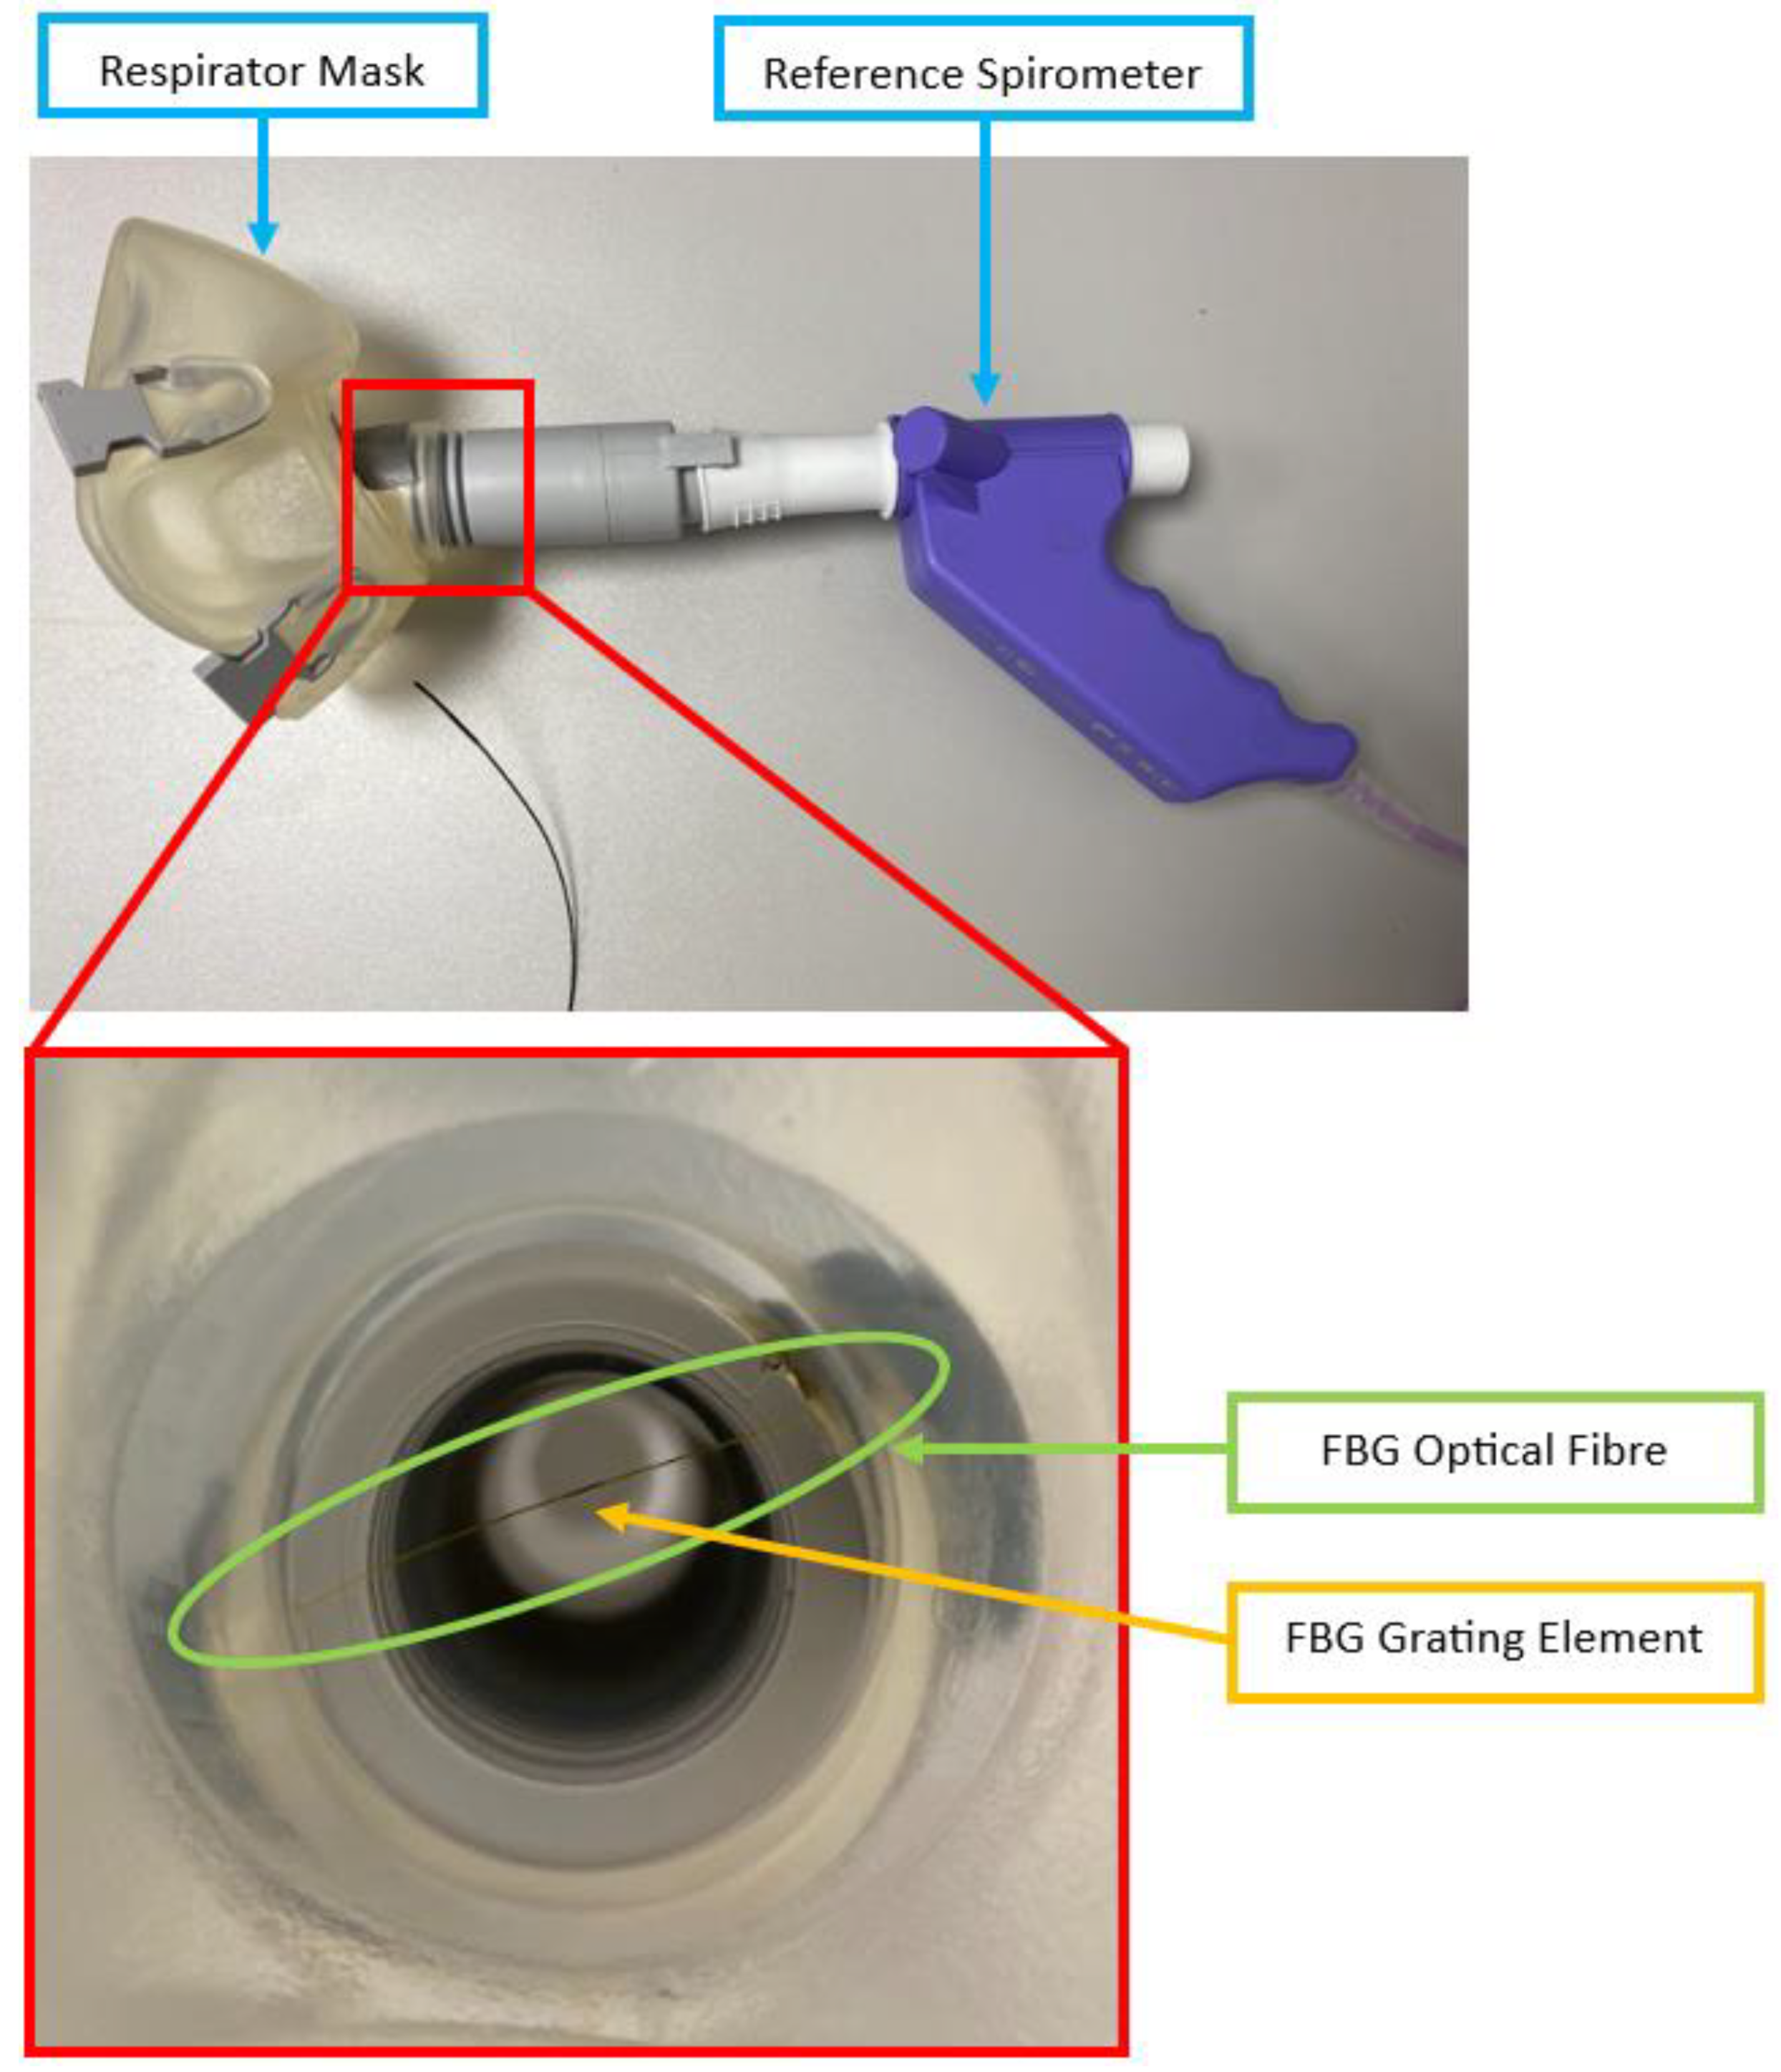
This section explains the setup and protocol to evaluate the “Mask System”, which refers to the FBG respirator mask and the mini-interrogator collectively against the gold standard spirometer. The experiment setup and protocol for Mask System performance evaluation was approved by the University of Nottingham, Faculty of Engineering, Ethics Committee (Ref: 2022-64, approved March 2024, study conducted May–July 2024). Each volunteer gave their informed consent prior to commencing the procedure.

2.4.1. Setup

To evaluate the performance of the Mask System, 10 healthy volunteers without known health complications (9 males, 1 female, mean age 28 (2.83 standard deviation)) were recruited. The imbalance between males and females was not intended but was simply dependent on the availability of volunteers. According to previously published research [41], there is no correlation between exhaled breath temperature at rest and gender. This is also the case for body temperature (measured at traditional sites such as axilla), heart rate, height, weight, and blood pressure [41]. Thus, these factors do not affect the measurements in this study. However, it is well documented that during physical activities (such as physical exercises and manual labour), individual breath temperature increases [42]. These will be explored in future work during work-simulated experiments following the FBG and miniature interrogator’s integration into industrial-grade masks, as described in the Discussion section. For confidentiality, each volunteer is given a unique identification number (ID). The procedure involved the volunteers performing natural tidal breathing whilst wearing the Mask System. A spirometer is fitted with the mask for simultaneous reference measurements (Figure 5 and Figure 6). The reference spirometer used in our study (Easy On-PC Spirometer) is an ultrasonic device that measures breathing volume over time. It works by emitting high-frequency sound waves that reflect off the particles in the exhaled and inhaled air, allowing the device to calculate the air volume passing through the sensor. The data acquisition rate of both devices is set to 10 Hz.
The experiment is performed in a closed, air-conditioned lab environment with air conditioning set to 23 °C and maintained throughout the experiment. This means that the ambient temperature is lower than the exhaled breath temperature (approximately 34 °C in healthy individuals [43]). Thus, it is expected that during exhalation, the FBG wavelength data will shift upward as the increase in temperature causes expansion in the FBG grating element, whilst the reverse (downward shift) is expected for inhalation.

2.4.2. Protocol

The breathing protocol includes 5 repetitions of tidal breathing, each lasting 2 min. To align both the Mask System and reference spirometer data, the timer is set to start as soon as the volunteer performs the first exhalation. The volunteers are free to choose their breathing rate and volume, as well as their path of gas exchange (oral or nasal breathing). A 30–60 s break is given between each measurement repetition.

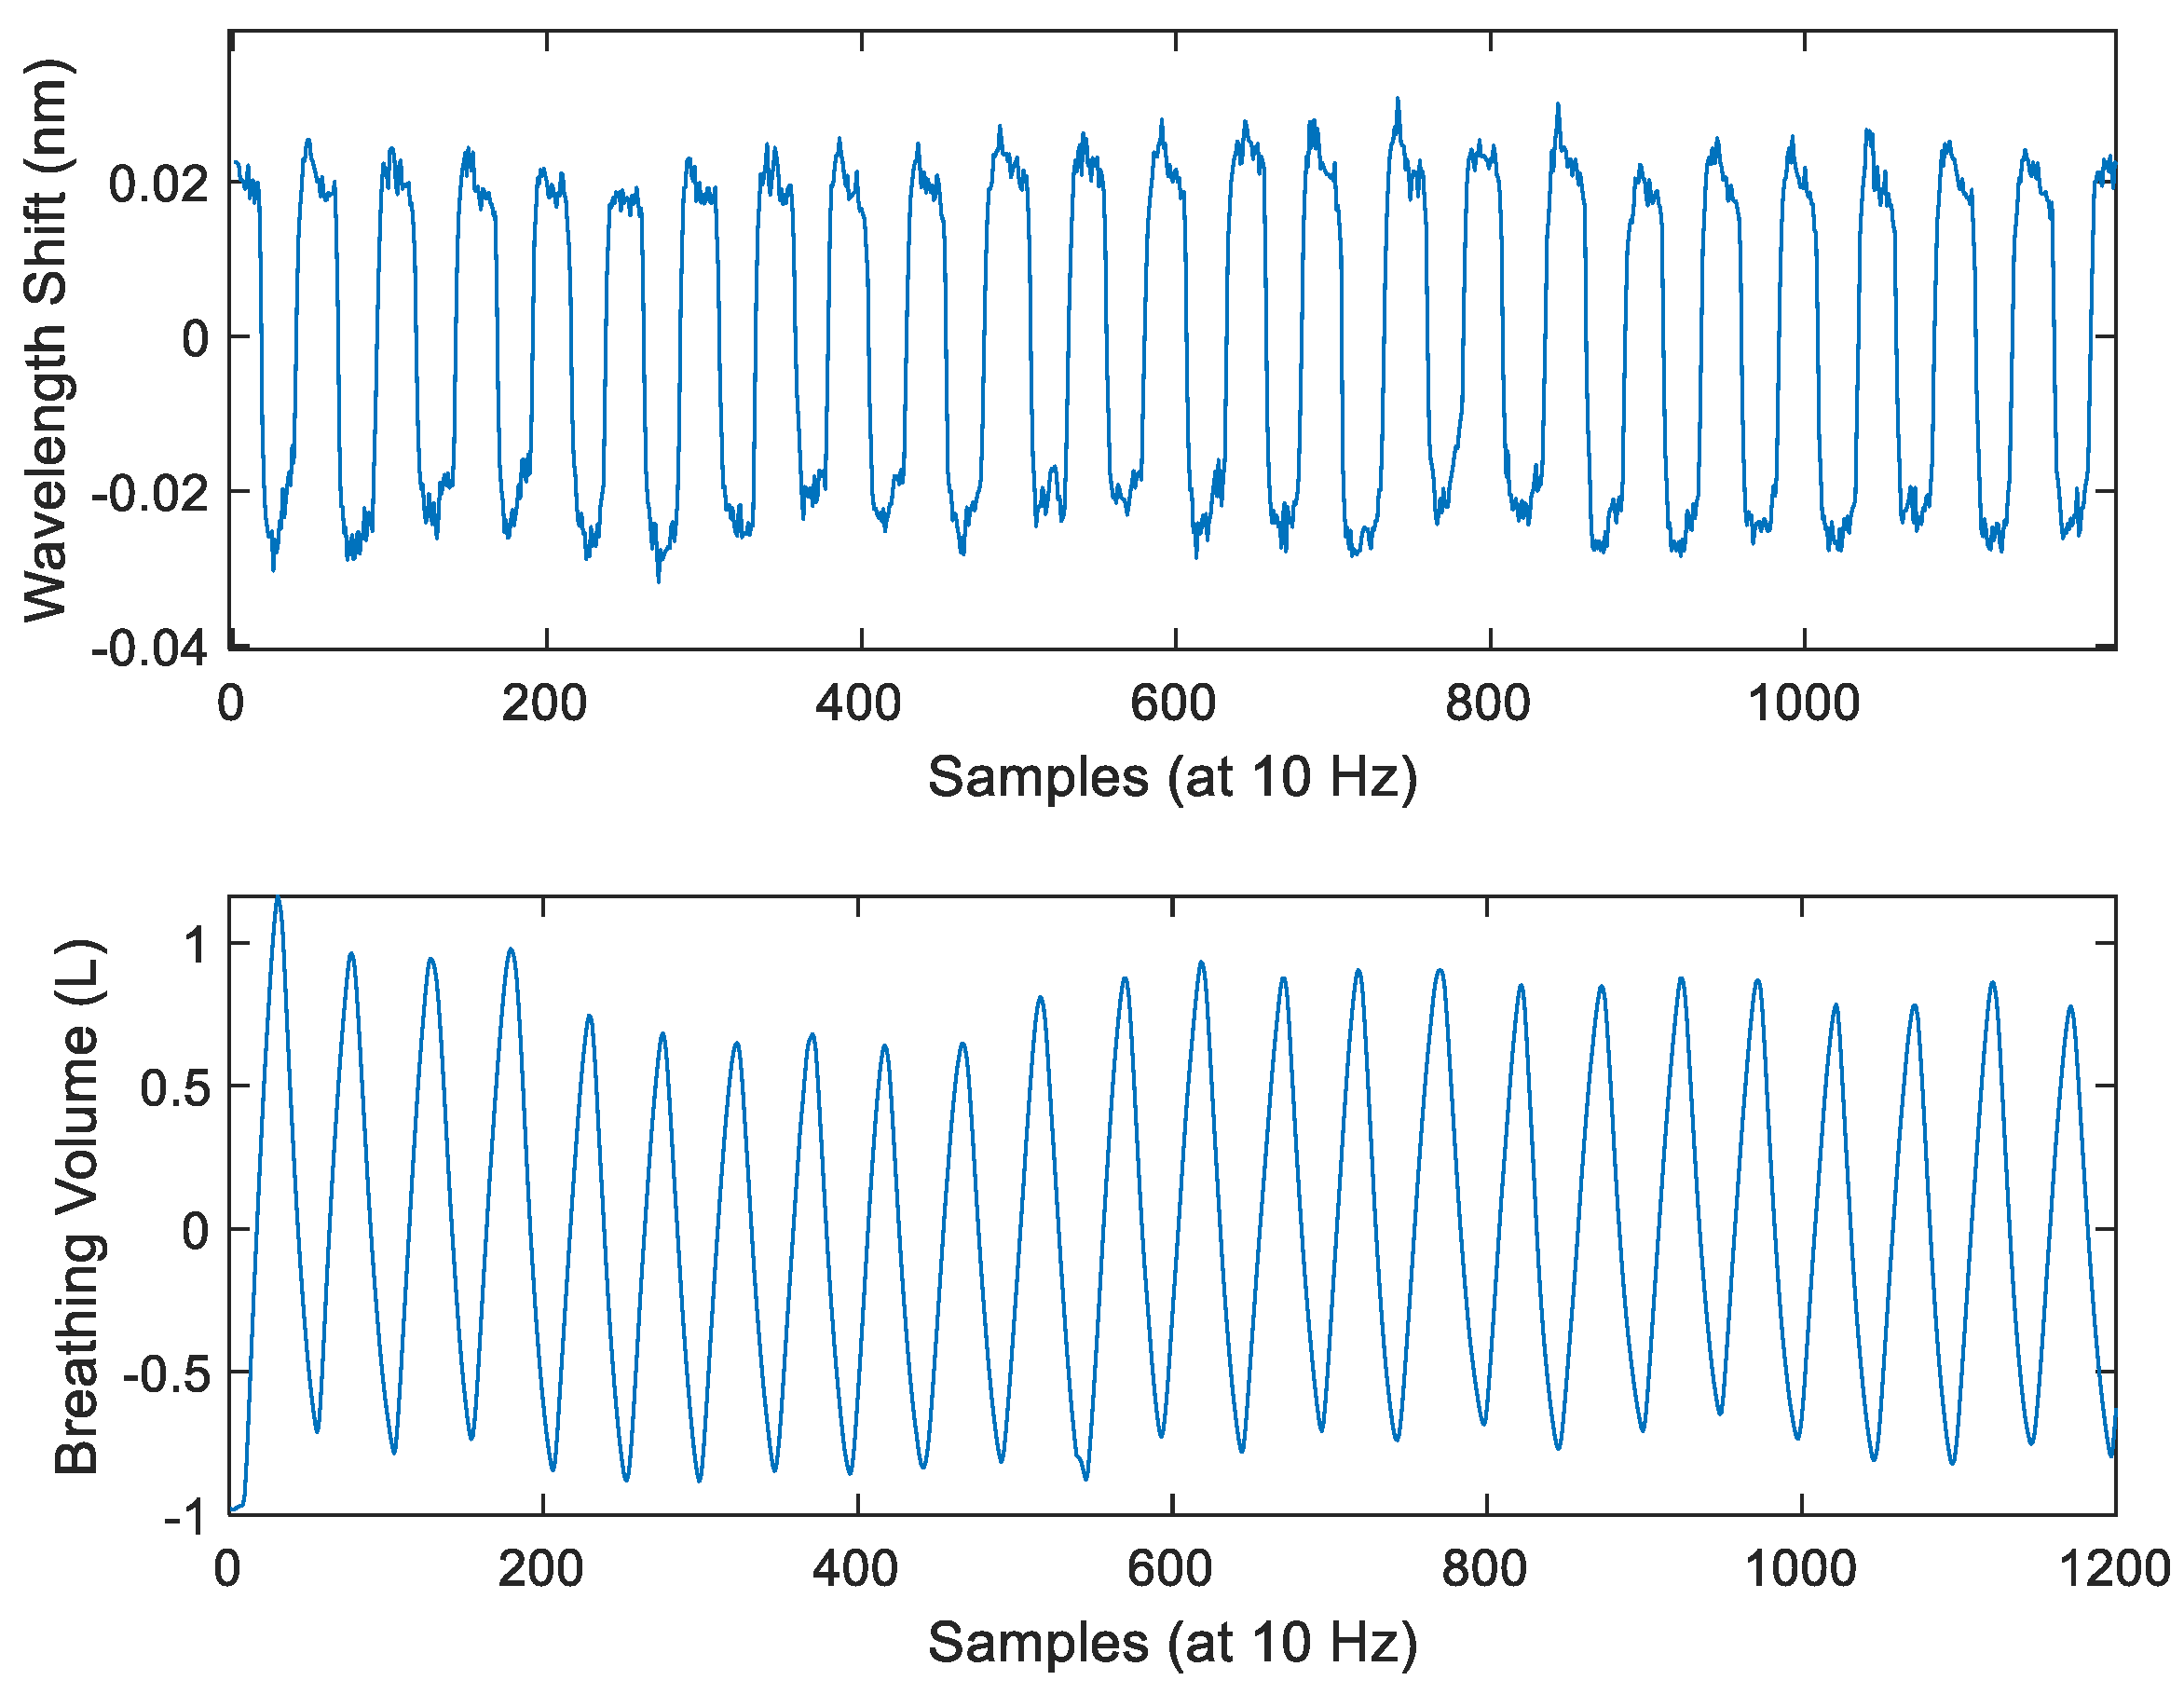
2.4.3. Data Processing and Interpretation

Since it is expected that exhalation and inhalation cause upward and downward FBG wavelength shifts, respectively, it is the opposite of the reference spirometer. Hence, prior to filtering, the Mask System data are inverted. The Mask System data are processed using a moving average filter and MATLAB (R2019b)’s built-in peak detection function “findpeaks” to reduce noise and identify individual breaths, respectively. The moving average filter has a 10-sample window size (equivalent to 1 s at a 10 Hz sampling rate).
In this experiment, only complete breaths are counted. This is defined as an inhalation followed by an exhalation [44]. This is identified in the data from both the Mask System and reference spirometer by locating the peak within the signal that represents peak inhalation. To achieve this, the “minpeakprominence” value of the findpeaks function is set to 7.4 pm for every volunteer Mask System data. This was chosen based on the magnitude of noise associated with the Mask System when placed on a benchtop in the same experiment venue and air conditioning setting as volunteer studies.
For the reference spirometer, breath identification is performed using manual identification. That is, during experimentation, the investigator (main author, N.L.) observes the spirometer waveform simultaneously with the volunteer’s chest wall motion using the same protocol as manual breath counting (rising indicates inhalation and falling indicates exhalation [45,46]). Each complete breath is noted and marked on the peak of the spirometer signal as a reference. The number of complete breaths (peaks) counted from both the Mask System and reference spirometer are recorded and compared.

3. Results

A typical example of raw volunteer studies data from the Mask System and reference spirometer is shown in Figure 7. It is observed that the Mask System data are the inverse of the reference spirometer data, which agrees with our expectation (Section 2.4.1). High-frequency noise (>0.4 Hz) is also present. This is consistent with Figure 8a, which shows the raw data from the Mask System when it is placed on a benchtop in the experiment venue with the same air conditioning setting as volunteer studies. Without the influence of breath-induced air temperature variation, there are high-frequency fluctuations with a similar magnitude to noise present in the volunteer study data. This indicates that the noise in the volunteer study signal is due to electrical and thermal noise in the mini-interrogator. Additionally, as the breath airflow slows at the peaks of inhalation and exhalation, further high-frequency fluctuations are likely contributed by increased air turbulence.
Figure 8b shows the benchtop data after filtering the raw benchtop data using a moving average filter. The magnitude of high-frequency fluctuation is greatly reduced (7.4 pm to 2.7 pm). Furthermore, the comparison between the Fast Fourier Transform (FFT) plot of the raw and filtered benchtop data showed that even though the high-frequency components of the signal are removed, the low-frequency ones remain largely untouched, including the 0.20 Hz to 0.33 Hz region, which is a normal human breathing frequency range.
In Figure 9, the Mask Data after filtering using the moving average filter and inversion is illustrated. The overall trend is retained, whilst the high-frequency fluctuations are mostly removed. Double peaks that remain in the filtered signal were not detected by findpeaks due to the minpeakprominence because their amplitudes were lower than 7.4 pm after filtering.
It can be seen from Figure 10 that the number of peaks counted from both plots of filtered-inverted Mask System data and reference spirometer data are identical (full set of normalised comparison plots of every volunteer given in Supplementary Materials). The resulting breath (peak) count from both the Mask System and reference spirometer for each volunteer is given in Table 3. Across every experiment repetition with every volunteer, the number of peaks counted by both the Mask System and the reference spirometer are identical.

4. Discussions

From Table 3, the Mask System and the reference spirometer have equal breath count through every volunteer trial, indicating 100% accuracy. This demonstrated improvements from our previous work [30] (65.4–88.1% mean accuracy vs. 100% accuracy). In the previous work, RR was acquired by performing a Fast Fourier Transform (FFT) on three data signals simultaneously obtained from two sensors featured in the same optical fibre placed within the EtCO2 (end-tidal CO2) mask. These include breath temperature-induced FBG wavelength shift, breath humidity-induced peak reflected light intensity variation, and breath humidity-induced variation in areas under the spectrum between 1529 and 1581 nm. The FFT was performed on the whole signal in every case, and the frequency corresponding to the greatest wavelength shift magnitude was recognised as RR. This method is prone to inaccuracy because the human respiration airflow pattern is not constant across every breath, even if the individual is breathing at a constant pre-determined RR. This indicates that the rate of corresponding temperature and humidity variation as measured by FBG also changes, which results in the frequency components of the breathing signal shifting from one that corresponds to the actual RR. However, the Mask System applies a peak detection algorithm directly onto the processed breath temperature-induced FBG signal. This better resembles the gold standard manual counting [47] and, thus, results in a more accurate RR measurement. Furthermore, the signals from peak reflected light intensity variation in our previous work were noisier than FBG wavelength shift. This is believed to be due to the position of the sensor within the EtCO2 mask, which is near the right cheek without touching the skin. This means that the sensor is subjected to more noise from air turbulence, compounded by the fact that the signal strength is reduced due to the FBG being further away from the mouth and nostrils. In contrast, the Mask System’s placement and orientation emphasise sensitivity to breath airflow in and out of the respirator mask (Section 2.1).
While we did not perform direct comparative tests with RR sensors from previous studies, our study involved volunteer experiments using tidal breathing, where both breathing rate and depth varied naturally, in contrast to studies that used pacing devices like metronomes [30]. This approach more closely mimics real-world clinical measurements of breathing rate. Direct comparison with published research on RR sensors is also challenging due to differences in performance evaluation protocols. For example, Bates et al. [9] measured data from a single volunteer over 6.9 h during sleep, Curone et al. [6] used exercises such as walking on slopes over 60 min, and Sinha et al. [22] focused on 60-s sessions with fixed breathing rates guided by a pacer. One study that employed a protocol similar to ours was Tavares et al. [22], which reported exact matches between the breathing rates measured by their system and a reference during tidal breathing (over 90 s in three intervals with 30 s of apnea in between). We observed comparable performance with our Mask System. However, as shown in Table 1 and Table 2, the Mask System offers key advantages over Tavares et al.’s approach and other studies: its portability and its resistance to noise caused by respiration-irrelevant torso movements. This makes it more suited for use during dynamic activities, such as manual labour, where torso movement can interfere with sensor accuracy. We believe these advantages highlight the Mask System’s potential for practical, real-world applications.
Although the results were promising, the volunteer study was performed in a controlled environment, and the Mask System does not feature air filters, which are typically present in industrial protective respirator masks. Therefore, it is proposed that additional investigations are conducted before work-simulated and real-life testing (different breathing rates in various mining and factory environments whilst performing various physical activities). These include investigations of (1) the effects of filters and different mask designs and (2) FBG pressure sensors.
(1)
Effect of mask structures and filters—during mining and factory work, workers are expected to wear industrial-grade respirator masks fitted with filters (such as P100, Honeywell International, Charlotte, NC, USA) to protect them from airborne harmful substances. They also typically have separate valves for inhalation and exhalation (for example, PD-101 Full-Face Industrial Air Purifying Respirator, Parcil Safety, Evansville, IN, USA). In some cases, a dedicated electric-powered portable air purifying unit is also included to pump filtered air into the mask (for example, Versaflo TR-800, 3M, Maplewood, MN, USA). These features can introduce different air movements and turbulence patterns than the respirator mask currently used in the Mask System. Thus, this investigation will include studying the effect of filter addition to the respirator mask airway, different airway structures, and different FBG placements in these structures to find the placement protocol that produces the greatest ratio of FBG sensitivity to breath-induced temperature variation and the noise from air turbulence.
(2)
FBG pressure sensor—in the environment where the ambient temperature is high or varies greatly (such as during underground mining where workers can face temperatures up to 37 °C [48]), the temperature of the exhaled breath and surrounding air can be comparable, making it difficult to identify the peak in the signal with only the findpeaks function. A solution to this is to incorporate an FBG pressure sensor into the Mask System to detect pressure changes due to inhalation and exhalation [49]. If ambient air temperature and breath temperature are significantly different, then the temperature sensor is advantageous to the pressure sensor in detecting inhalation and exhalation during quiet breathing, where the pressure drop is low due to small airflow [50]. On the other hand, in the case of minor temperature differences (causing less wavelength shift than the Mask System’s noise shown in Figure 8a, pressure measurement data can be used to assist the breath detection algorithm. Thus, research to design the FBG air pressure sensor and placement within the mask for accurate breath detection is required.
Since the interrogator (Fispec FBG X100 FiSens GmbH, Braunschweig, Germany) can support multiple FBGs simultaneously (up to 30), a wide range of FBG-based sensor systems can be integrated in addition to the temperature and pressure sensors. For example, the Mask System can be integrated with a heart rate (HR) monitoring strap (1 FBG) [32] and body temperature monitoring system (1 FBG) [51] to detect physical stress, heat stress, and fatigue, which will further contribute to the safety of workers in harsh environments [52,53].
Table 4 compares the Mask System’s mini-interrogator and other methods, both commercial and research. With regards to commercial methods, the main advantage over the proposed system is the number of supportable FBGs. However, commercial interrogators are bulkier and heavier, making them unsuitable for applications involving portable, real-time measurements during daily/occupational tasks. For novel methods, some reported full integration into a textile, i.e., each component of the interrogation system being attached to a shirt distributing the weight of the apparatus along the surface area, which favors convenience and comfort. However, since mine and factory workers may have to carry heavy tools or equipment on their body, such as an over-the-shoulder tool belt or an air purifying unit in industrial-grade protective mask, the components and wiring can be damaged. Furthermore, in these novel methods, the number of FBG supported is also lower, with some having a lower wavelength range, hence limiting the potential for multiple sensor integration.

5. Conclusions

In summary, an RR monitoring device based on incorporating FBG sensors into a respirator mask has been developed. A performance evaluation experiment with 10 healthy volunteers showed that the device could detect inhalation and exhalation coinciding with that of the reference spirometer, where both suggested the same number of breaths across the period of 120 s. Based on the results, the Mask System demonstrated improved RR from our previous work. The application of the moving average filter and peak detection algorithm directly onto the FBG signal in the time domain showed that the individual breath can be distinguished from the influence of air turbulence and accurately detected.
The employed mini-interrogator also demonstrated its ability to perform continuous measurements error-free across 10 volunteer experiments, which represents reliability in miniature FBG interrogation technology. This suggests the potential and opportunity to develop FBG technology into portable devices that can display and transfer medical data wirelessly and in real time. Overall, the Mask System showed great potential for future development as a reliable means of RR monitoring for workers. However, the system still lacks features such as a filter and dedicated valve for inhalation and exhalation typically found in industrial-grade protective masks. Additionally, the volunteer study was performed in a closed and controlled laboratory environment. Therefore, research proposals were discussed to address these and further develop the Mask System for deployment in harsh environments.

Supplementary Materials

The following supporting information can be downloaded at: https://www.mdpi.com/article/10.3390/s24237476/s1, Figure S1: Volunteer ID. 18131 Mask System vs. reference spirometer data (top to bottom plots represent experiment repetitions 1–5, respectively); Figure S2: Volunteer ID. 20609 Mask System vs. reference spirometer data (top to bottom plots represent experiment repetitions 1–5, respectively); Figure S3: Volunteer ID. 56464 Mask System vs. reference spirometer data (top to bottom plots represent experiment repetitions 1–5, respectively); Figure S4: Volunteer ID. 57384 Mask System vs. reference spirometer data (top to bottom plots represent experiment repetitions 1–5, respectively); Figure S5: Volunteer ID. 63350 Mask System vs. reference spirometer data (top to bottom plots represent experiment repetitions 1–5, respectively); Figure S6: Volunteer ID. 65714 Mask System vs. reference spirometer data (top to bottom plots represent experiment repetitions 1–5, respectively); Figure S7: Volunteer ID. 66409 Mask System vs. reference spirometer data (top to bottom plots represent experiment repetitions 1–5, respectively); Figure S8: Volunteer ID. 77711 Mask System vs. reference spirometer data (top to bottom plots represent experiment repetitions 1–5, respectively); Figure S9: Volunteer ID. 89277 Mask System vs. reference spirometer data (top to bottom plots represent experiment repetitions 1–5, respectively); Figure S10: Volunteer ID. 95543 Mask System vs. reference spirometer data (top to bottom plots represent experiment repetitions 1–5, respectively).

Author Contributions

Conceptualisation, N.L., I.A.C., S.P.M., S.K. and R.C.; methodology, N.L., I.A.C., S.P.M., S.K., B.R.H.-G., M.A.F. and R.C.; software, N.L. and I.A.C.; validation, N.L., I.A.C., S.P.M., S.K., B.R.H.-G. and R.C.; formal analysis, N.L.; investigation, N.L. and I.A.C.; resources, S.P.M., S.K., B.R.H.-G., M.A.F. and R.C.; data curation, N.L. and I.A.C.; writing—original draft preparation, N.L. and I.A.C.; writing—review and editing, N.L., I.A.C., S.P.M., S.K., M.A.F. and R.C.; visualisation, N.L. and I.A.C.; supervision, S.P.M., S.K., B.R.H.-G. and R.C.; project administration, S.P.M. and R.C.; funding acquisition, S.P.M., S.K., B.R.H.-G. and R.C. All authors have read and agreed to the published version of the manuscript.

Funding

This research was partially funded by the Medical Research Council UK (Swindon, UK), funding no. MR/Y008642/1. Itzel Avila-Castro was funded by a scholarship from Conahcyt (Mexico City, Mexico).

Institutional Review Board Statement

The study was conducted in accordance with the Declaration of Helsinki and approved by the Institutional Review Board (or Ethics Committee) of the University of Nottingham (protocol code 2022-64 on 28 March 2023).

Informed Consent Statement

Informed consent was obtained from all subjects involved in the study.

Data Availability Statement

The data presented in this study are available upon request from the corresponding author.

Conflicts of Interest

The authors declare no conflicts of interest.

References

  1. Brekke, I.J.; Puntervoll, L.H.; Pedersen, P.B.; Kellett, J.; Brabrand, M. The value of vital sign trends in predicting and monitoring clinical deterioration: A systematic review. PLoS ONE 2019, 14, e0210875. [Google Scholar] [CrossRef] [PubMed]
  2. Nicolò, A.; Massaroni, C.; Schena, E.; Sacchetti, M. The Importance of Respiratory Rate Monitoring: From Healthcare to Sport and Exercise. Sensors 2020, 20, 6396. [Google Scholar] [CrossRef] [PubMed]
  3. Loring, S.H.; Garcia-Jacques, M.; Malhotra, A. Pulmonary characteristics in COPD and mechanisms of increased work of breathing. J. Appl. Physiol. 2009, 107, 309–314. [Google Scholar] [CrossRef] [PubMed]
  4. Kim, H.; Mazza, J. Asthma. Allergy Asthma Clin. Immunol. 2011, 7 (Suppl. S1), S2. [Google Scholar] [CrossRef] [PubMed]
  5. Qi, X.; Luo, Y.; Song, M.; Liu, Y.; Shu, T.; Liu, Y.; Pang, J.; Wang, J.; Wang, C. Pneumoconiosis: Current status and future prospects. Chin. Med. J. 2021, 134, 898–907. [Google Scholar] [CrossRef]
  6. Curone, D.; Secco, E.L.; Caldani, L.; Lanatà, A.; Paradiso, R.; Tognetti, A.; Magenes, G. Assessment of Sensing Fire-Fighters Uniforms for Physiological Parameters Measurement in Harsh Environment. IEEE Trans. Inf. Technol. Biomed. 2012, 16, 501–511. [Google Scholar] [CrossRef]
  7. Aqueveque, P.; Gutierrez, C.; Rodriguez, F.S.; Pino, E.J.; Morales, A.S.; Wiechmann, E. Monitoring Physiological Variables of Mining Workers at High Altitude. IEEE Trans. Ind. Appl. 2017, 53, 2628–2634. [Google Scholar] [CrossRef]
  8. Que, C.; Kolmaga, C.; Durand, L.; Kelly, S.; Macklem, P.T. Phonospirometry for noninvasive measurement of ventilation: Methodology and preliminary results. J. Appl. Physiol. 2002, 93, 1515–1526. [Google Scholar] [CrossRef]
  9. Bates, A.; Ling, M.J.; Mann, J.; Arvind, D.K. Respiratory Rate and Flow Waveform Estimation from Tri-axial Accelerometer Data. In Proceedings of the 2010 International Conference on Body Sensor Networks, Singapore, 7–9 June 2010; pp. 144–150. [Google Scholar]
  10. Fekr, A.R.; Radecka, K.; Zilic, Z. Tidal volume variability and respiration rate estimation using a wearable accelerometer sensor. In Proceedings of the 4th International Conference on Wireless Mobile Communication and Healthcare—Transforming Healthcare Through Innovations in Mobile and Wireless Technologies (MOBIHEALTH), Athens, Greece, 3–5 November 2014; pp. 1–6. [Google Scholar]
  11. Aqueveque, P.; Gómez, B.; Monsalve, E.; Germany, E.; Ortega-Bastidas, P.; Dubo, S.; Pino, E.J. Simple Wireless Impedance Pneumography System for Unobtrusive Sensing of Respiration. Sensors 2020, 20, 5228. [Google Scholar] [CrossRef]
  12. Kwon, H.; Ikeda, K.; Kim, S.; Thiele, R.H. Non-contact thermography-based respiratory rate monitoring in a post-anesthetic care unit. J. Clin. Monit. Comput. 2021, 35, 1291–1297. [Google Scholar] [CrossRef]
  13. Hayward, N.; Shaban, M.; Badger, J.; Jones, I.; Wei, Y.; Spencer, D.; Isichei, S.; Knight, M.; Otto, J.; Rayat, G.; et al. A capaciflector provides continuous and accurate respiratory rate monitoring for patients at rest and during exercise. J. Clin. Monit. Comput. 2022, 36, 1535–1546. [Google Scholar] [CrossRef] [PubMed]
  14. Dawood, J.; Muller, M.; Carlson, C.S. “Are you breathing?”—Design, build and testing of a low-cost, portable respiratory rate monitor. Curr. Dir. Biomed. Eng. 2022, 8, 109–112. [Google Scholar] [CrossRef]
  15. Berkebile, J.A.; Mabrouk, S.A.; Ganti, V.G.; Srivatsa, A.V.; Sanchez-Perez, J.A.; Inan, O.T. Towards Estimation of Tidal Volume and Respiratory Timings via Wearable-Patch-Based Impedance Pneumography in Ambulatory Settings. IEEE Trans. Biomed. Eng. 2022, 69, 1909–1919. [Google Scholar] [CrossRef] [PubMed]
  16. Massaroni, C.; Lopes, D.S.; Presti, D.L.; Schena, E.; Silvestri, S. Contactless Monitoring of Breathing Patterns and Respiratory Rate at the Pit of the Neck: A Single Camera Approach. J. Sens. 2018, 11, 4567213. [Google Scholar] [CrossRef]
  17. Bhongade, A.; Gupta, R.; Gandhi, T.K.; Ap, P. A Portable Low-Cost Respiration Rate Measurement System for Sleep Apnea Detection. In Proceedings of the 2023 45th Annual International Conference of the IEEE Engineering in Medicine & Biology Society (EMBC), Sydney, Australia, 24–27 July 2023; pp. 1–5. [Google Scholar]
  18. Hwang, H.; Lee, K.; Lee, E. A Real-Time Remote Respiration Measurement Method with Improved Robustness Based on a CNN Model. Appl. Sci. 2022, 12, 11603. [Google Scholar] [CrossRef]
  19. Zhu, H.Y.; Hossain, S.N.; Jin, C.; Singh, A.K.; Nguyen, M.T.D.; Deverell, L.; Nguyen, V.; Gates, F.S.; Fernandez, I.G.; Melencio, M.V.; et al. An investigation into the effectiveness of using acoustic touch to assist people who are blind. PLoS ONE 2023, 18, e0290431. [Google Scholar] [CrossRef]
  20. Shafiq, G.; Veluvolu, K.C. Multimodal chest surface motion data for respiratory and cardiovascular monitoring applications. Sci. Data 2017, 4, 170052. [Google Scholar] [CrossRef]
  21. Hamouda, S.; Amneenah, N. Electromagnetic Interference Impacts on Electronic Systems and Regulations. Int. J. Adv. Multidiscip. Res. Stud. 2024, 4, 124–127. [Google Scholar]
  22. Yan, Y.; Cao, W. The mining method of anti-electromagnetic interference for electronic equipment in coal mine by considering network communication technology. Microelectron. J. 2021, 109, 104987. [Google Scholar] [CrossRef]
  23. McIntyre, W.F.; Michael, K.A.; Baranchuk, A. Electromagnetic interference induced by magnetic resonance imaging. Can. J. Cardiol. 2010, 26, e64. [Google Scholar] [CrossRef]
  24. Zhou, C.; Reyes, M.; Girman, M. Electromagnetic Interference (EMI) In Underground Coal Mines: A Literature Review and Practical Considerations. Min. Metall. Explor. 2022, 39, 421–431. [Google Scholar] [CrossRef]
  25. Zhuang, Y.; Han, T.; Yang, Q.; O’Malley, R.; Kumar, A.; Gerald, R.E.; Huang, J. A Fibre-Optic Sensor-Embedded and Machine Learning Assisted Smart Helmet for Multi-Variable Blunt Force Impact Sensing in Real Time. Biosensors 2022, 12, 1159. [Google Scholar] [CrossRef] [PubMed]
  26. Yoo, W.J.; Jang, K.W.; Seo, J.K.; Heo, J.Y.; Moon, J.S.; Jun, J.H.; Park, J.Y.; Lee, B.S. Development of optical fibre-based respiration sensor for noninvasive respiratory monitoring. Opt. Rev. 2011, 18, 132–138. [Google Scholar] [CrossRef]
  27. Dziuda, L.; Krej, M.; Skibniewski, F.W. Fibre Bragg Grating Strain Sensor Incorporated to Monitor Patient Vital Signs During MRI. IEEE Sens. J. 2013, 13, 4986–4991. [Google Scholar] [CrossRef]
  28. Elsarnagawy, T. A Simultaneous and Validated Wearable FBG Heartbeat and Respiration Rate Monitoring System. Sens. Lett. 2015, 13, 48–51. [Google Scholar] [CrossRef]
  29. Presti, D.L.; Massaroni, C.; Schena, P.S.E.; Formica, D.; Caponero, M.A.; Tomaso, G.D. Smart textile based on FBG sensors for breath-by-breath respiratory monitoring: Tests on women. In Proceedings of the 2018 IEEE International Symposium on Medical Measurements and Applications (MeMeA), Rome, Italy, 11–13 June 2018; pp. 1–6. [Google Scholar]
  30. Sinha, R.; Hernandez, F.U.; He, C.; Korposh, S.; Correia, R.; Norris, A.M.; Liu, C.; Hayes-Gill, B.R.; Morgan, S.P. Development and validation of a novel fibre-optic respiratory rate sensor (FiRRS) integrated in oxygen delivery devices. J. Phys. D Appl. Phys. 2021, 54, 124002. [Google Scholar] [CrossRef]
  31. Di Tocco, J.; Presti, D.L.; Zaltieri, M.; D’Alesio, G.; Filosa, M.; Massari, L.; Aliperta, A.; Rienzo, M.D.; Carrozza, M.C.; Ferrarin, M.; et al. A Wearable System Based on Flexible Sensors for Unobtrusive Respiratory Monitoring in Occupational Settings. IEEE Sens. J. 2021, 21, 14369–14378. [Google Scholar] [CrossRef]
  32. Tavares, C.; Leitão, C.; Presti, D.L.; Domingues, M.F.; Alberto, N.; Silva, H.; Antunes, P. Respiratory and heart rate monitoring using an FBG 3D-printed wearable system. Biomed. Opt. Express 2022, 13, 2299–2311. [Google Scholar] [CrossRef]
  33. He, C.; Wang, Q.; Qu, Z. Research Progress of Electromagnetic Shielding Materials. IOP Conf. Ser. Earth Environ. Sci. 2018, 170, 032027. [Google Scholar] [CrossRef]
  34. Vegfors, M.; Ugnell, H.; Hök, B.; Öberg, Å.; Lennmarken, C. Experimental evaluation of two new sensors for respiratory rate monitoring. Physiol. Meas. 1993, 14, 171–181. [Google Scholar] [CrossRef]
  35. Roudjane, M.; Bellemare-Rousseau, S.; Khalil, M.; Gorgutsa, S.; Miled, A.; Messaddeq, Y. A Portable Wireless Communication Platform Based on a Multi-Material Fibre Sensor for Real-Time Breath Detection. Sensors 2018, 18, 973. [Google Scholar] [CrossRef] [PubMed]
  36. Othonos, A.; Kalli, K.; Pureur, D.; Mugnier, A. Fibre Bragg Gratings. In Wavelength Filters in Fibre Optics; Springer: Berlin/Heidelberg, Germany, 2006; pp. 189–269. [Google Scholar]
  37. Li, Z.; Dong, B.; Chen, E.; Li, Y.; Zhao, W.; Wang, Y.; Gao, C. High sensitivity FBG humidity sensor coated with graphene and polyimide films. Opt. Fibre Technol. 2021, 66, 102635. [Google Scholar] [CrossRef]
  38. Mihailov, S.J. Fibre Bragg Grating Sensors for Harsh Environments. Sensors 2012, 12, 1898–1918. [Google Scholar] [CrossRef] [PubMed]
  39. Tahir, B.A.; Ali, J.; Rahman, R.A. Fabrication of fibre grating by phase mask and its sensing application. J. Optoelectron. Adv. Mater. 2006, 8, 1604–1609. [Google Scholar]
  40. Hill, B.; Annesley, S.H. Monitoring respiratory rate in adults. Br. J. Community Nurs. 2020, 29, 12–16. [Google Scholar] [CrossRef]
  41. Popov, T.A.; Dunev, S.; Kralimarkova, T.Z.; Kraeva, S.; DuBuske, L.M. Evaluation of a simple, potentially individual device for exhaled breath temperature measurement. Respir. Med. 2007, 101, 2044–2050. [Google Scholar] [CrossRef]
  42. Svensson, H.; Nilsson, D.; Bjermer, L.; Tufvesson, E. Exhaled Breath Temperature Increases after Exercise in Asthmatics and Controls Subject. Respiration 2012, 84, 283–290. [Google Scholar] [CrossRef]
  43. Anghel, M.; Iacobescu, F. The Influence of Temperature and CO2 in Exhaled Breath. In Proceedings of the 16th International Congress of Metrology, Paris, France, 7–10 October 2013; p. 10012. [Google Scholar]
  44. Pleil, J.D.; Wallace, M.A.G.; Davis, M.D.; Matty, C.M. The physics of human breathing: Flow, timing, volume, and pressure parameters for normal, on-demand, and ventilator respiration. J. Breath. Res. 2021, 15, 042002. [Google Scholar] [CrossRef]
  45. Henricson, J.; Glasin, J.; Rindebratt, S.; Wilhelms, D. Respiratory rate monitoring in healthy volunteers by central photoplethysmography compared to capnography. J. Biophotonics 2022, 15, e202100270. [Google Scholar] [CrossRef]
  46. Troyee, T.G.; Gani, M.M.; Hasan, M. Design and Implementation of Low-Cost Respiratory Rate Measurement Device. Arab. J. Sci. Eng. 2022, 49, 6959–6969. [Google Scholar] [CrossRef]
  47. Goldfine, C.E.; Oshim, M.F.T.; Chapman, B.P.; Ganesan, D.; Rahman, T.; Carreiro, S.P. Contactless Monitoring System Versus Gold Standard for Respiratory Rate Monitoring in Emergency Department Patients: Pilot Comparison Study. JMIR Form. Res. 2024, 8, e44717. [Google Scholar] [CrossRef] [PubMed]
  48. Zhu, S.; Wu, S.; Cheng, J.; Li, S.; Li, M. An Underground Air-Route Temperature Prediction Model for Ultra-Deep Coal Mines. Minerals 2015, 5, 527–545. [Google Scholar] [CrossRef]
  49. Pant, S.; Umesh, S.; Asokan, S. Fibre Bragg Grating Respiratory Measurement Device. In Proceedings of the 2018 IEEE International Symposium on Medical Measurements and Applications (MeMeA), Rome, Italy, 11–13 June 2018; pp. 1–5. [Google Scholar]
  50. Monjezi, M.; Jamaati, H. The effects of face mask specifications on work of breathing and particle filtration efficiency. Med. Eng. Phys. 2021, 98, 36–43. [Google Scholar] [CrossRef] [PubMed]
  51. Wang, X.; Jiang, Y.; Xu, S.; Liu, H.; Li, X. Fibre Bragg Grating-Based Smart Garment for Monitoring Human Body Temperature. Sensors 2022, 22, 4252. [Google Scholar] [CrossRef]
  52. Ghafoori, M.; Clevenger, C.; Abdallah, M.; Rens, K. Heart rate modeling and prediction of construction workers based on physical activity using deep learning. Autom. Constr. 2023, 155, 105077. [Google Scholar] [CrossRef]
  53. Nasirzadeh, F.; Karmakar, C.; Habib, A.; Neelangal, K.B.; Mir, M.; Lee, S.; Arneld, T. Continuous monitoring of body temperature for objective detection of health and safety risks in construction sites: An analysis of the accuracy and comfort of off-the-shelf wearable sensors. Heliyon 2024, 10, e26947. [Google Scholar] [CrossRef]
  54. Carmo, J.P.; da Silva, A.M.F.; Rocha, R.P.; Correia, J.H. Application of Fibre Bragg Gratings to Wearable Garments. IEEE Sens. J. 2012, 12, 261–266. [Google Scholar] [CrossRef]
  55. Diaz, C.A.R.; Leal-Junior, A.G.; Avellar, L.M.; Antunes, P.F.C.; Pontes, M.J.; Marques, C.A.; Frizera, A.; Ribeiro, M.R.N. Perrogator: A Portable Energy-Efficient Interrogator for Dynamic Monitoring of Wavelength-Based Sensors in Wearable Applications. Sensors 2019, 19, 2962. [Google Scholar] [CrossRef]
  56. Tian, X.; Wang, Y.; Zhao, Q.; Li, Y.; Li, H.; Qu, J.; Zhang, D. A Miniaturized, Low-Cost and Portable Fibre Bragg Grating Interrogation System for Remote Monitoring. Optik 2021, 248, 168054. [Google Scholar]
  57. Li, H.; Yang, H.; Li, E.; Liu, Z.; Wei, K. Wearable sensors in intelligent clothing for measuring human body temperature based on optical fibre Bragg grating. Opt. Express 2012, 20, 11740–11752. [Google Scholar] [CrossRef]
Figure 1. Dimension of employed respirator mask (head strap removed).
Sensors 24 07476 g001
Figure 2. Side view illustration of overall design of respirator mask after FBG placements perpendicular to breath airflow direction; sub-panel shows a magnified sketch (not to scale) at the respirator mask airway and cross-sectional diagram of FBG grating elements along with inhalation and exhalation airflow directions.
Sensors 24 07476 g002
Figure 3. System diagram of the mini-interrogator operation with WebSocket protocol.
Sensors 24 07476 g003
Figure 4. FiSpecX100 instrumentation flow chart, including ESP32, UART protocol, and parsing of FBG data/wavelength shift values.
Sensors 24 07476 g004
Figure 5. Mask System setup during volunteer study (note: FBG placement on respirator mask is as shown in Figure 2; head strap included in this figure).
Sensors 24 07476 g005
Figure 6. FBG respirator mask and reference spirometer setup during volunteer experiments (sub-panel shows a photo of FBG placement in the respirator mask airway, taken from the inside of the respirator mask after spirometer attachment).
Sensors 24 07476 g006
Figure 7. Examples of data from a volunteer (top panel = Mask System raw data, bottom panel = reference spirometer data).
Sensors 24 07476 g007
Figure 8. Mask System data when placed on benchtop at experiment venue; (a) time domain where the X-axis is labelled as data samples and acquisition rate; (b) frequency domain (note: sub-panel in (b) shows magnification of data at 0–1 Hz).
Sensors 24 07476 g008
Figure 9. Inverted and filtered Mask System data peak detection (sub-panel shows magnification of data at the double peak).
Sensors 24 07476 g009
Figure 10. Example comparison between processed Mask System and reference spirometer normalised data and peak detection (note: the result of reference spirometer data manual breath count is shown as the peaks of the signal labelled as “Reference Spirometer Peaks”).
Sensors 24 07476 g010
Table 1. Chronological review of RR monitoring device operation principle and performance/error (n = no. of volunteer/subject, MPE = mean percentage error, SD = standard deviation, COV = coefficient of variation, BA = Bland–Altman, LOA = limits of agreement, RMSE = root mean square error, CC = correlation coefficient, BPM = breaths per minute, BREA = breathing rate estimation accuracy = [1—normalized mean absolute error] × 100%).
Author, Reference, and YearOperation PrinciplenPortablePerformance/ErrorLimitations
Bates et al., [9], 2010Accelerometer (chest wall angular displacement)1NoRMSE: 0.38 BPM (3 BPM peak error)Prone to respiration-irrelevant motion artefacts
Curone et al., [6], 2012Piezoelectric sensor strap (voltage variation due to respiration-induced stress)6NoBA: bias range = −5 to 0 BPM, max upper LOA = 11, min lower LOA = −17
Fekr et al., [10], 2018Accelerometer (chest wall 3D movement)8NoMean CC: 0.85 BPM, SD not given
Massaroni et al., [16], 2018RGB video analysis12NoBA: −0.03 BPM bias (−3.51 to 3.46 BPM LOA)Prone to interference due to camera obstructions and respiration-irrelevant motion artefacts
Aqueveque et al., [11], 2020Thoracic impedance plethysmography (four electrodes, two on each hemithorax)15NoBA: right thorax (−0.18 BPM bias, −2.96 to 2.6 LOA), left thorax (−0.52 BPM bias, −3.08 to 2.07 LOA)Prone to inaccuracies due to motion artefacts and breathing movement pattern variation
Kwon et al., [12], 2020Thermography imaging (respiration-induced temperature variation near nostril)101NoBA: −0.15 BPM bias (2.65 to −2.92 LOA)Prone to interference due to camera obstructions and other movements
Hayward et al., [13], 2022Capaciflector (chest wall motion)61NoBA: static (bias range = 0.95 to 0.85 BPM, min lower LOA = −2.30, max upper LOA = 3.90); exercise (bias range = 0.31 to 0.32 BPM, min lower LOA = −3.51, max upper LOA = 3.36)Prone to cross-talks due to moisture buildup in the sensing element due to skin humidity and sweating
Dawood et al., [14], 2022Thermistor mask (respiration-induced temperature variation near nostril)5YesMPE: 5.6% (SD not reported)Prone to EM-induced self-heating
Bhongade et al., [17], 2023Inertial measurement unit (three units placed on chest, abdomen, and lateral left rib)3YesBREA: 97.50 ± 1.17% (static seated); 96.84 ± 1.76% (seated working); and 95.17 ± 2.66% (static supine)Prone to respiration-irrelevant motion artefacts
Table 2. Chronological review of fibre optic respiration sensor operation principle, respiration parameter measured, calibration methodology, and performance/error (n = no. of volunteer/subject, MPE = mean percentage error, SD = standard deviation, BA = Bland–Altman, LOA = limits of agreement, MPA = mean percentage accuracy, MAPE = mean absolute percentage error.
Author, Reference, and YearOperation PrinciplenPortablePerformance/ErrorLimitations
Vegfors et al., [34], 1993Boundary reflection10NoMPE: spontaneous rate (0.1%, 1.91% SD), fixed rate (0%, 0.67% SD)Prone to respiration-irrelevant motion artefacts
Yoo et al., [26], 2011Polycrystalline optical fibre, thermochromic microcapsule pigment (respiration-induced temperature variation near nostril)1NoNo comparison with reference devices reportedProne to respiration-irrelevant motion artefacts, discomfort due to placement requirements (directly on skin between nose and upper lip via adhesive)
Dziuda et al., [27], 2013FBG-embedded plexiglass bed (torso motion)3NoBA: 0.00 BPM bias (–0.42 to 0.43 LOA)Applicable only for static supine position
Elsarnagawy, [28], 2015FBG-embedded strap (horizontal chest strain)10NoExact match with manual countingProne to respiration-irrelevant motion artefacts, placement-induced discomfort (directly over mammilla)
Presti et al., [29], 2018FBG array (body strain)8NoPE: 0.22% mean (0.12% SD)Prone to respiration-irrelevant motion artefacts
Sinha et al., [30], 2021FBG (respiration-induced temperature variation near nostril)18NoMPA: 88.1% (2.9% SD)Interpretation algorithm undermines breathing frequency variation during measurements
Di Tocco et al., [31], 2021FBG (horizontal chest and abdomen strain)10NoMAPE: 2.34% (1.88% SD)Prone to respiration-irrelevant motion artefacts
Tavares et al., [32], 2022FBG (horizontal chest strain)3NoExact match with reference RR
Roudjane et al., [35], 2018Hollow-core silica-based fibre array bending (horizontal chest strain)4YesNo comparison with reference devices reportedProne to respiration-irrelevant motion artefacts
Table 3. No. of breaths counted from Mask System and reference spirometer data throughout the duration of each repetition of tidal breathing experiment (120 s).
Volunteer IDMask System Breath Count (First, Second, Third, Fourth, Fifth Experiment Repetitions)Reference Spirometer Breath Count (First, Second, Third, Fourth, Fifth Experiment Repetitions)
1813124, 25, 21, 23, 2324, 25, 21, 23, 23
2060937, 38, 39, 38, 3837, 38, 39, 38, 38
5646437, 37, 35, 34, 3137, 37, 35, 34, 31
5738433, 33, 28, 28, 2733, 33, 28, 28, 27
6335019, 23, 22, 23, 2019, 23, 22, 23, 20
6571431, 31, 29, 31, 3131, 31, 29, 31, 31
6640920, 24, 19, 20, 2220, 24, 19, 20, 22
7771120, 20, 20, 20, 1920, 20, 20, 20, 19
8927736, 33, 40, 37, 4136, 33, 40, 37, 41
9554325, 33, 34, 35, 3425, 33, 34, 35, 34
Table 4. Comparison between proposed Mask System and other methods of interrogation, both commercial and novel (NR = not reported; * = individual components of apparatus reported to be placed in a single layer directly onto a shirt).
SystemNo. of ChannelsMax No. of FBG per ChannelSampling Rate (hz)Wavelength Range (nm)Resolution (nm)Dimension (mm × mm × mm)Weight (g)Power Consumption (W)Battery-Powered
Mask System13010808–8800.1155 × 86 × 653741.2Yes
CommercialSmartScan (Smartfibres, Bracknell, UK)41625001528–15680.1140 × 115 × 859008.5No
LCM-2708 (Fibrestrike, Twinsburg, OH, USA)8819,2001515–15851170 × 99 × 3614536NRYes
FSI S16PC (Femto Sensing, Atlanta, GA, USA)163011510–15901235 × 202 × 120350018No
Hyperion Si255 (Luna Innovations, Roanoke, VA, USA)16*50001460–1620NR307 × 274 × 69490040No
NovelCarmo et. al. (2012) [54]116361529–15611NR *2501NR
Diaz et. al. (2019) [55]1*2131522–15673.82145 × 85 × 453003Yes
Tian et. al. (2021) [56]4*40001510–15950.1NRNR6NR
Li et. al. (2012) [57]135001540–15600.08NR *10NRYes
Disclaimer/Publisher’s Note: The statements, opinions and data contained in all publications are solely those of the individual author(s) and contributor(s) and not of MDPI and/or the editor(s). MDPI and/or the editor(s) disclaim responsibility for any injury to people or property resulting from any ideas, methods, instructions or products referred to in the content.

