
FBG and BOTDA Based Monitoring of Mine Pressure Under Remaining Coal Pillars Using Physical Modeling


Abstract
1. Introduction
2. Experimental Design of Physical Model Based on Fiber Optic Sensing
2.1. Fiber Optic Sensing Principle
- 1.
- FBG Sensing Principle
- 2.
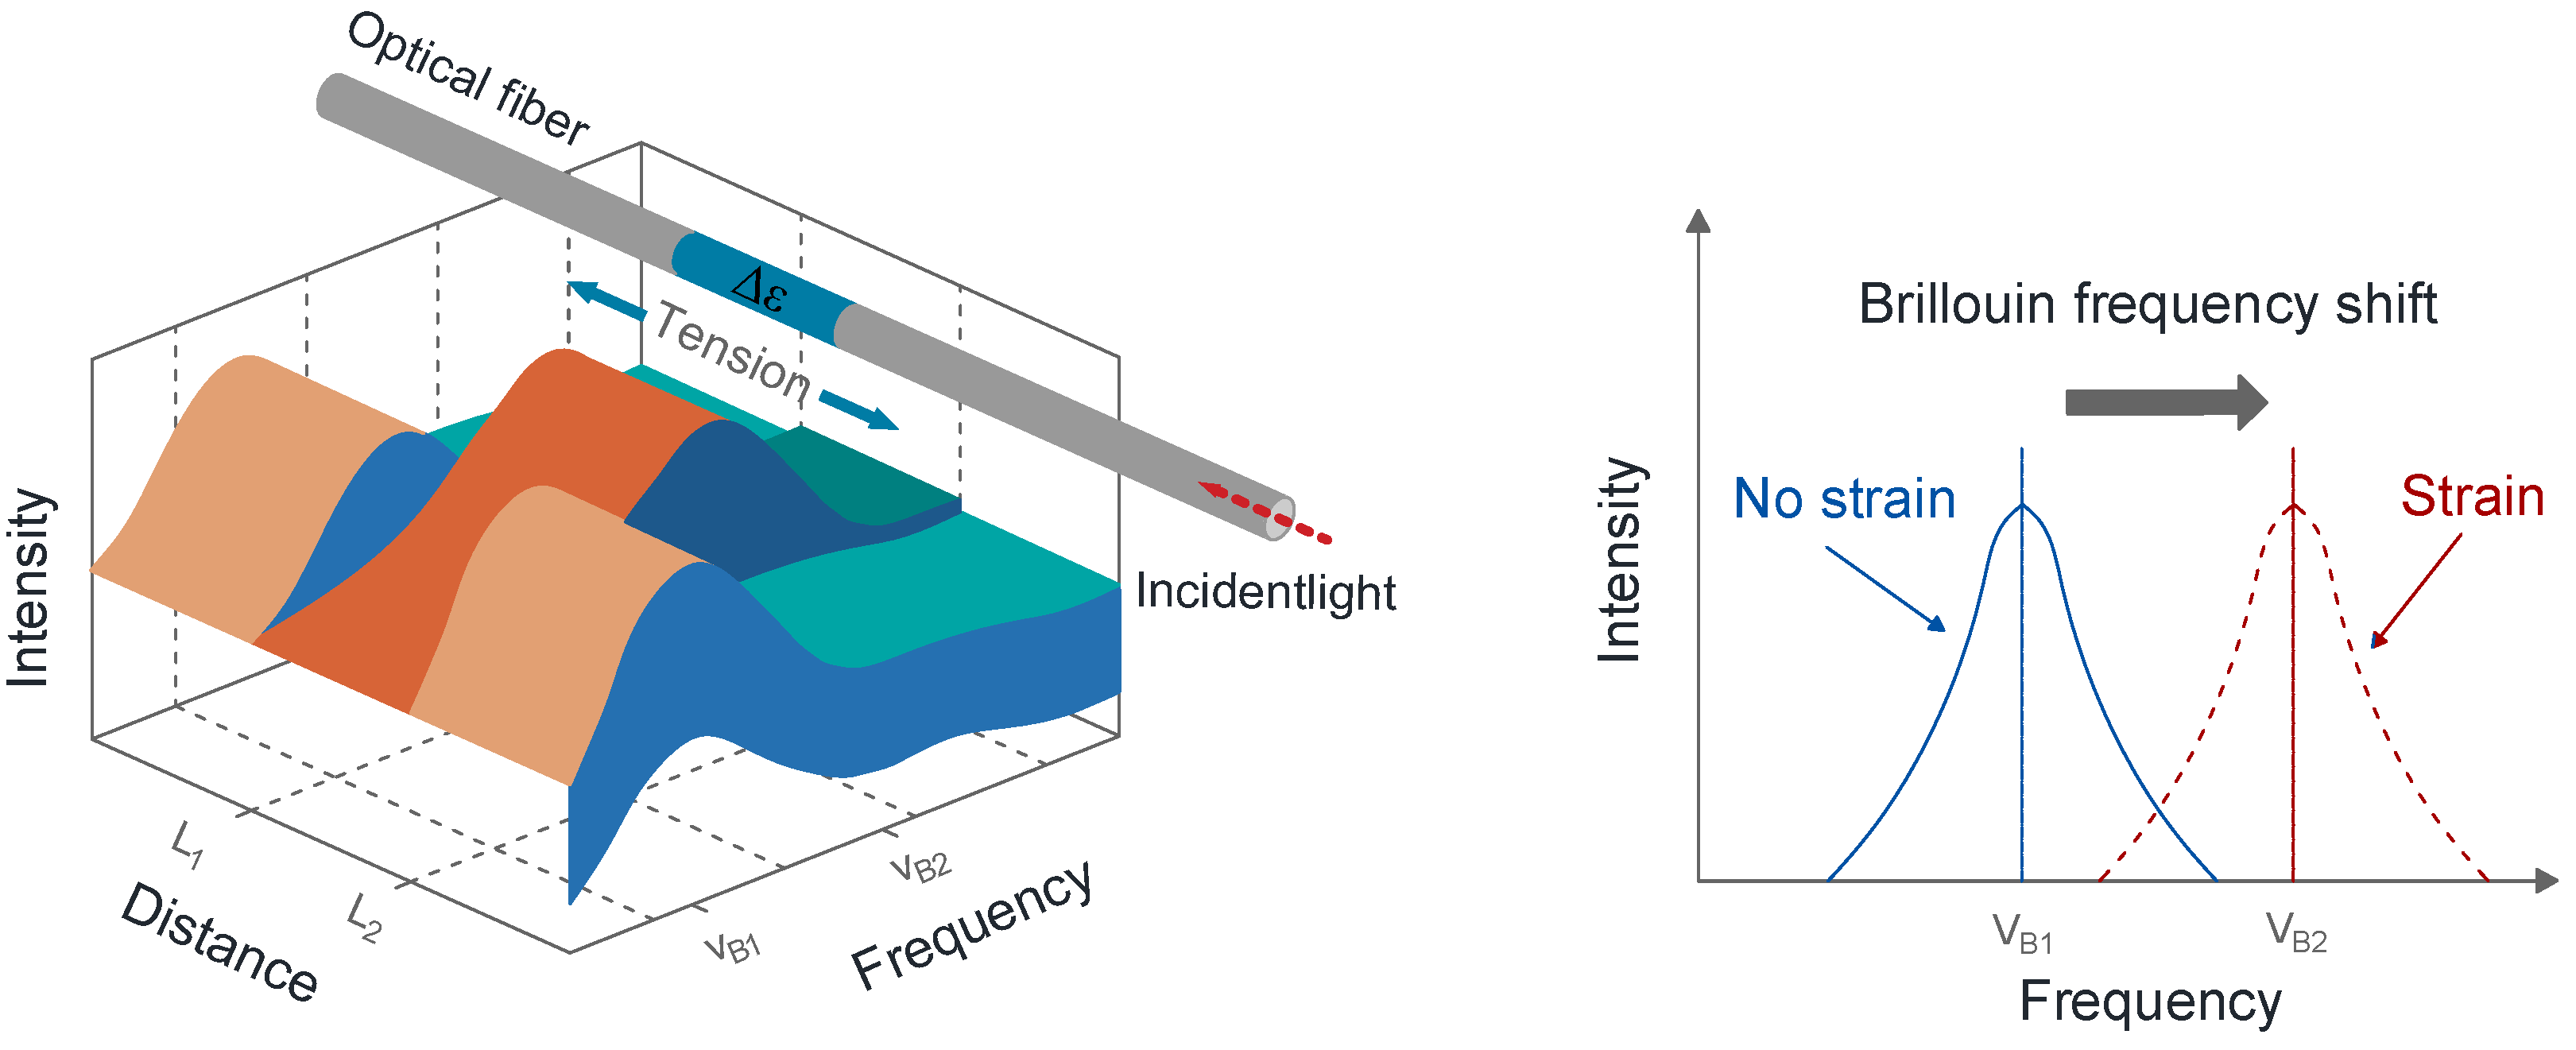
- Principle of BOTDA
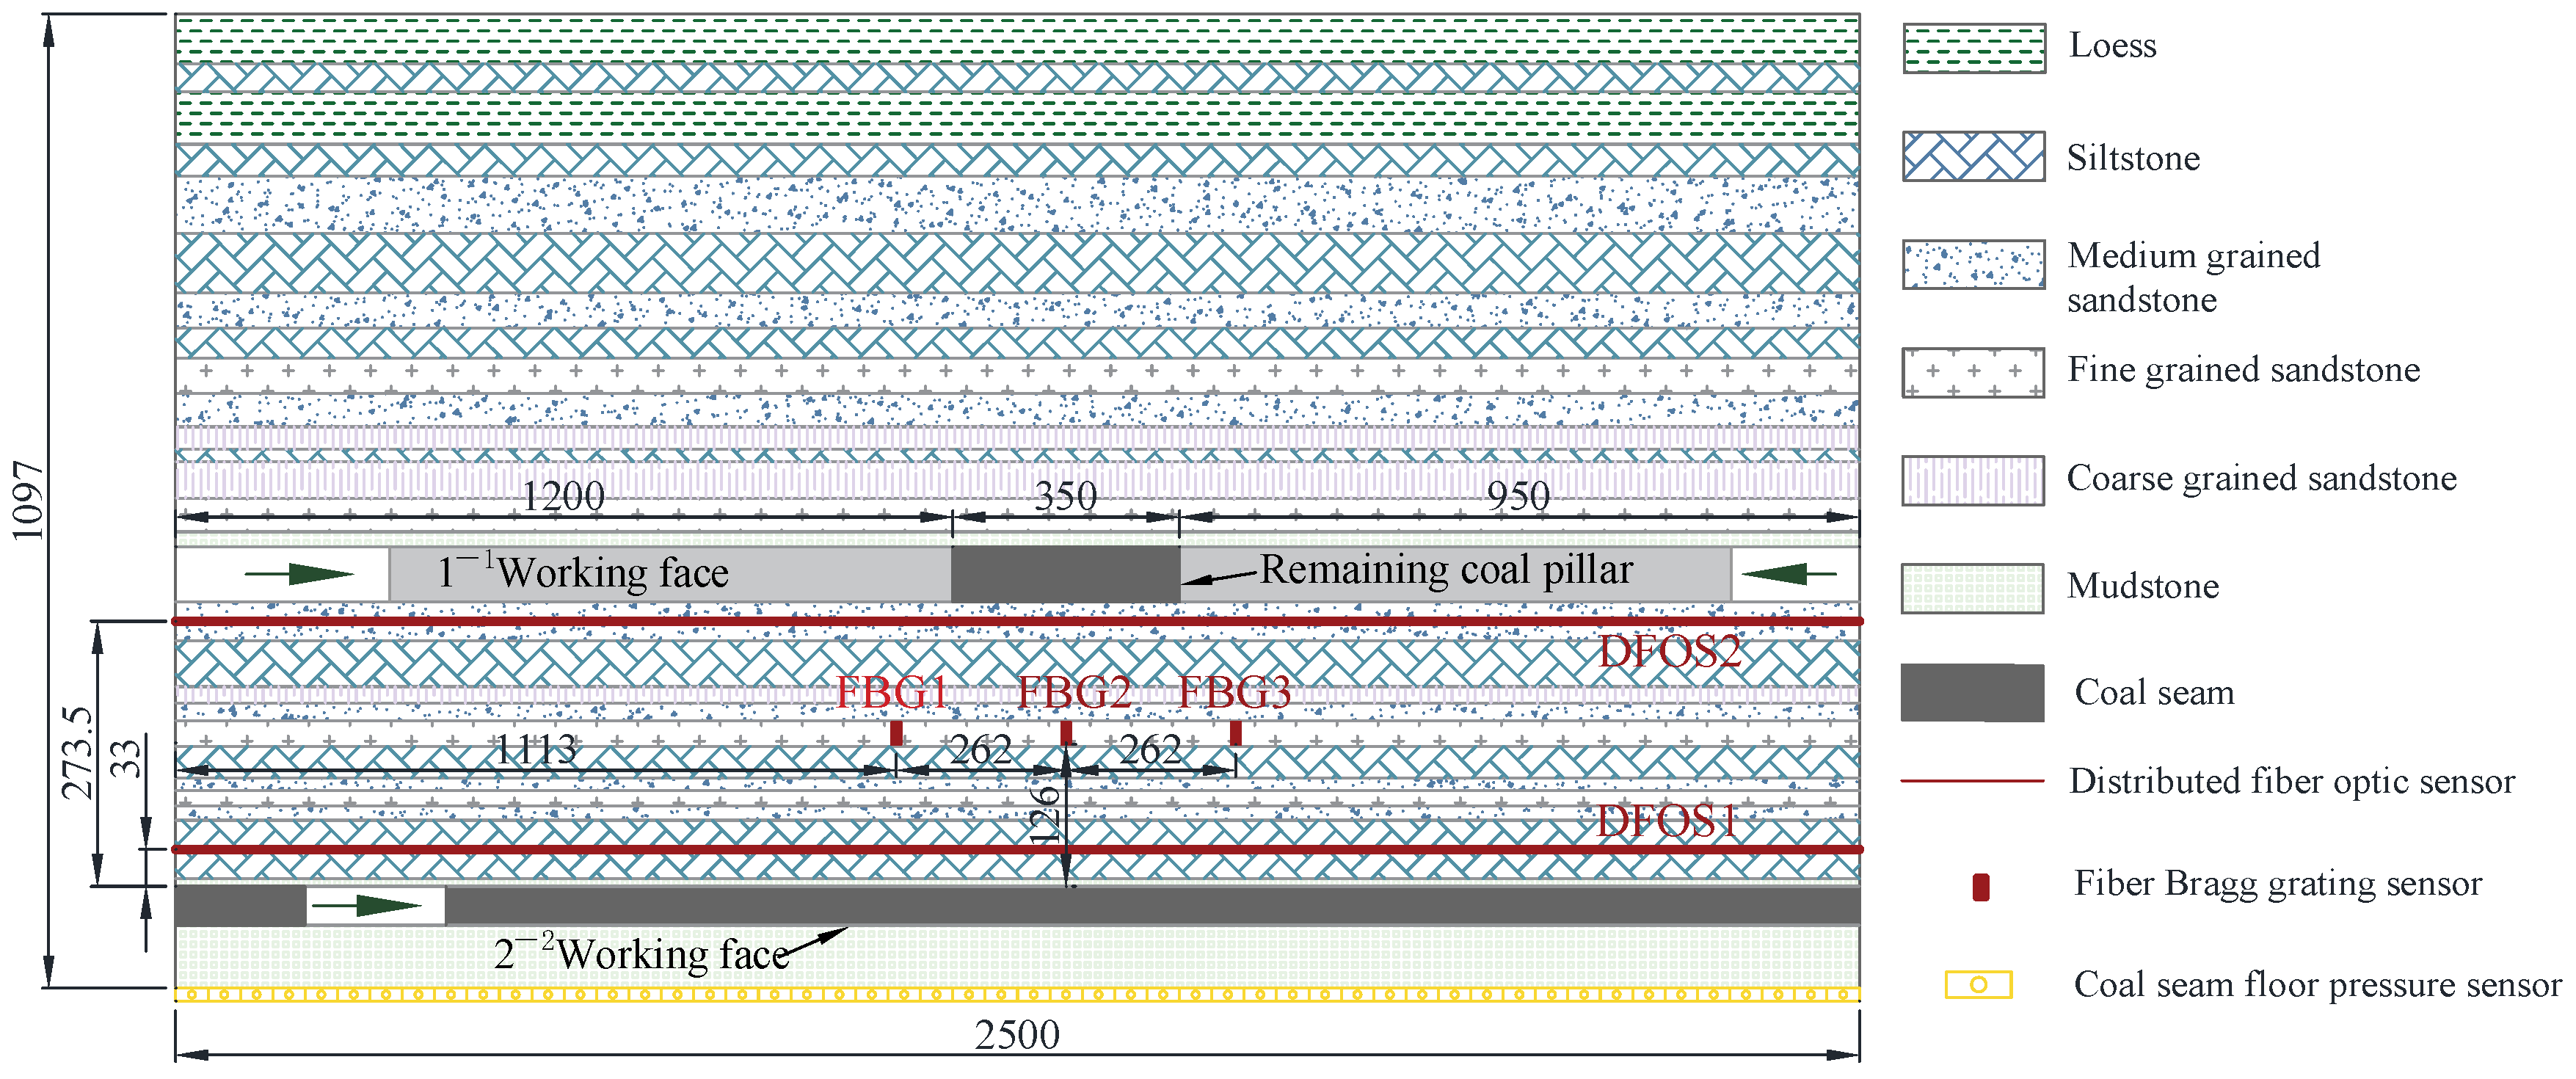
2.2. Physical Model Experiment Design
2.3. Experimental Process
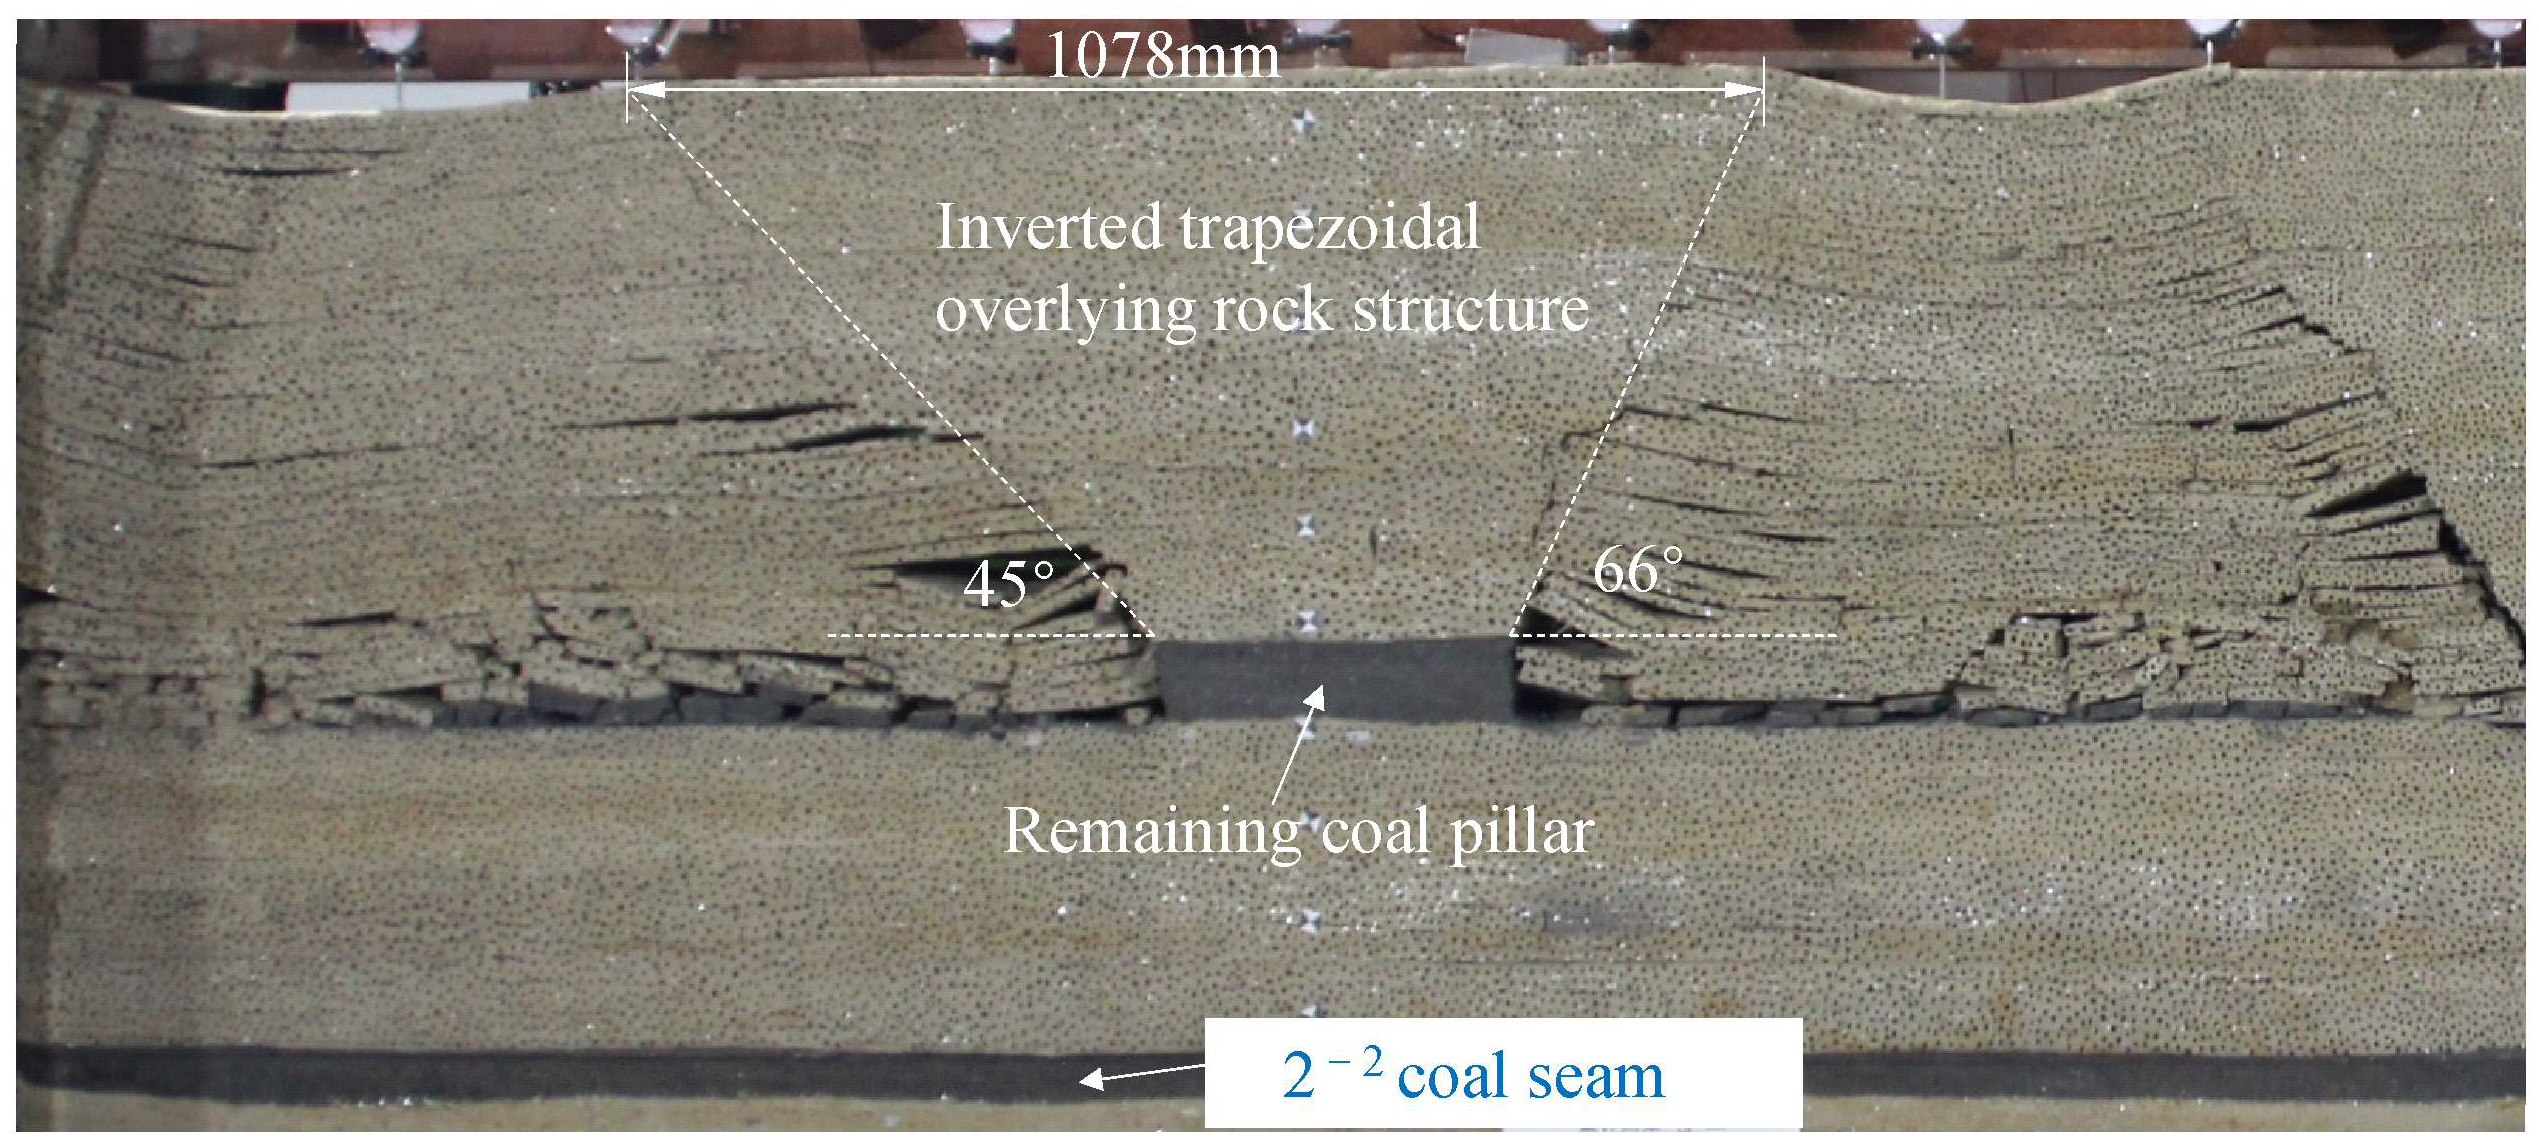
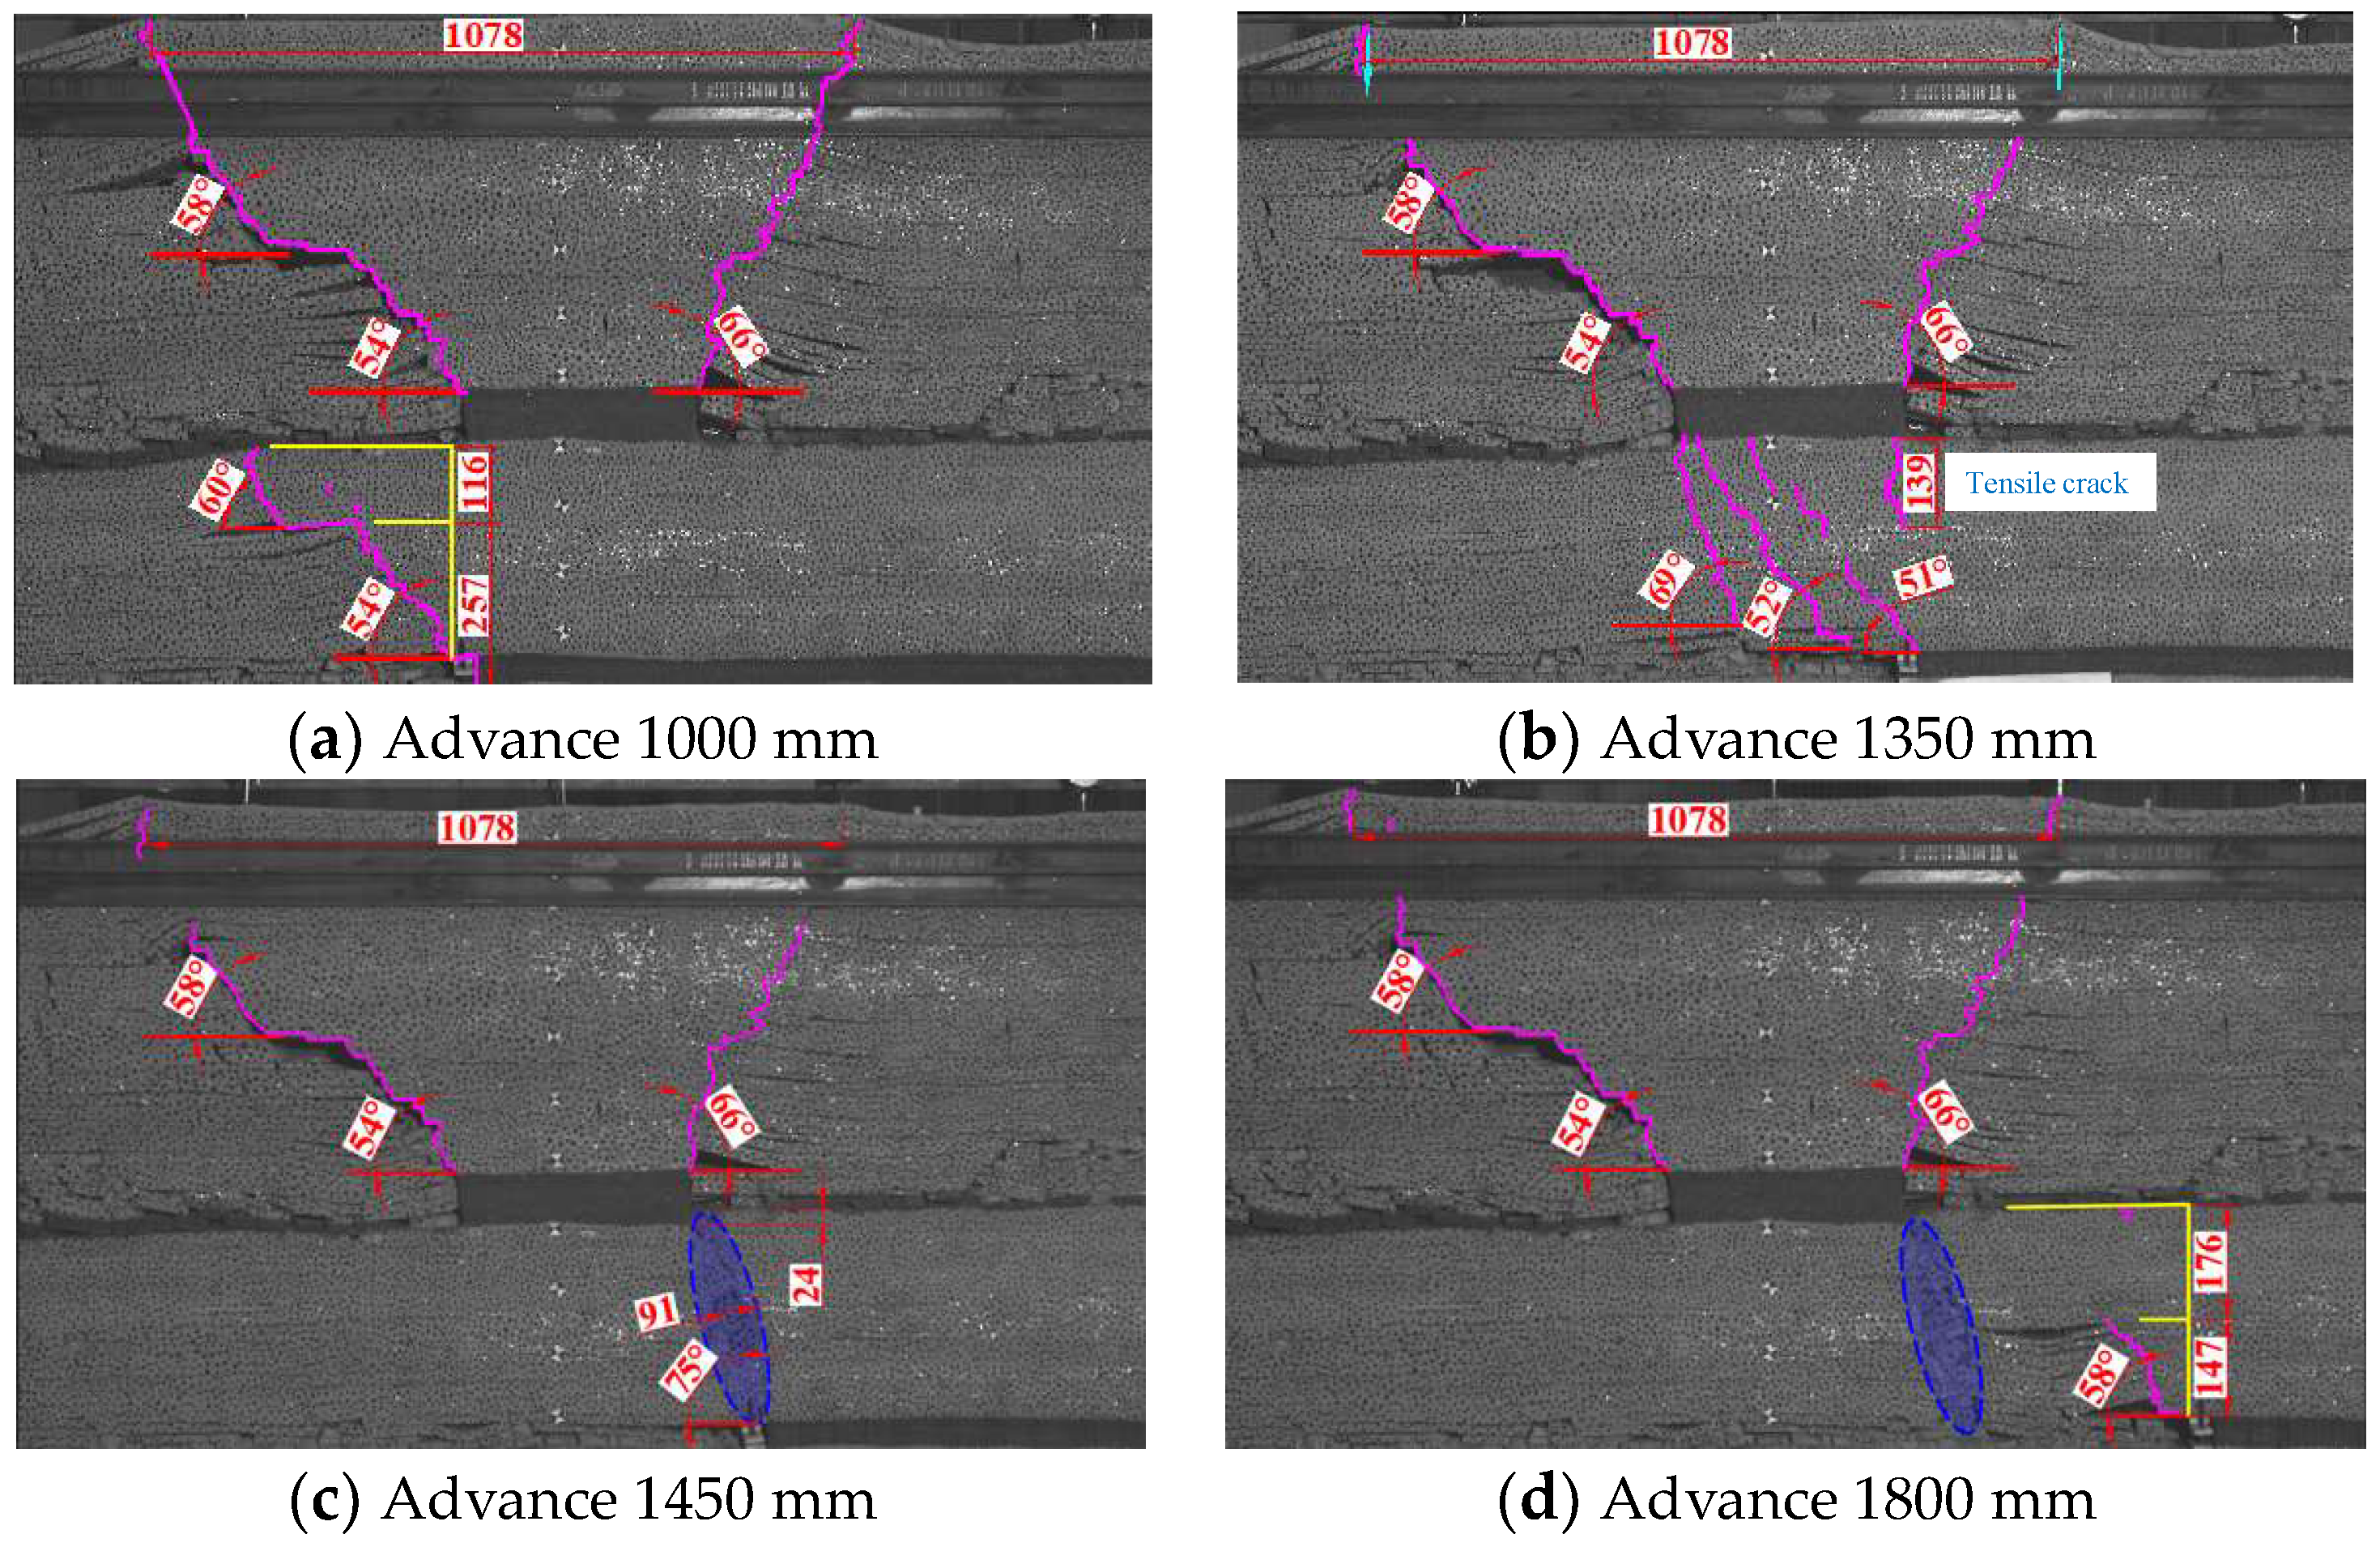
3. The Deformation Law of Overlying Rock During Mining Through the Remaining Coal Pillar
4. Fiber Optic Characterization of Overburden Fracture Characteristics
5. Characterization of Stress Evolution Law of Overlying Rock Using FBG
5.1. FBG Monitoring Analysis
5.2. Comparison of Coal Seam Floor Pressure Sensor Testing
6. Conclusions
- (1)
- The patterns of overlying rock fracture and working face pressure when the lower coal seam working face passes through the remaining coal pillar are obtained, and the patterns are divided into three stages. The fracture angle of the overlying rock near the working face decreases gradually as the mining passes through the coal pillar and the post-passing stage. The mining leads to the formation of a penetrating fracture between the overlying rock of the lower coal seam and the goaf of the upper coal seam, with the caving angle of the penetrating fracture of the overlying rock reaching 75°. The cycle pressure step distance of the working face during mining through the coal pillar is 33.3% lower than that without the influence of the coal pillar.
- (2)
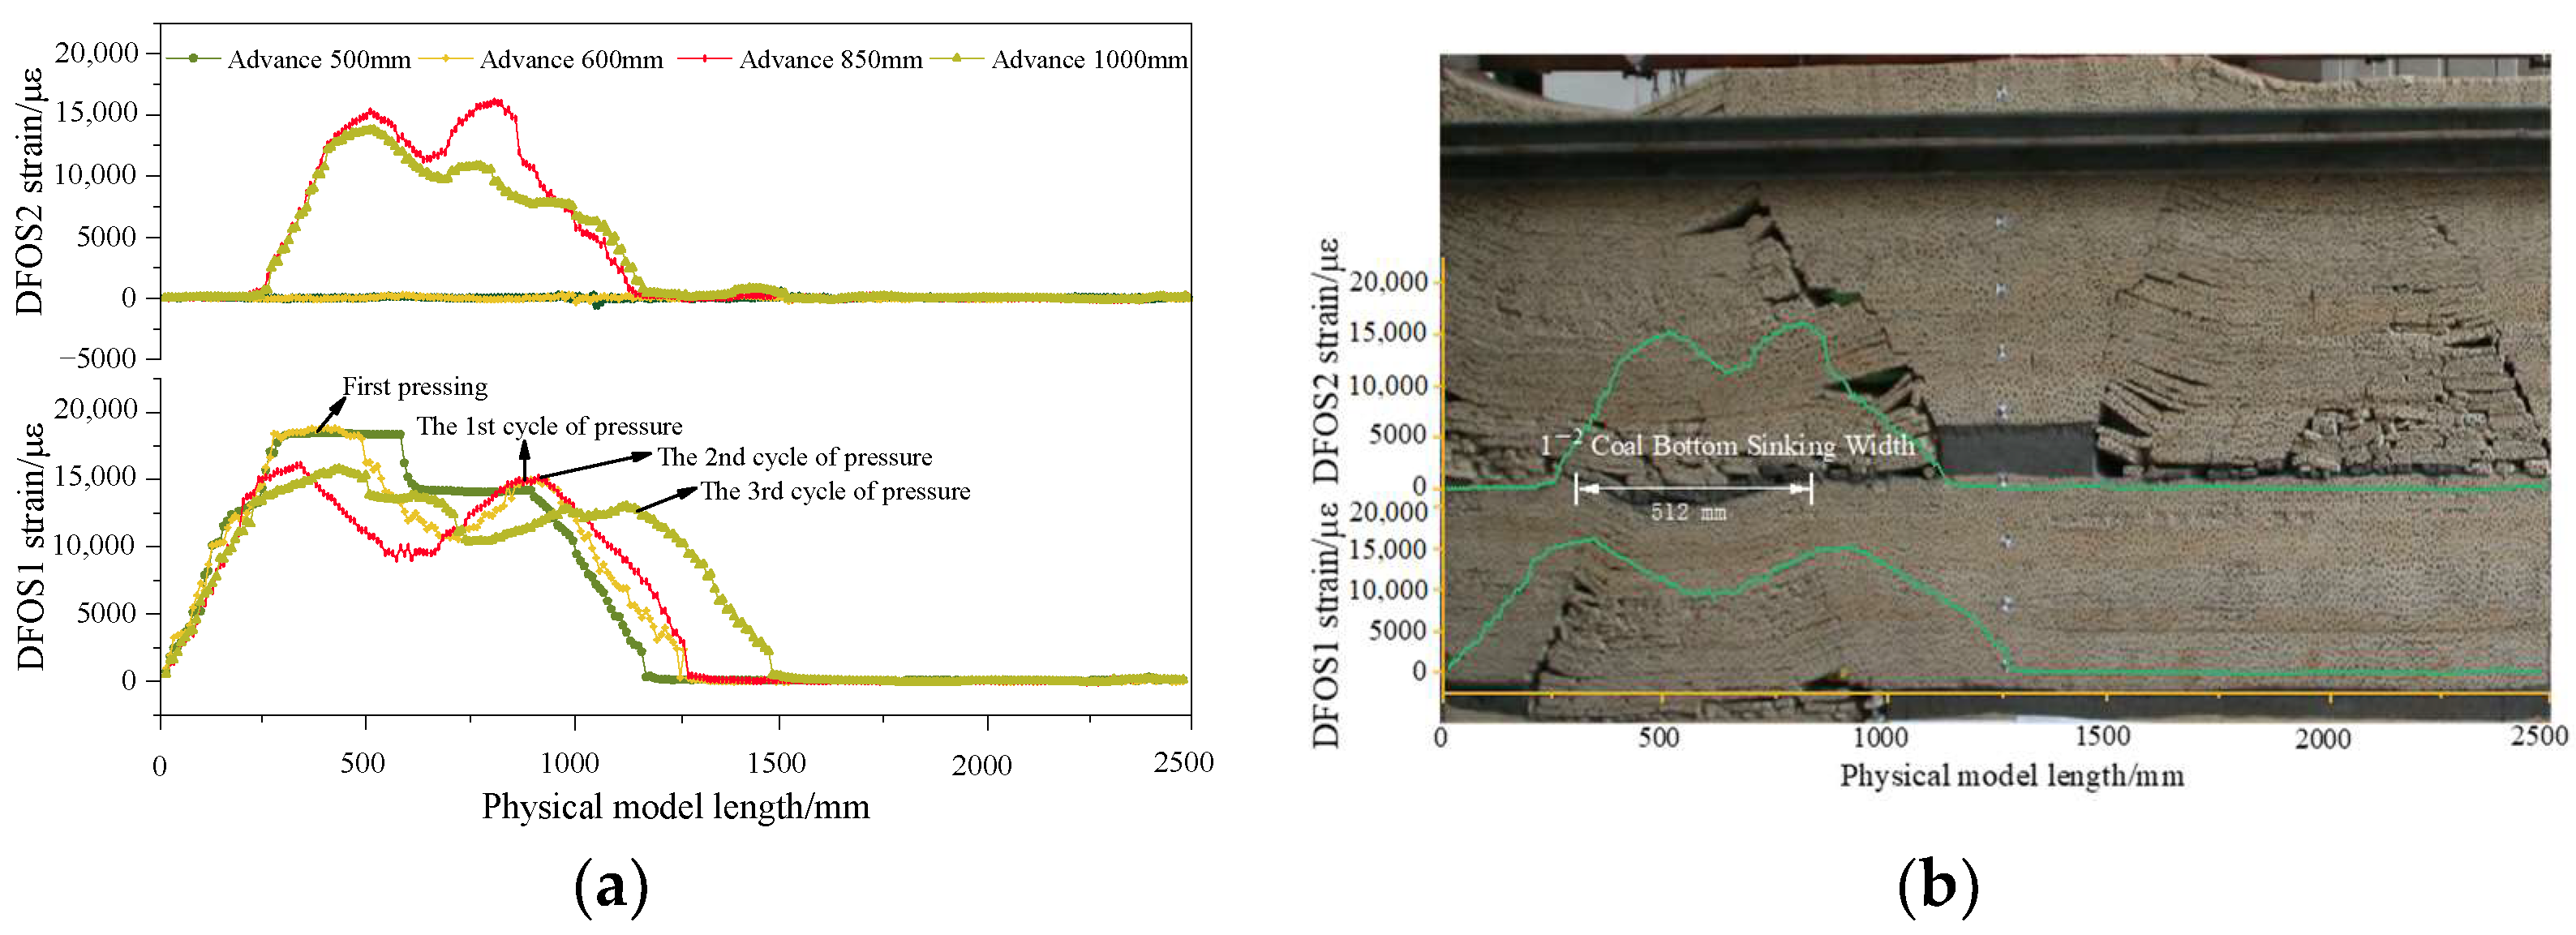
- The horizontally distributed optical fiber characterization of working face pressure is proposed. The peak of fiber optic tensile strain is a manifestation of crack development after horizontal rock fracture, and the peak value of tensile strain increases with the increase in mining-induced crack opening. The strain pattern of the horizontal optical fiber is unimodal when initially placed on the working face and transitions from unimodal to bimodal during periodic pressure. Simultaneously, the peak point of the fiber on one side of the working face advances in the direction of the old top breaking.
- (3)
- The strain curve of fiber Bragg grating can characterize the stress state of overlying rock. During the mining process of the working face passing through the remaining coal pillar, the variation pattern of the fiber optic grating strain curve remains consistent, undergoing stages of original rock stress, advanced support pressure influence, tensile fracture, continuous compression, and stable compression. The accuracy of the fiber optic grating characterization method is verified by comparing it to the monitoring curve of the coal seam floor pressure sensor.
- (4)
- The influence of the remaining coal pillar on the advanced support pressure of the working face is examined. The advanced support pressure value and its influence range continue to increase when the mining face passes through the remaining coal pillar. The advanced support pressure value and its influence range increase, registering 4.8 times and 3.6 times higher than before passing through the remaining coal pillar. The stress concentration rises after passing through the remaining coal pillar on the working face. Further verification of the conclusions of the physical model experiment is necessary combined with engineering experiments.
Author Contributions
Funding
Institutional Review Board Statement
Informed Consent Statement
Data Availability Statement
Conflicts of Interest
References
- Ghabraie, B.; Ren, G.; Smith, J.V. Characterising the multi-seam subsidence due to varying mining configuration: Insights from physical modelling. Int. J. Rock Mech. Min. Sci. 2017, 93, 269–279. [Google Scholar] [CrossRef]
- Tian, Q.; Zhang, J.; Zhang, Y. Similar simulation experiment of expressway tunnel in karst area. Constr. Build. Mater. 2018, 176, 1–13. [Google Scholar] [CrossRef]
- Floris, I.; Adam, J.M.; Calderón, P.A.; Sales, S. Fiber optic shape sensors: A comprehensive review. Opt. Lasers Eng. 2021, 139, 106508. [Google Scholar] [CrossRef]
- Udd, E.; Theriault, J.P.; Markus, A.; Bar-Cohen, Y. Microbending fiber optic sensors for smart structures. In Proceedings of the SPIE, Fiber Optic Smart Structures and Skins II, Boston, MA, USA, 5–7 September 1989; Volume 1170, pp. 478–482. [Google Scholar] [CrossRef]
- Wanser, K.; Voss, K. Crack detection using multimode fiber optical time domain reflectometry. In Proceedings of the SPIE, Distributed and Multiplexed Fiber Optic Sensors IV, San Diego, CA, USA, 24–29 July 1994; Volume 2294, pp. 43–52. [Google Scholar] [CrossRef]
- Chai, J.; Wei, S.; Chang, X.; Li, Y. Distributed Optical Fiber Sensor For Monitoring Rock Deformation. Chin. J. Rock Mech. Eng. 2004, 23, 4068. [Google Scholar] [CrossRef]
- Chai, J.; Du, W. Dynamic evolution law analysis of overburden separation and water flowing fracture under mining based on distributed optical fiber and information entropy theory. Opt. Fiber Technol. 2023, 80, 103408. [Google Scholar] [CrossRef]
- Chai, J.; Du, W. Experimental Study on the Application of BOTDA in the Overlying rock Deformation Monitoring Induced by Coal Mining. J. Sens. 2019, 2019, 3439723. [Google Scholar] [CrossRef]
- Juraszek, J.; Gwóźdź-Lasoń, M.; Logoń, D. FBG Strain Monitoring of a Road Structure Reinforced with a Geosynthetic Mattress in Cases of Subsoil Deformation in Mining Activity Areas. Materials 2021, 14, 1709. [Google Scholar] [CrossRef] [PubMed]
- Piao, C.; Wang, D.; Kang, H.; He, H.; Zhao, C.; Liu, W. Model test study on overburden settlement law in coal seam backfill mining based on fiber Bragg grating technology. Arab. J. Geosci. 2019, 12, 401. [Google Scholar] [CrossRef]
- Zhang, D.; Wang, J.; Zhang, P.; Shi, B. Internal strain monitoring for coal mining similarity model based on distributed fiber optical sensing. Measurement 2017, 97, 234–241. [Google Scholar] [CrossRef]
- Liu, Q.; Niu, J.; Li, Q.; Zhao, J.; Zi, J. Deformation zoning characterization of mining rock mass based on partition coupling optical fiber sensing. J. China Coal Soc. 2024, 49, 1345–1357. [Google Scholar] [CrossRef]
- Zhang, D.; Huang, Z.; Ma, Z.; Yang, J.; Chai, J. Research on similarity simulation experiment of mine pressure appearance in surface gully working face based on BOTDA. Sensors 2023, 22, 9063. [Google Scholar] [CrossRef] [PubMed]
- Hu, T.; Han, K.; Song, C.; Che, J.; Li, B.; Huo, T.; Hu, T. Development Law of Water-Conducting Fracture Zones in Overburden above Fully Mechanized Top-Coal Caving Face: A Comprehensive Study. Processes 2024, 12, 2076. [Google Scholar] [CrossRef]
- Morozov, O.; Tunakova, Y.; Hussein, S.M.R.H.; Shagidullin, A.; Agliullin, T.; Kuznetsov, A.; Valeev, B.; Lipatnikov, K.; Anfinogentov, V.; Sakhabutdinov, A. Addressed Combined Fiber-Optic Sensors as Key Element of Multisensor Greenhouse Gas Monitoring Systems. Sensors 2022, 22, 4827. [Google Scholar] [CrossRef] [PubMed]
- Konstantinov, Y.; Krivosheev, A.; Barkov, F. An Image Processing-Based Correlation Method for Improving the Characteristics of Brillouin Frequency Shift Extraction in Distributed Fiber Optic Sensors. Algorithms 2024, 17, 365. [Google Scholar] [CrossRef]
- Jinachandran, S.; Rajan, G. Fibre Bragg grating based acoustic emission measurement system for structural health monitoring applications. Materials 2021, 14, 897. [Google Scholar] [CrossRef]
- Kwon, I.; Baik, S.; Im, K.; Yu, J. Development of fiber optic BOTDA sensor for intrusion detection. Sens. Actuators A Phys. 2002, 101, 77–84. [Google Scholar] [CrossRef]
- Wang, B.; Li, K.; Shi, B.; Wei, G. Test on application of distributed fiber optic sensing technique into soil slope monitoring. Landslides 2009, 6, 61–68. [Google Scholar] [CrossRef]
- Iten, M.; Puzrin, A. BOTDA road-embedded strain sensing system for landslide boundary localization. In Proceedings of the SPIE, Smart Sensor Phenomena, Technology, Networks, and Systems, San Diego, CA, USA, 8–12 March 2009; Volume 7293, p. 729316. [Google Scholar] [CrossRef]
- Bao, X.; Dhliwayo, J.; Heron, N.; Webb, D.; Jackson, D. Experimental and theoretical studies on a distributed temperature sensor based on Brillouin scattering. J. Light. Technol. 1995, 13, 1340–1348. [Google Scholar] [CrossRef]
- Chai, J. Study on large scale stereo scopic simulation for shallow seam mining. J. China Coal Soc. 1998, 23, 392–395. [Google Scholar] [CrossRef]


| Lithology of Simulated Stratum | Accumulated Thickness (mm) | Mass Ratio (River Sand: Binding Material) | Mass Ratio (Gypsum: Mica Powder) | Sand Mass (kg) | Binding Material Mass | |
|---|---|---|---|---|---|---|
| Gypsum Mass (kg) | Mica Powder Mass (kg) | |||||
| Loess | 58 | 9:1 | 2:8 | 13.00 | 0.29 | 1.16 |
| Medium-grained Sandstone | 246 | 8:1 | 2:8 | 69.00 | 1.73 | 6.90 |
| Siltstone | 418 | 7:1 | 2:8 | 123.60 | 3.53 | 14.13 |
| Fine-grained Sandstone | 203 | 8:1 | 3:7 | 70.80 | 2.66 | 6.20 |
| Coarse-grained Sandstone | 19 | 7:1 | 2:8 | 16.00 | 0.46 | 1.83 |
| Mudstone | 44 | 9:1 | 2:8 | 18.00 | 0.40 | 1.60 |
| Working Face Pressure | Advancing Distance (mm) | Pressure Step Distance (mm) | Collapse Height (mm) | Collapse Angle (°) |
|---|---|---|---|---|
| Initial pressure | 500 | 500 | 157 | 49 |
| The 1st cycle to pressure | 650 | 150 | 168 | 61 |
| The 2nd cycle to pressure | 850 | 200 | 296 | 56 |
| The 3rd cycle to pressure | 1000 | 150 | 296 | 54 |
| The 4th cycle to pressure | 1100 | 100 | 296 | 69 |
| The 5th cycle to pressure | 1250 | 150 | 296 | 52 |
| The 6th cycle to pressure | 1350 | 150 | 296 | 51 |
| The 7th cycle to pressure | 1450 | 150 | 296 | 75 |
| The 8th cycle to pressure | 1650 | 200 | 296 | 51 |
| The 9th cycle to pressure | 1800 | 150 | 296 | 58 |
| The 10th cycle to pressure | 2000 | 200 | 296 | 60 |
| The 11th cycle to pressure | 2200 | 200 | 296 | 68 |
| The 12th cycle to pressure | 2300 | 100 | 296 | 63 |
Disclaimer/Publisher’s Note: The statements, opinions and data contained in all publications are solely those of the individual author(s) and contributor(s) and not of MDPI and/or the editor(s). MDPI and/or the editor(s) disclaim responsibility for any injury to people or property resulting from any ideas, methods, instructions or products referred to in the content. |
© 2024 by the authors. Licensee MDPI, Basel, Switzerland. This article is an open access article distributed under the terms and conditions of the Creative Commons Attribution (CC BY) license (https://creativecommons.org/licenses/by/4.0/).
Share and Cite
Zhang, D.; Li, Z.; Duan, Y.; Yang, L.; Liu, H. FBG and BOTDA Based Monitoring of Mine Pressure Under Remaining Coal Pillars Using Physical Modeling. Sensors 2024, 24, 7037. https://doi.org/10.3390/s24217037
Zhang D, Li Z, Duan Y, Yang L, Liu H. FBG and BOTDA Based Monitoring of Mine Pressure Under Remaining Coal Pillars Using Physical Modeling. Sensors. 2024; 24(21):7037. https://doi.org/10.3390/s24217037
Chicago/Turabian StyleZhang, Dingding, Zhi Li, Yanyan Duan, Long Yang, and Hongrui Liu. 2024. "FBG and BOTDA Based Monitoring of Mine Pressure Under Remaining Coal Pillars Using Physical Modeling" Sensors 24, no. 21: 7037. https://doi.org/10.3390/s24217037
APA StyleZhang, D., Li, Z., Duan, Y., Yang, L., & Liu, H. (2024). FBG and BOTDA Based Monitoring of Mine Pressure Under Remaining Coal Pillars Using Physical Modeling. Sensors, 24(21), 7037. https://doi.org/10.3390/s24217037