


Analysis of Local Track Discontinuities and Defects in Railway Switches Based on Track-Side Accelerations


Abstract
1. Introduction
1.1. Impact Event Monitoring with Bogie or Axle Box Acceleration Data
1.2. Track-Side Acceleration Measurement Systems on Open Track
1.3. Track-Side Acceleration Measurement Systems Tailored to Switches and Crossings
1.4. Contributions
2. Materials and Methods
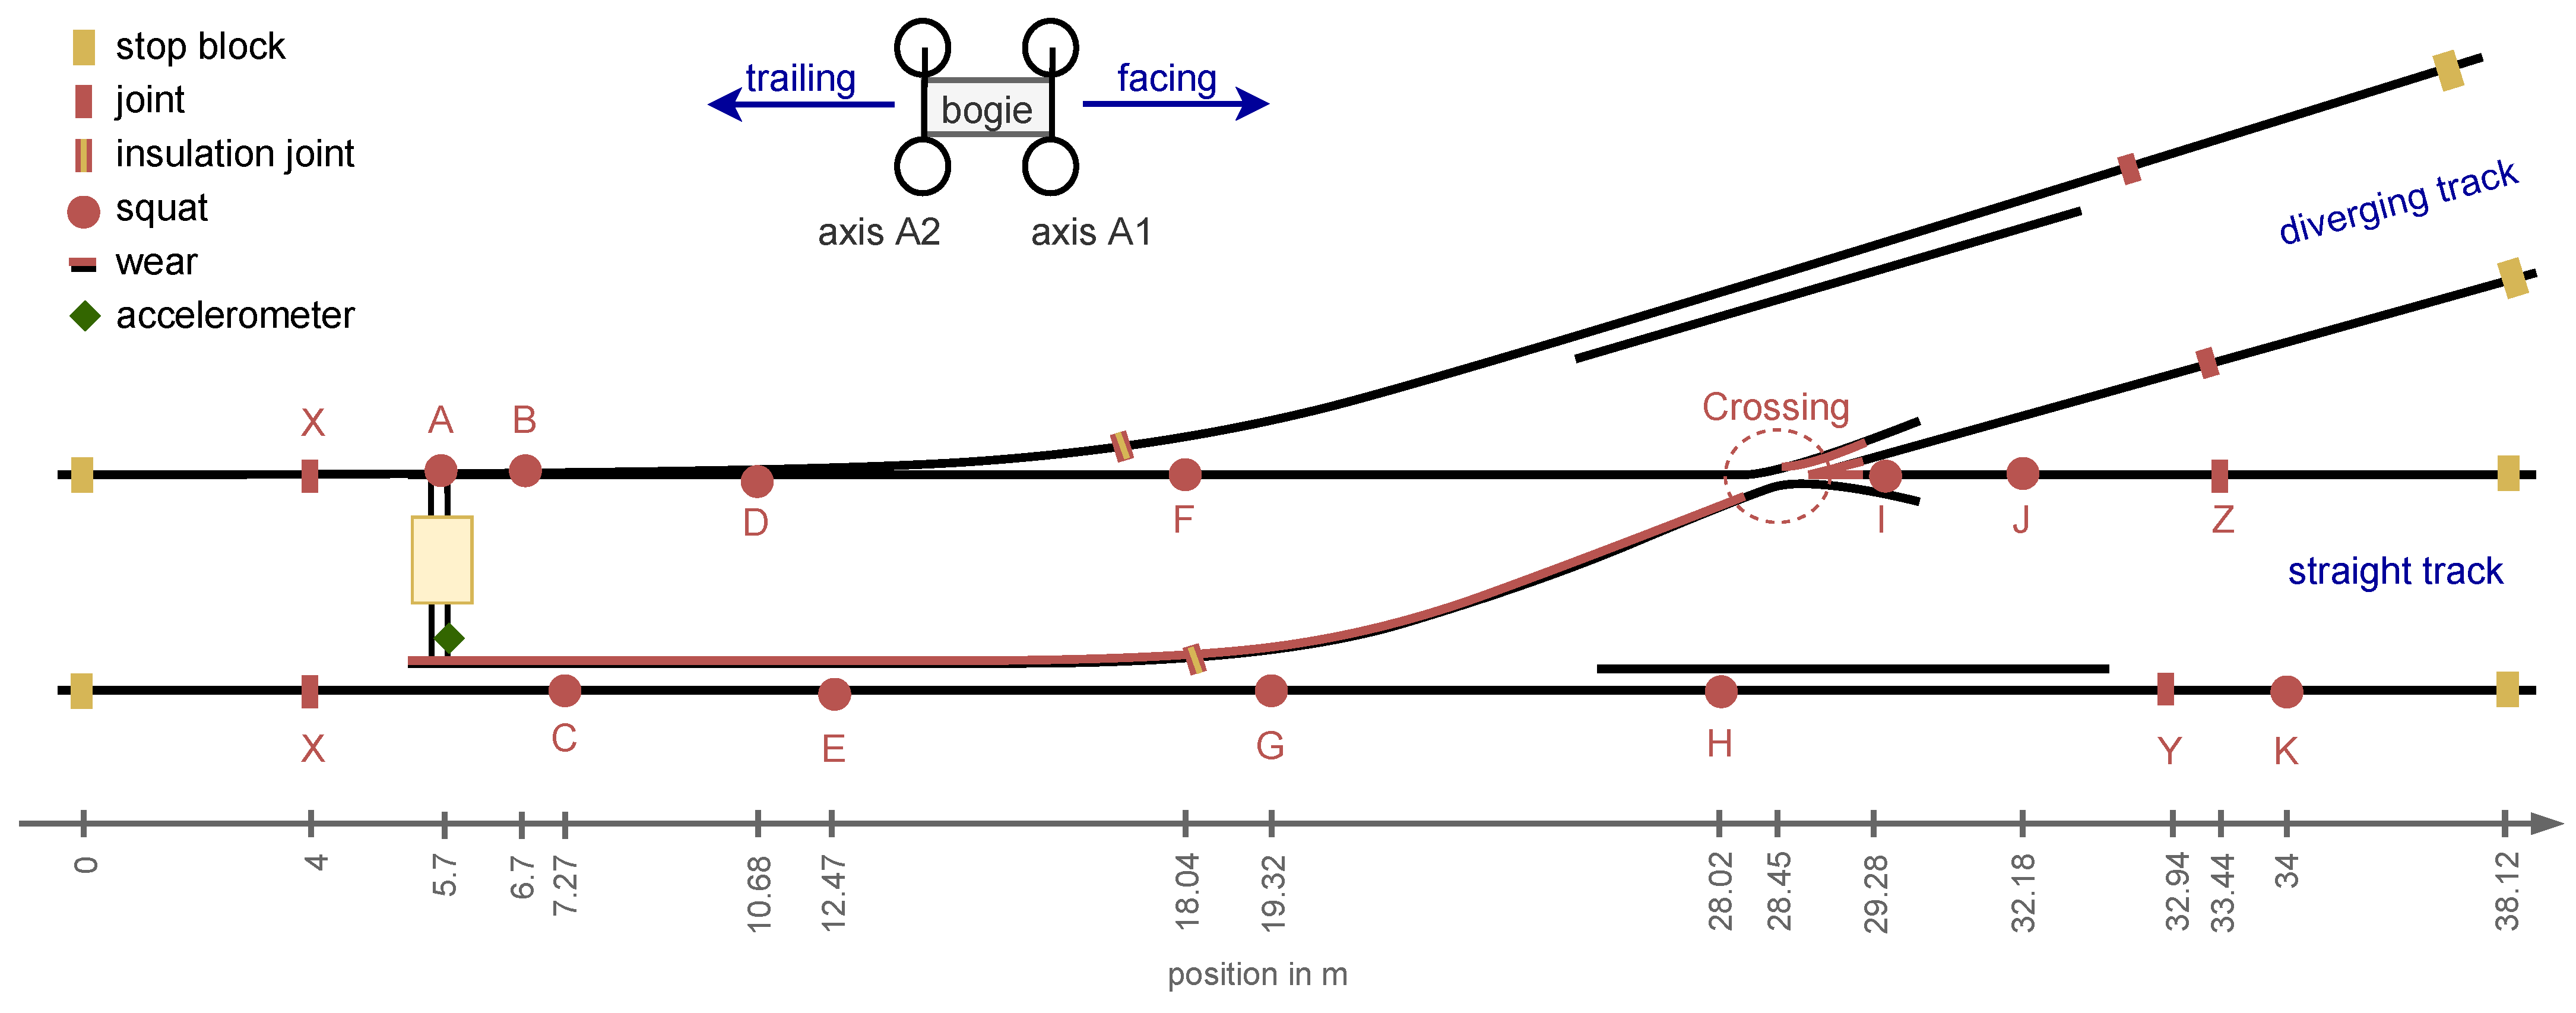
2.1. Experimental Setup
2.2. Measurement Data
- Detrend and demean signal.
- Apply Tukey window of length 2 s at the beginning and the end of the time series.
- Apply Butterworth bandpass filter (forward and backward) with filter frequencies 1 to 8000 Hz and filter order 2.
- Cut the signal down to where the bogie is moving from stop block to stop block. This also removes the areas affected by the Tukey window at the head and tail of the measurement.
- Down-sample by 2 to a sampling frequency of 25,600 Hz.
2.3. Methods
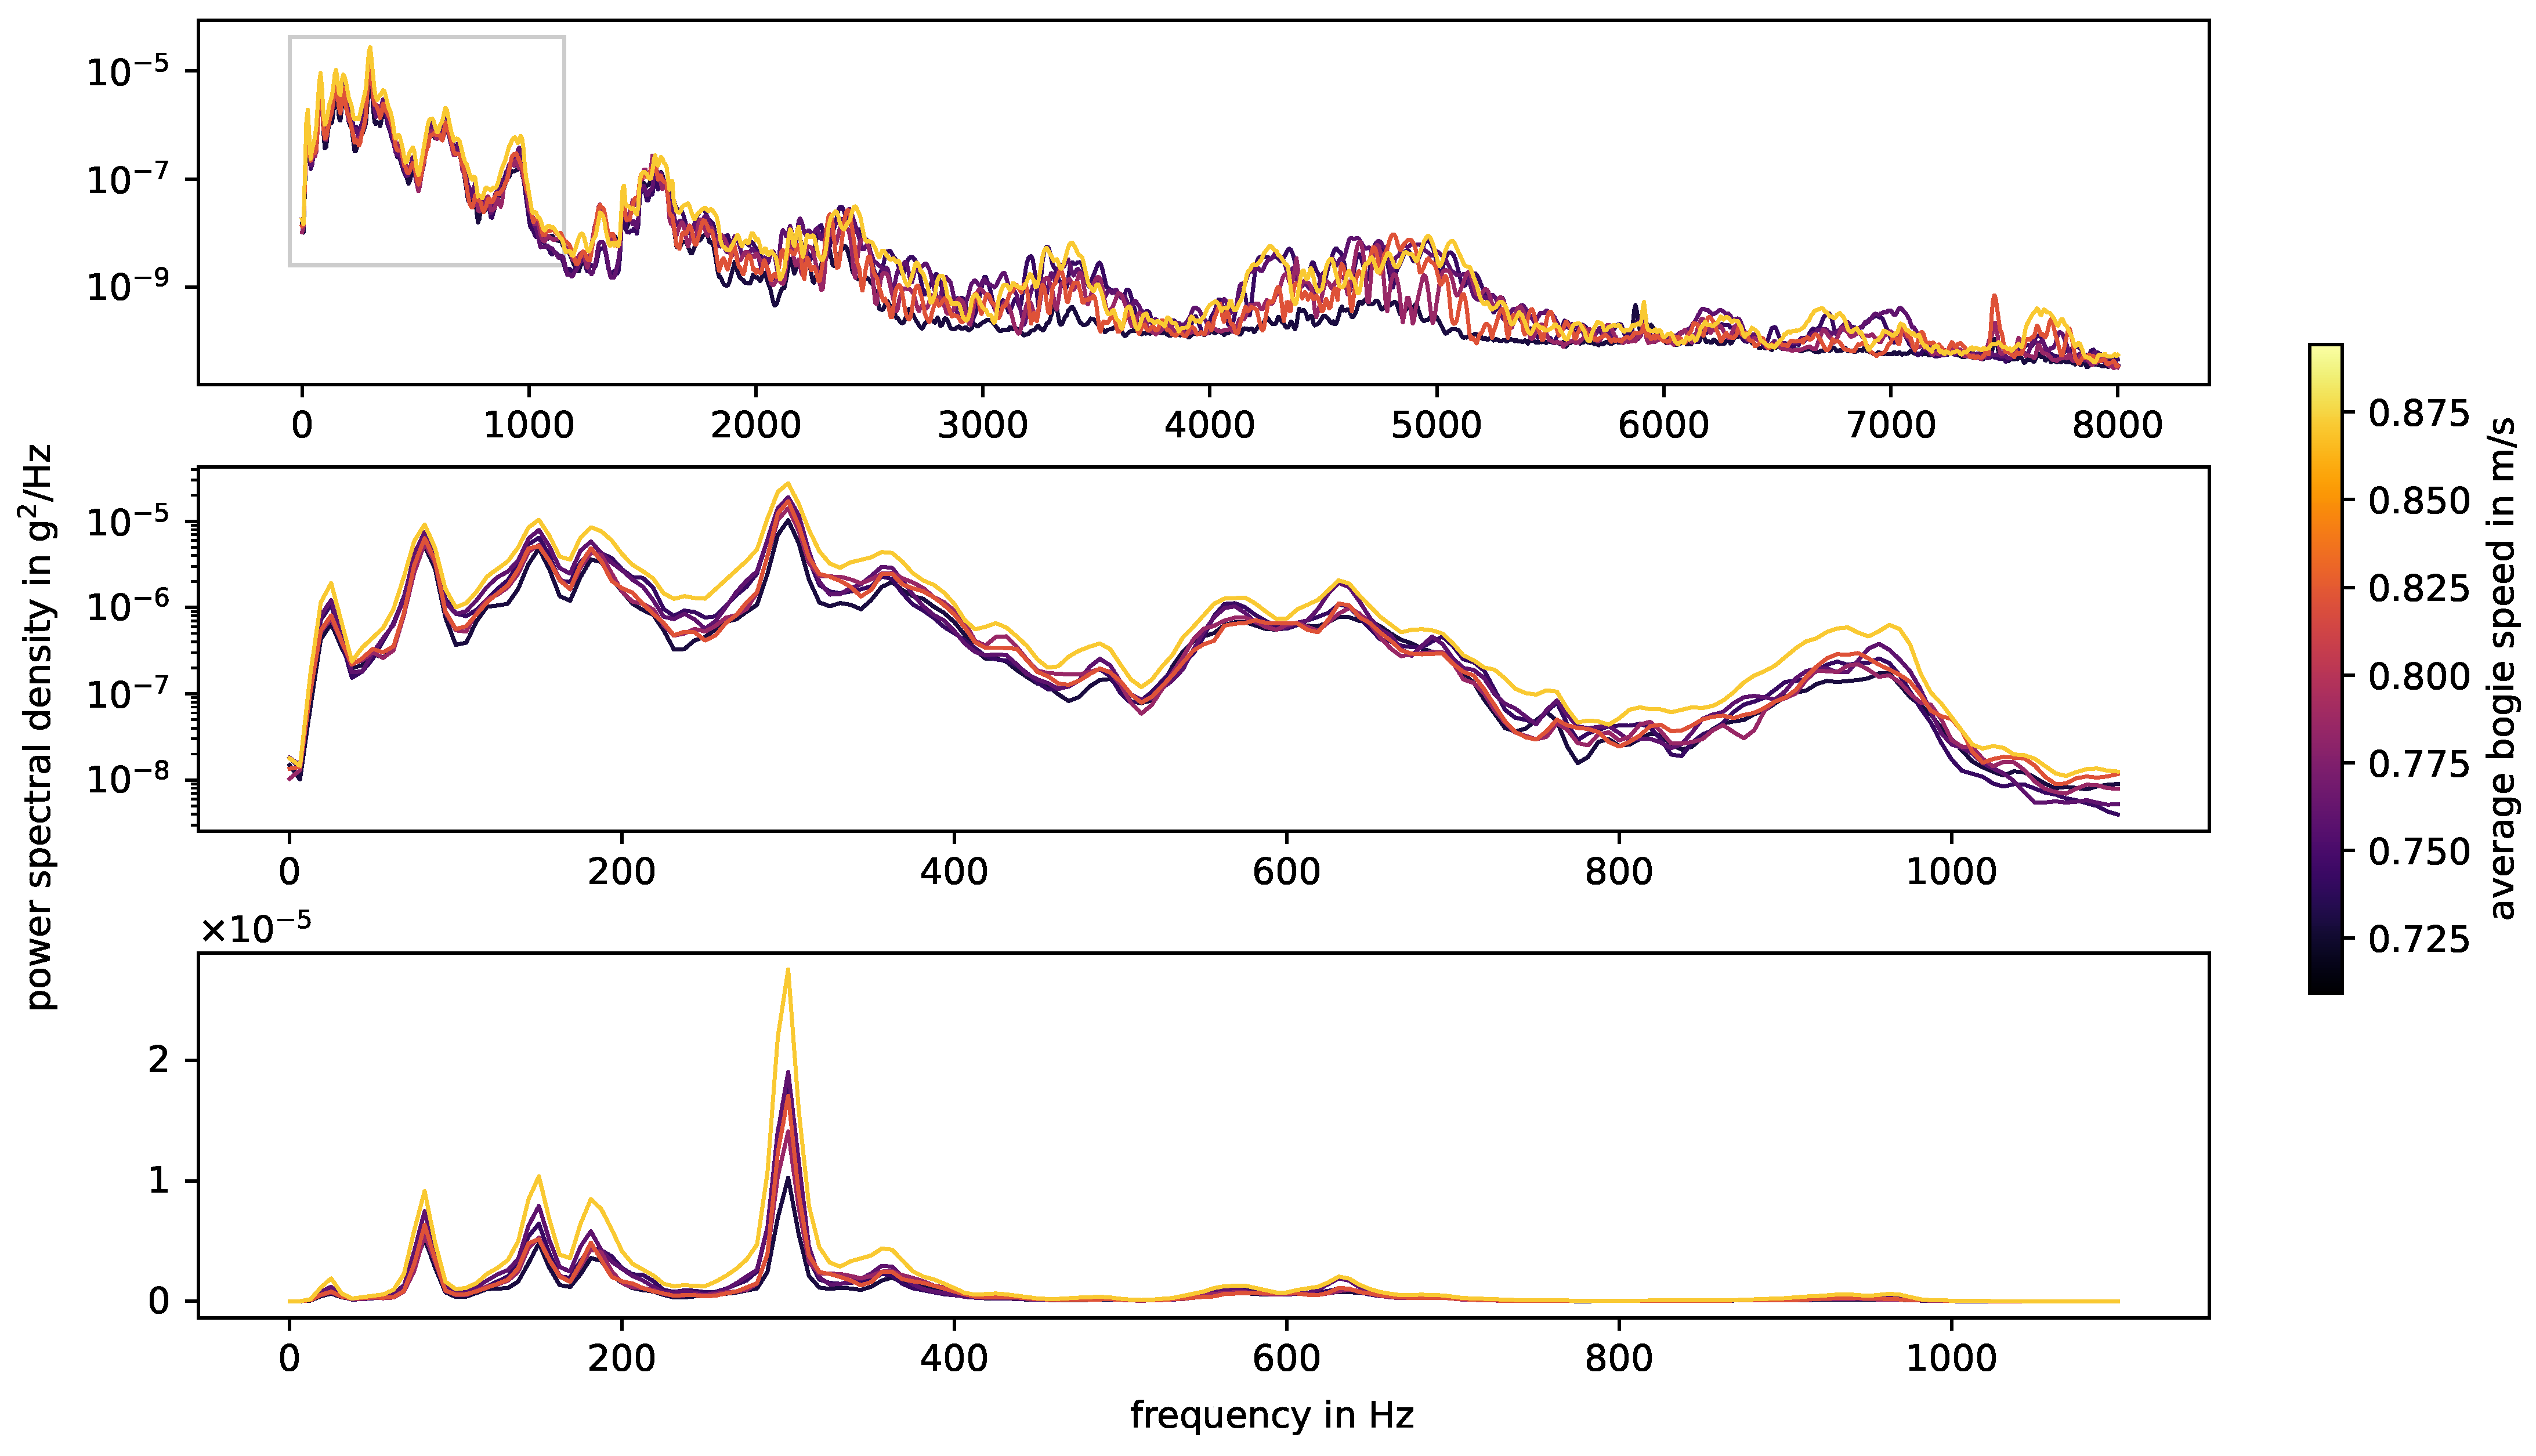
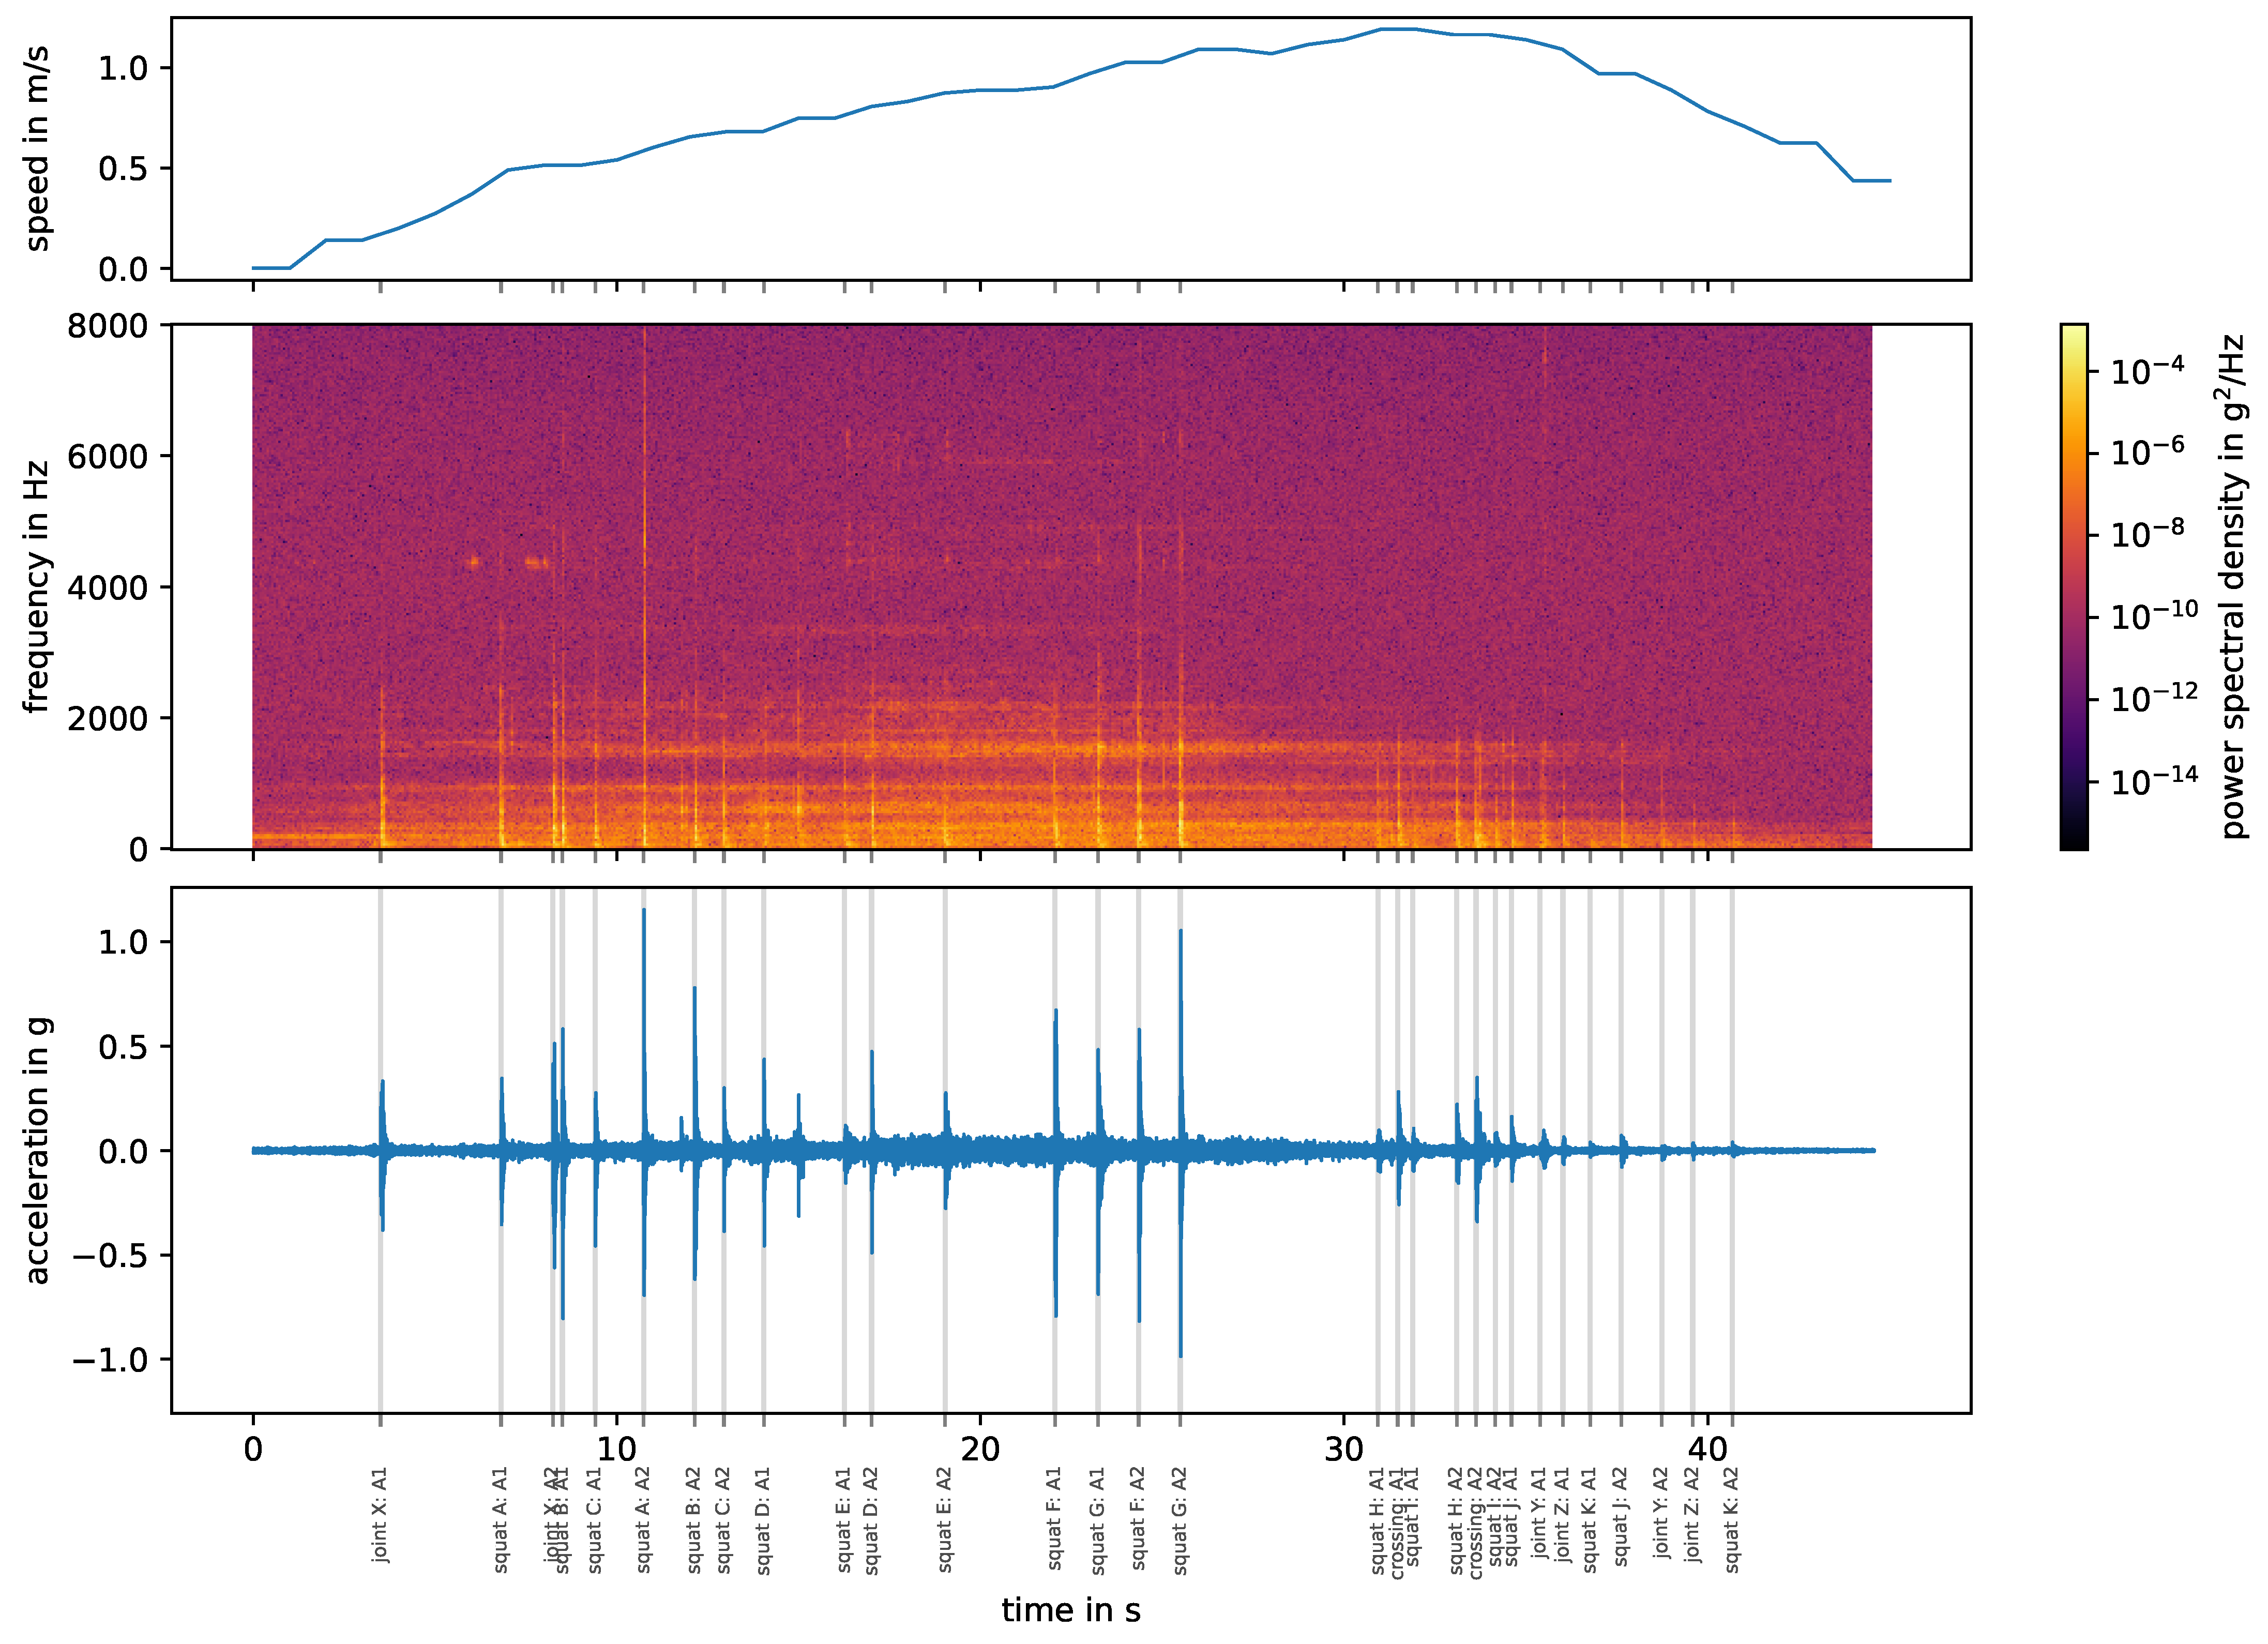
2.3.1. Frequency Analysis
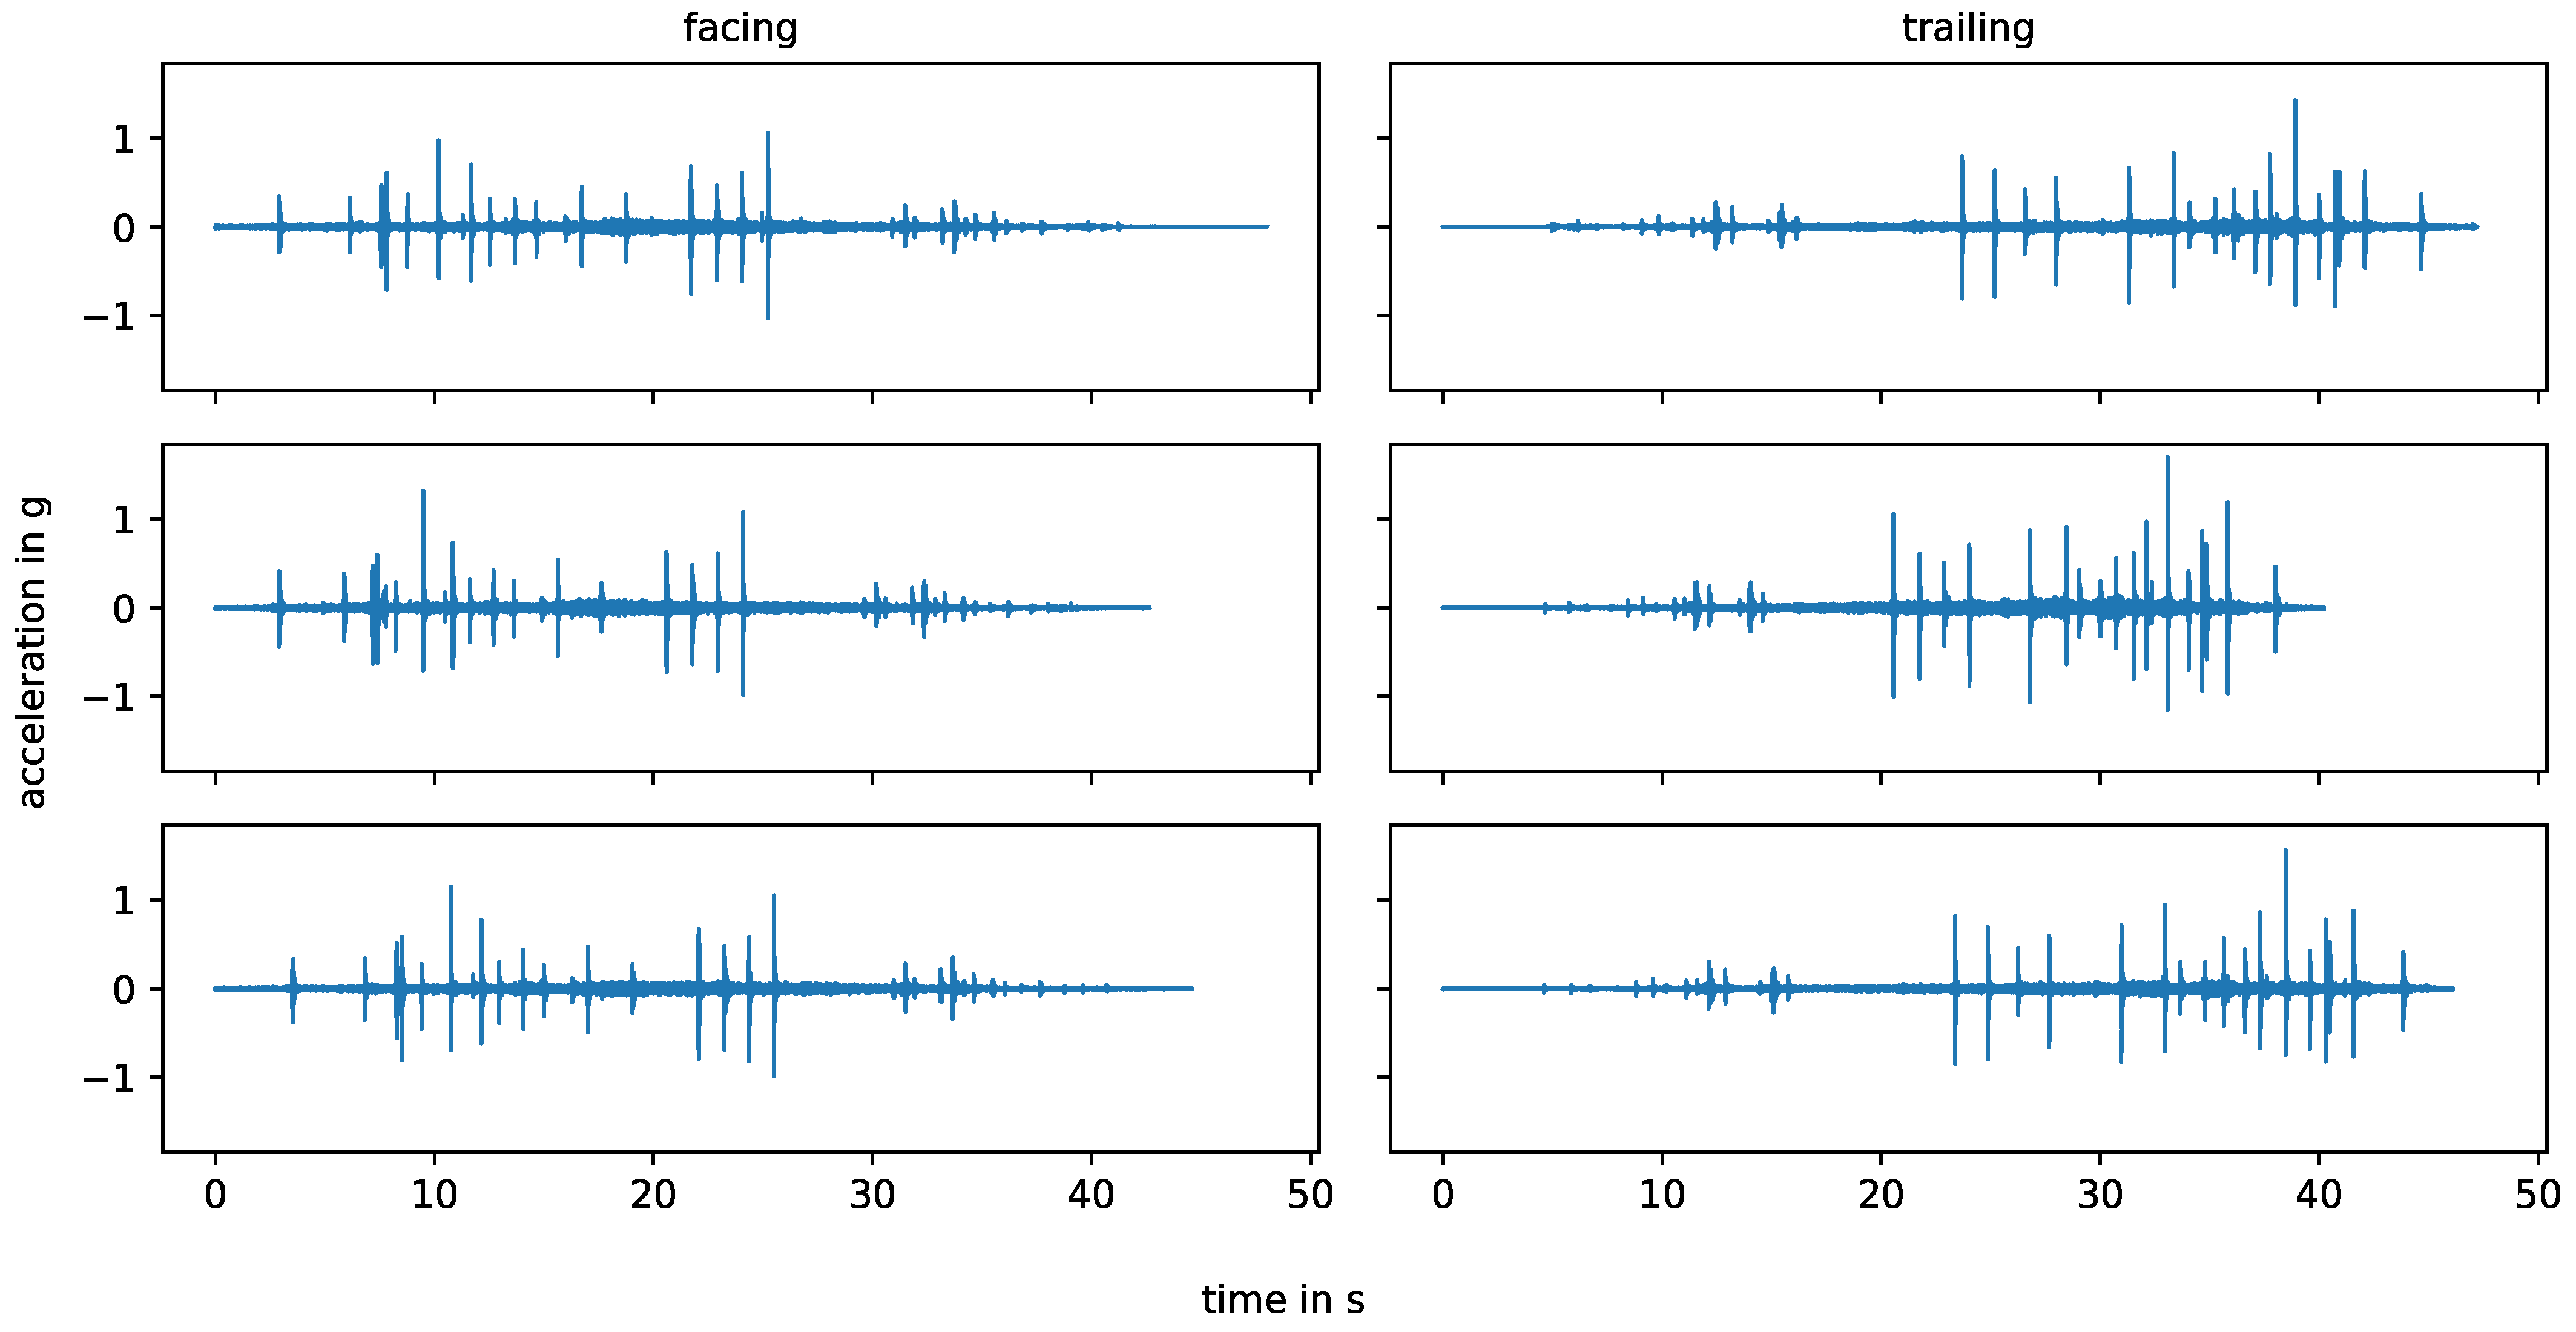
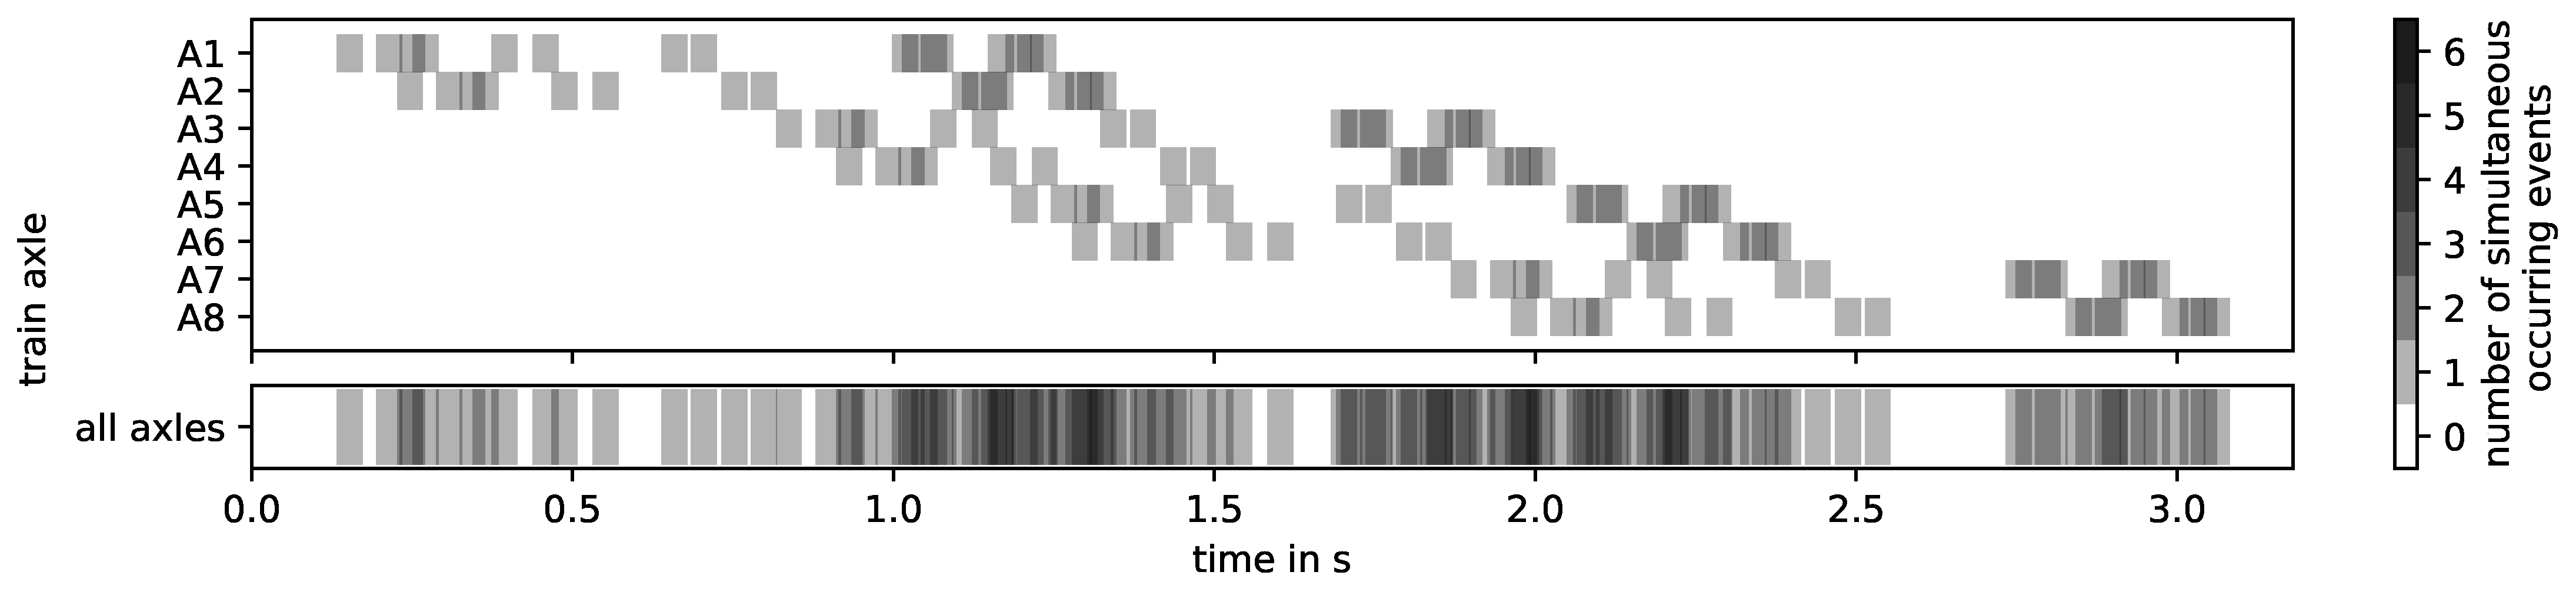
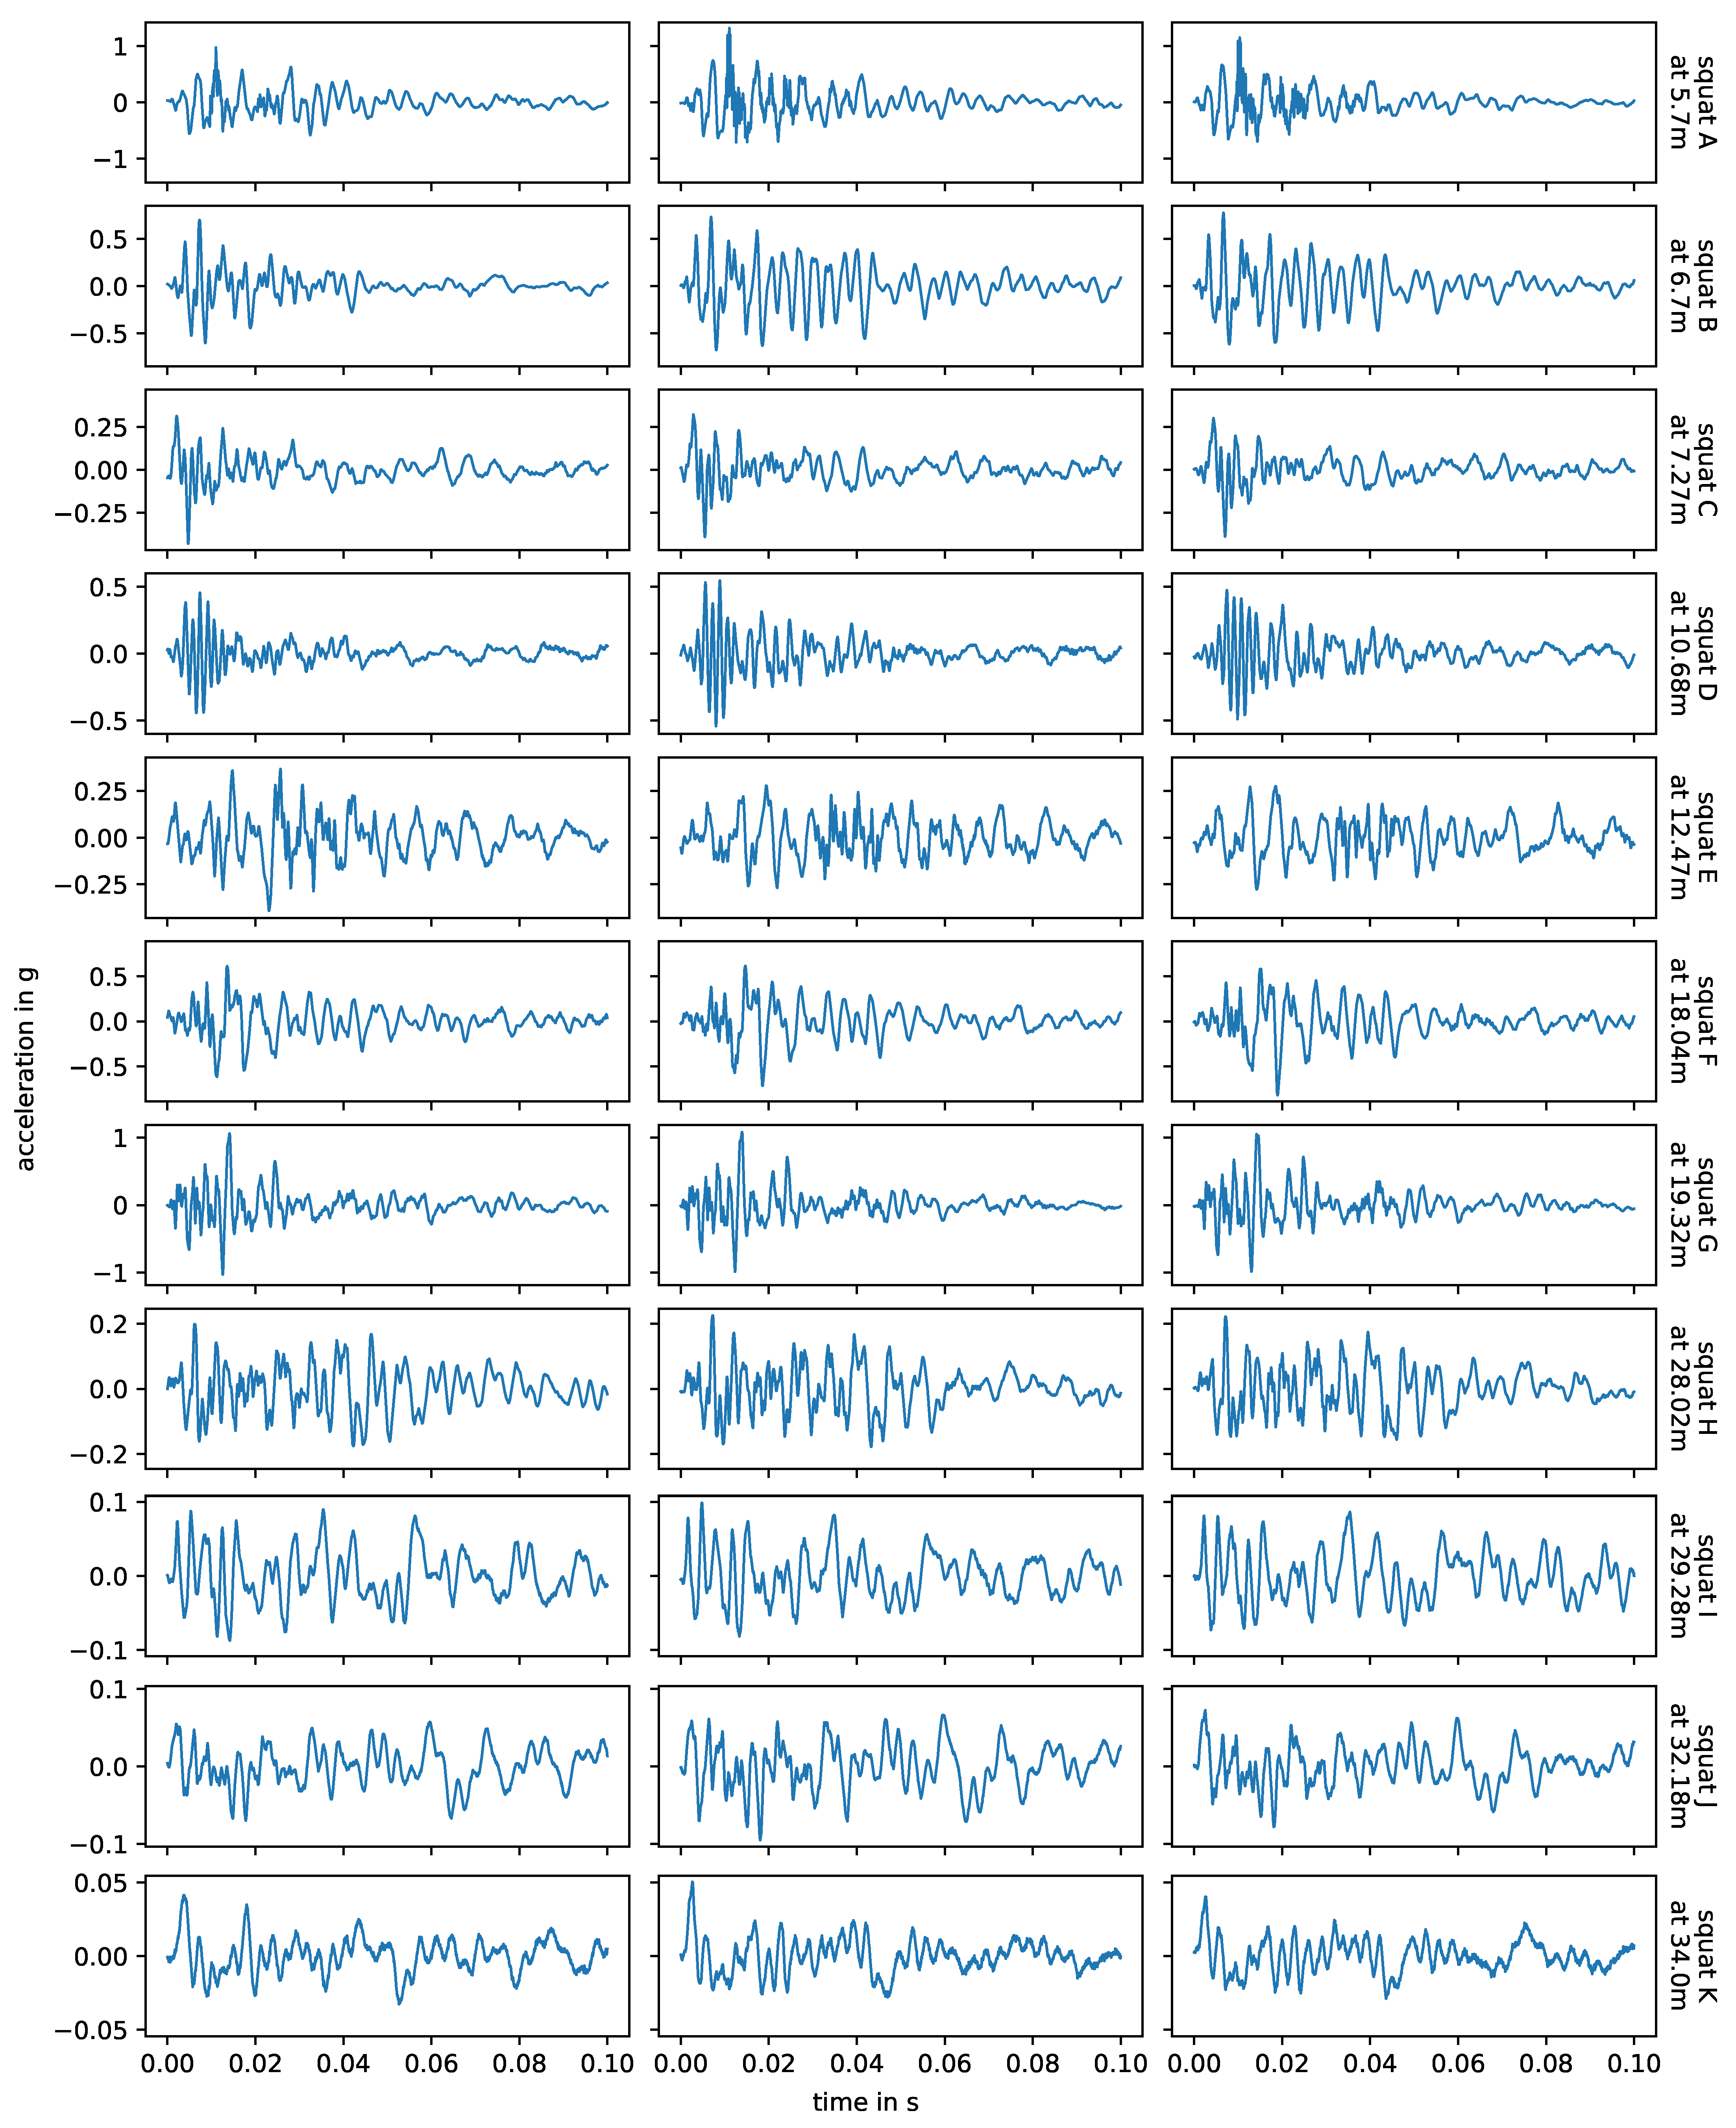
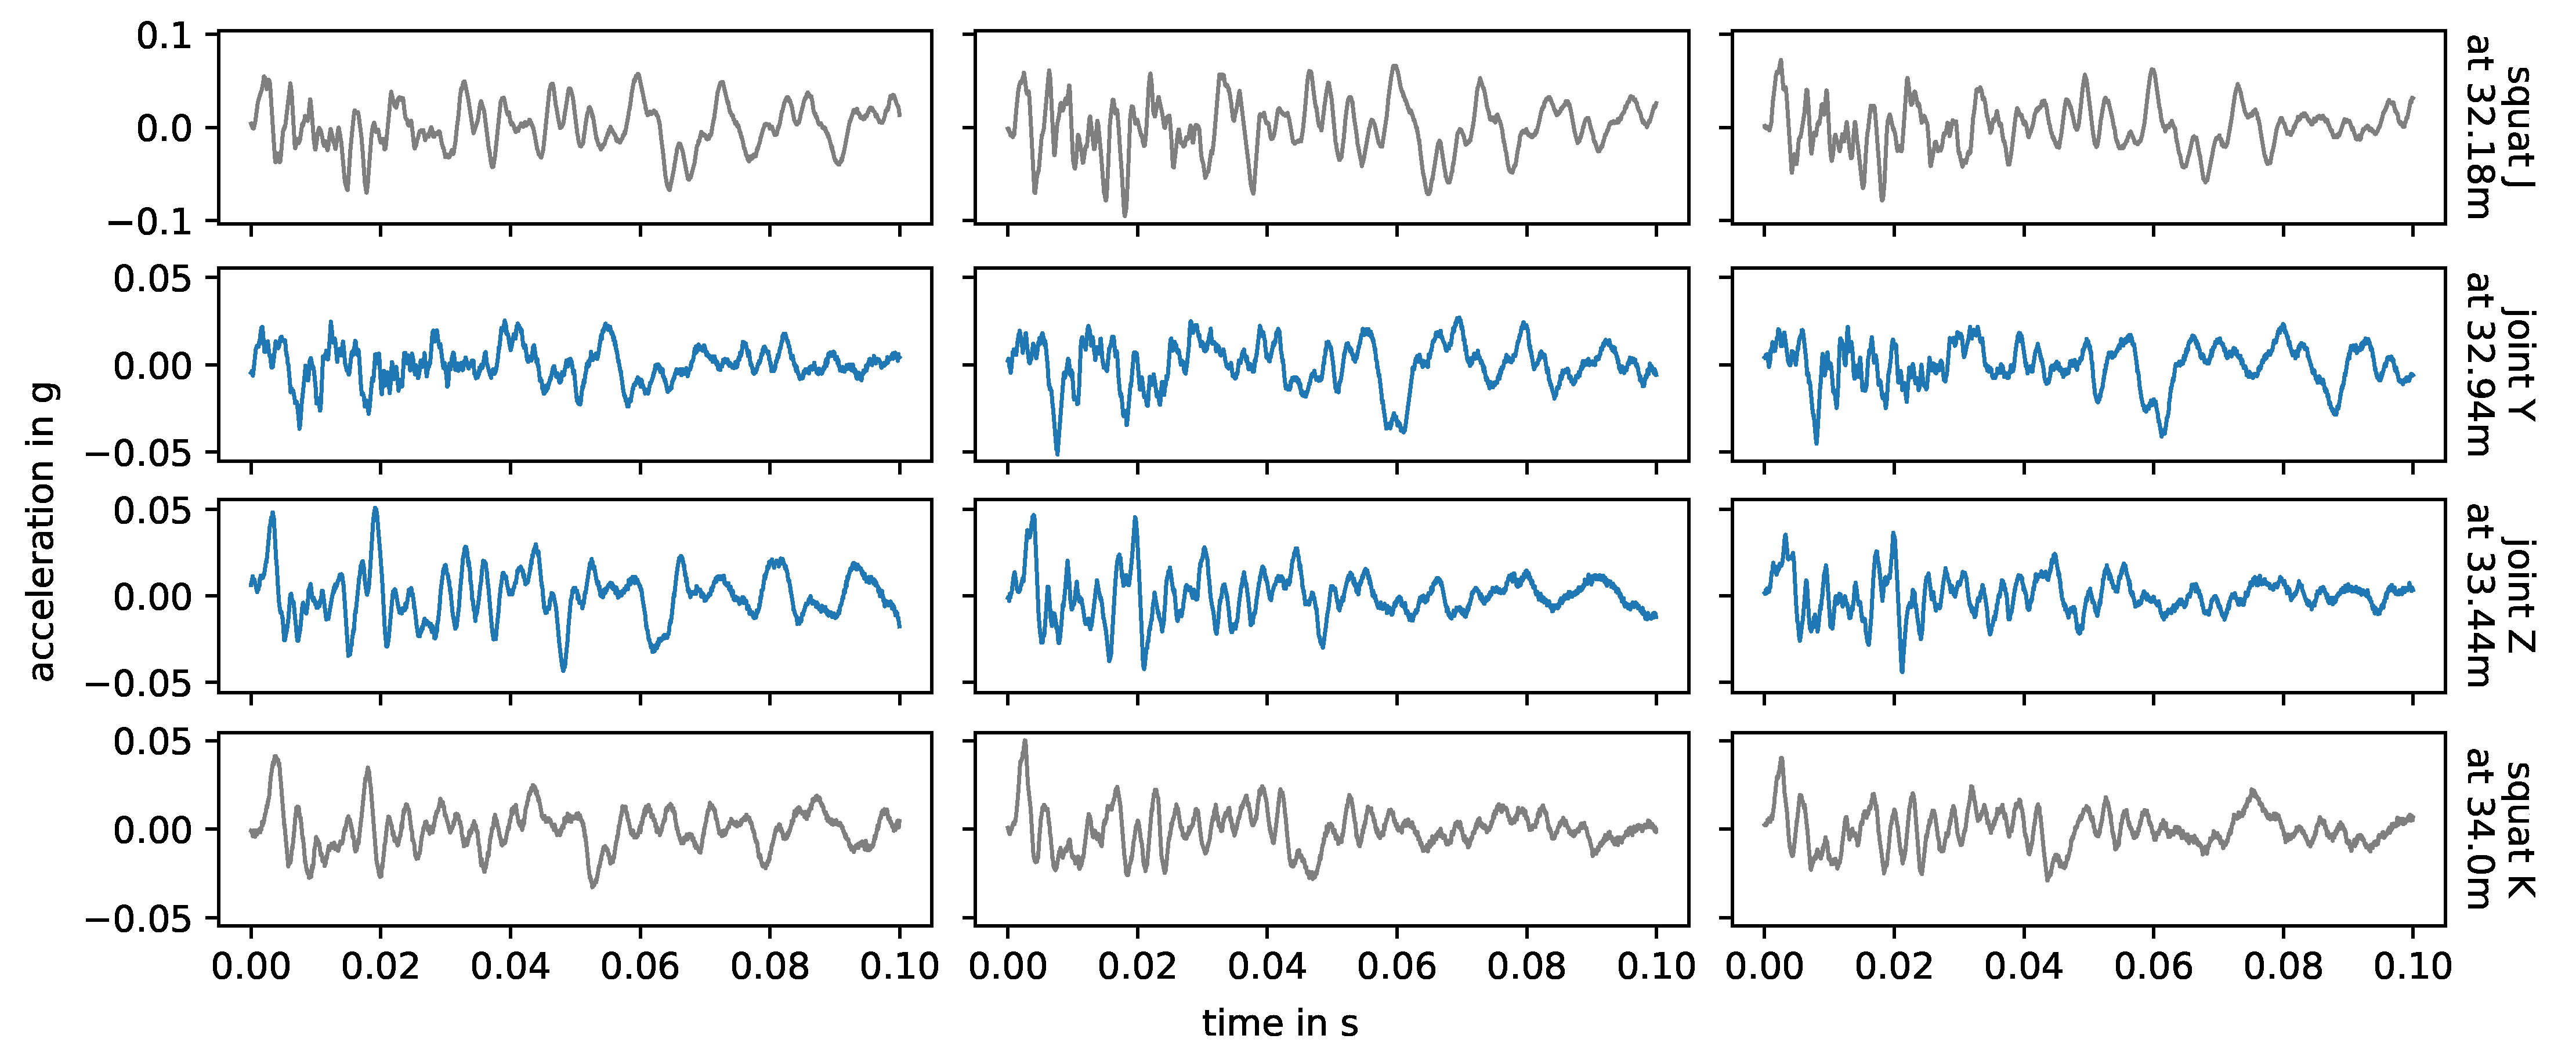
2.3.2. Waveform Analysis
3. Results and Discussions
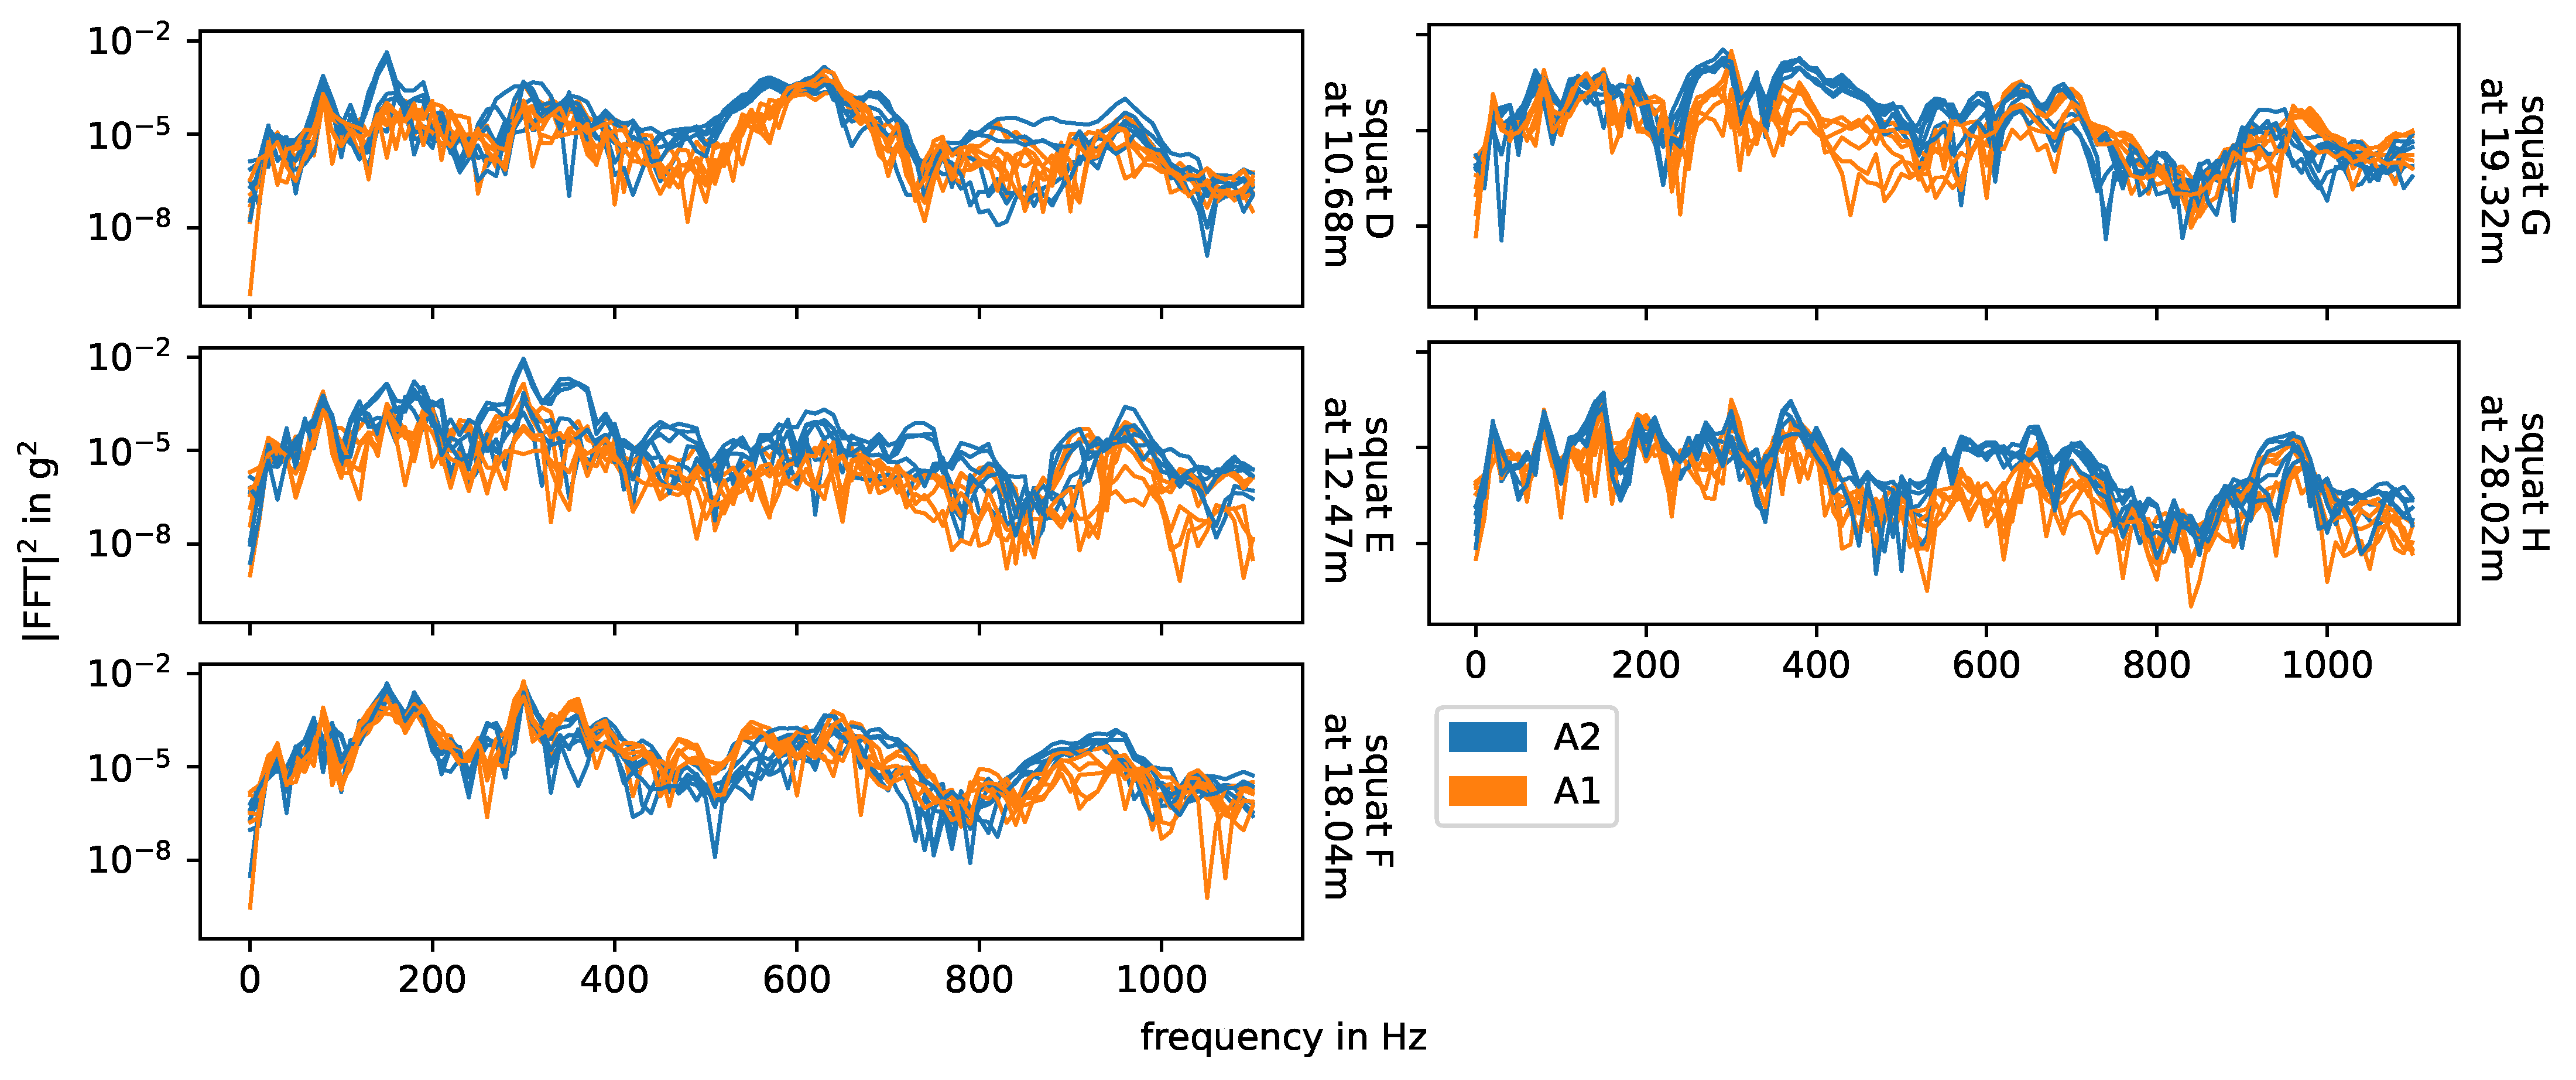
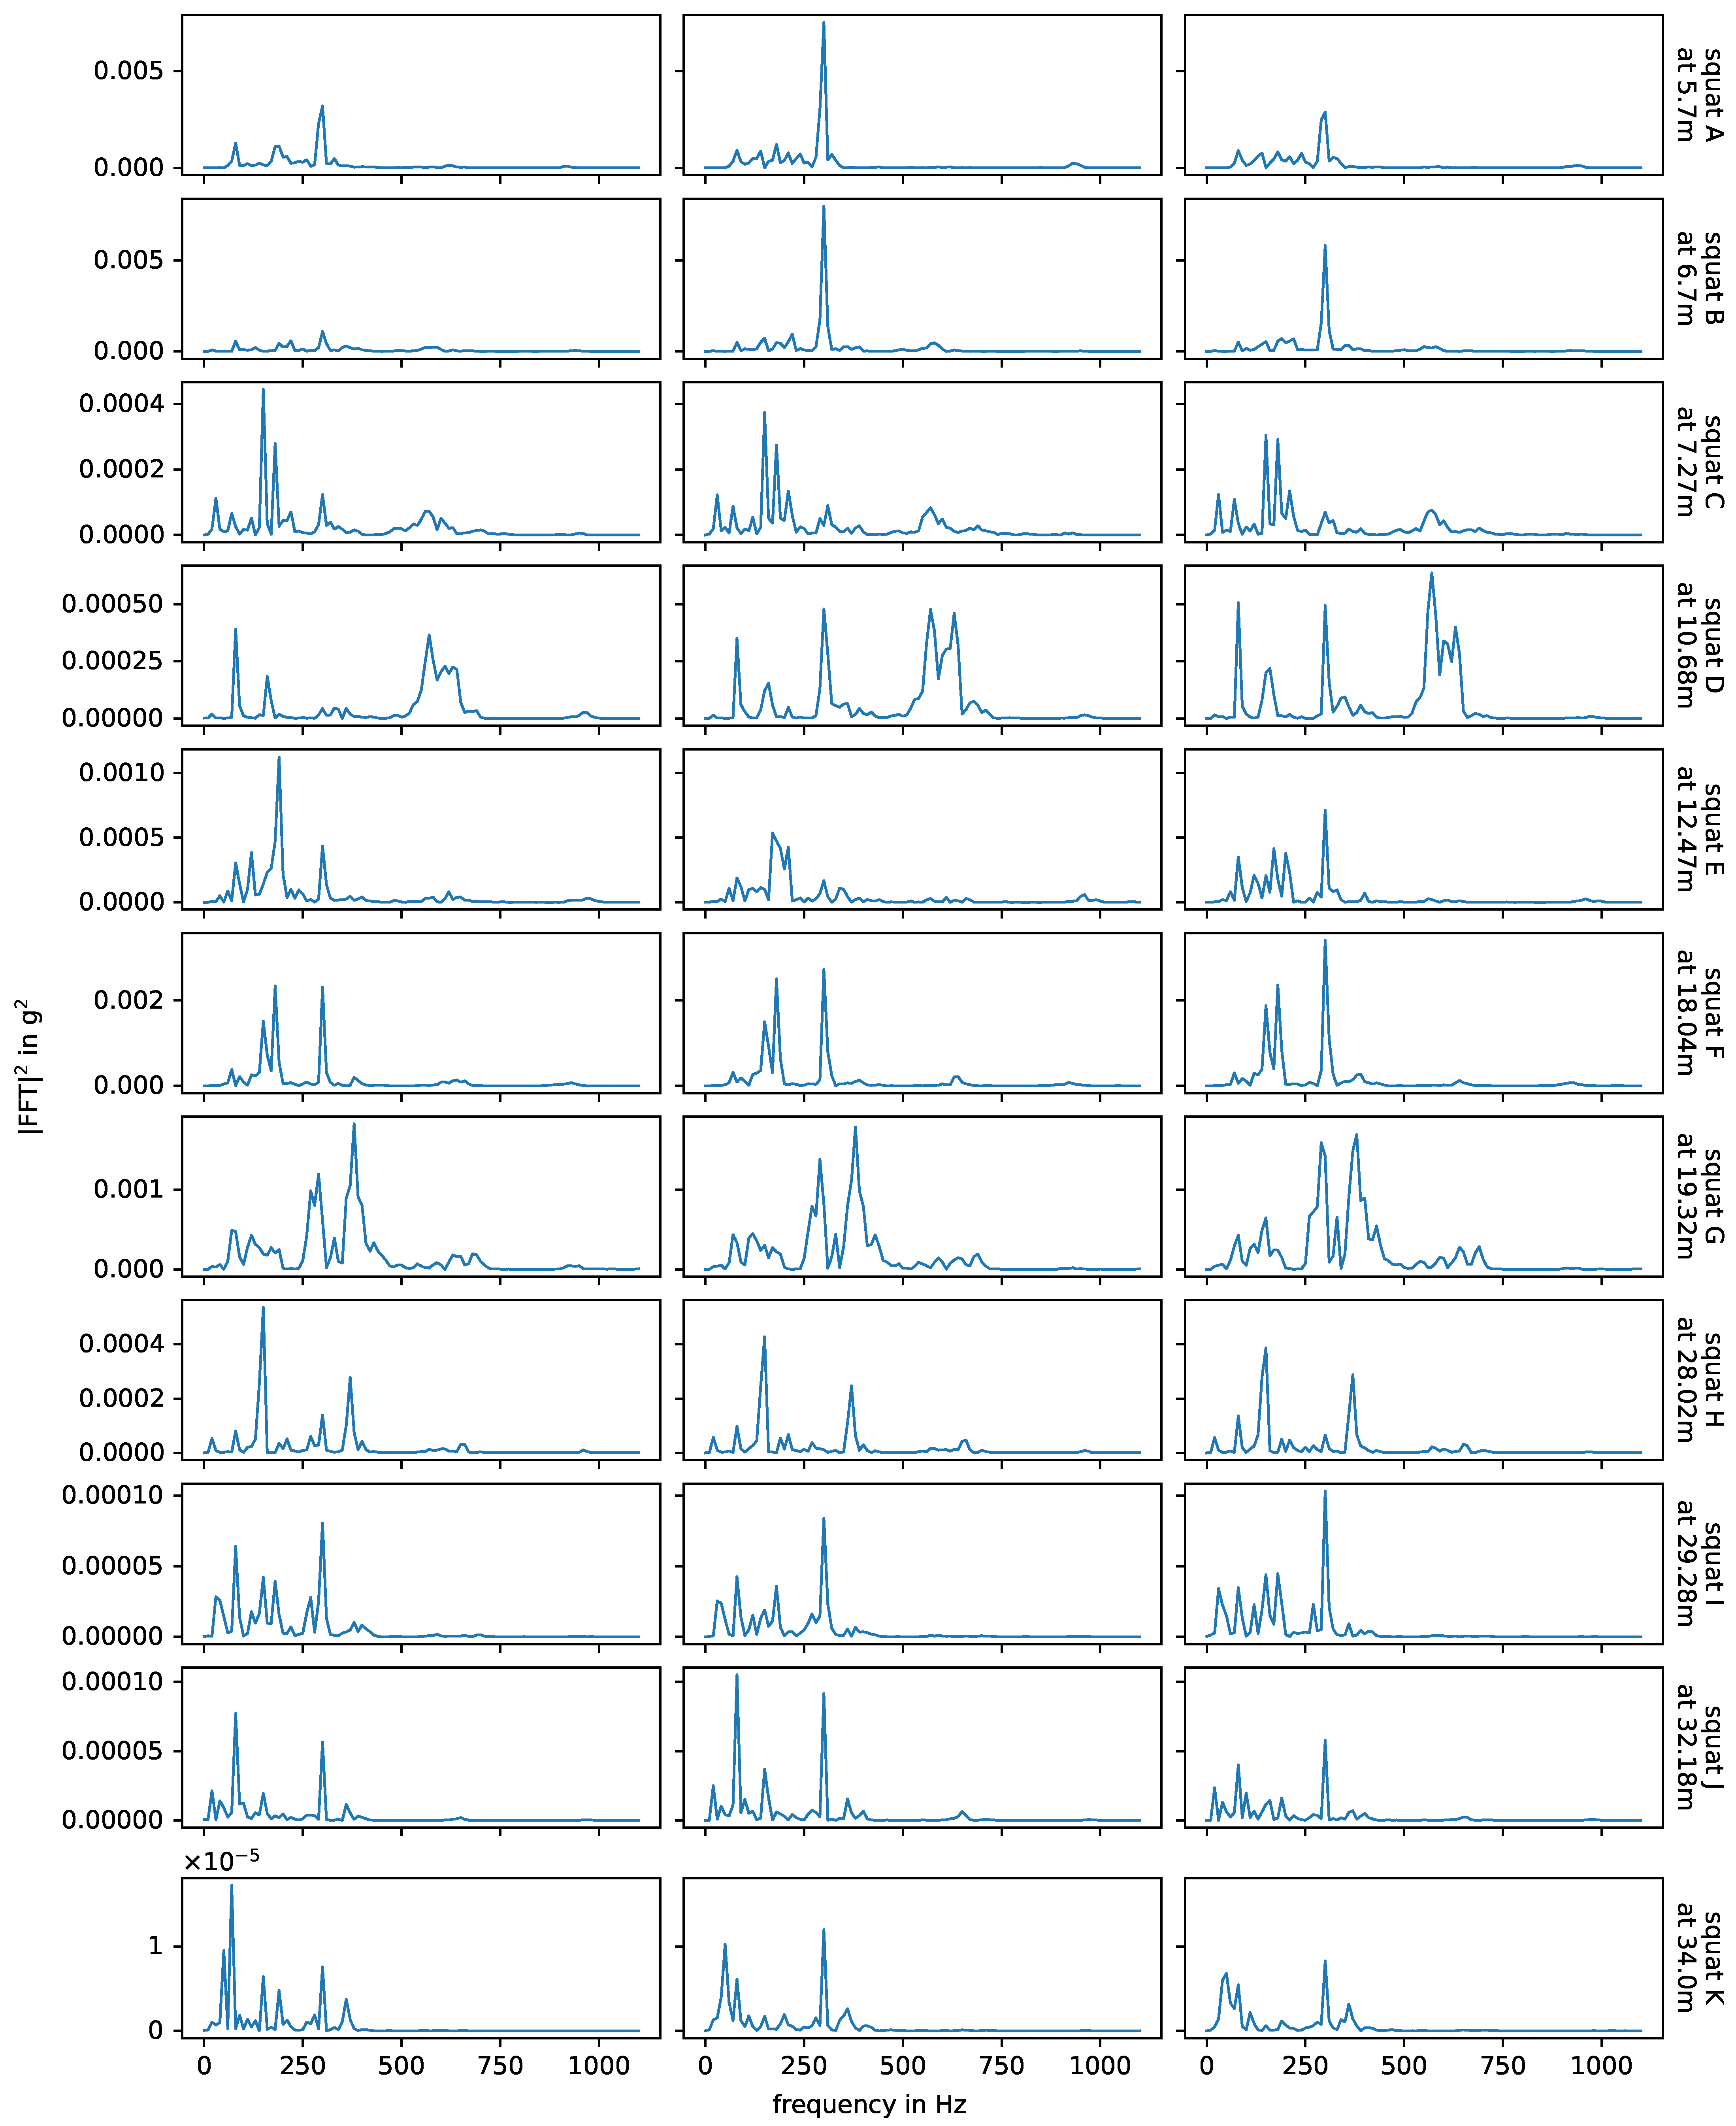
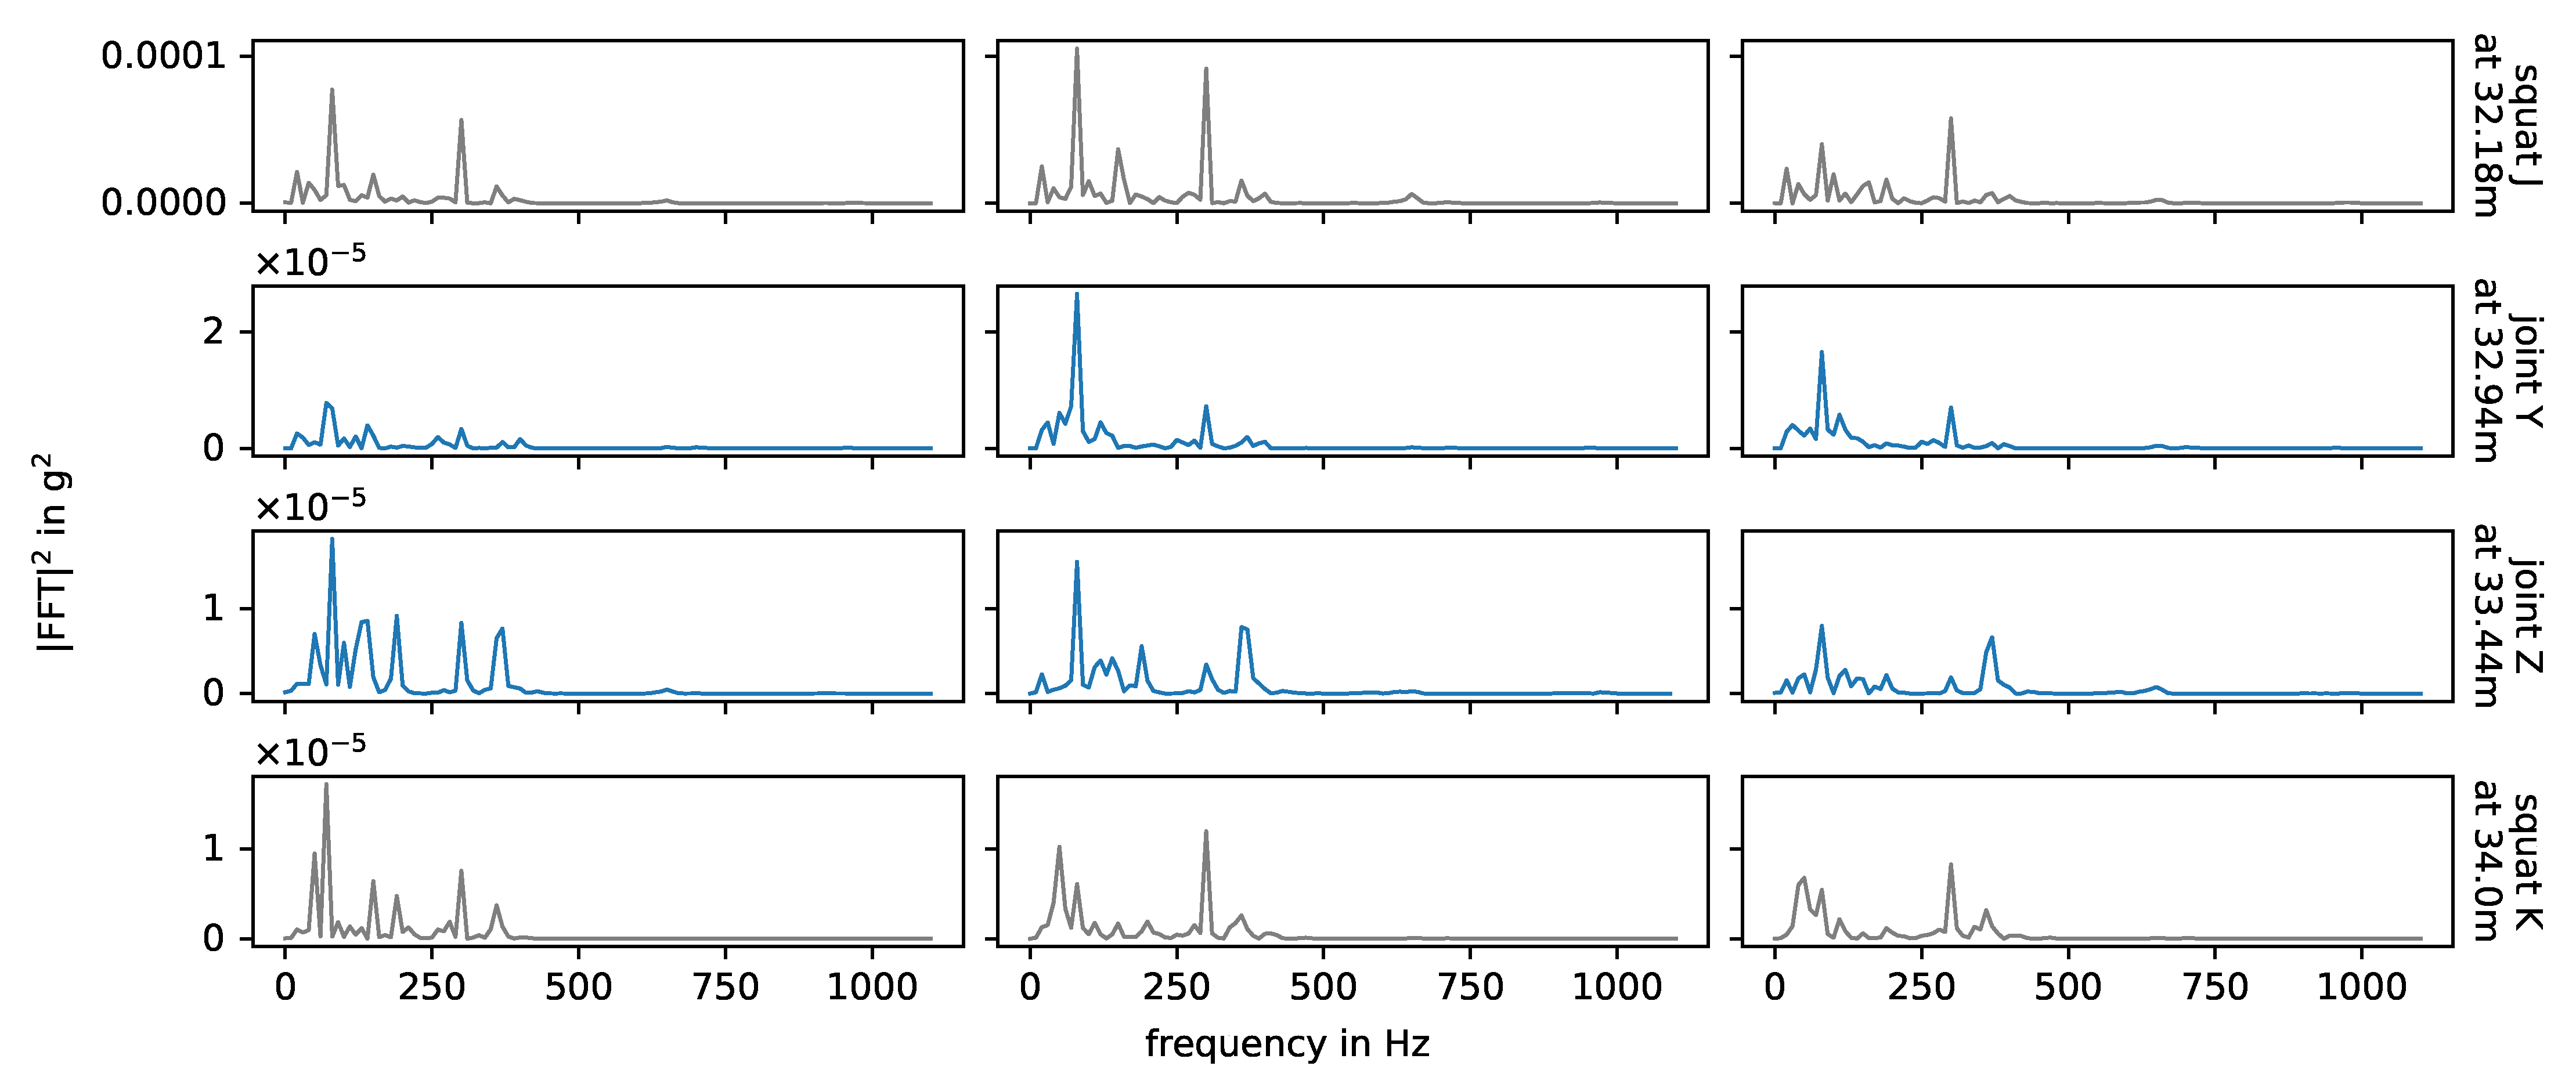
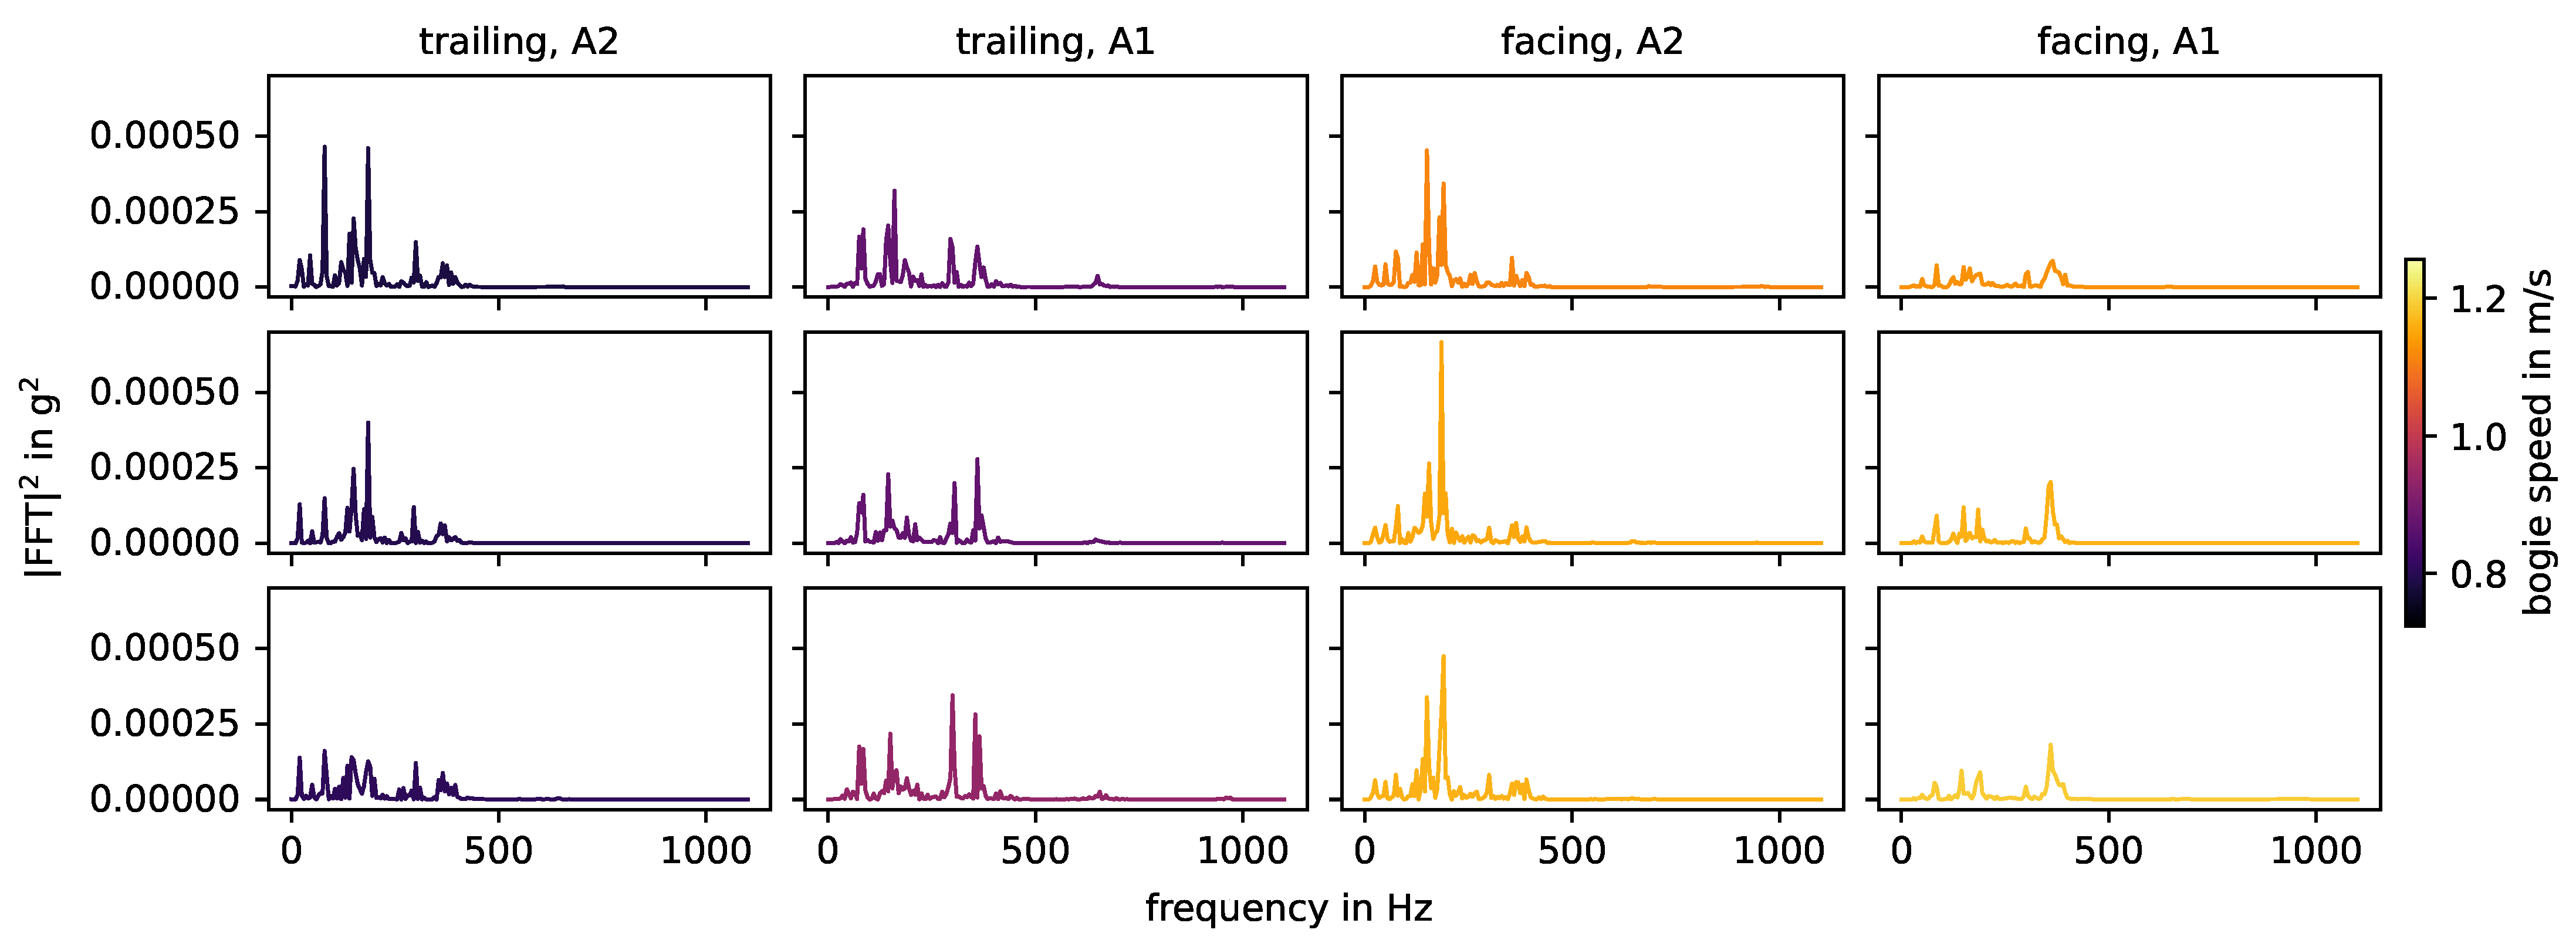
3.1. Frequency Analysis
- In-phase or rail and sleeper (as a mass) on ballast vibration: 40–200 Hz;
- Out-of-phase or rail on railpad vibration: 200–670 Hz;
- Pin-to-pin, i.e., bending wave of the rail with wavelength twice the sleeper spacing: 600–1500 Hz.
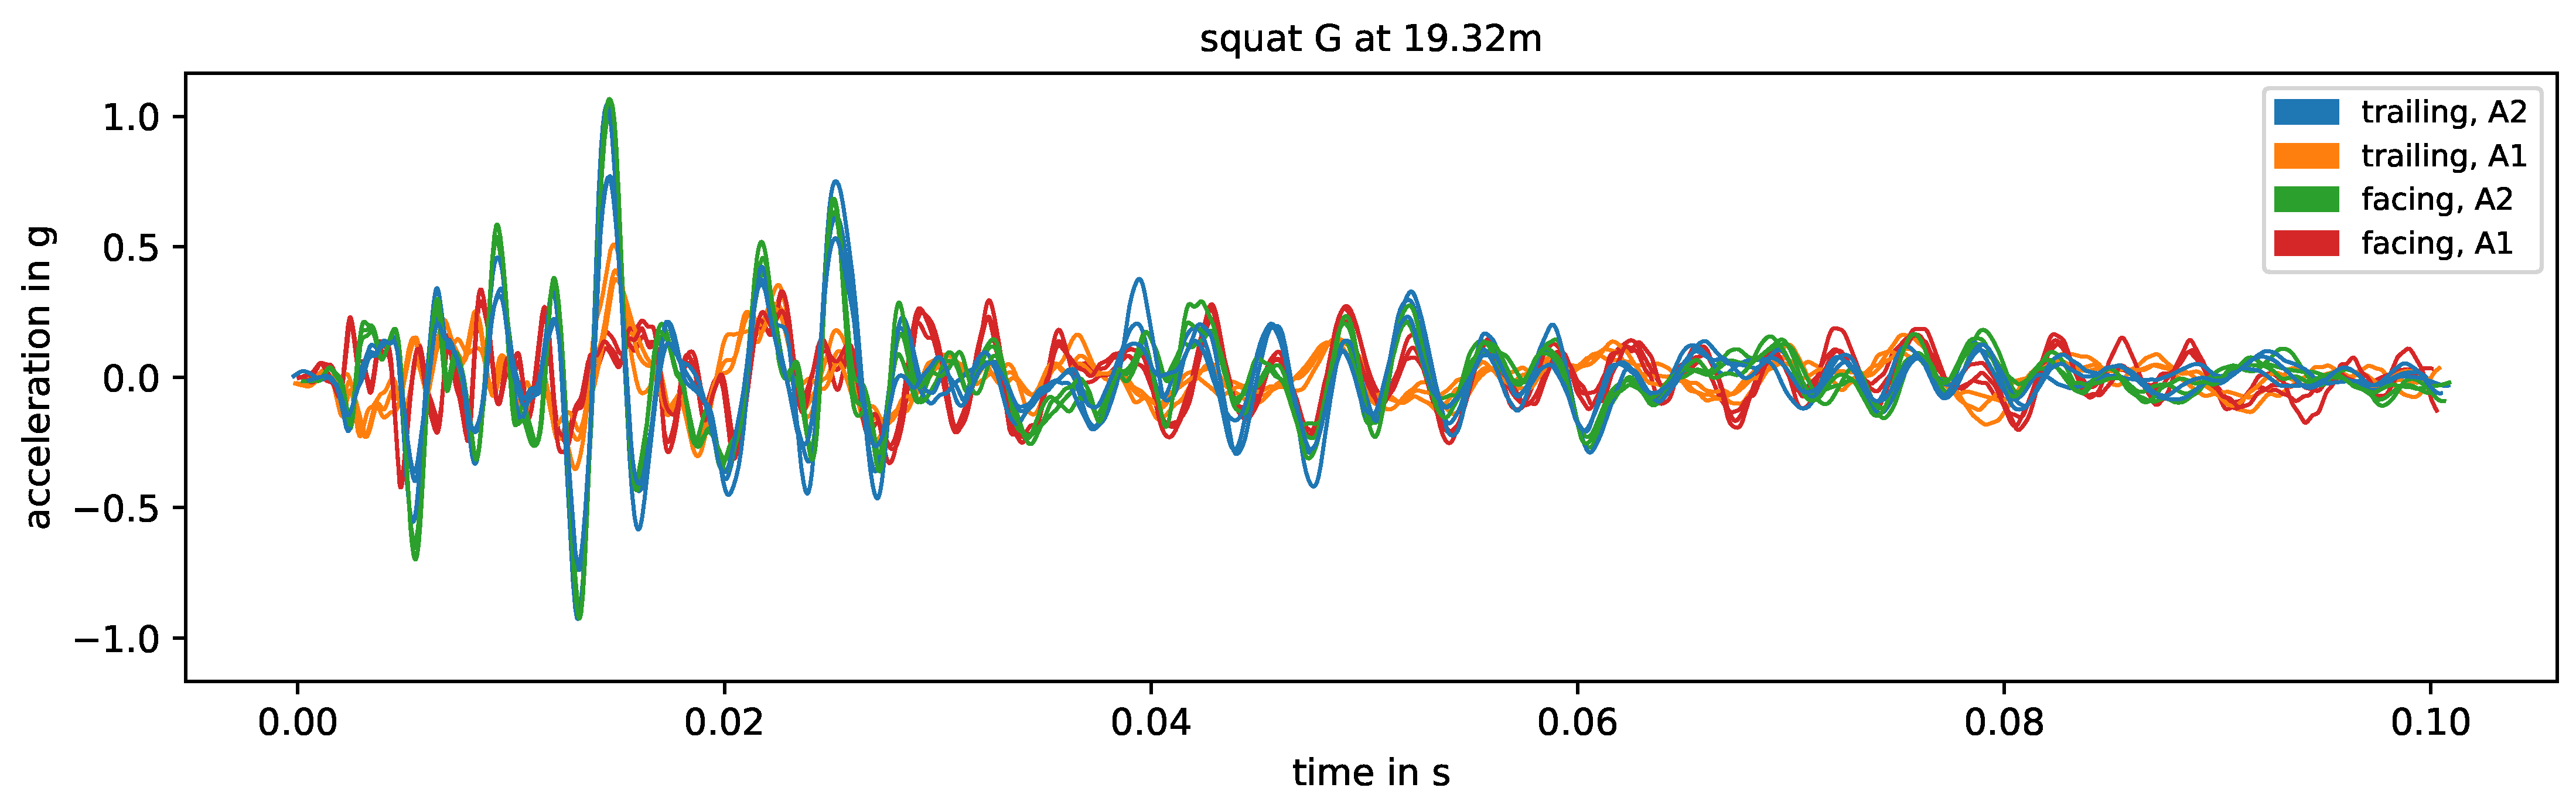
3.2. Impact Event Signature
3.3. Influencing Factors on Impact Events
- Location of impact event origin with respect to sensor: The location dominates the transmission of the signal toward the sensor and the natural frequencies of the system that are excited by impact events. A main (but not isolated) factor is the absolute distance between the impact event origin and the sensor.
- Driving direction: Facing or trailing. This factor directly changes the geometry of the impacts.
- Axle: A1 or A2. While no vehicle faults were noted, the axle (especially the wheels) themselves differ from each other. This directly changes the source excitation of the impacts. Furthermore, depending on its location, the axle not involved in an impact event influences the transmission between impact origin and sensor and the natural frequencies of the system.
- Bogie speed: Influences the strength of impact events. Theoretically, higher speeds can also change the geometry of impact events (cf. [4]) due to a loss of contact between wheel and rail, but this is not the case in the experiment.
3.4. Squats
3.5. Joints
3.6. Crossing
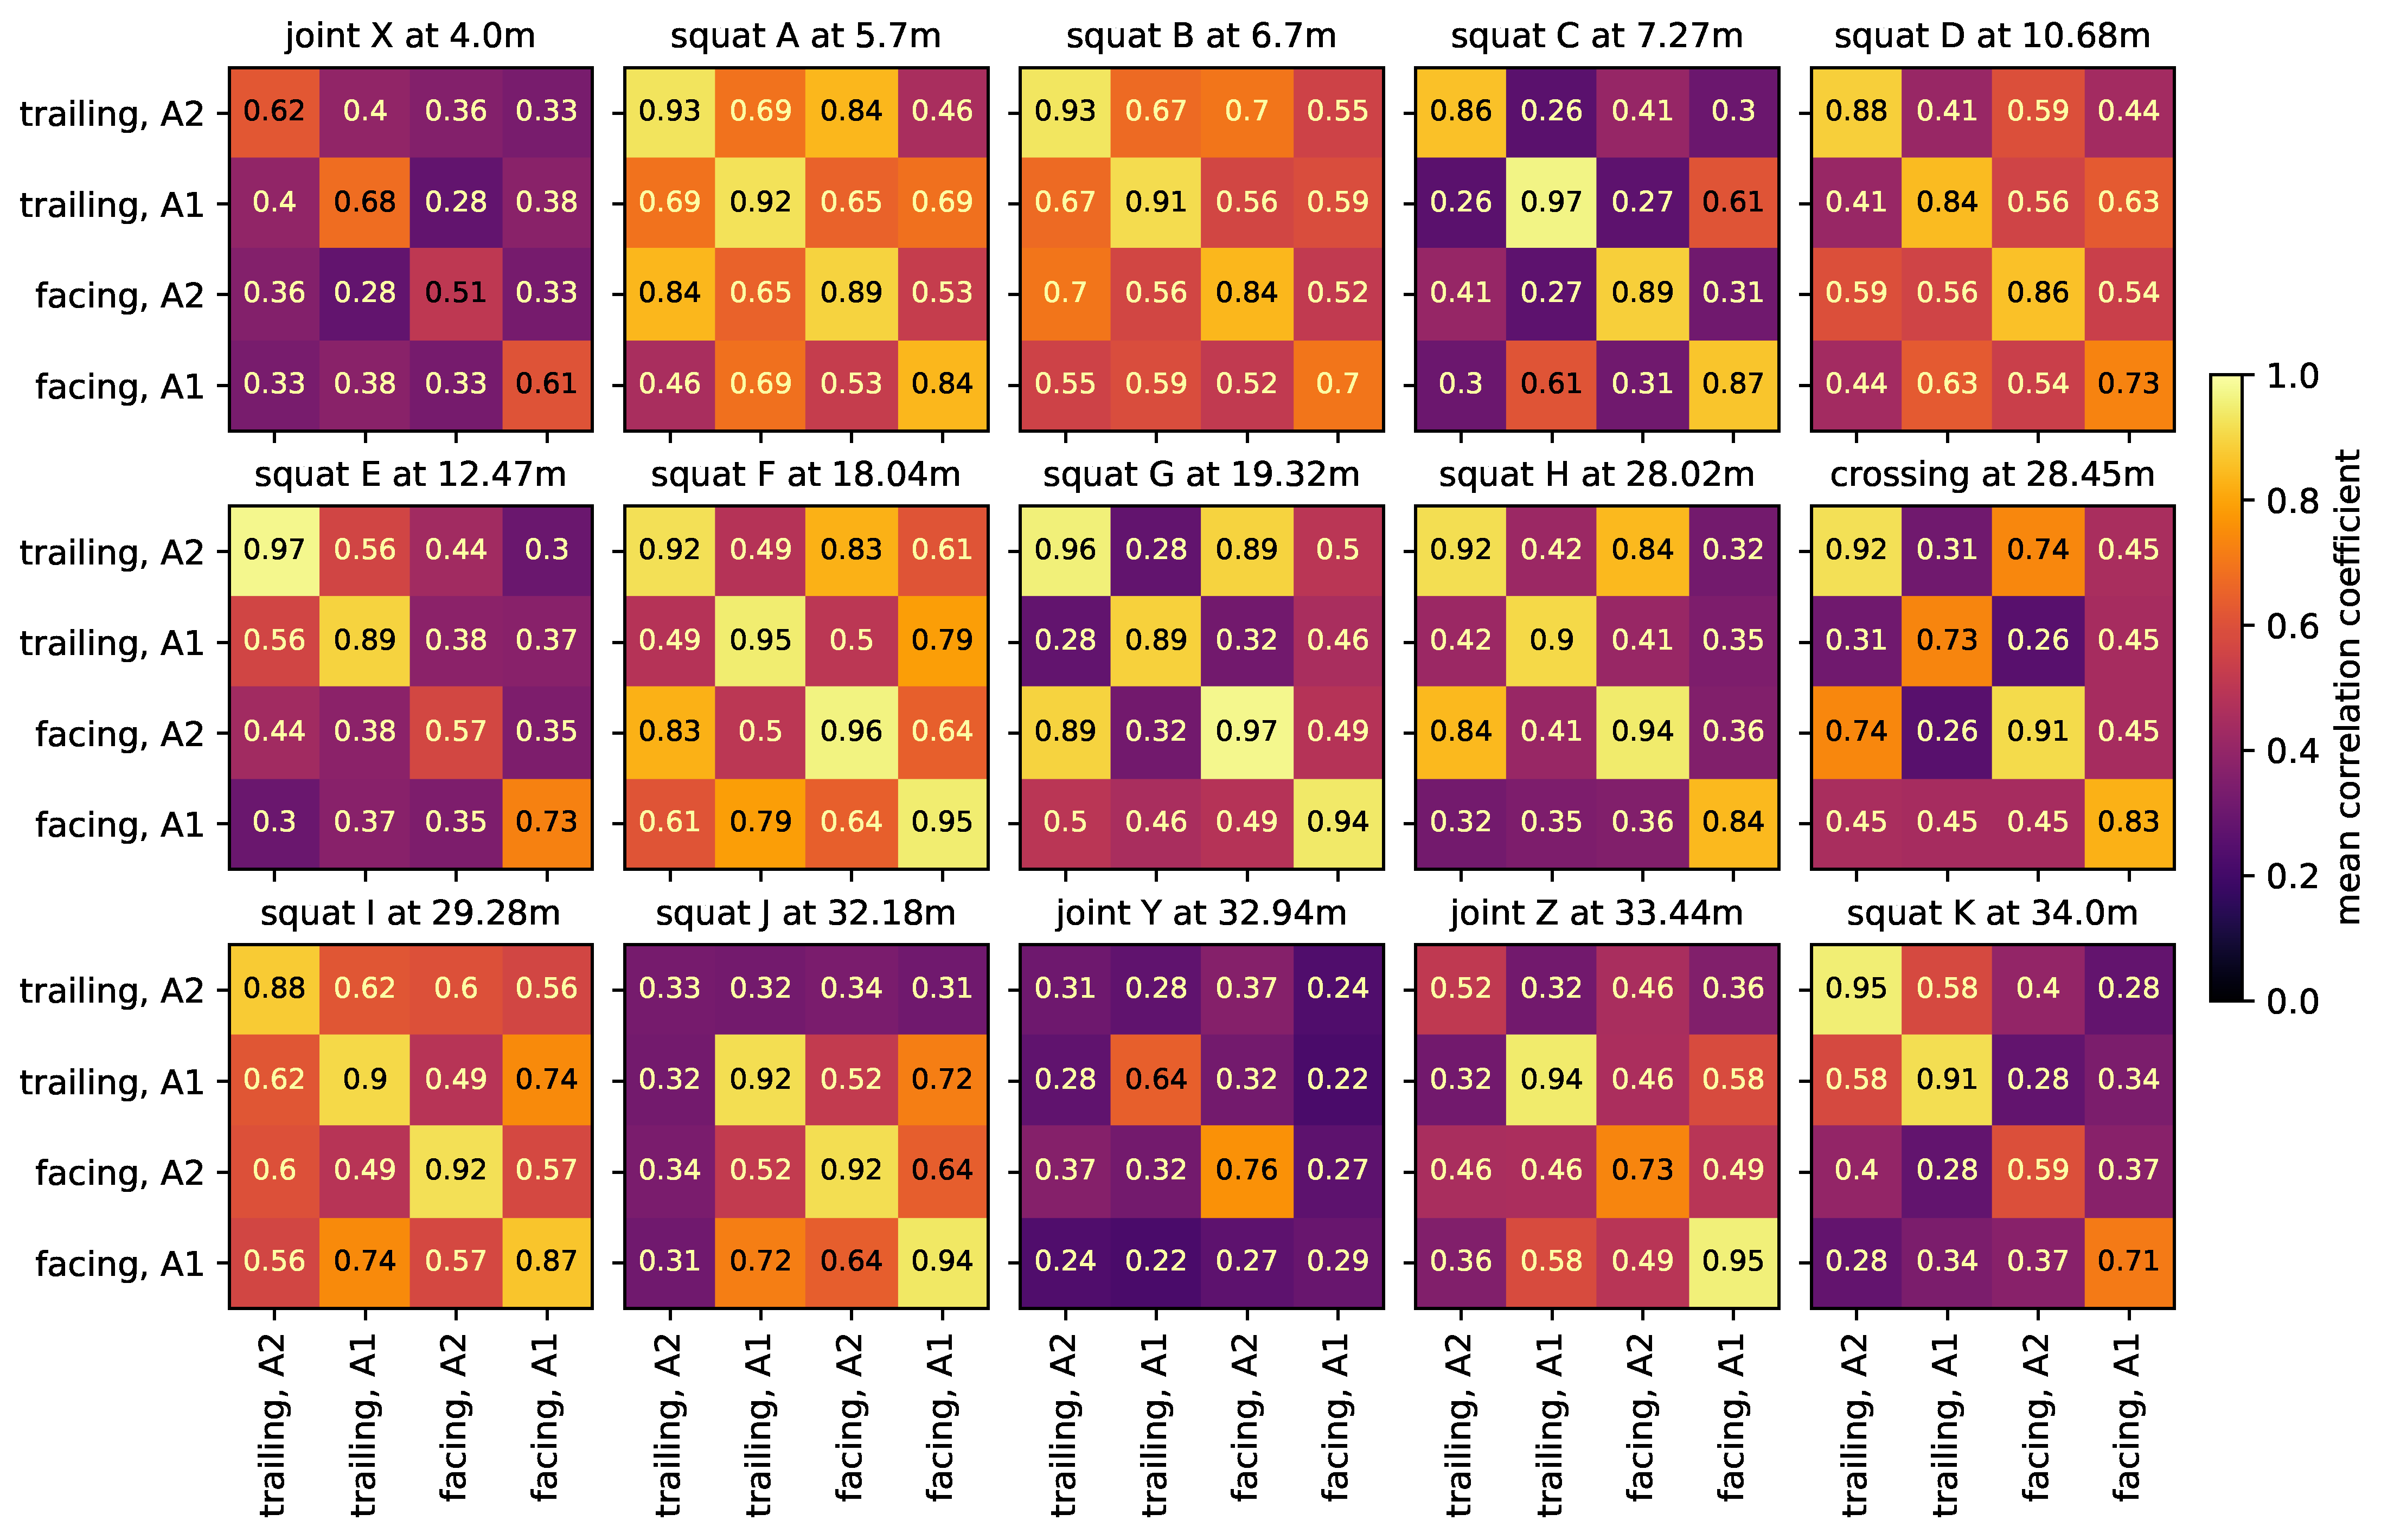
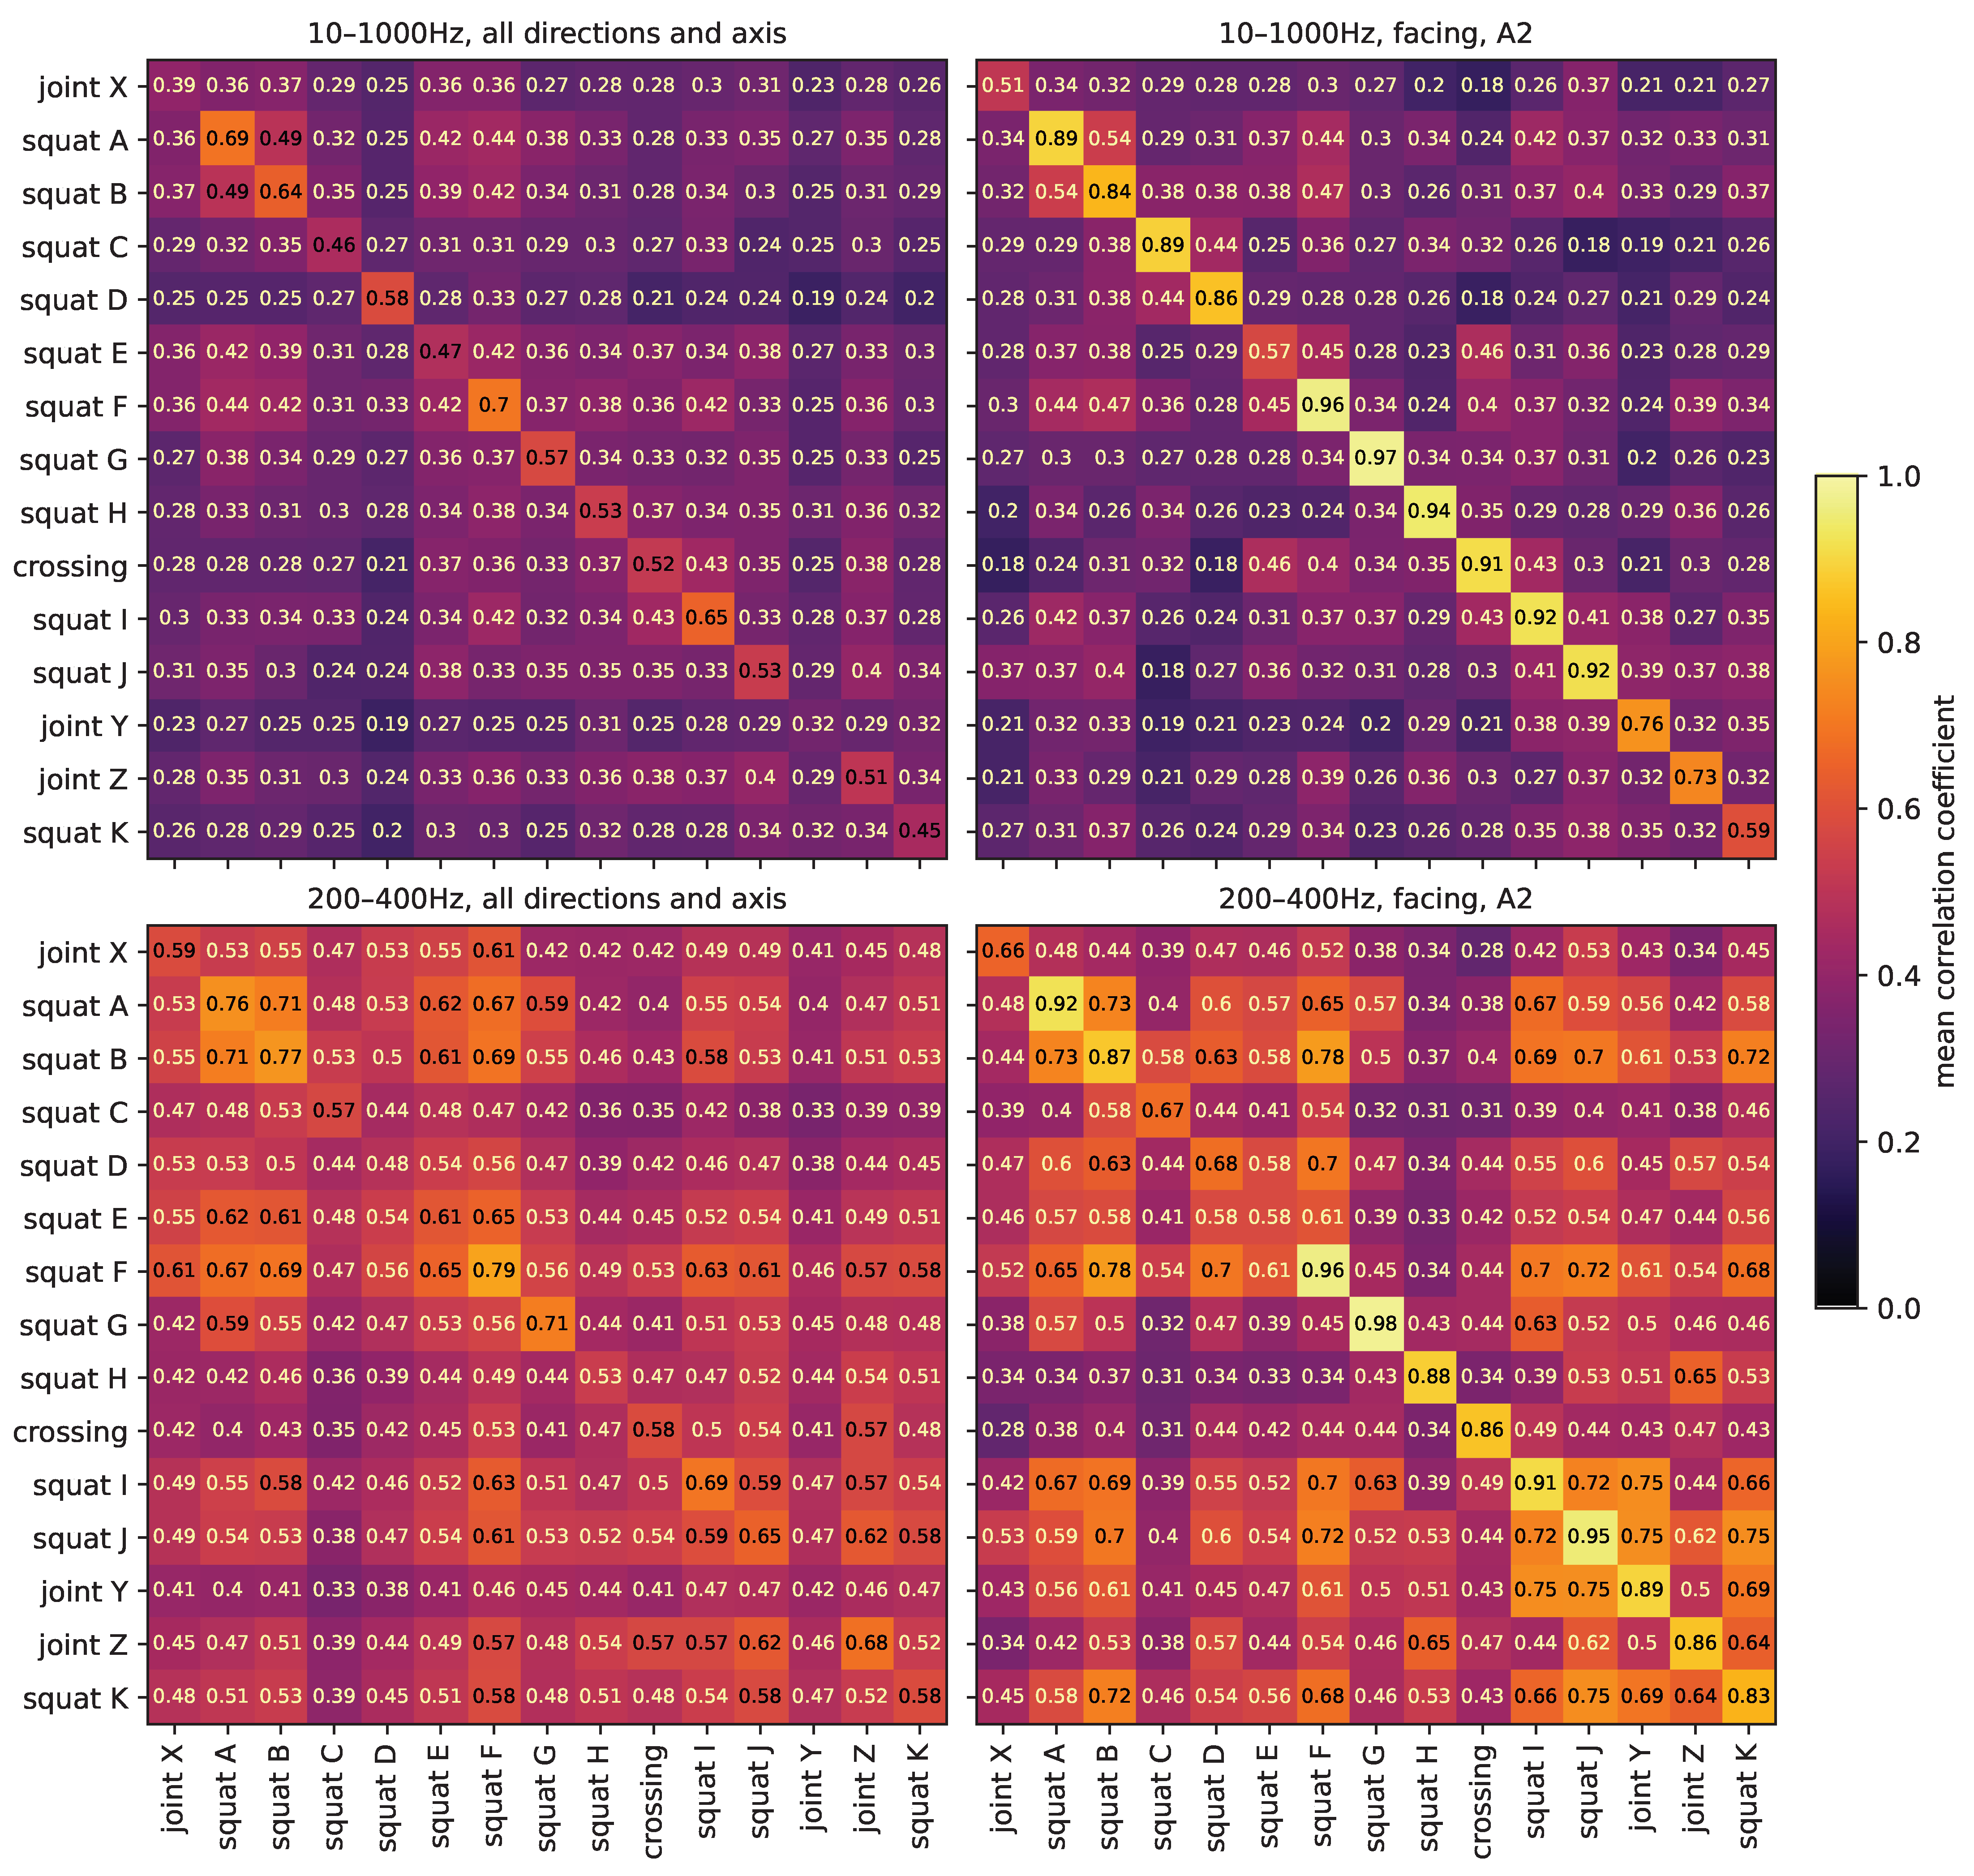
3.7. Comparison
4. Conclusions and Future Research
4.1. Conclusions
4.2. Future Research
Author Contributions
Funding
Institutional Review Board Statement
Informed Consent Statement
Data Availability Statement
Conflicts of Interest
References
- Deutsche Bahn AG. Infrastrukturzustands- und -Entwicklungsbericht 2022. Available online: https://www.eba.bund.de/SharedDocs/Downloads/DE/Finanzierung/IZB/IZB_2022.pdf?__blob=publicationFile&v=3 (accessed on 10 October 2023).
- Kostrzewski, M.; Melnik, R. Condition Monitoring of Rail Transport Systems: A Bibliometric Performance Analysis and Systematic Literature Review. Sensors 2021, 21, 4710. [Google Scholar] [CrossRef] [PubMed]
- Chia, L.; Bhardwaj, B.; Lu, P.; Bridgelall, R. Railroad Track Condition Monitoring Using Inertial Sensors and Digital Signal Processing: A Review. IEEE Sens. J. 2019, 19, 25–33. [Google Scholar] [CrossRef]
- Remennikov, A.M.; Kaewunruen, S. A review of loading conditions for railway track structures due to train and track vertical interaction. Struct. Control Health Monit. 2008, 15, 207–234. [Google Scholar] [CrossRef]
- Kaewunruen, S.; Ishida, M.; Marich, S. Dynamic Wheel–Rail Interaction Over Rail Squat Defects. Acoust. Aust. 2015, 43, 97–107. [Google Scholar] [CrossRef]
- Molodova, M.; Li, Z.; Dollevoet, R. Simulation of dynamic responses of vehicle-track system for detection of track short wave defects. In Proceedings of the 8th International Conference on Contact Mechanics and Wear of Rail/Wheel Systems, Firenze, Italy, 15–18 September 2009. [Google Scholar]
- Molodova, M.; Li, Z.; Núñez, A.; Dollevoet, R. Monitoring the railway infrastructure: Detection of surface defects using wavelets. In Proceedings of the 16th International IEEE Conference on Intelligent Transportation Systems (ITSC 2013), The Hague, The Netherlands, 6–9 October 2013; pp. 1316–1321. [Google Scholar]
- Molodova, M.; Li, Z.; Núñez, A.; Dollevoet, R. Automatic Detection of Squats in Railway Infrastructure. IEEE Trans. Intell. Transp. Syst. 2014, 15, 1980–1990. [Google Scholar] [CrossRef]
- Molodova, M.; Li, Z.; Núñez, A.; Dollevoet, R. Validation of a finite element model for axle box acceleration at squats in the high frequency range. Comput. Struct. 2014, 141, 84–93. [Google Scholar] [CrossRef]
- Molodova, M.; Li, Z.; Núñez, A.; Dollevoet, R. Parametric study of axle box acceleration at squats. Proc. Inst. Mech. Eng. Part F J. Rail Rapid Transit 2015, 229, 841–851. [Google Scholar] [CrossRef]
- Cho, H.; Park, J. Study of Rail Squat Characteristics through Analysis of Train Axle Box Acceleration Frequency. Appl. Sci. 2021, 11, 7022. [Google Scholar] [CrossRef]
- Molodova, M.; Oregui, M.; Núñez, A.; Li, Z.; Moraal, J.; Dollevoet, R. Axle box acceleration for health monitoring of insulated joints: A case study in the Netherlands. In Proceedings of the 17th International IEEE Conference on Intelligent Transportation Systems (ITSC), Qingdao, China, 8–11 October 2014; pp. 822–827. [Google Scholar]
- Molodova, M.; Oregui, M.; Núñez, A.; Li, Z.; Moraal, J.; Dollevoet, R. Health condition monitoring of insulated joints based on axle box acceleration measurements. Eng. Struct. 2016, 123, 225–235. [Google Scholar]
- Oregui, M.; Li, S.G.; Nunez, A.; Li, Z.; Carroll, R.; Dollevoet, R. Monitoring bolt tightness of rail joints using axle box acceleration measurements. Struct. Control Health Monit. 2017, 24, e1848. [Google Scholar] [CrossRef]
- Yin, X.X.; Wei, X.K. Track dipped joints and thermite weld defects detection based on in-service vehicle. In Dynamics of Vehicles on Roads and Tracks, Proceedings of the 25th International Symposium on Dynamics of Vehicles on Roads and Tracks (IAVSD 2017), Rockhampton, QLD, Australia, 14–18 August 2017; Spiryagin, M., Gordon, T., Cole, C., McSweeney, T., Eds.; CRC Press: London, UK, 2018; Volume 2, pp. 1121–1127. [Google Scholar]
- Wei, Z.; Núñez, A.; Li, Z.; Dollevoet, R. Evaluating Degradation at Railway Crossings Using Axle Box Acceleration Measurements. Sensors 2017, 17, 2236. [Google Scholar] [CrossRef] [PubMed]
- Baasch, B.; Roth, M.H.; Havrila, P.; Groos, J.C. Detecting singular track defects by time-frequency signal separation of axle-box acceleration data. In Proceedings of the World Congress on Railway Research (WCRR) 2019, Tokyo, Japan, 28 October–1 November 2019. [Google Scholar]
- Niebling, J.; Baasch, B.; Kruspe, A. Analysis of Railway Track Irregularities with Convolutional Autoencoders and Clustering Algorithms. In Dependable Computing—EDCC 2020 Workshops; Bernardi, S., Vittorini, V., Flammini, F., Nardone, R., Marrone, S., Adler, R., Schneider, D., Schleiß, P., Nostro, N., Løvenstein Olsen, R., et al., Eds.; Communications in Computer and Information Science; Springer International Publishing: Cham, Switzerland, 2020; Volume 1279, pp. 78–89. [Google Scholar]
- Baasch, B.; Heusel, J.; Roth, M.H.; Neumann, T. Train Wheel Condition Monitoring via Cepstral Analysis of Axle Box Accelerations. Appl. Sci. 2021, 11, 1432. [Google Scholar] [CrossRef]
- Zhou, Y.; Tian, Q.; Hecht, M. Wheel flat detection on railway vehicles using the angular domain synchronous averaging method: An experimental study. Struct. Health Monit. 2023, 23, 343–359. [Google Scholar] [CrossRef]
- Mosleh, A.; Montenegro, P.A.; Costa, P.A.; Calçada, R. Railway Vehicle Wheel Flat Detection with Multiple Records Using Spectral Kurtosis Analysis. Appl. Sci. 2021, 11, 4002. [Google Scholar] [CrossRef]
- Mosleh, A.; Meixedo, A.; Ribeiro, D.; Montenegro, P.; Calçada, R. Automatic clustering-based approach for train wheels condition monitoring. Int. J. Rail Transp. 2022, 11, 639–664. [Google Scholar] [CrossRef]
- Mosleh, A.; Meixedo, A.; Ribeiro, D.; Montenegro, P.; Calçada, R. Early wheel flat detection: An automatic data-driven wavelet-based approach for railways. Veh. Syst. Dyn. 2022, 61, 1644–1673. [Google Scholar] [CrossRef]
- Kouroussis, G.; Connolly, D.P.; Alexandrou, G.; Vogiatzis, K. Railway ground vibrations induced by wheel and rail singular defects. Veh. Syst. Dyn. 2015, 53, 1500–1519. [Google Scholar] [CrossRef]
- Barkhordari, P. Data-Driven Condition Monitoring of Switches and Crossings. Ph.D. Thesis, Technical University of Denmark, Kgs. Lyngby, Denmark, 2019. [Google Scholar]
- Asadzadeh, S.M.; Galeazzi, R. The predictive power of track dynamic response for monitoring ballast degradation in turnouts. Proc. Inst. Mech. Eng. Part F J. Rail Rapid Transit 2019, 234, 976–991. [Google Scholar] [CrossRef]
- Milošević, M.D.G.; Pålsson, B.A.; Nissen, A.; Johansson, H.; Nielsen, J.C.O. On tailored signal processing tools for operational condition monitoring of railway switches and crossings. In Proceedings of the ISMA2020 International Conference on Noise and Vibration Engineering, Leuven, Belgium, 7–9 September 2020; pp. 7–9. [Google Scholar]
- Milošević, M.D.G.; Pålsson, B.A.; Nissen, A.; Nelsen, J.C.O.; Johansson, H. Condition Monitoring of Railway Crossing Geometry via Measured and Simulated Track Responses. Sensors 2022, 22, 1012. [Google Scholar] [CrossRef]
- Gerber, U.; Fengler, W.; Zoll, A. Das Messsystem ESAH-M. Eisenbahningenieurkalender 2016, 1, 49–62. [Google Scholar]
- Kluge, F.; Gerber, U. Suggestion for an approach to geometry optimization of switch frogs using measurement data and calculation models. In Proceedings of the 19th Seminar of Track Management, Poprad, Slovakia, 13–14 October 2022. [Google Scholar]
- Sysyn, M.; Gerber, U.; Kluge, F.; Kovalchuk, V.; Pentask, A. Common crossing structural health analysis with track-side monitoring. Commun.-Sci. Lett. Univ. Zilina 2019, 21, 77–84. [Google Scholar] [CrossRef]
- Sysyn, M.; Nabochenko, O.; Kovalchuk, V.; Gruen, D.; Pentsak, A. Improvement of inspection system for common crossings by track side monitoring and prognostics. Struct. Monit. Maint. 2019, 6, 219–235. [Google Scholar]
- Sysyn, M.; Izvolt, L.; Nabochenko, O.; Kovalchuk, V.; Sestakova, J.; Pentsak, A. Multifractal analysis of the common crossing track-side measurements. Civ. Environ. Eng. 2019, 15, 101–114. [Google Scholar] [CrossRef]
- Liu, X.; Markine, V.L.; Shevtsov, I.Y.; Dollevoet, R. Experimental study of key parameters investigation in turnout crossing degradation process. In Proceedings of the 10th International Conference on Contact Mechanics and Wear of Rail/Wheel Systems, Colorado Springs, CO, USA, 30 August–3 September 2015. [Google Scholar]
- Liu, X.; Markine, V.L. Correlation Analysis and Verification of Railway Crossing Condition Monitoring. Sensors 2019, 19, 4175. [Google Scholar] [CrossRef] [PubMed]
- Lundberg, J. Digitala Spårväxeln: Digitaliserade Omläggningsanordningar för Framtiden: Slutgiltig Rapport. Available online: https://www.smartbuilt.se/media/ufsm4itk/slutrapport-till-programkontoret-r%C3%A4tt-version-svenska-v40docx.pdf (accessed on 15 June 2022).
- Najeh, T.; Lundberg, J.; Kerrouche, A. Deep-Learning and Virbration-Based System for Wear Size Estiamtion of Railway Switches and Crossings. Sensors 2021, 21, 5217. [Google Scholar] [CrossRef]
- Zuo, Y.; Thiery, F.; Chandran, P.; Odelius, J.; Rantatalo, M. Squat Detection of Railway Switches and Crossings Using Wavelets and Isolation Forest. Sensors 2022, 22, 6357. [Google Scholar] [CrossRef]
- Zuo, Y.; Lundberg, J.; Najeh, T.; Rantatalo, M.; Odelius, J. Squat Detection of Railway Switches and Crossings Using Point Machine Vibration Measurements. Sensors 2023, 23, 3666. [Google Scholar] [CrossRef]
- Brunton, S.L.; Kutz, J.N. Data-Driven Science and Engineering: Machine Learning, Dynamical Systems, and Control; Cambridge University Press: Cambridge, UK, 2022. [Google Scholar]
- Boslaugh, S. Statistics in a Nutshell: A Desktop Quick Reference; O’Reilly Media, Inc.: Sebastopol, CA, USA, 2012. [Google Scholar]
- Grund, M.; Groos, J.C.; Ritter, J.R.R. Fault Reactivation Analysis Using Microearthquake Clustering Based on Signal-to-Noise Weighted Waveform Similarity. Pure Appl. Geophys. 2016, 173, 2325–2355. [Google Scholar] [CrossRef]
- de Man, A.P. Pin-pin resonance as a reference in determining ballasted railway track vibration behaviour. Heron-Engl. Ed. 2000, 45, 35–52. [Google Scholar]
- Knothe, K. Gleisdynamik, 1st ed.; Ernst und Sohn: Berlin, Germany, 2001. [Google Scholar]
- Croft, B. The Development of Rail-Head Acoustic Roughness. Ph.D. Thesis, University of Southampton, Southampton, UK, 2009. [Google Scholar]
- Wei, Z.; Boogaard, M.; Núñez, A.; Li, Z.; Dollevoet, R. An Integrated Approach for Characterizing the Dynamic Behavior of the Wheel–Rail Interaction at Crossings. IEEE Trans. Instrum. Meas. 2018, 67, 2332–2344. [Google Scholar] [CrossRef]
- Li, Q.; Thompson, D.J.; Toward, M.G.R. Estimation of track parameters and wheel–rail combined roughness from rail vibration. Proc. Inst. Mech. Eng. Part F J. Rail Rapid Transit 2018, 232, 1149–1167. [Google Scholar] [CrossRef]
- Li, W.; Jiang, J.; Dwight, R.; Schulten, C. An investigation of a method for track decay rate measurement using train pass-bys. In Proceedings of the ACOUSTICS 2011, Gold Coast, Australia, 2–4 November 2011; p. 75. [Google Scholar]


| Sensor | Setup | ||
|---|---|---|---|
| Model | 608A11 industrial ICP® accelerometer | Direction | vertical |
| Axis | single-axis | Sampling rate | 51,200 Hz |
| Sensitivity | 100 mV/g | ||
| Measurement range | ±50 g | ||
| Frequency range (±3 dB) | 0.5 to 10,000 Hz | ||
Disclaimer/Publisher’s Note: The statements, opinions and data contained in all publications are solely those of the individual author(s) and contributor(s) and not of MDPI and/or the editor(s). MDPI and/or the editor(s) disclaim responsibility for any injury to people or property resulting from any ideas, methods, instructions or products referred to in the content. |
© 2024 by the authors. Licensee MDPI, Basel, Switzerland. This article is an open access article distributed under the terms and conditions of the Creative Commons Attribution (CC BY) license (https://creativecommons.org/licenses/by/4.0/).
Share and Cite
Reetz, S.; Najeh, T.; Lundberg, J.; Groos, J. Analysis of Local Track Discontinuities and Defects in Railway Switches Based on Track-Side Accelerations. Sensors 2024, 24, 477. https://doi.org/10.3390/s24020477
Reetz S, Najeh T, Lundberg J, Groos J. Analysis of Local Track Discontinuities and Defects in Railway Switches Based on Track-Side Accelerations. Sensors. 2024; 24(2):477. https://doi.org/10.3390/s24020477
Chicago/Turabian StyleReetz, Susanne, Taoufik Najeh, Jan Lundberg, and Jörn Groos. 2024. "Analysis of Local Track Discontinuities and Defects in Railway Switches Based on Track-Side Accelerations" Sensors 24, no. 2: 477. https://doi.org/10.3390/s24020477
APA StyleReetz, S., Najeh, T., Lundberg, J., & Groos, J. (2024). Analysis of Local Track Discontinuities and Defects in Railway Switches Based on Track-Side Accelerations. Sensors, 24(2), 477. https://doi.org/10.3390/s24020477