


Performance Improvement of Partial Least Squares Regression Soluble Solid Content Prediction Model Based on Adjusting Distance between Light Source and Spectral Sensor according to Apple Size
 ,
,
Abstract
1. Introduction
2. Materials and Methods
2.1. Experimental Samples
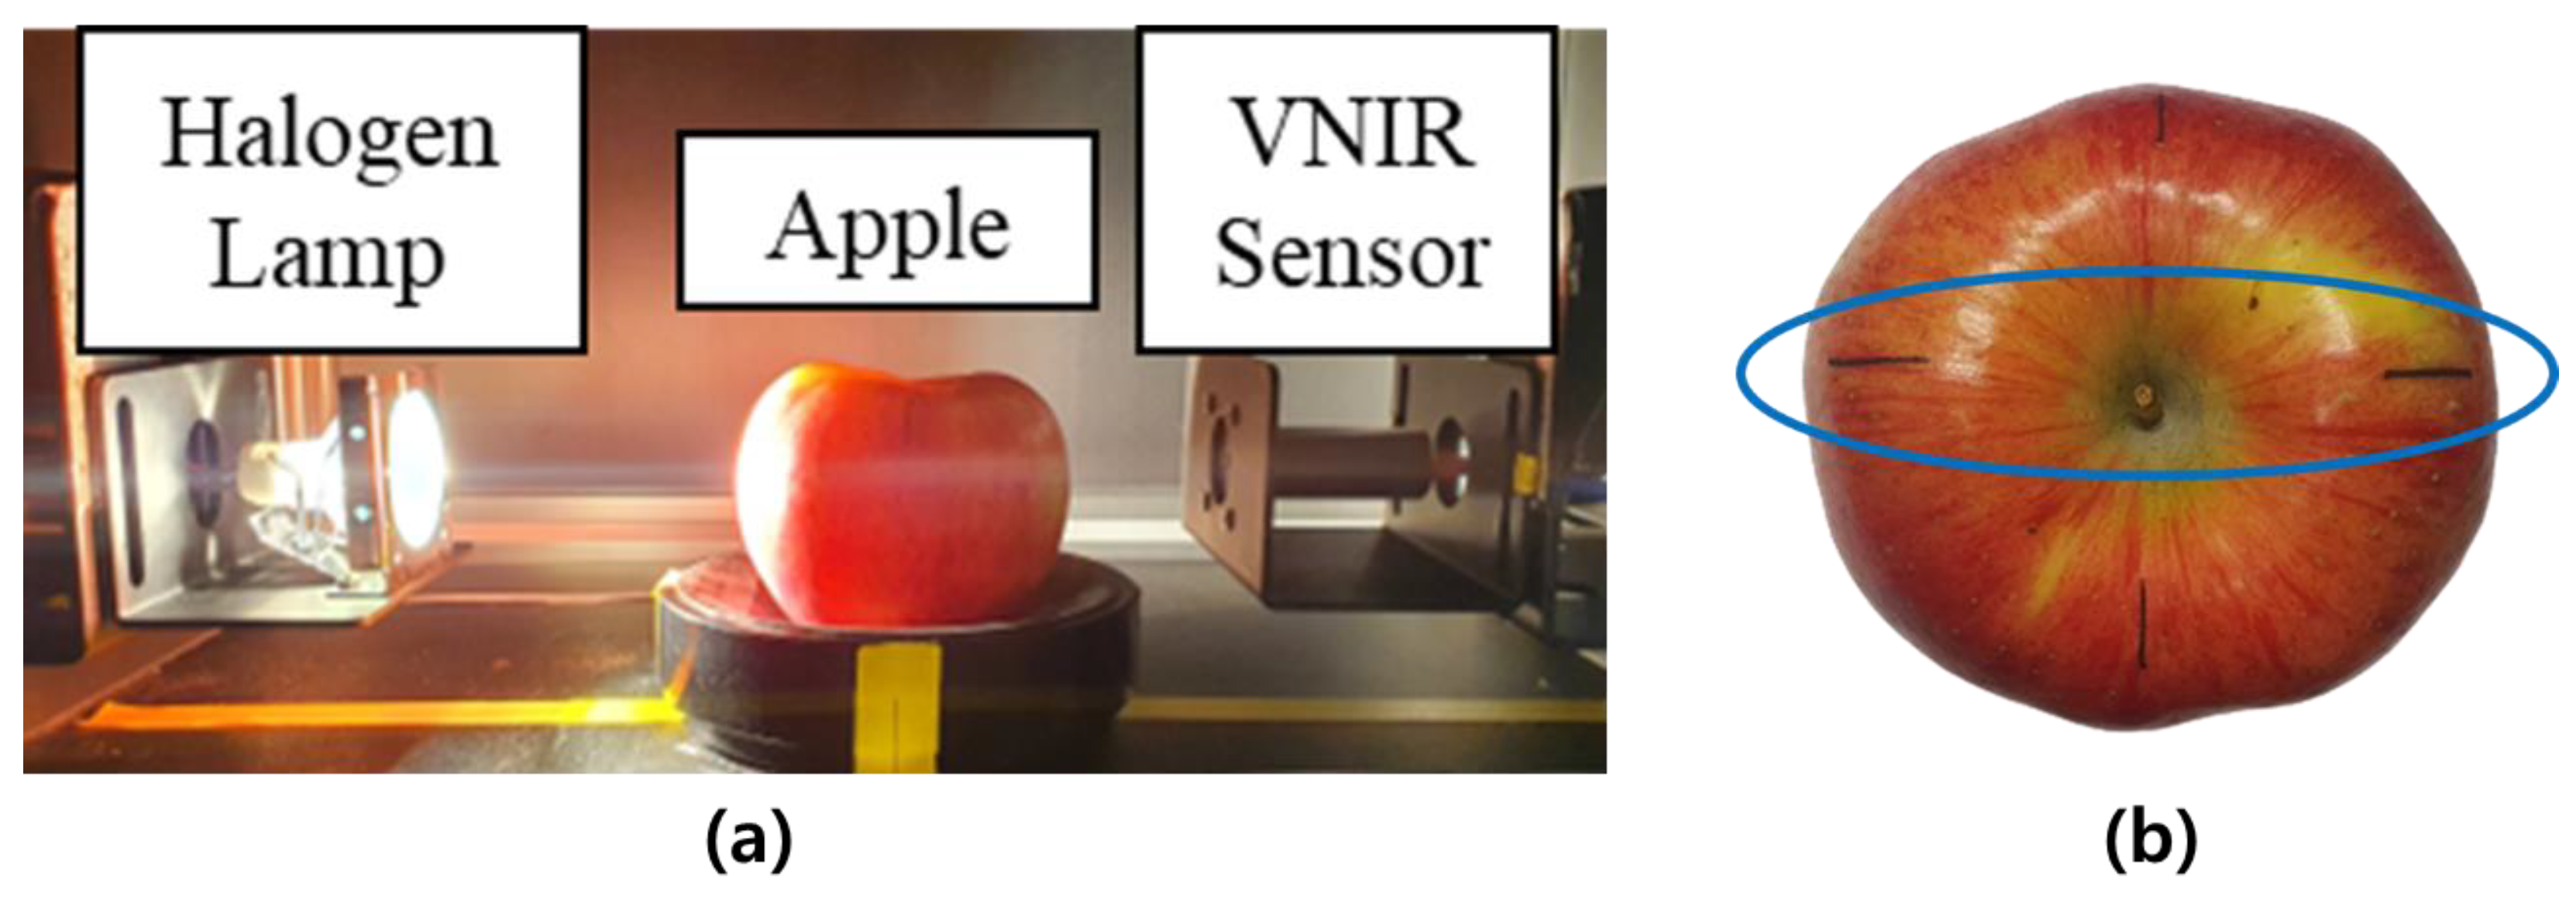
2.2. Spectra Collection and SSC Measurement
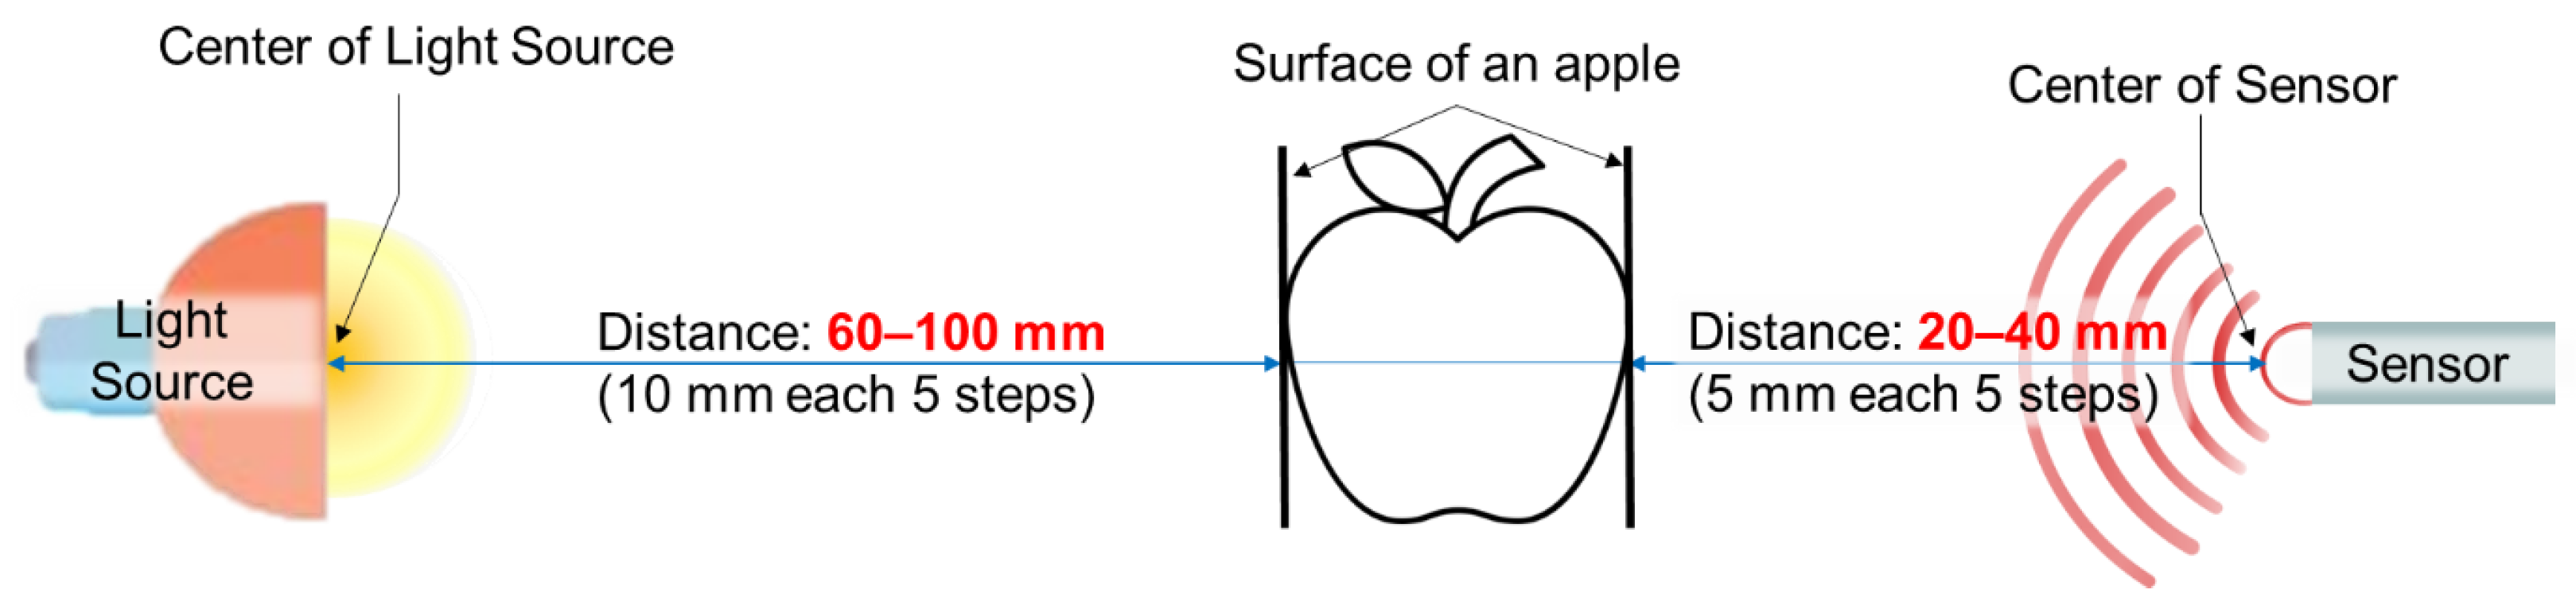
2.3. Analysis of Spectral Characteristics and Selection of Appropriate Distance between Light Source and Vis/NIR Sensor (Experiment 1)
2.4. Development of Apple SSC Prediction Model (Experiment 2)
- Spectral preprocessing
- Model evaluation
3. Results and Discussion
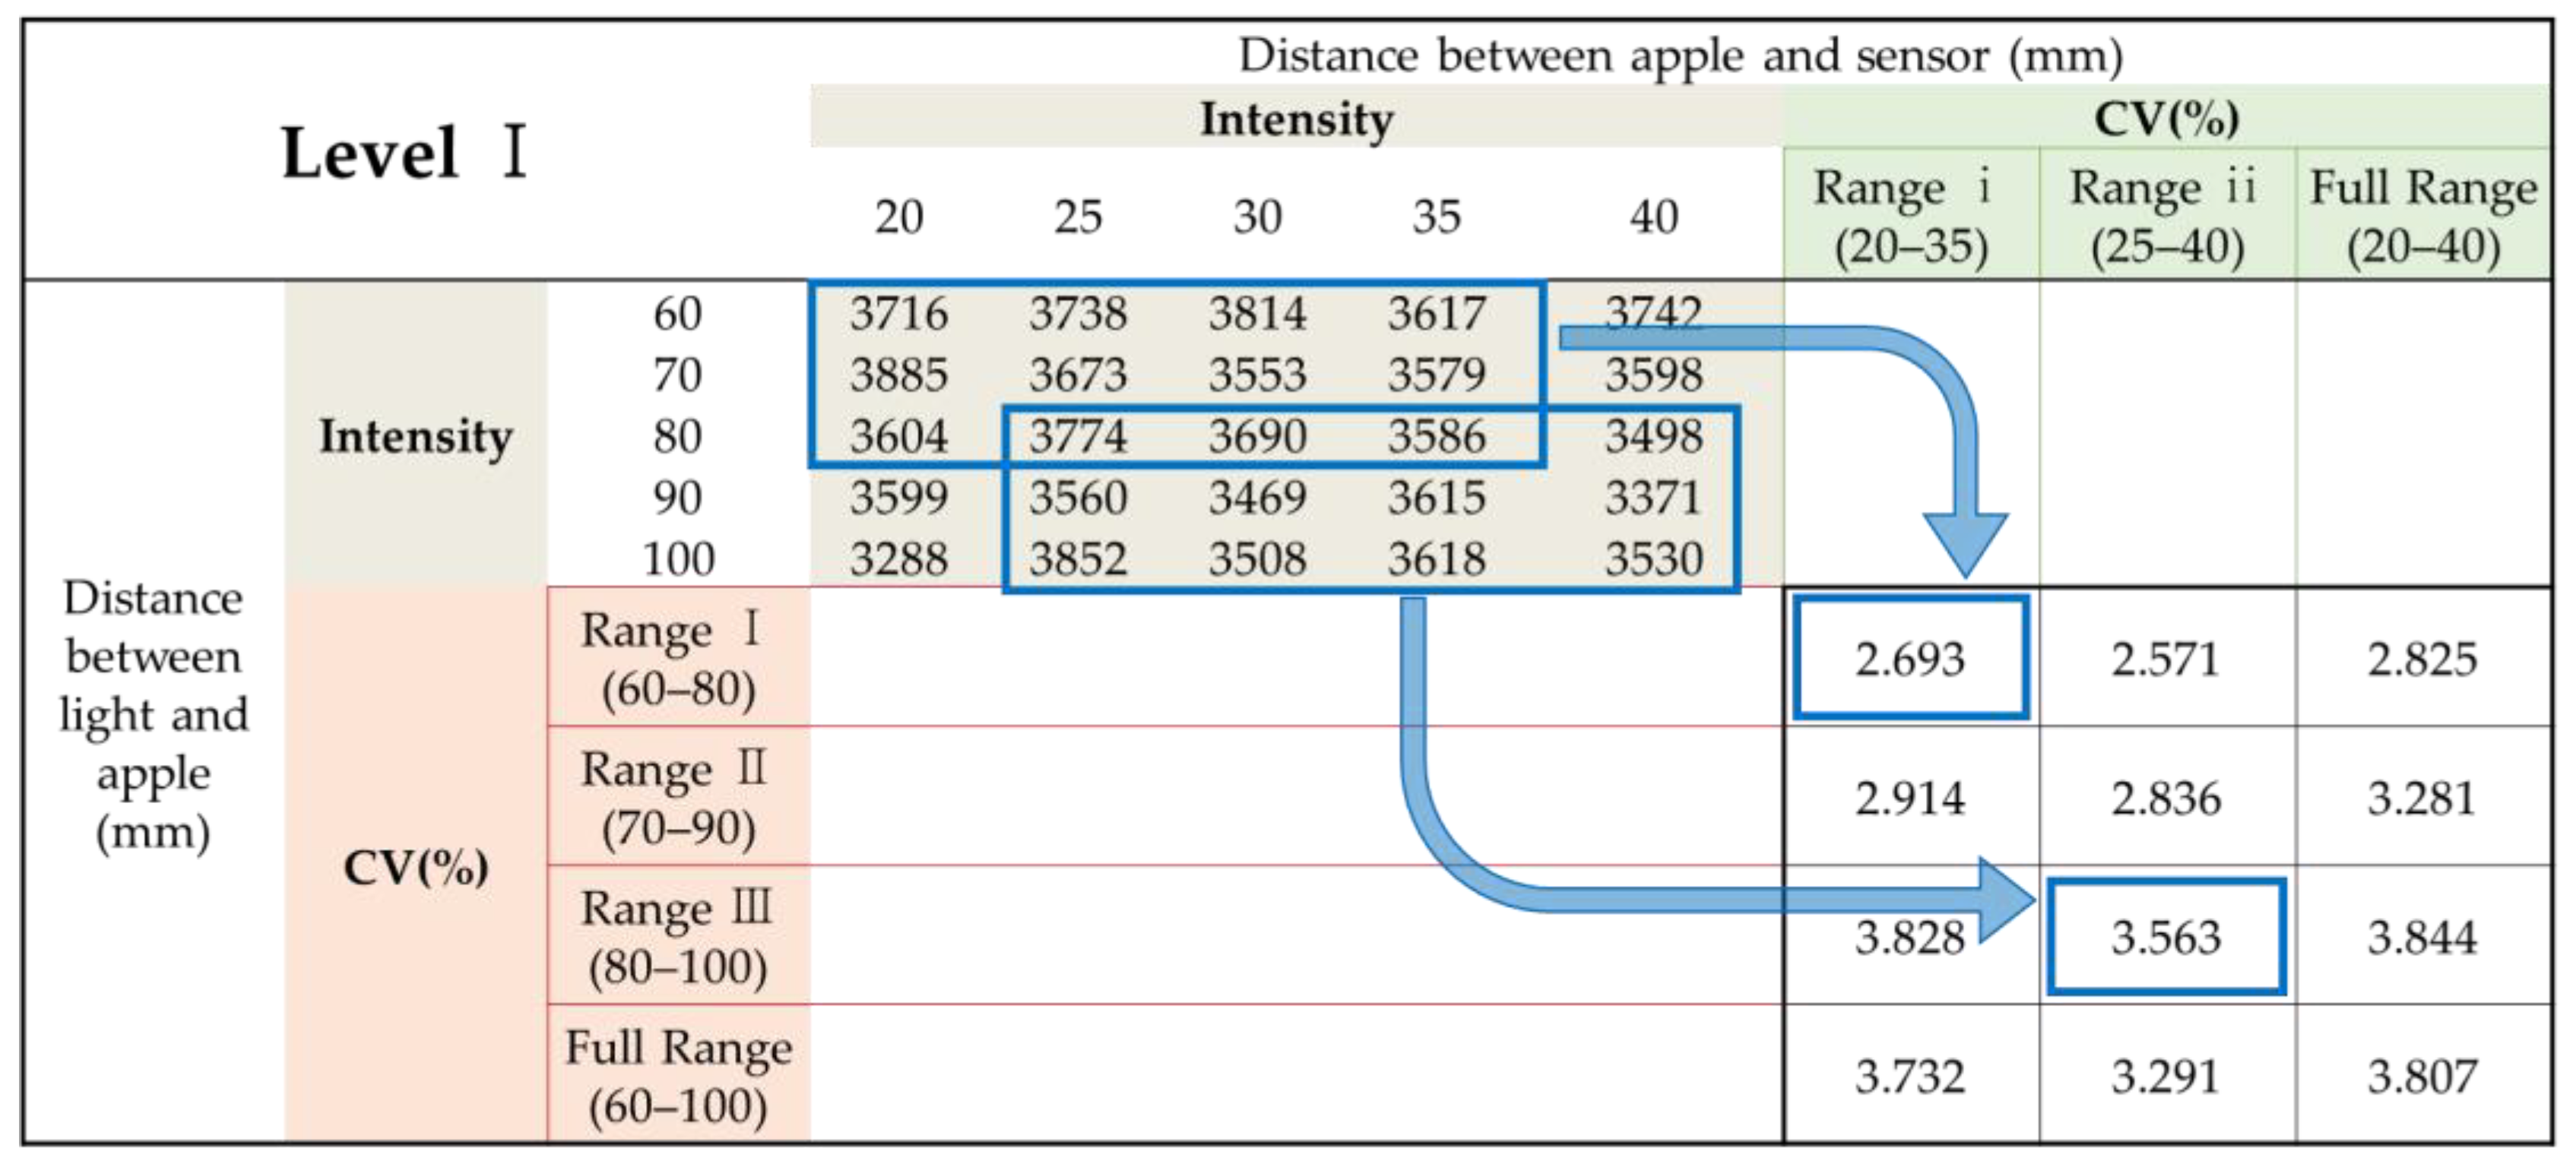
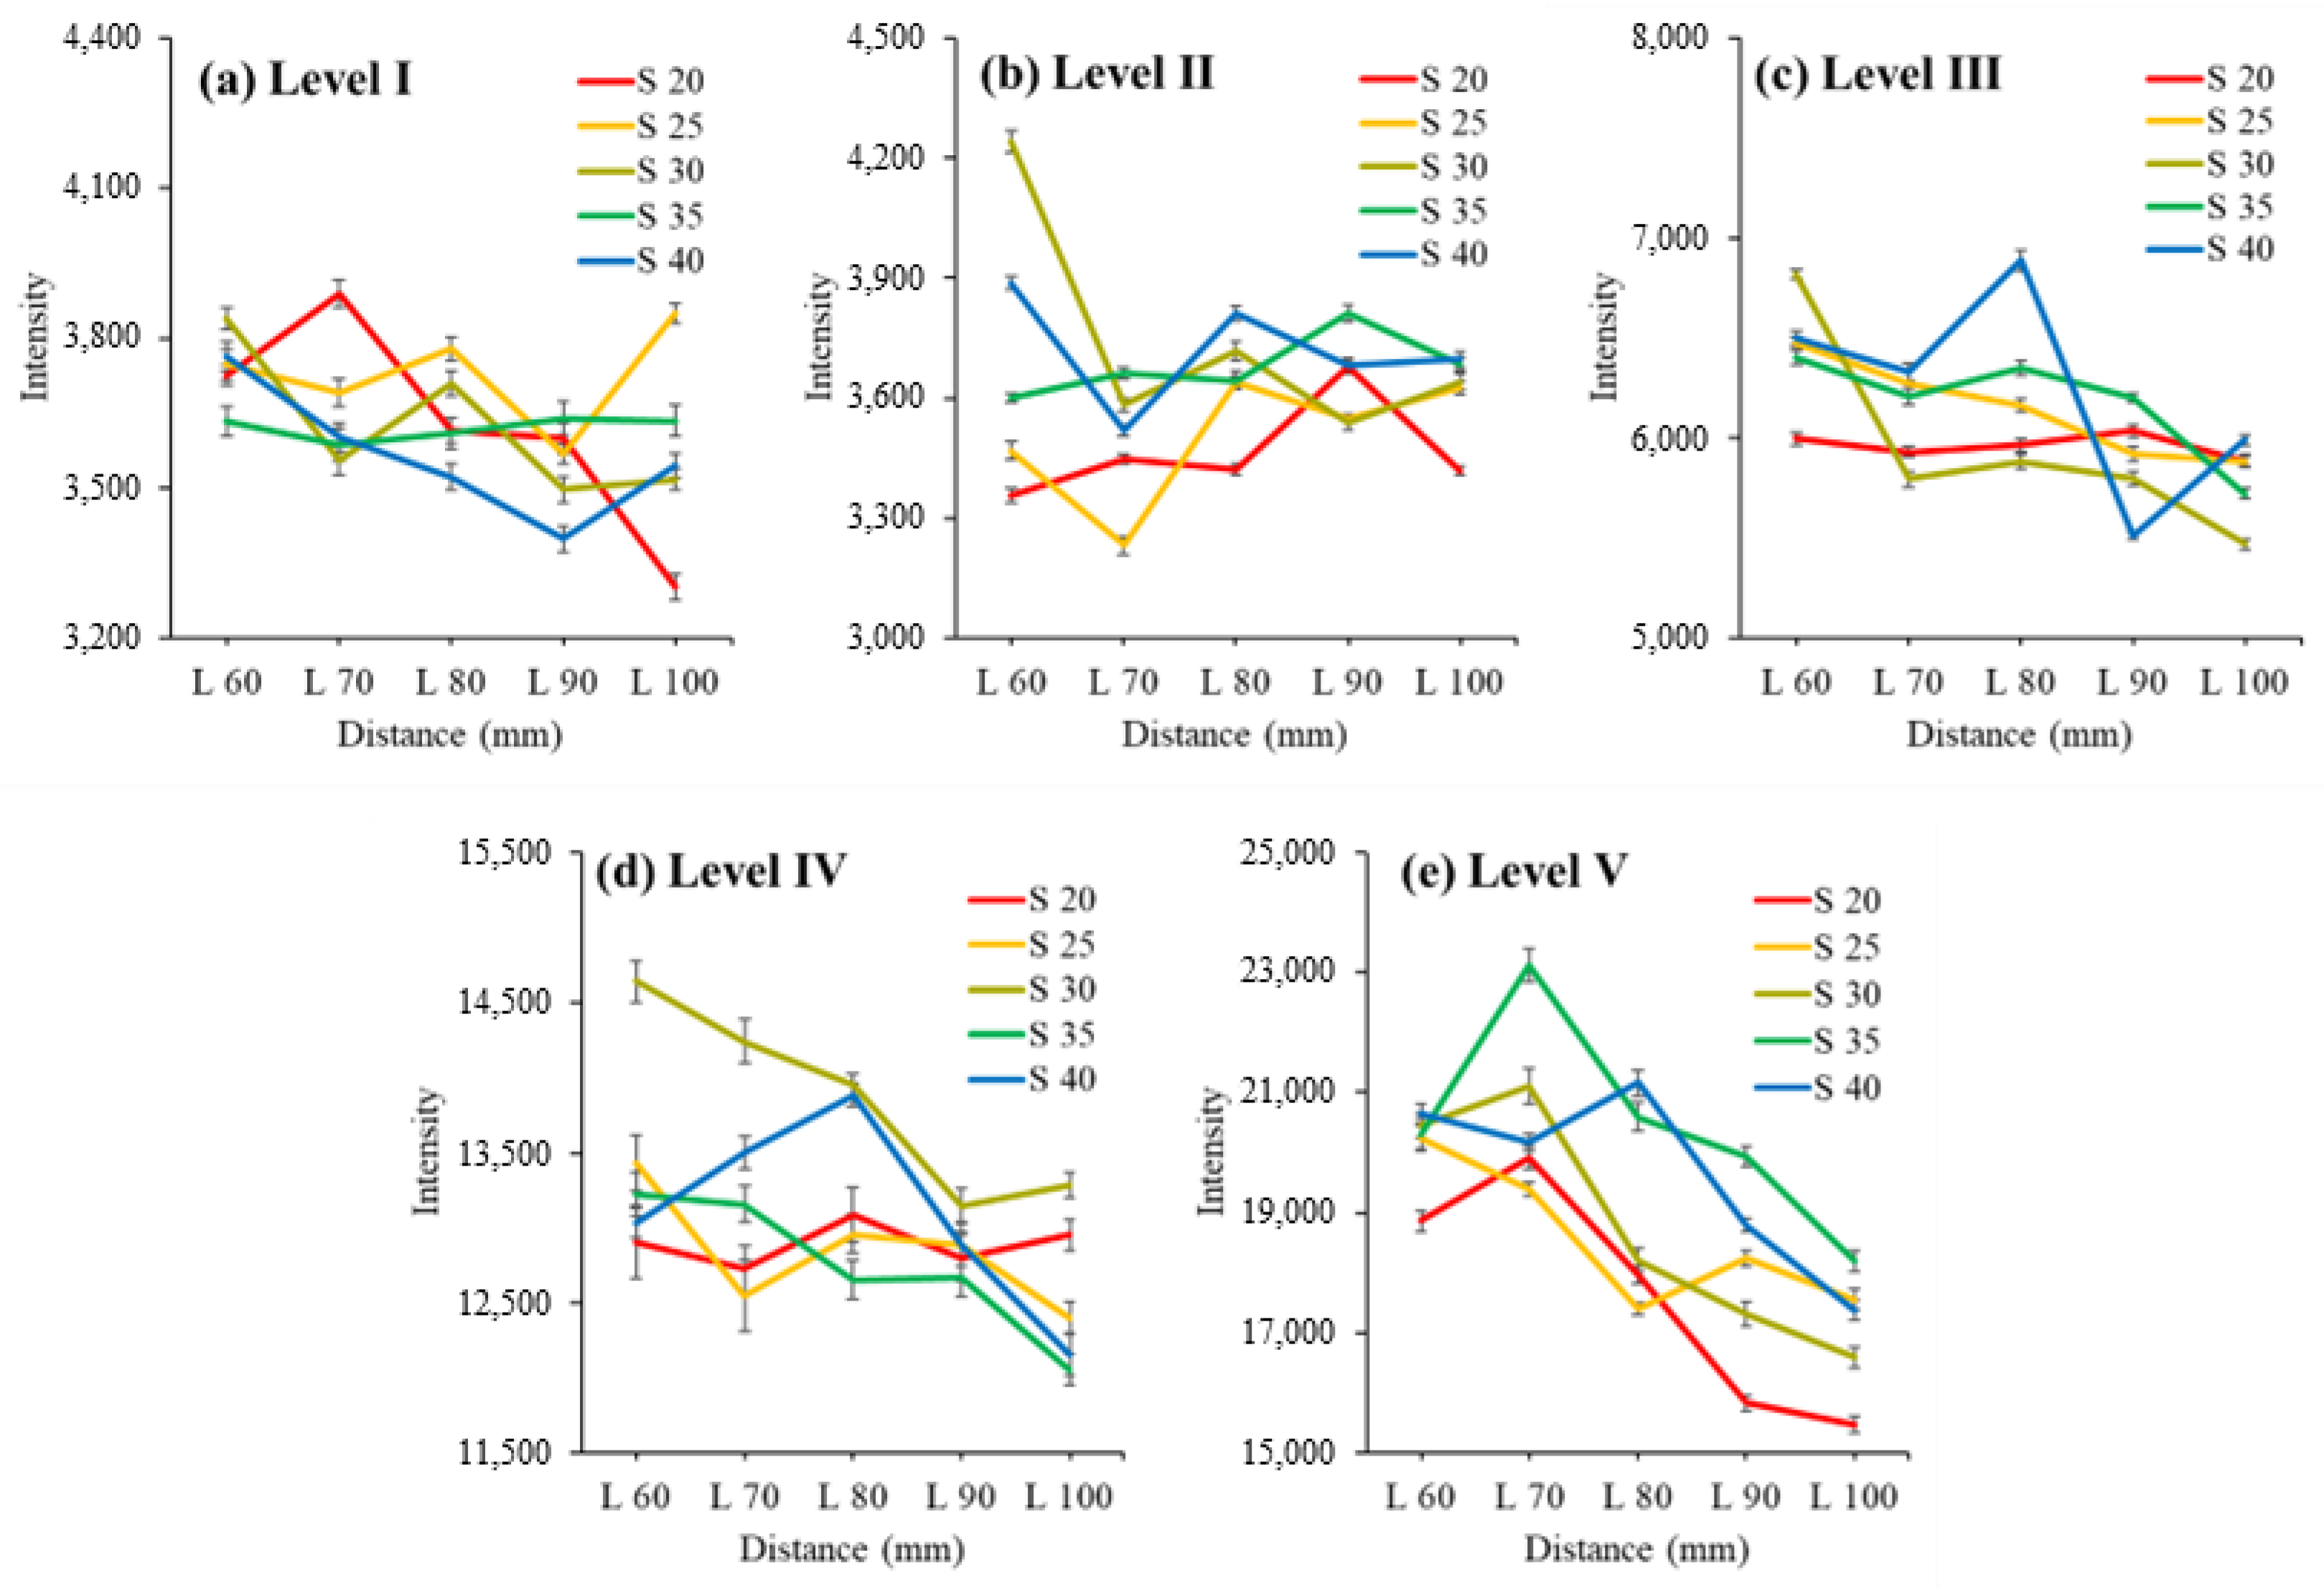
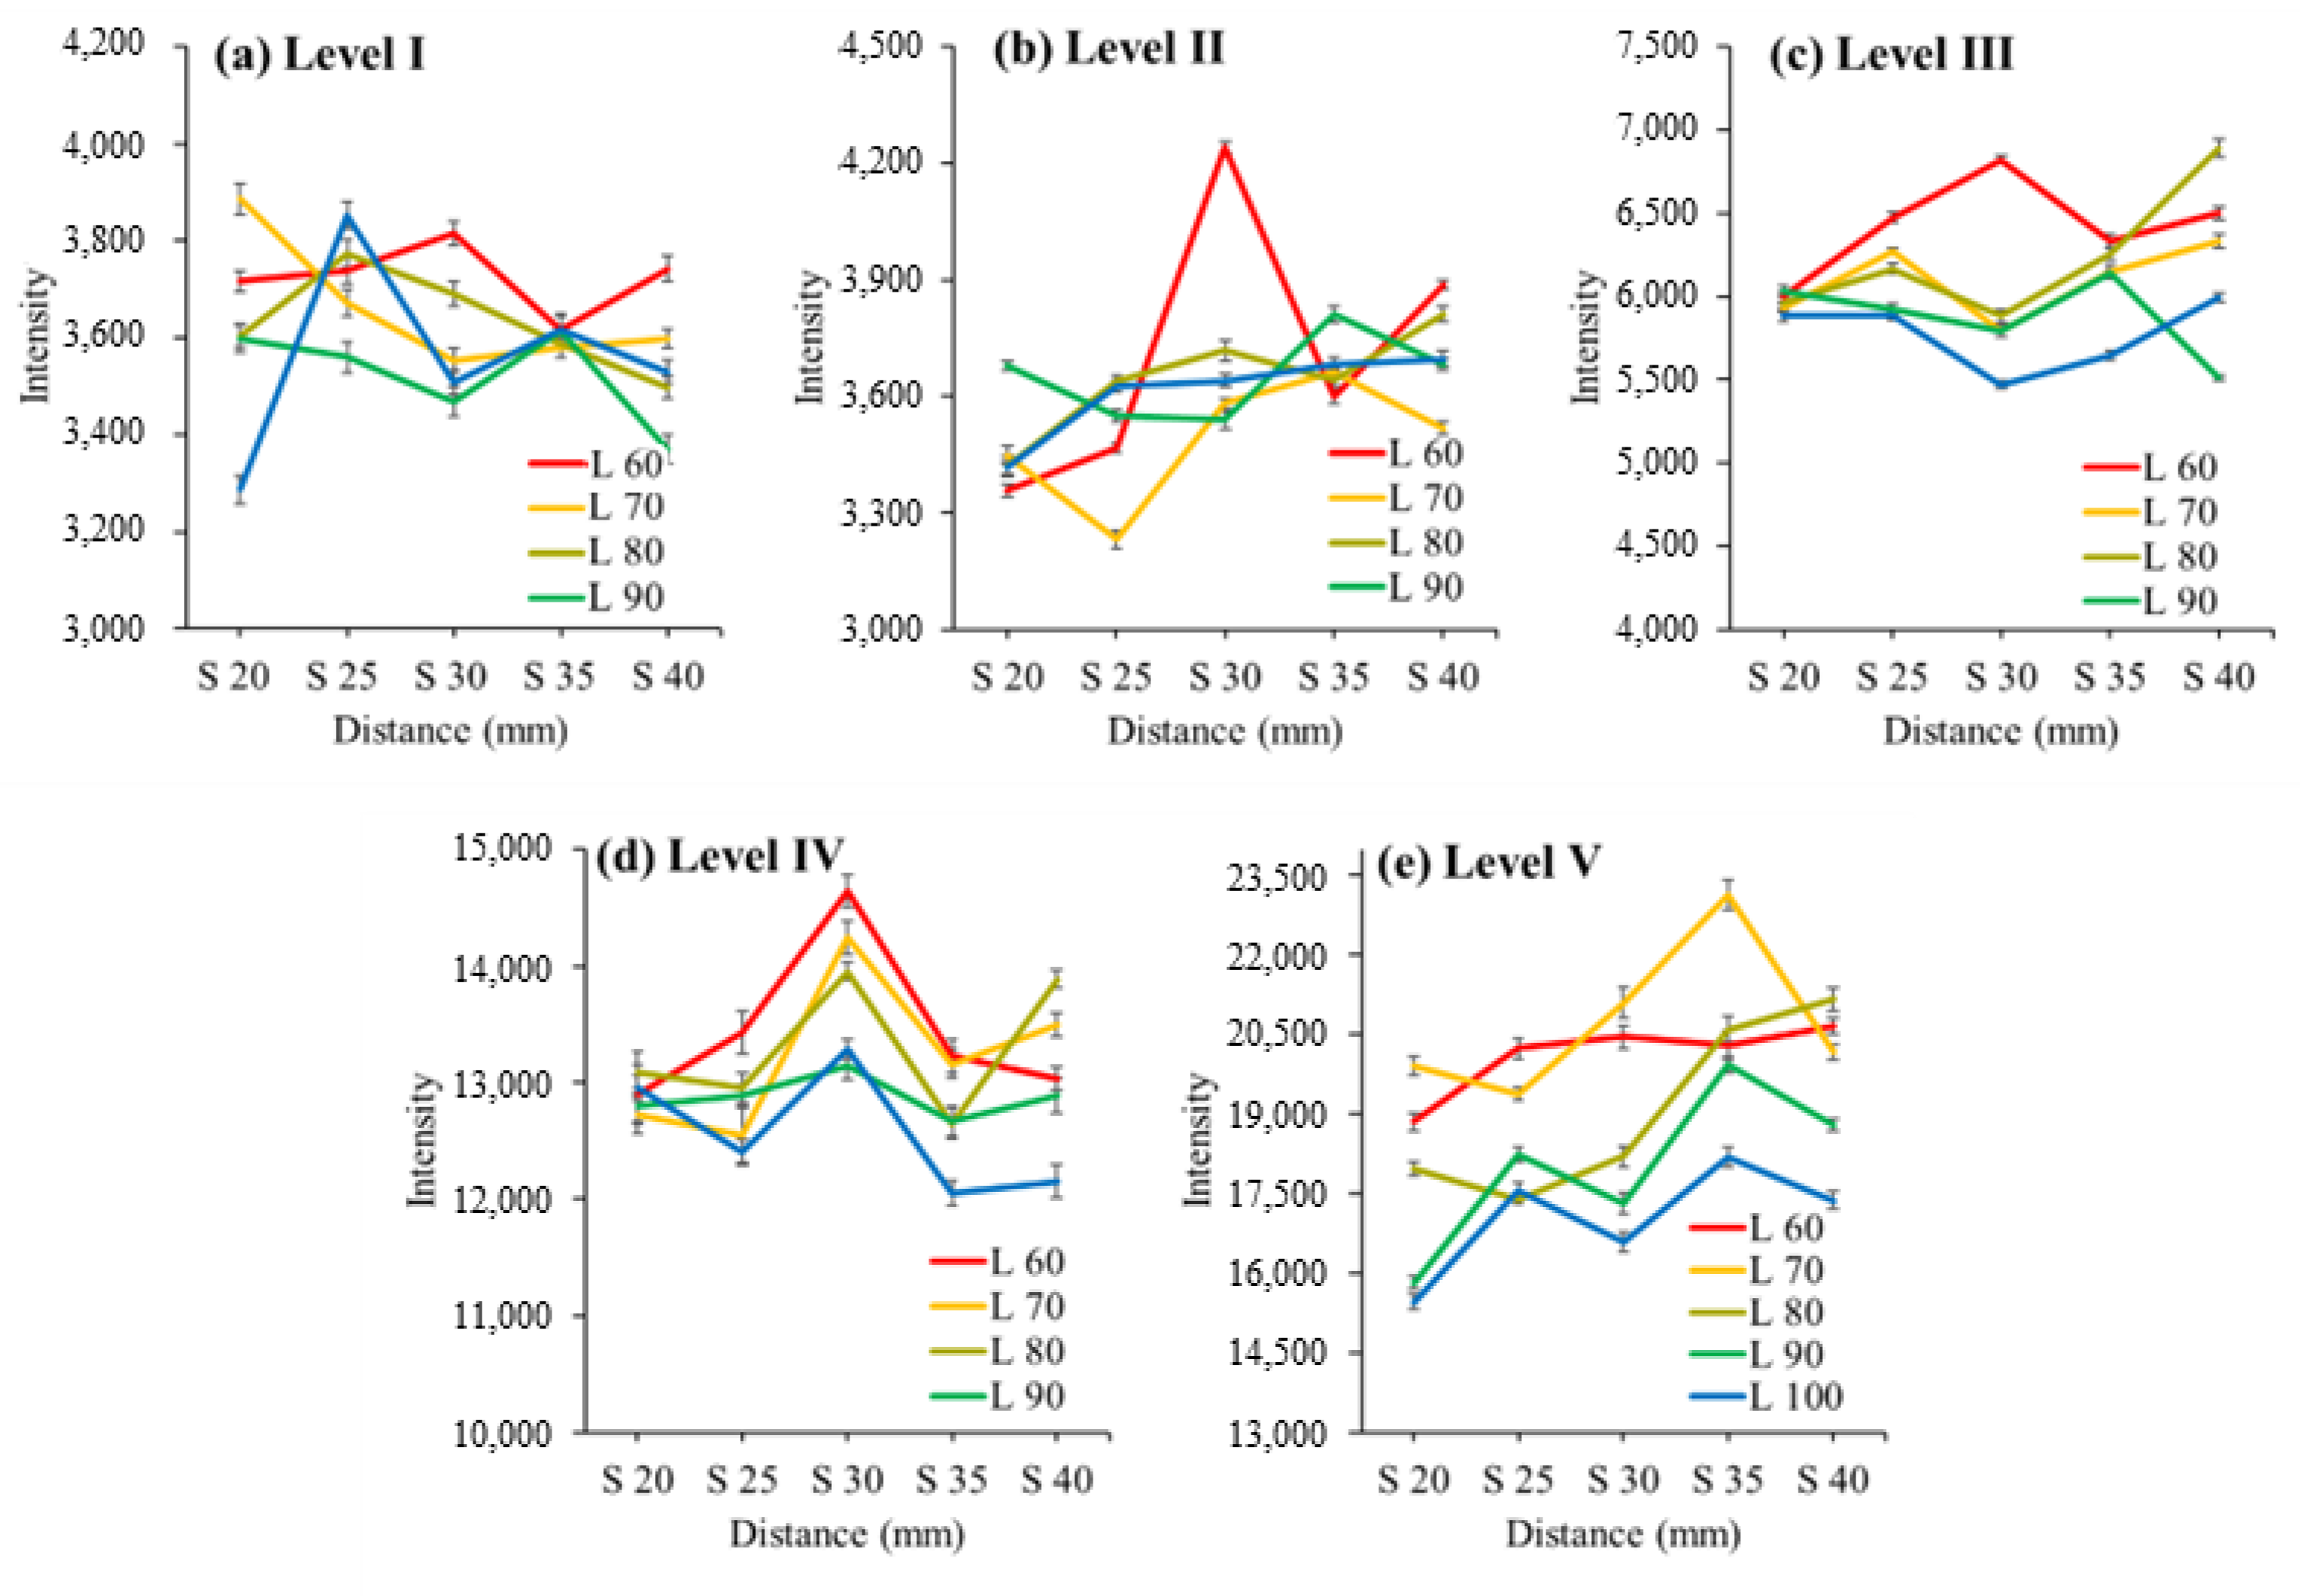
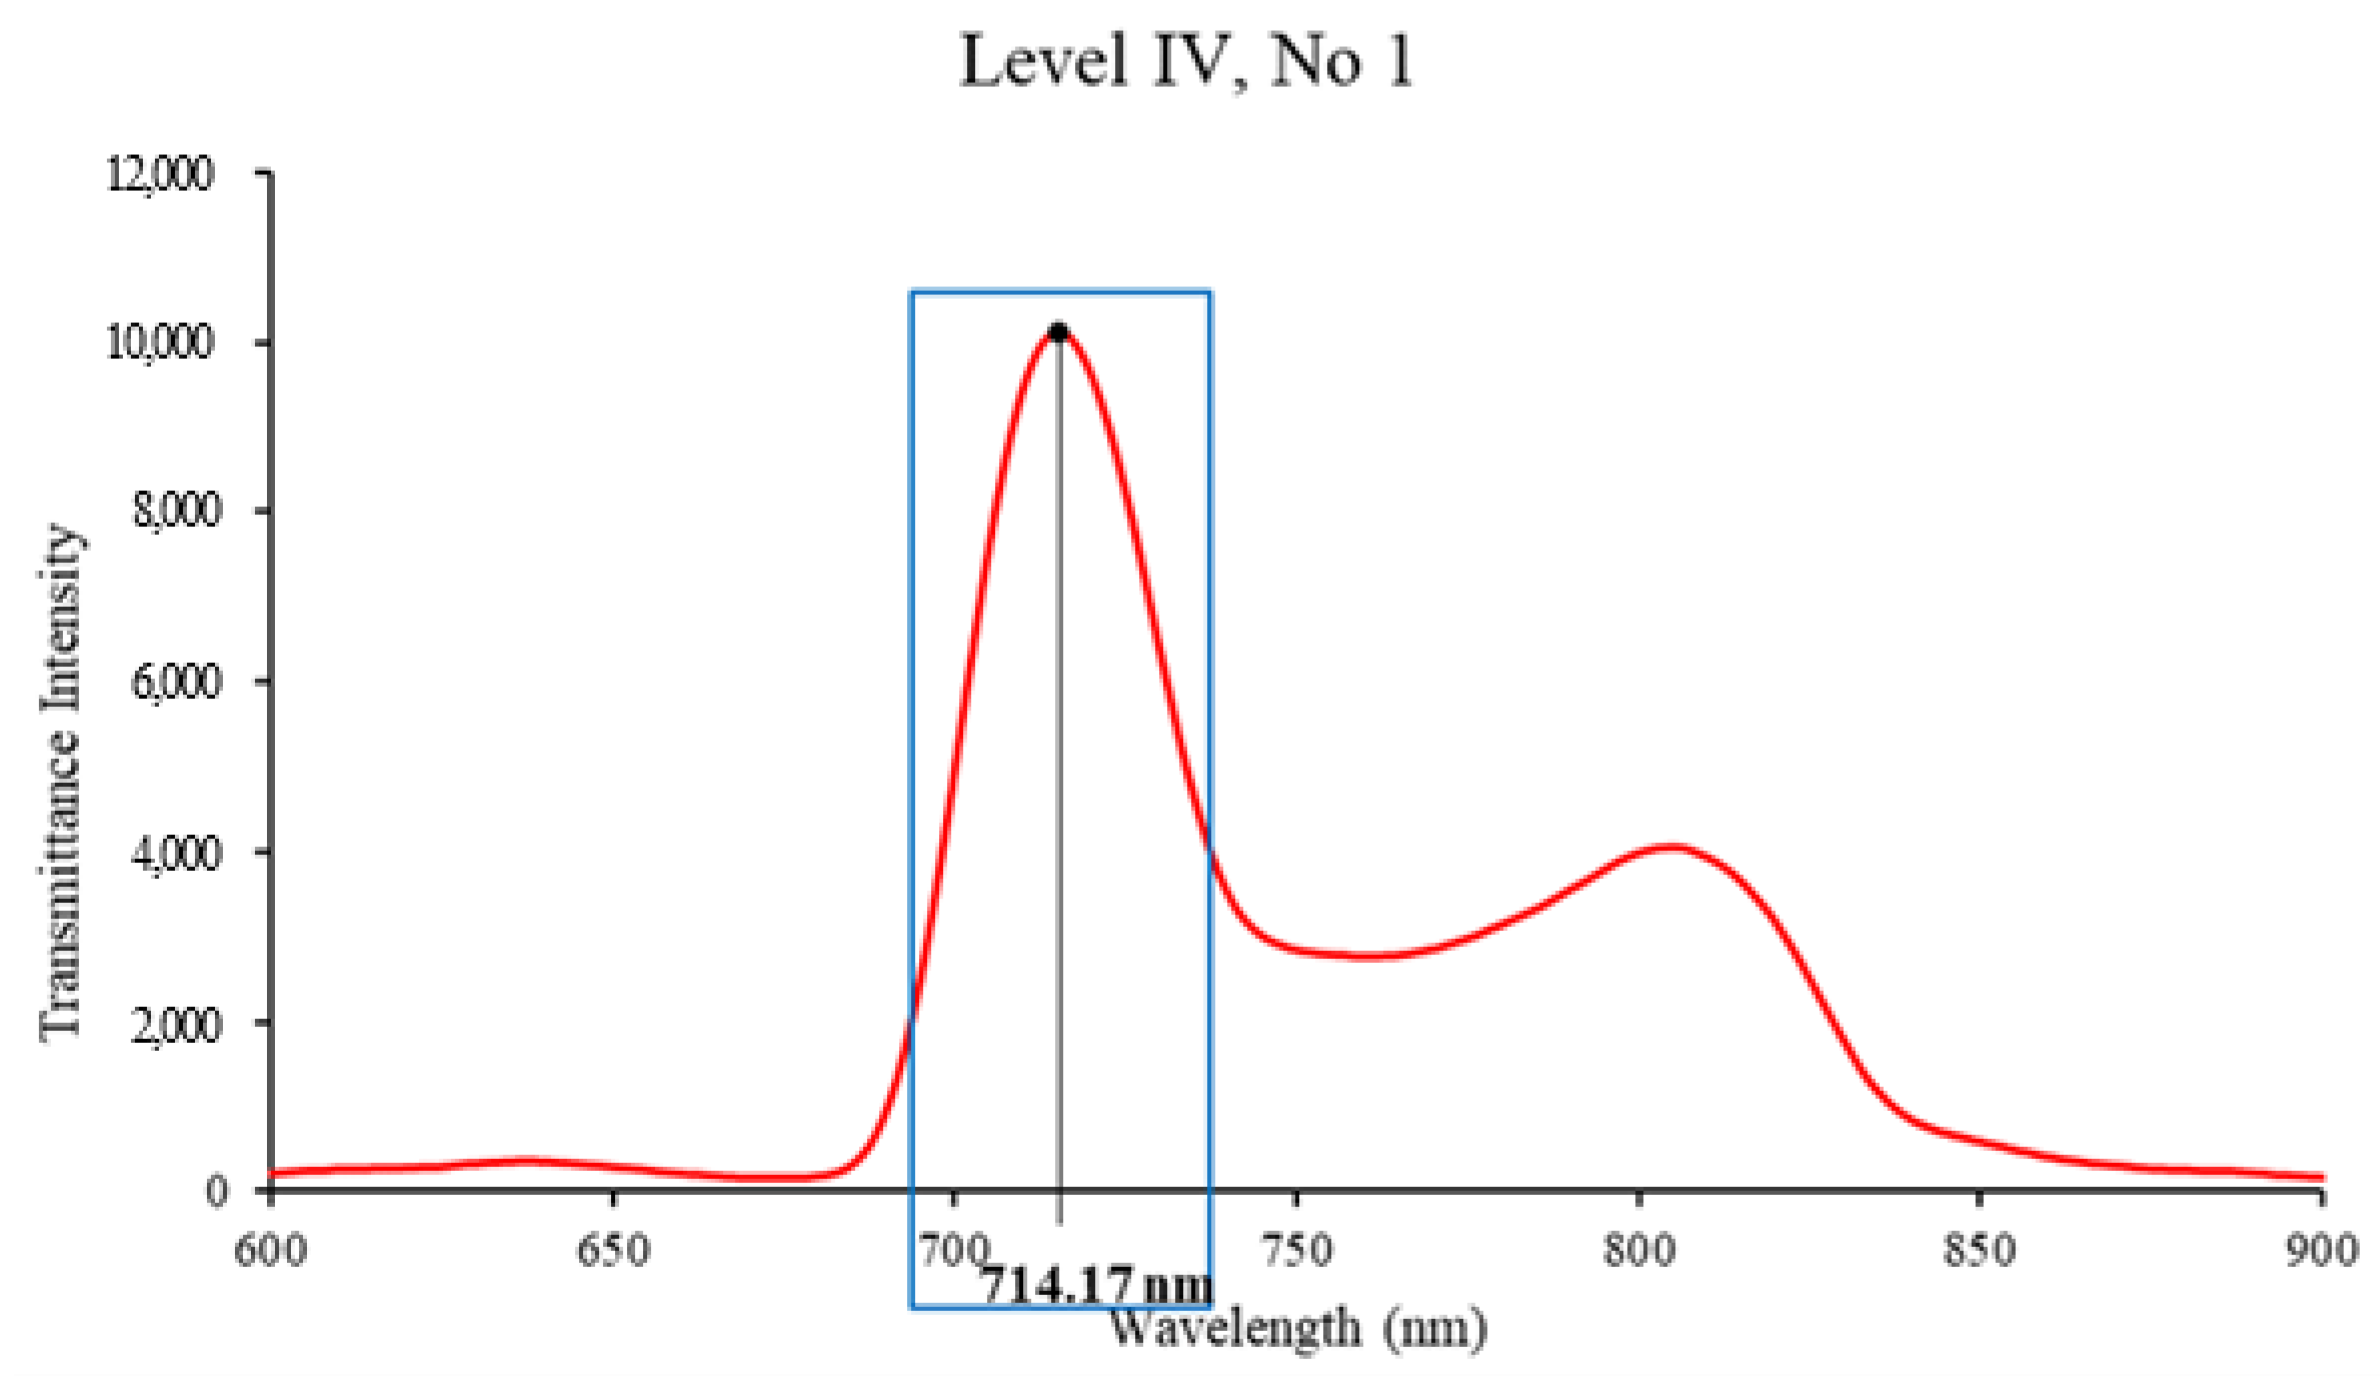
3.1. Transmittance Spectral Characteristics According to Apple Size and Light Source and Vis/NIR Sensor Distance (Experiment 1)
3.2. Selection of Appropriate Distance between Light Source and Vis/NIR Sensor According to Changes in Apple Size
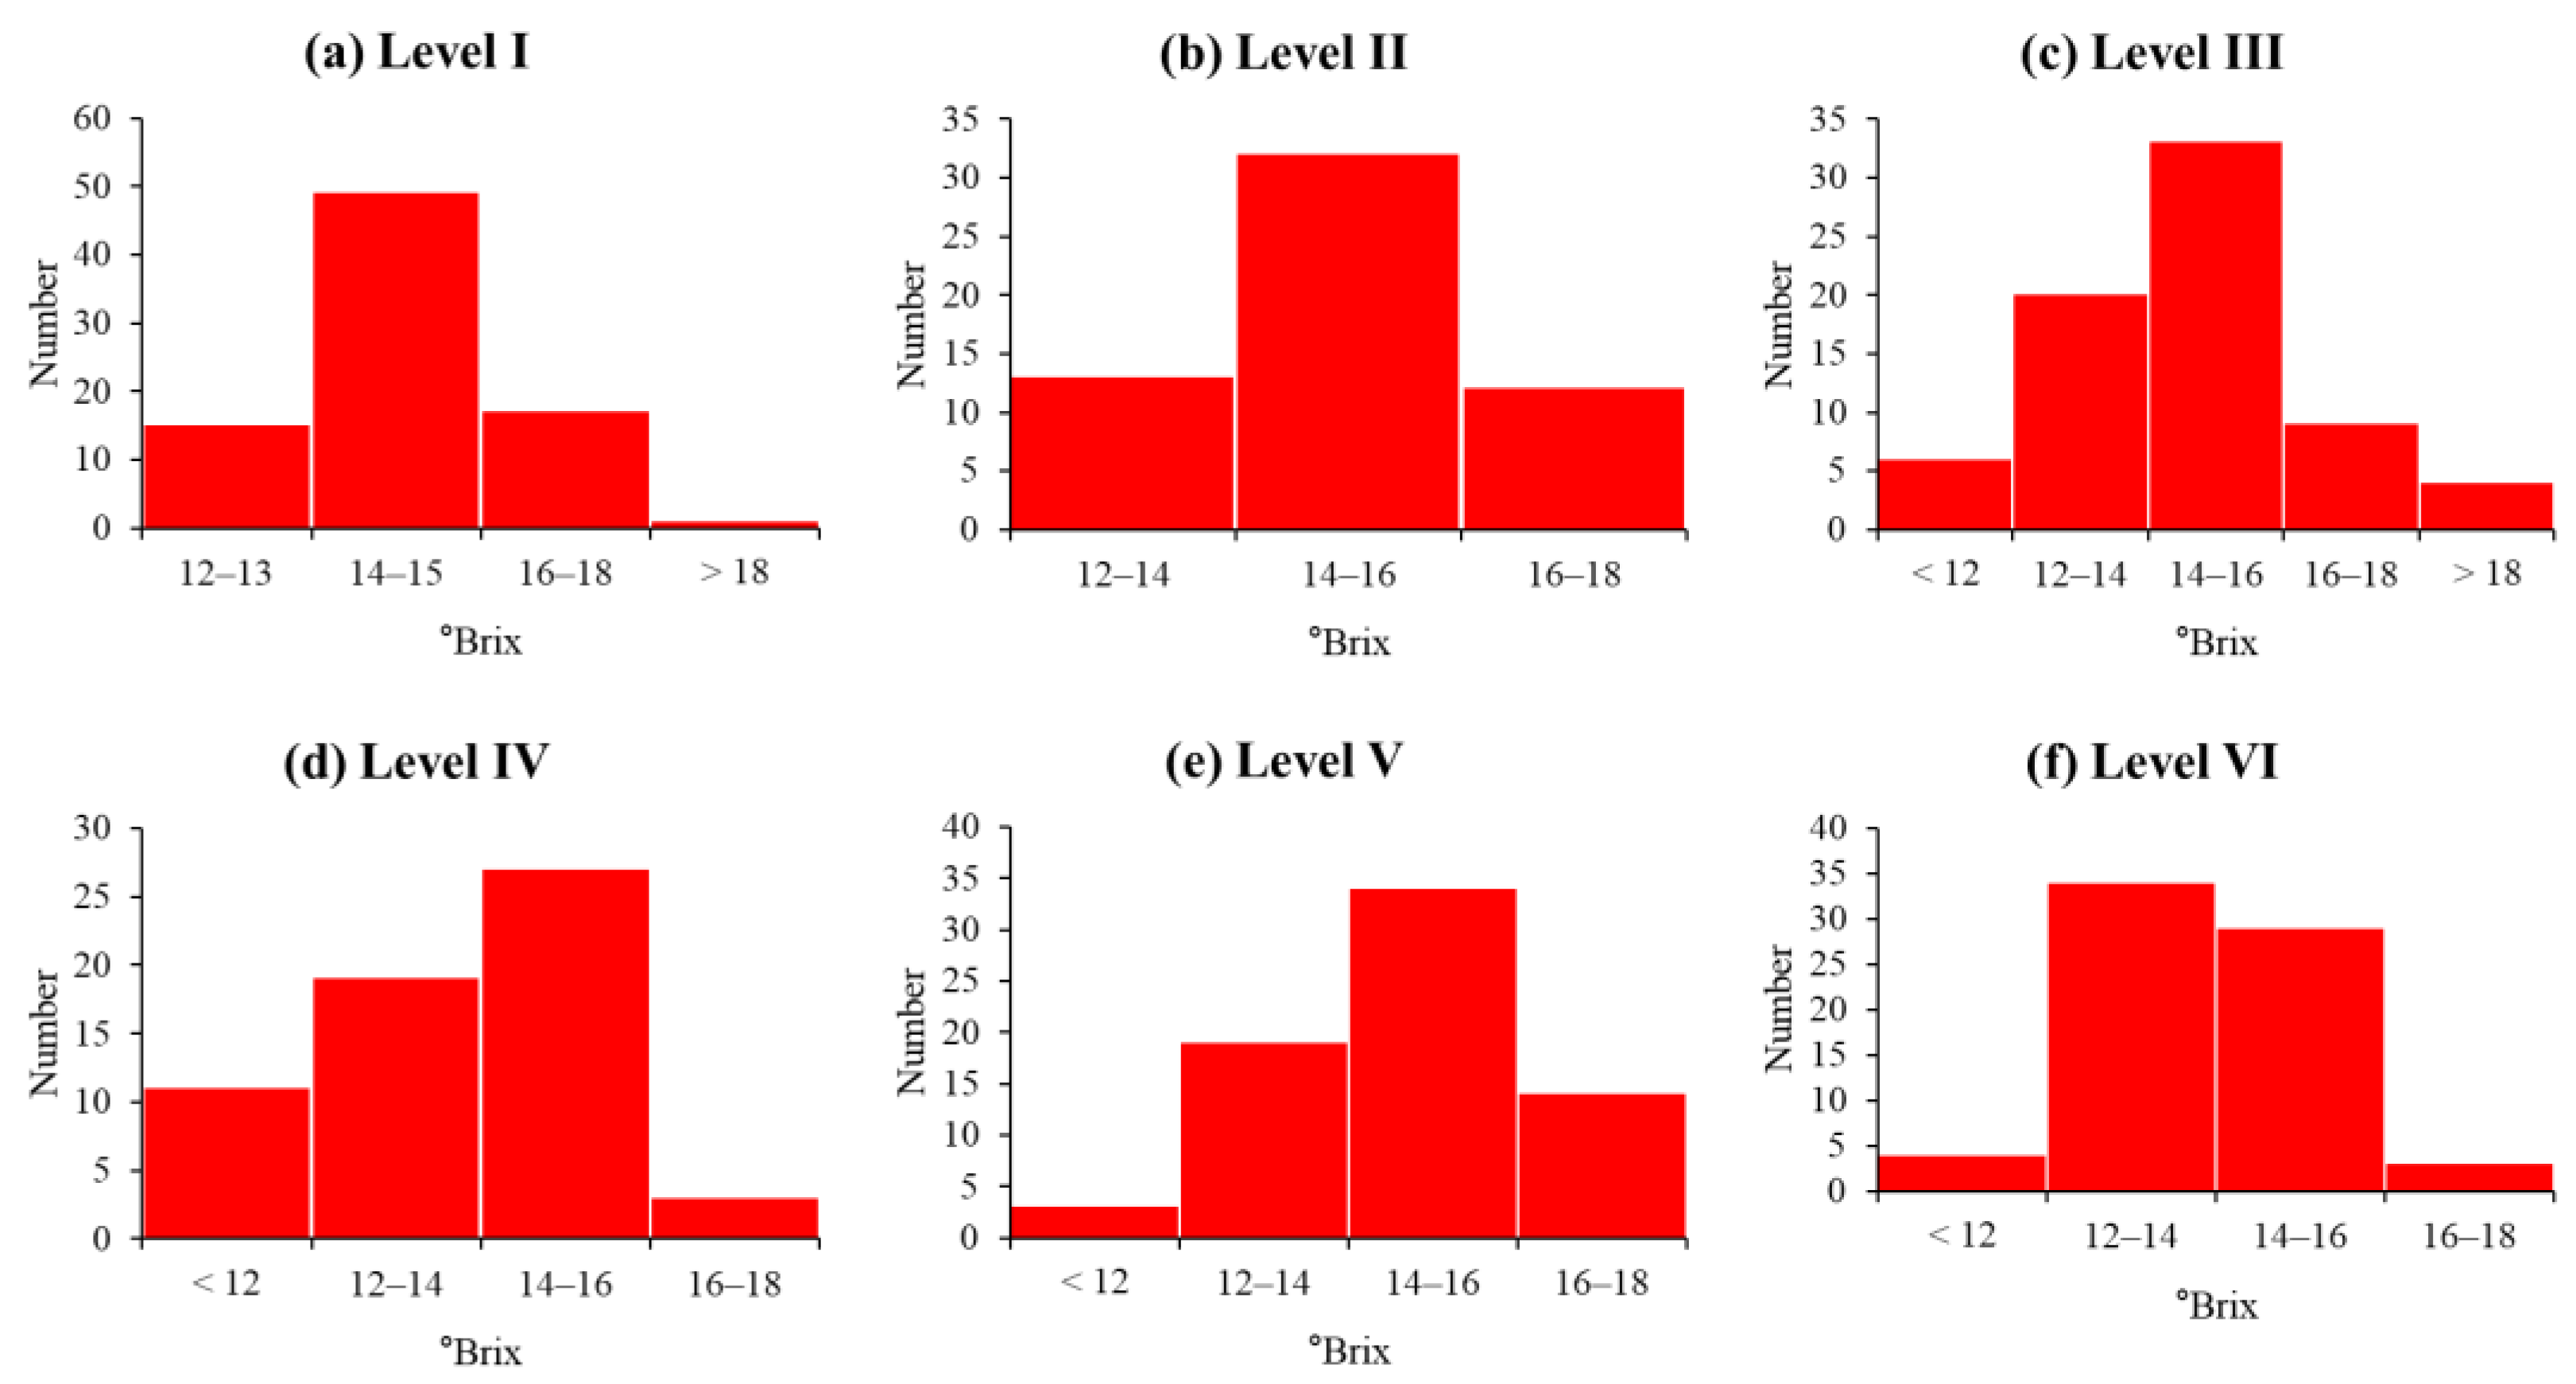
3.3. Characteristics According to Size of Apple Sample (Experiment 2)
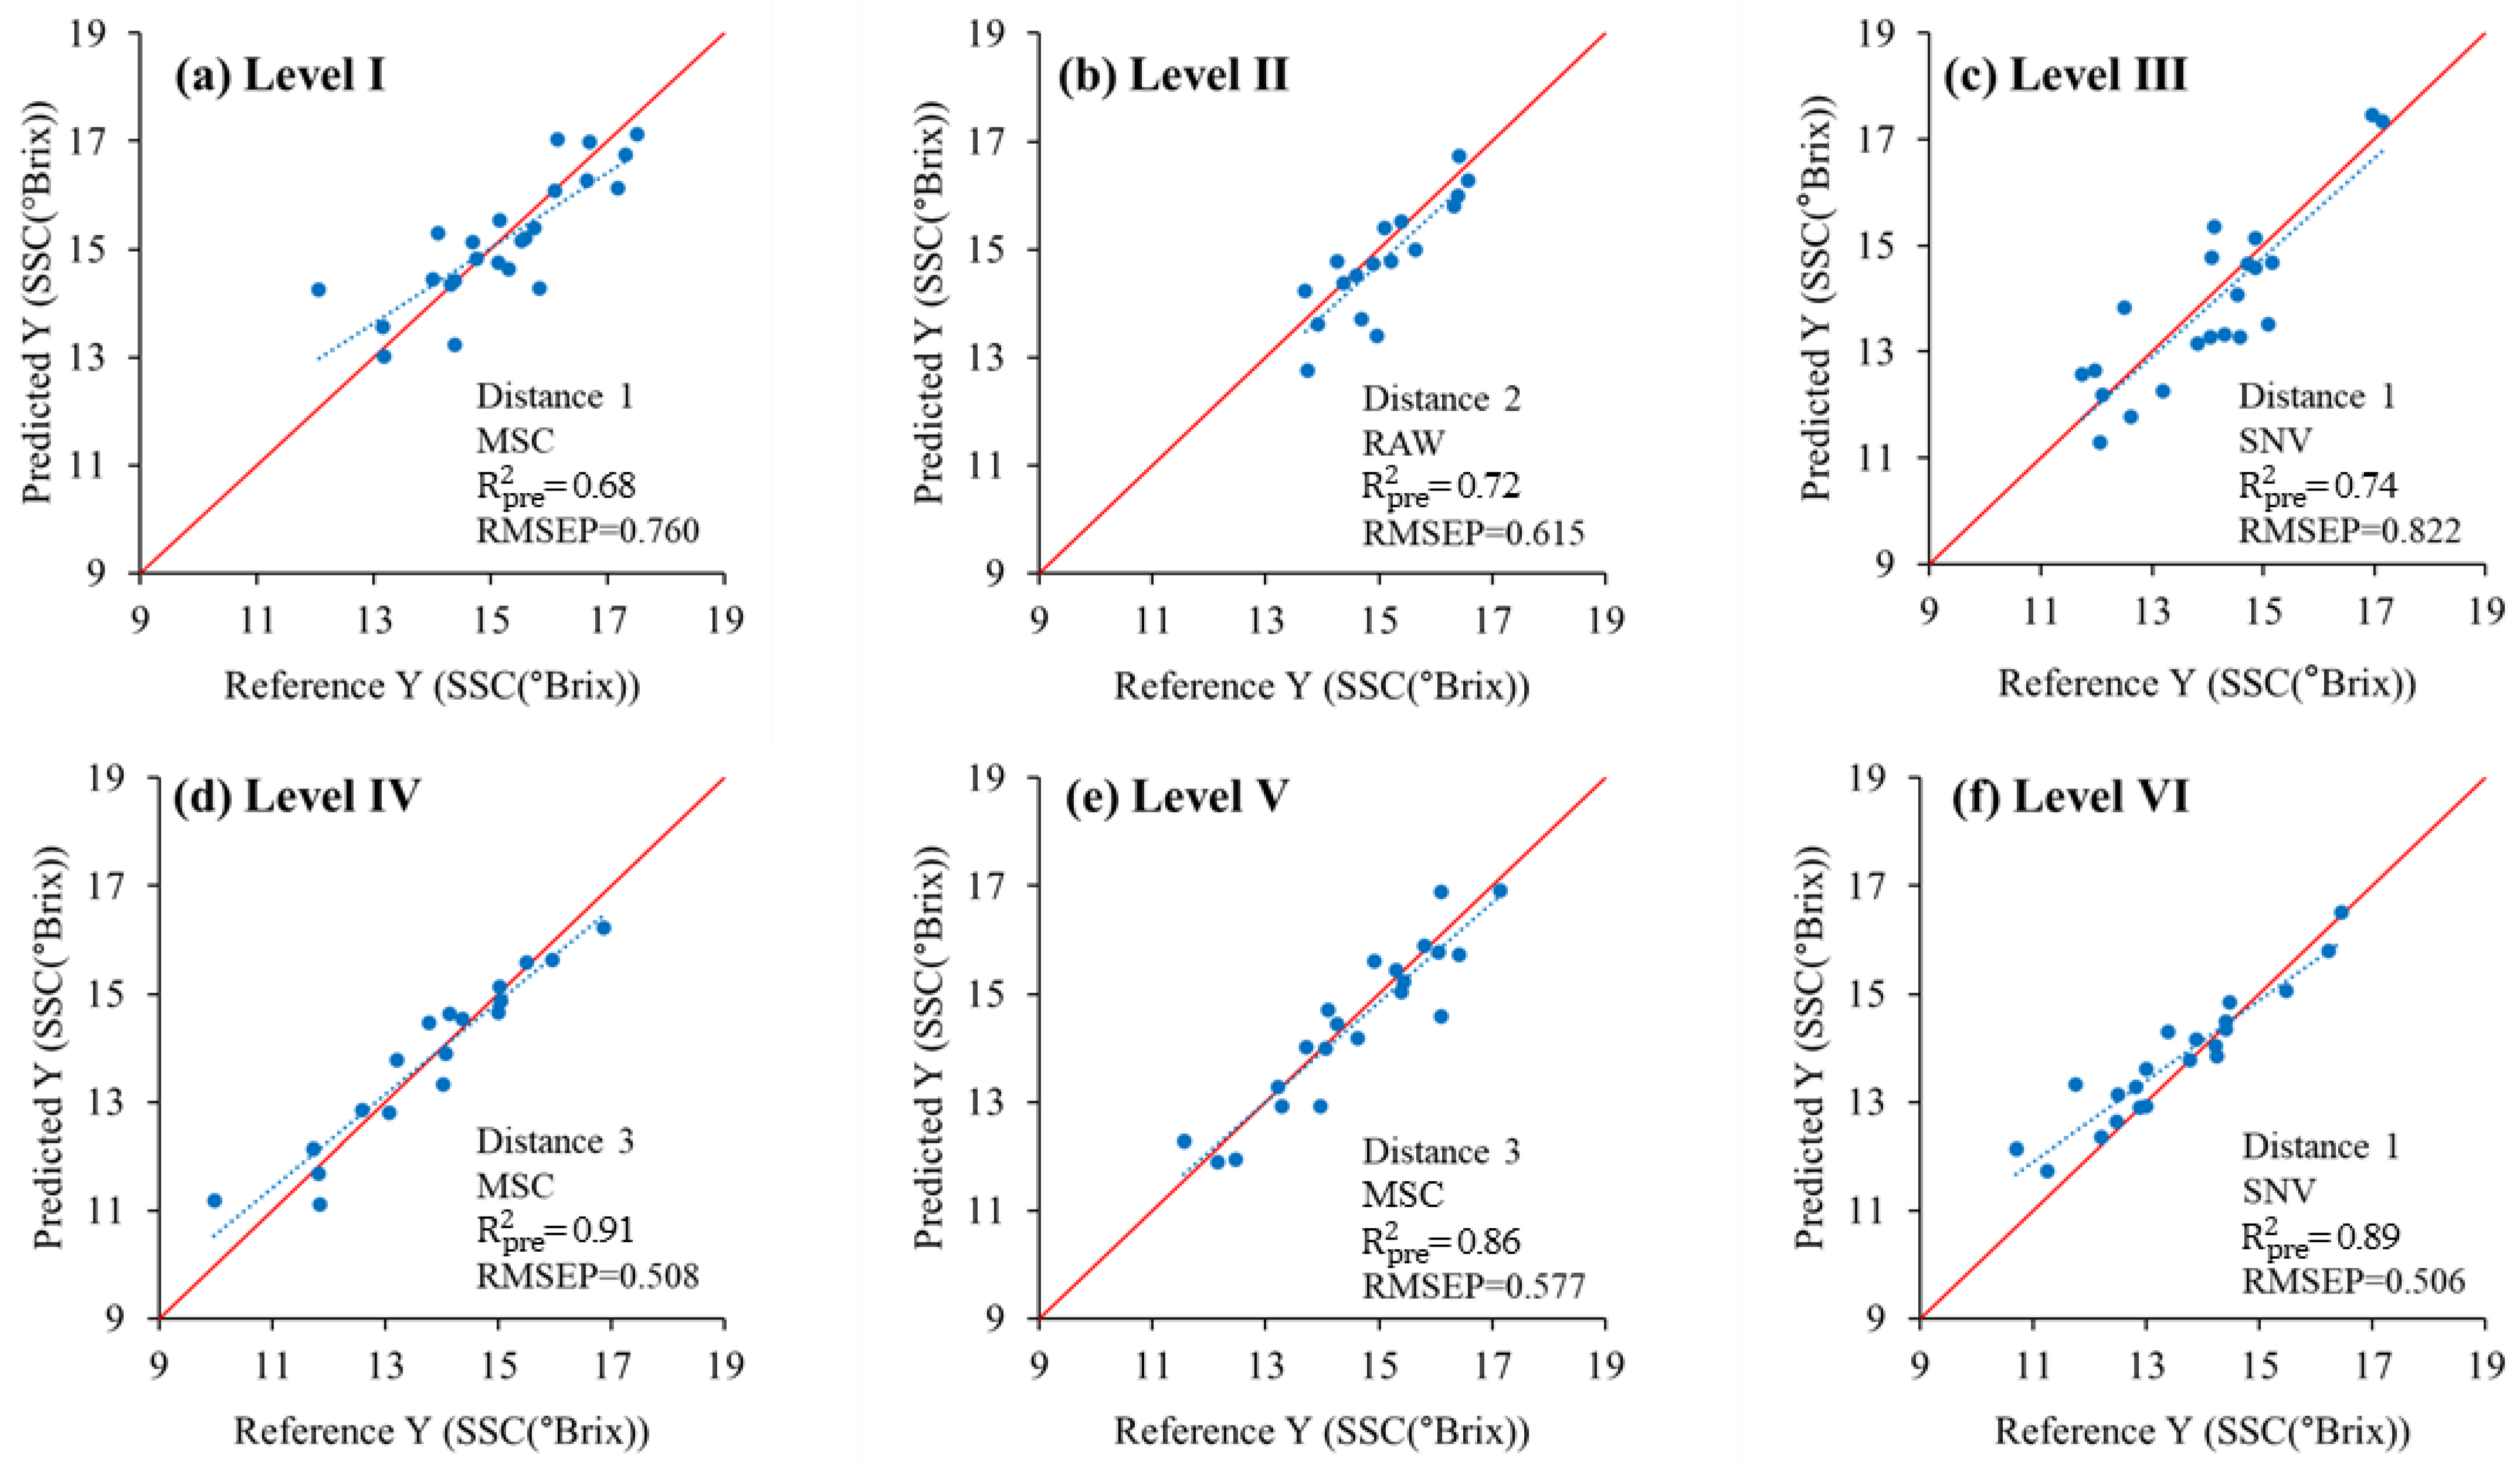
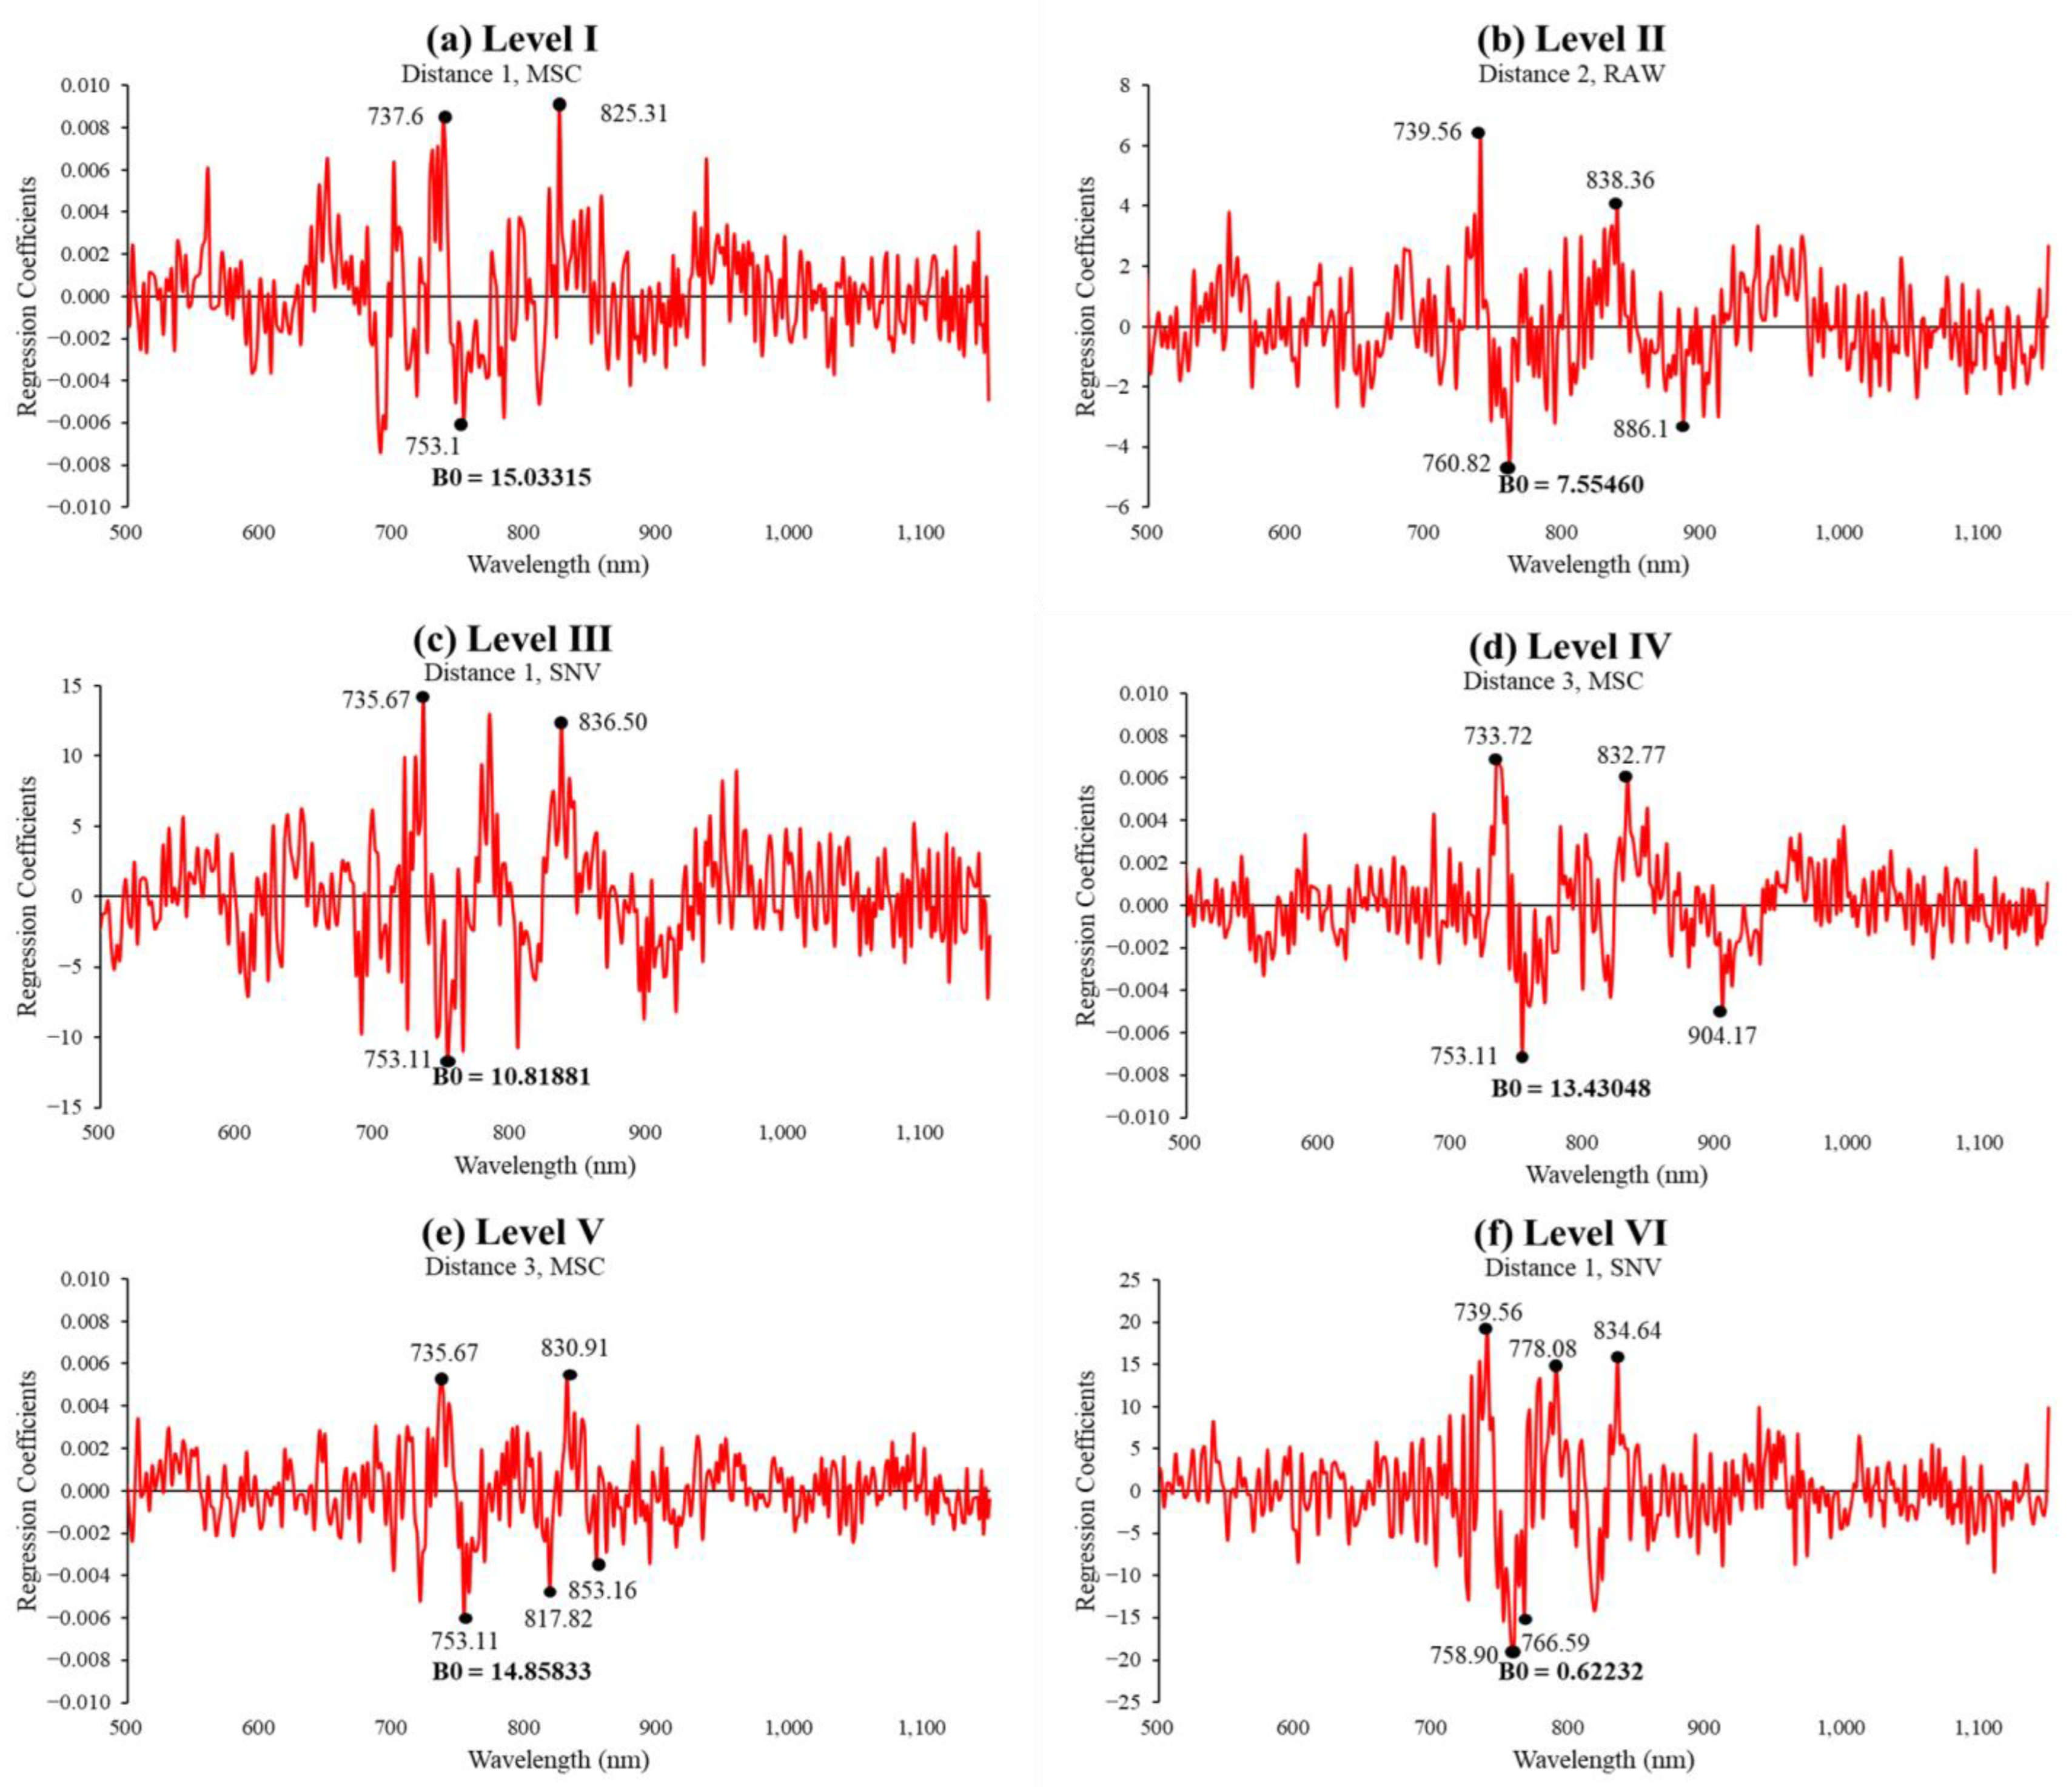
3.4. Development of SSC Prediction Model Based on Distance between Light Source and Vis/NIR Sensor
4. Conclusions
Author Contributions
Funding
Institutional Review Board Statement
Informed Consent Statement
Data Availability Statement
Conflicts of Interest
References
- Korea Rural Economic Institute. The Consumer Behavior Survey for Food 2018. (Report No. E16-2018). KREI. 2018. Available online: https://www.krei.re.kr/krei/researchReportView.do?key=67&pageType=010101&biblioId=519796&pageUnit=10&searchCnd=all&searchKrwd=&pageIndex=31&engView= (accessed on 20 October 2023).
- Korea Rural Economic Institute. The Consumer Behavior Survey for Food 2020. (Report No. E16-2020-1). KREI. 2020. Available online: https://www.krei.re.kr/krei/researchReportView.do?key=67&pageType=010101&biblioId=527882&pageUnit=10&searchCnd=all&searchKrwd=&pageIndex=10&engView= (accessed on 20 October 2023).
- Ku, K.H.; Choi, E.J.; Kim, S.S.; Jeong, M.C. Quality characteristics and sensory evaluation of Fuji apple based on commodity price. Korean J. Food Preserv. 2016, 23, 1065–1073. [Google Scholar] [CrossRef]
- Kim, B.G.; Lim, J.G. Discrimination of Internally Browned Apples Utilizing Near-Infrared Non-Destructive Fruit Sorting System. J. Korea Acad. Ind. Coop. Soc. 2021, 22, 208–213. [Google Scholar]
- Mo, C.; Kim, M.S.; Kim, G.; Lim, J.; Delwiche, S.R.; Chao, K.; Lee, H.; Cho, B.K. Spatial assessment of soluble solid contents on apple slices using hyperspectral imaging. Biosyst. Eng. 2017, 159, 10–21. [Google Scholar] [CrossRef]
- Ma, S.D. Development of Non-Destructive Sorting System for Fruits Using Near Infrared Spectroscopic. Ph.D. Thesis, The Chosun University, Gwangju, Republic of Korea, 2010. Available online: https://oak.chosun.ac.kr/handle/2020.oak/8907 (accessed on 20 October 2023).
- Yoon, J.M.; So, M.H.; Han, C.S.; Kim, H.Y. Comparison of Prediction Models of the Sugar Content for a Nondestructive Sorting System Based on Near-Infrared. In Proceedings of the KIIT Conference, Cheonan, Republic of Korea, 29−31 May 2014. [Google Scholar]
- So, M.; Han, C.S.; Kim, H.Y. Implementation of real-time SSC measurement system of fruits using the NIR. J. Korean Inst. Inf. Technol. 2020, 18, 117–125. [Google Scholar]
- Farifteh, J.; Van der Meer, F.; Atzberger, C.; Carranza, E.J.M. Quantitative analysis of salt-affected soil reflectance spectra: A comparison of two adaptive methods (PLSR and ANN). Remote Sens. Environ. 2007, 110, 59–78. [Google Scholar] [CrossRef]
- Suh, S.R.; Lee, K.H.; Yu, S.H.; Yoo, S.N.; Choi, Y.S. Comparison of performance of measuring method of VIS/NIR spectroscopic spectrum to predict soluble solids content of ‘Shingo’ Pear. J. Biosyst. Eng. 2011, 36, 130–139. [Google Scholar] [CrossRef]
- Hwang, I.G.; Noh, S.H.; Lee, H.Y.; Yang, S.B. Nondestructive Determination of the Soluble Solid and Acid Contents of Peach Using VIS/NIR Real-Time Transmission Spectra. J. KSAM 2000, 5, 457–463. [Google Scholar]
- Kawano, S.; Fujiwara, T.; Iwamoto, M. Nondestructive determination of sugar content in satsuma mandarin using near infrared (NIR) transmittance. J. Jpn. Soc. Hortic. Sci. 1993, 62, 465–470. [Google Scholar] [CrossRef]
- Xia, Y.; Fan, S.; Li, J.; Tian, X.; Huang, W.; Chen, L. Optimization and comparison of models for prediction of soluble solids content in apple by online Vis/NIR transmission coupled with diameter correction method. Chemom. Intell. Lab. Syst. 2020, 201, 104017. [Google Scholar] [CrossRef]
- Shin, H.S. Development of Models to Predict Sugar Content of Melon Using Spectroscopic Analysis. Master’s Thesis, The Chonnam University, Gwangju, Republic of Korea, 2011. Available online: http://www.riss.kr/link?id=T12380671 (accessed on 20 October 2023).
- Luo, C.; Xue, L.; Liu, M.; Li, J.; Wang, X. Nondestructive Measurement of Sugar Content in Navel Orange Based on Vis-NIR Spectroscopy. In International Conference on Computer and Computing Technologies in Agriculture; Springer: Berlin/Heidelberg, Germany, 2010. [Google Scholar]
- Tian, X.; Fan, S.; Li, J.; Xia, Y.; Huang, W.; Zhao, C. Comparison and optimization of models for SSC on-line determination of intact apple using efficient spectrum optimization and variable selection algorithm. Infrared Phys. Technol. 2019, 102, 102979. [Google Scholar] [CrossRef]
- Lee, A.; Shim, J.; Kim, B.; Lee, H.; Lim, J. Non-destructive prediction of soluble solid contents in Fuji apples using visible near-infrared spectroscopy and various statistical methods. J. Food Eng. 2022, 321, 110945. [Google Scholar] [CrossRef]
- Guo, Z.; Wang, M.; Agyekum, A.A.; Wu, J.; Chen, Q.; Zuo, M.; El-Seedi, H.R.; Tao, F.; Shi, J.; Ouyang, Q.; et al. Quantitative detection of apple watercore and soluble solids content by near infrared transmittance spectroscopy. J. Food Eng. 2020, 279, 109955. [Google Scholar] [CrossRef]
- Xia, Y.; Fan, S.; Tian, X.; Huang, W.; Li, J. Multi-factor fusion models for soluble solid content detection in pear (Pyrus bretschneideri ‘Ya’) using Vis/NIR online half-transmittance technique. Infrared Phys. Technol. 2020, 110, 103443. [Google Scholar] [CrossRef]
- Tian, X.; Fan, S.; Li, J.; Huang, W.; Chen, L. An optimal zone combination model for on-line nondestructive prediction of soluble solids content of apple based on full-transmittance spectroscopy. Biosyst. Eng. 2020, 197, 64–75. [Google Scholar] [CrossRef]
- Golic, M.; Walsh, K.; Lawson, P. Short-wavelength near-infrared spectra of sucrose, glucose, and fructose with respect to sugar concentration and temperature. Appl. Spectrosc. 2003, 57, 139–145. [Google Scholar] [CrossRef]
- Zhang, B.; Zhang, M.; Shen, M.; Li, H.; Zhang, H.; Zhao, J. Prediction of Soluble Solids Content During Storage of Apples with Different Maturity Based on VIS/NIR Spectroscopy. In Proceedings of the 2020 ASABE Annual International Virtual Meeting, Online, 13–15 July 2020; American Society of Agricultural and Biological Engineers: Saint Joseph, MI, USA, 2020; p. 1. [Google Scholar]
- Jiang, X.; Zhu, M.; Yao, J.; Zhang, Y.; Liu, Y. Study on the effect of apple size difference on soluble solids content model based on near-infrared (NIR) spectroscopy. J. Spectrosc. 2022, 2022, 3740527. [Google Scholar] [CrossRef]


| Level | 3 | 4 | 5 | 6 | 7 | 8 |
|---|---|---|---|---|---|---|
| Weight (g) | 375 ≥ | 300 ≥ | 250 ≥ | 214 ≥ | 188 ≥ | 167 ≥ |
| 375 < | 300 < | 250 < | 214 < | 188 < |
| Level | |||||||
|---|---|---|---|---|---|---|---|
| I | II | III | IV | V | VI | ||
| Experiment 1 | Number of samples (n) | 3 | 3 | 3 | 3 | 3 | - |
| Average weight (g) | 390 | 325 | 292 | 240 | 197 | - | |
| Average of maximum diameter (mm) | 106.59 | 103.32 | 94.43 | 86.74 | 80.71 | - | |
| Average height (mm) | 84.99 | 82.37 | 75.33 | 73.2 | 66.1 | - | |
| Experiment 2 | Number of samples (n) | 82 | 57 | 72 | 60 | 70 | 70 |
| Average weight (g) | 398 | 318 | 285 | 223 | 195 | 182 | |
| Average of maximum diameter (mm) | 99.16 | 90.17 | 88.23 | 80.80 | 78.92 | 75.63 | |
| Average height (mm) | 86.78 | 83.07 | 79.64 | 73.96 | 70.32 | 68.90 | |
| Range I | Range II | Range III | Full Range | |||
|---|---|---|---|---|---|---|
| Distance between light and apple (mm) | 60–80 | 70–90 | 80–100 | 60–100 | ||
| Range ii | Range ii | Full Range | ||||
| Distance between apple and Vis/NIR sensor (mm) | 20–35 | 25–40 | 20–40 | |||
| Level I–V CV (%) Average (Ranking) | Distance between Apple and NIR Sensor (mm) | |||
|---|---|---|---|---|
| Range i | Range ii | Full Range | ||
| (20–35) | (25–40) | (20–40) | ||
| Distance between light and apple (mm) | Range I | 5.275 | 5.057 | 5.160 |
| (60–80) | (9) | (6) | (8) | |
| Range II | 4.806 | 5.025 | 5.150 | |
| (70–90) | (3) | (5) | (7) | |
| Range III | 4.457 | 4.760 | 5.022 | |
| (80–100) | (1) | (2) | (4) | |
| Full Range | 5.764 | 5.651 | 5.799 | |
| (60–100) | (11) | (10) | (12) | |
| Level | |||||||
|---|---|---|---|---|---|---|---|
| I | II | III | IV | V | VI | ||
| Number of samples (Dataset) | Calibration | 58 | 40 | 51 | 42 | 49 | 49 |
| Prediction | 24 | 17 | 21 | 18 | 21 | 21 | |
| Total | 82 | 57 | 72 | 60 | 70 | 70 | |
| Number of Spectra | Calibration | 232 | 160 | 204 | 168 | 196 | 196 |
| Prediction | 96 | 68 | 84 | 72 | 84 | 84 | |
| Total | 328 | 228 | 288 | 240 | 280 | 280 | |
| SSC (°Brix) | Avg. 1 | 15.10 | 14.93 | 14.38 | 13.68 | 14.57 | 13.86 |
| SD 2 | 1.31 | 1.06 | 1.80 | 1.77 | 1.51 | 1.21 | |
| Level I | Preprocessing | Factor | Calibration | Prediction | ||
|---|---|---|---|---|---|---|
| Cal.: 58, Pre.: 24 | RMSEC (°Brix) | RMSEV (°Brix) | ||||
| Distance 1 | MSC | 10 | 0.90 | 0.414 | 0.68 | 0.769 |
| Distance 2 | SNV | 11 | 0.90 | 0.413 | 0.61 | 0.861 |
| Distance 3 | SNV | 11 | 0.81 | 0.562 | 0.58 | 0.895 |
| Level II | Preprocessing | Factor | Calibration | Prediction | ||
| Cal.: 40, Pre.: 17 | RMSEC (°Brix) | RMSEV (°Brix) | ||||
| Distance 1 | Raw | 13 | 0.97 | 0.202 | 0.70 | 0.619 |
| Distance 2 | Raw | 13 | 0.96 | 0.223 | 0.72 | 0.615 |
| Distance 3 | Raw | 11 | 0.93 | 0.301 | 0.66 | 0.738 |
| Level III | Preprocessing | Factor | Calibration | Prediction | ||
|---|---|---|---|---|---|---|
| Cal.: 51, Pre.: 21 | RMSEC (°Brix) | RMSEV (°Brix) | ||||
| Distance 1 | SNV | 15 | 0.99 | 0.142 | 0.74 | 0.822 |
| Distance 2 | Normalization (Mean) | 12 | 0.96 | 0.358 | 0.72 | 0.851 |
| Distance 3 | SNV | 12 | 0.96 | 0.398 | 0.71 | 0.919 |
| Level IV | Preprocessing | Factor | Calibration | Prediction | ||
|---|---|---|---|---|---|---|
| Cal.: 42, Pre.: 18 | RMSEC (°Brix) | RMSEV (°Brix) | ||||
| Distance 1 | Normalization (Maximum) | 11 | 0.97 | 0.319 | 0.85 | 0.705 |
| Distance 2 | Normalization (Range) | 11 | 0.93 | 0.467 | 0.86 | 0.772 |
| Distance 3 | MSC | 12 | 0.99 | 0.195 | 0.91 | 0.508 |
| Level V | Preprocessing | Factor | Calibration | Prediction | ||
|---|---|---|---|---|---|---|
| Cal.: 49, Pre.: 21 | RMSEC (°Brix) | RMSEV (°Brix) | ||||
| Distance 1 | Normalization (Range) | 14 | 0.97 | 0.251 | 0.80 | 0.730 |
| Distance 2 | Normalization (Mean) | 14 | 0.98 | 0.199 | 0.76 | 0.784 |
| Distance 3 | MSC | 11 | 0.90 | 0.487 | 0.86 | 0.577 |
| Level VI | Preprocessing | Factor | Calibration | Prediction | ||
|---|---|---|---|---|---|---|
| Cal.: 49, Pre.: 21 | RMSEC (°Brix) | RMSEV (°Brix) | ||||
| Distance 1 | SNV | 15 | 0.98 | 0.154 | 0.89 | 0.596 |
| Distance 2 | MSC | 11 | 0.90 | 0.337 | 0.76 | 0.841 |
| Distance 3 | Normalization (Mean) | 13 | 0.93 | 0.275 | 0.85 | 0.742 |
Disclaimer/Publisher’s Note: The statements, opinions and data contained in all publications are solely those of the individual author(s) and contributor(s) and not of MDPI and/or the editor(s). MDPI and/or the editor(s) disclaim responsibility for any injury to people or property resulting from any ideas, methods, instructions or products referred to in the content. |
© 2024 by the authors. Licensee MDPI, Basel, Switzerland. This article is an open access article distributed under the terms and conditions of the Creative Commons Attribution (CC BY) license (https://creativecommons.org/licenses/by/4.0/).
Share and Cite
Song, D.-J.; Chun, S.-W.; Kim, M.-J.; Park, S.-H.; Ahn, C.-K.; Mo, C. Performance Improvement of Partial Least Squares Regression Soluble Solid Content Prediction Model Based on Adjusting Distance between Light Source and Spectral Sensor according to Apple Size. Sensors 2024, 24, 316. https://doi.org/10.3390/s24020316
Song D-J, Chun S-W, Kim M-J, Park S-H, Ahn C-K, Mo C. Performance Improvement of Partial Least Squares Regression Soluble Solid Content Prediction Model Based on Adjusting Distance between Light Source and Spectral Sensor according to Apple Size. Sensors. 2024; 24(2):316. https://doi.org/10.3390/s24020316
Chicago/Turabian StyleSong, Doo-Jin, Seung-Woo Chun, Min-Jee Kim, Soo-Hwan Park, Chi-Kook Ahn, and Changyeun Mo. 2024. "Performance Improvement of Partial Least Squares Regression Soluble Solid Content Prediction Model Based on Adjusting Distance between Light Source and Spectral Sensor according to Apple Size" Sensors 24, no. 2: 316. https://doi.org/10.3390/s24020316
APA StyleSong, D.-J., Chun, S.-W., Kim, M.-J., Park, S.-H., Ahn, C.-K., & Mo, C. (2024). Performance Improvement of Partial Least Squares Regression Soluble Solid Content Prediction Model Based on Adjusting Distance between Light Source and Spectral Sensor according to Apple Size. Sensors, 24(2), 316. https://doi.org/10.3390/s24020316