

An Electrical Conductivity Sensor for the Selective Determination of Soil Salinity

Abstract
1. Introduction
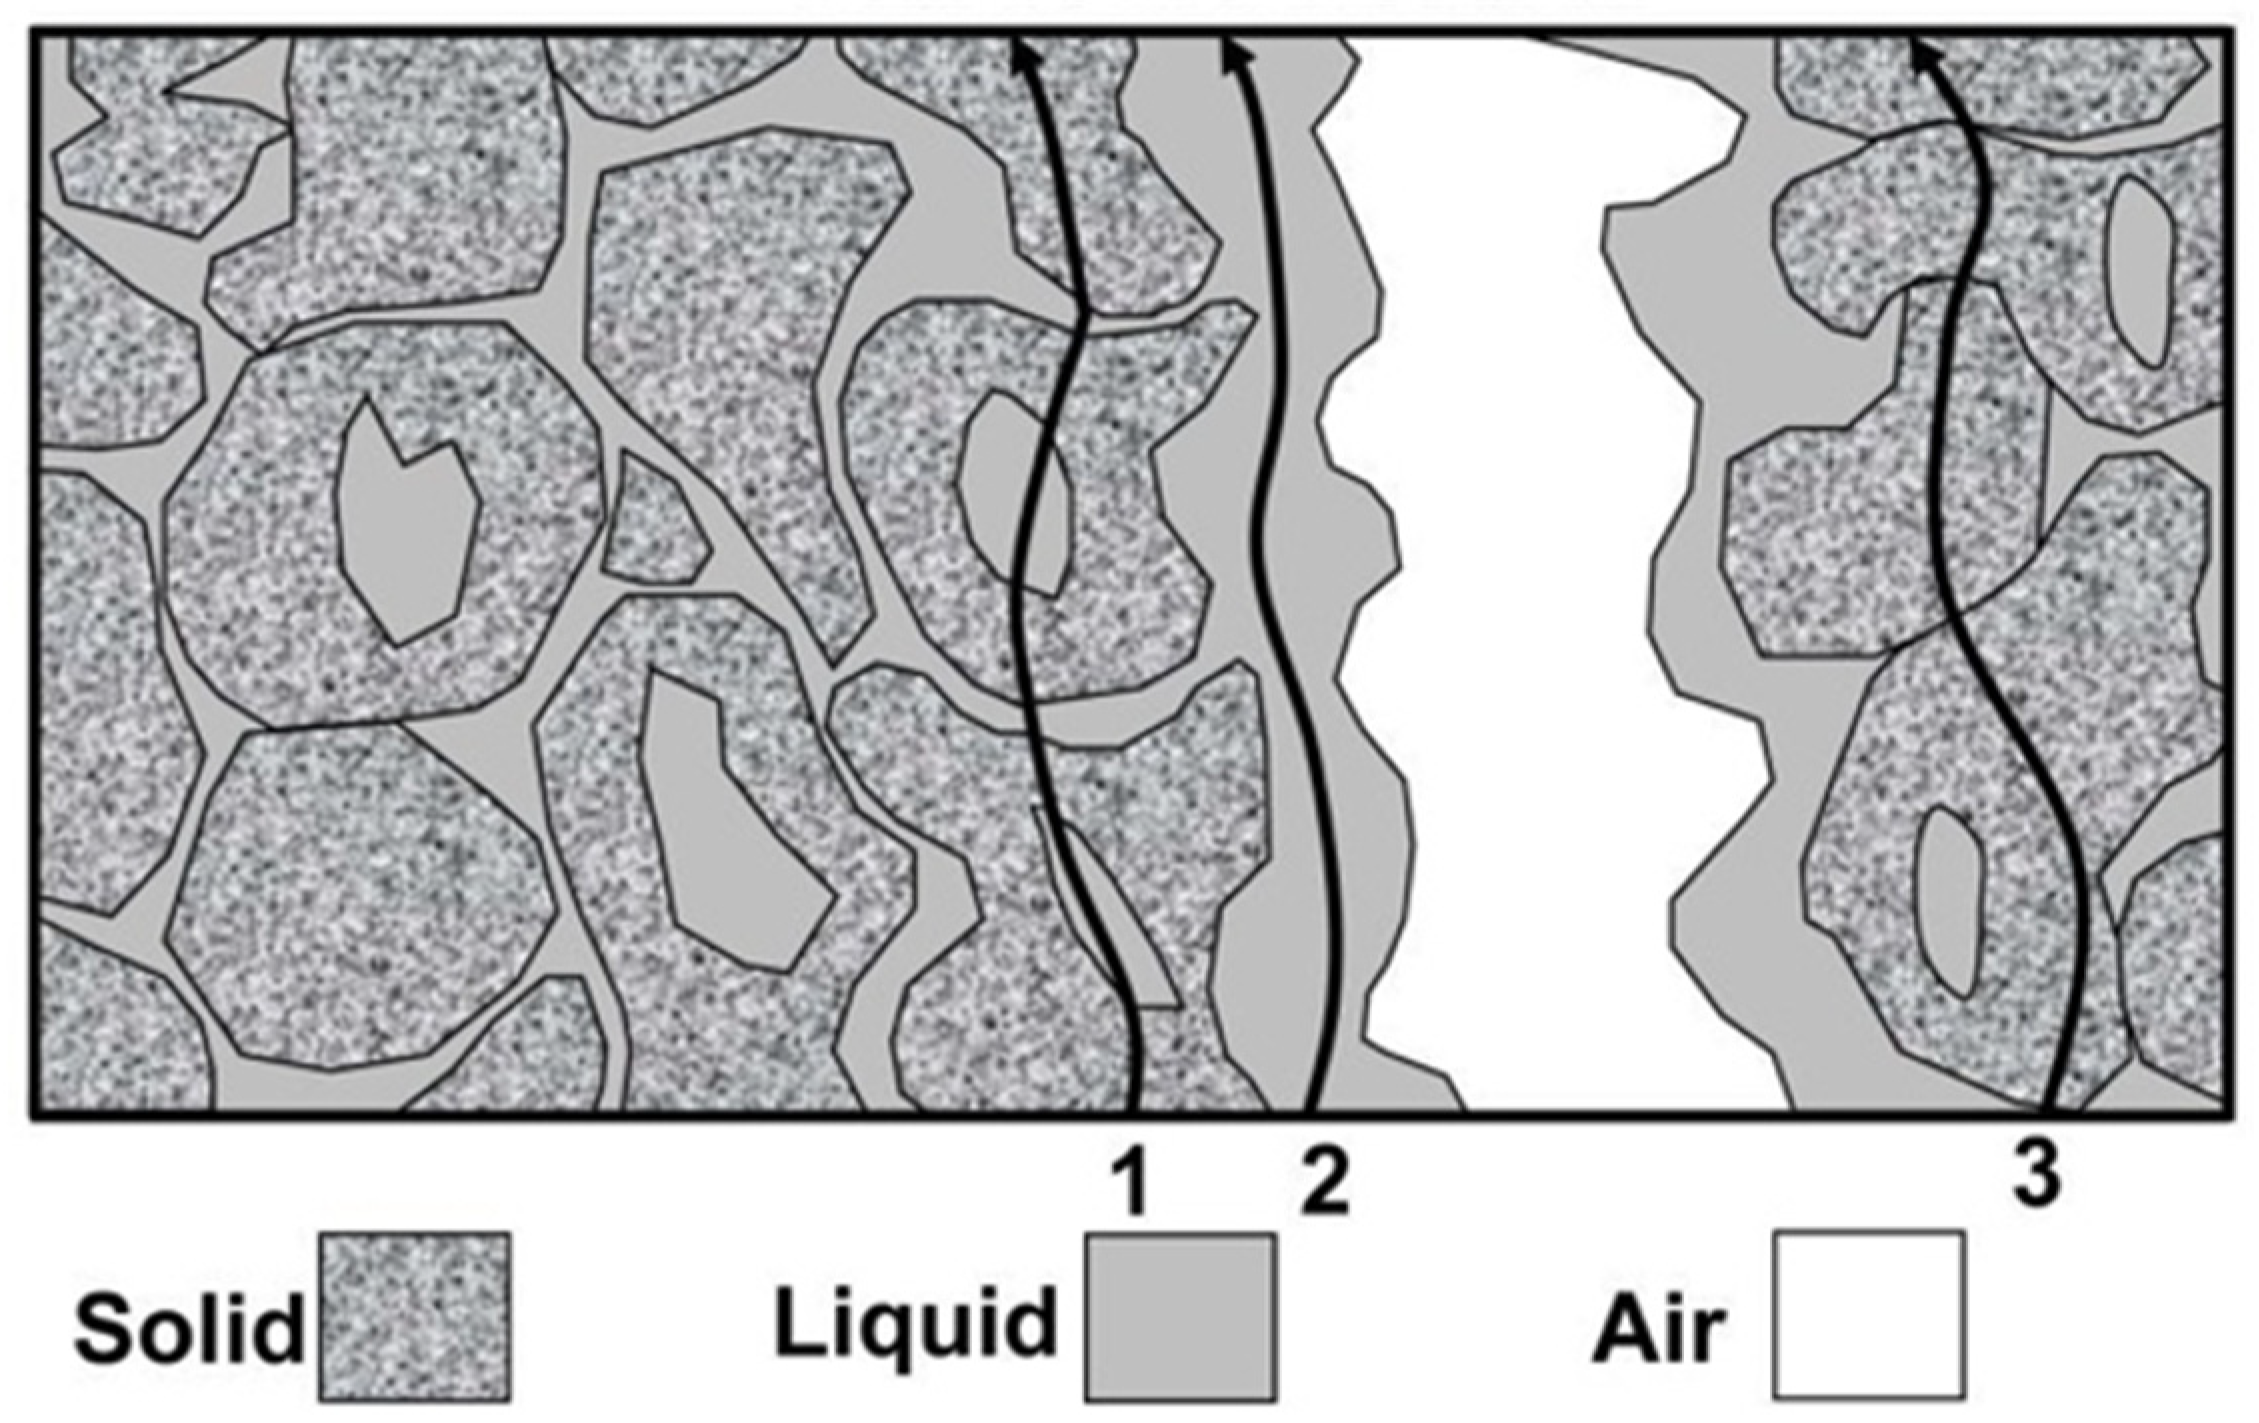
1.1. Conductivity in Soil
1.2. Chemical Composition of Soil Moisture in Soil Solution
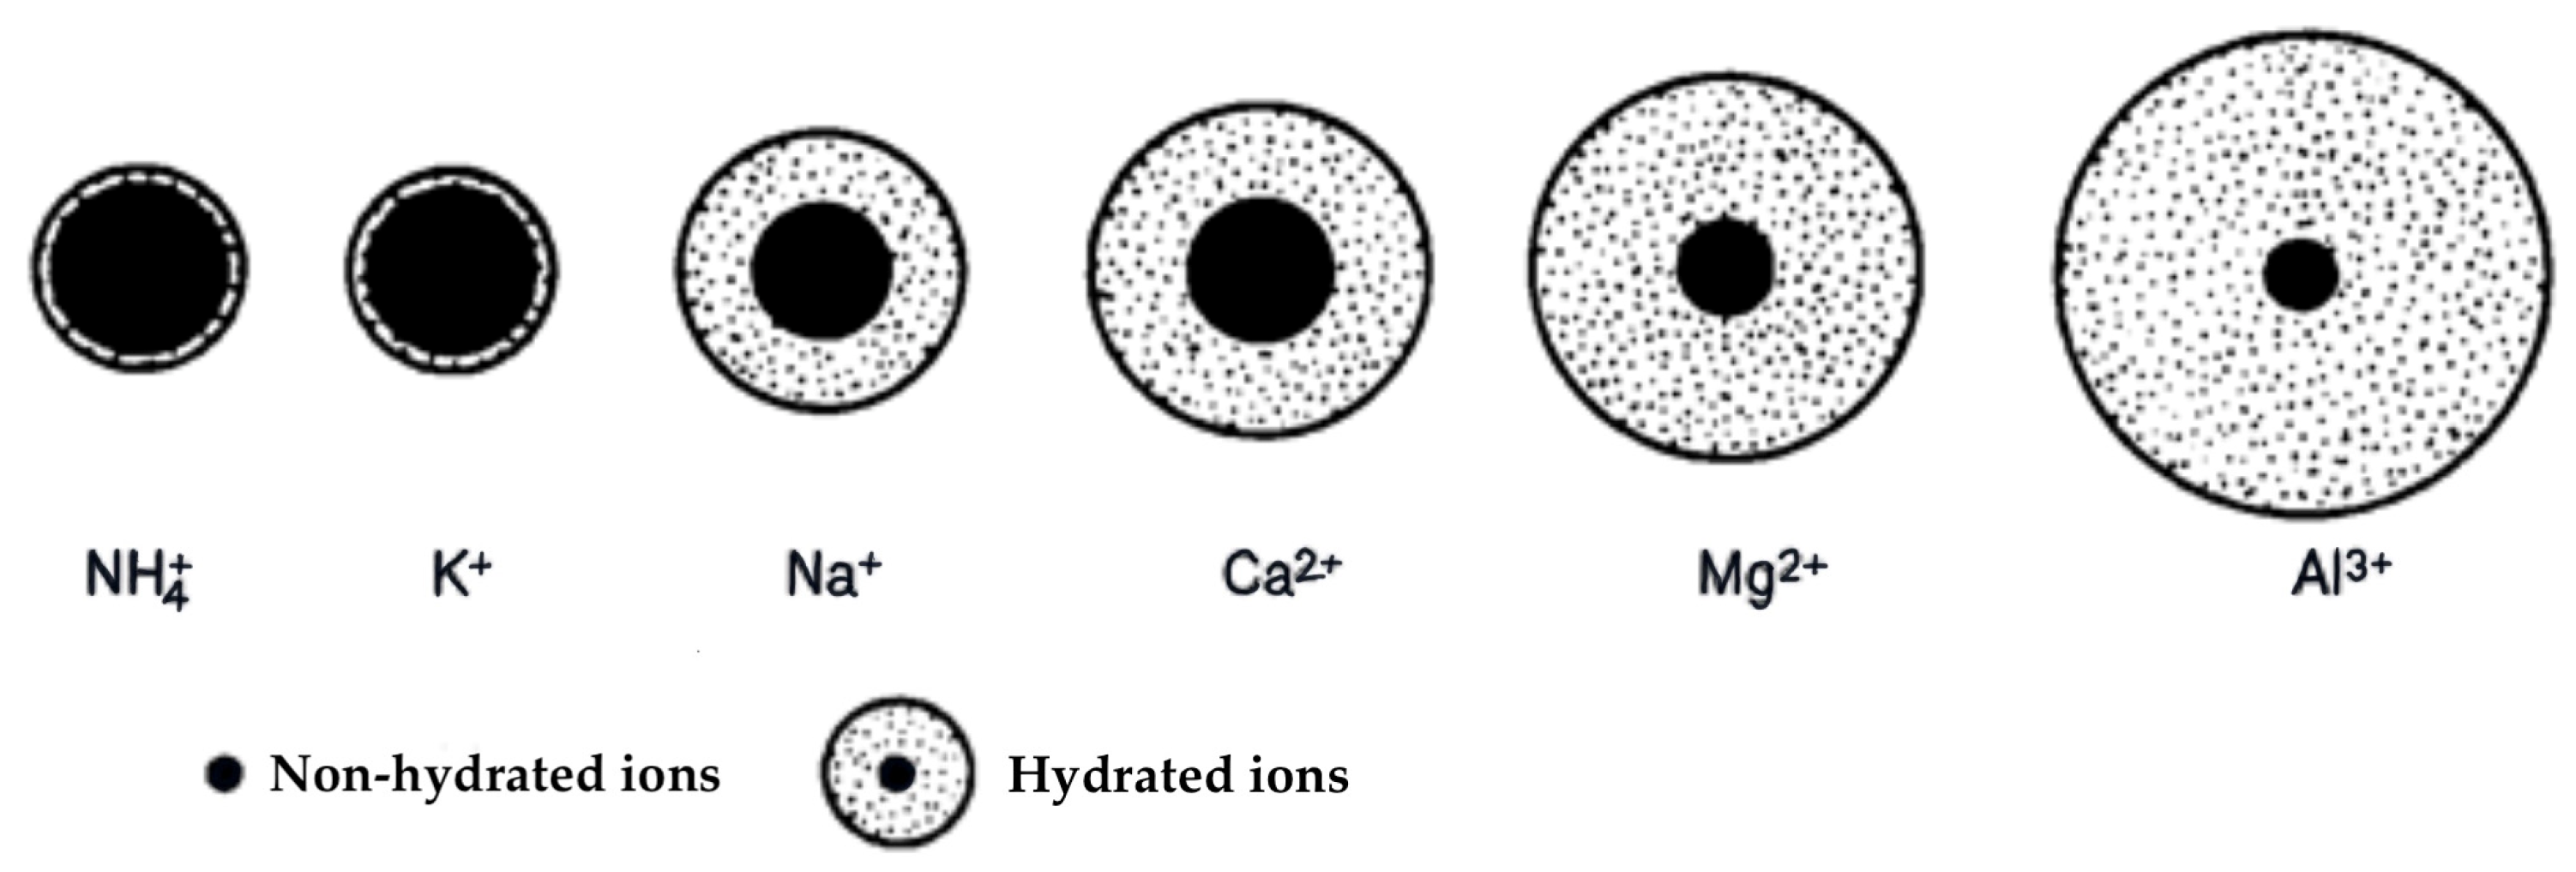
- Cations: Ca2+, Mg2+, Na+, K+, NH+4, and, in some soils, Al3+, Fe3+, or Fe2+.
- Anions: HCO3−, CO32−, Cl−, SO42−, NO3−, H2PO4−, HPO42−.
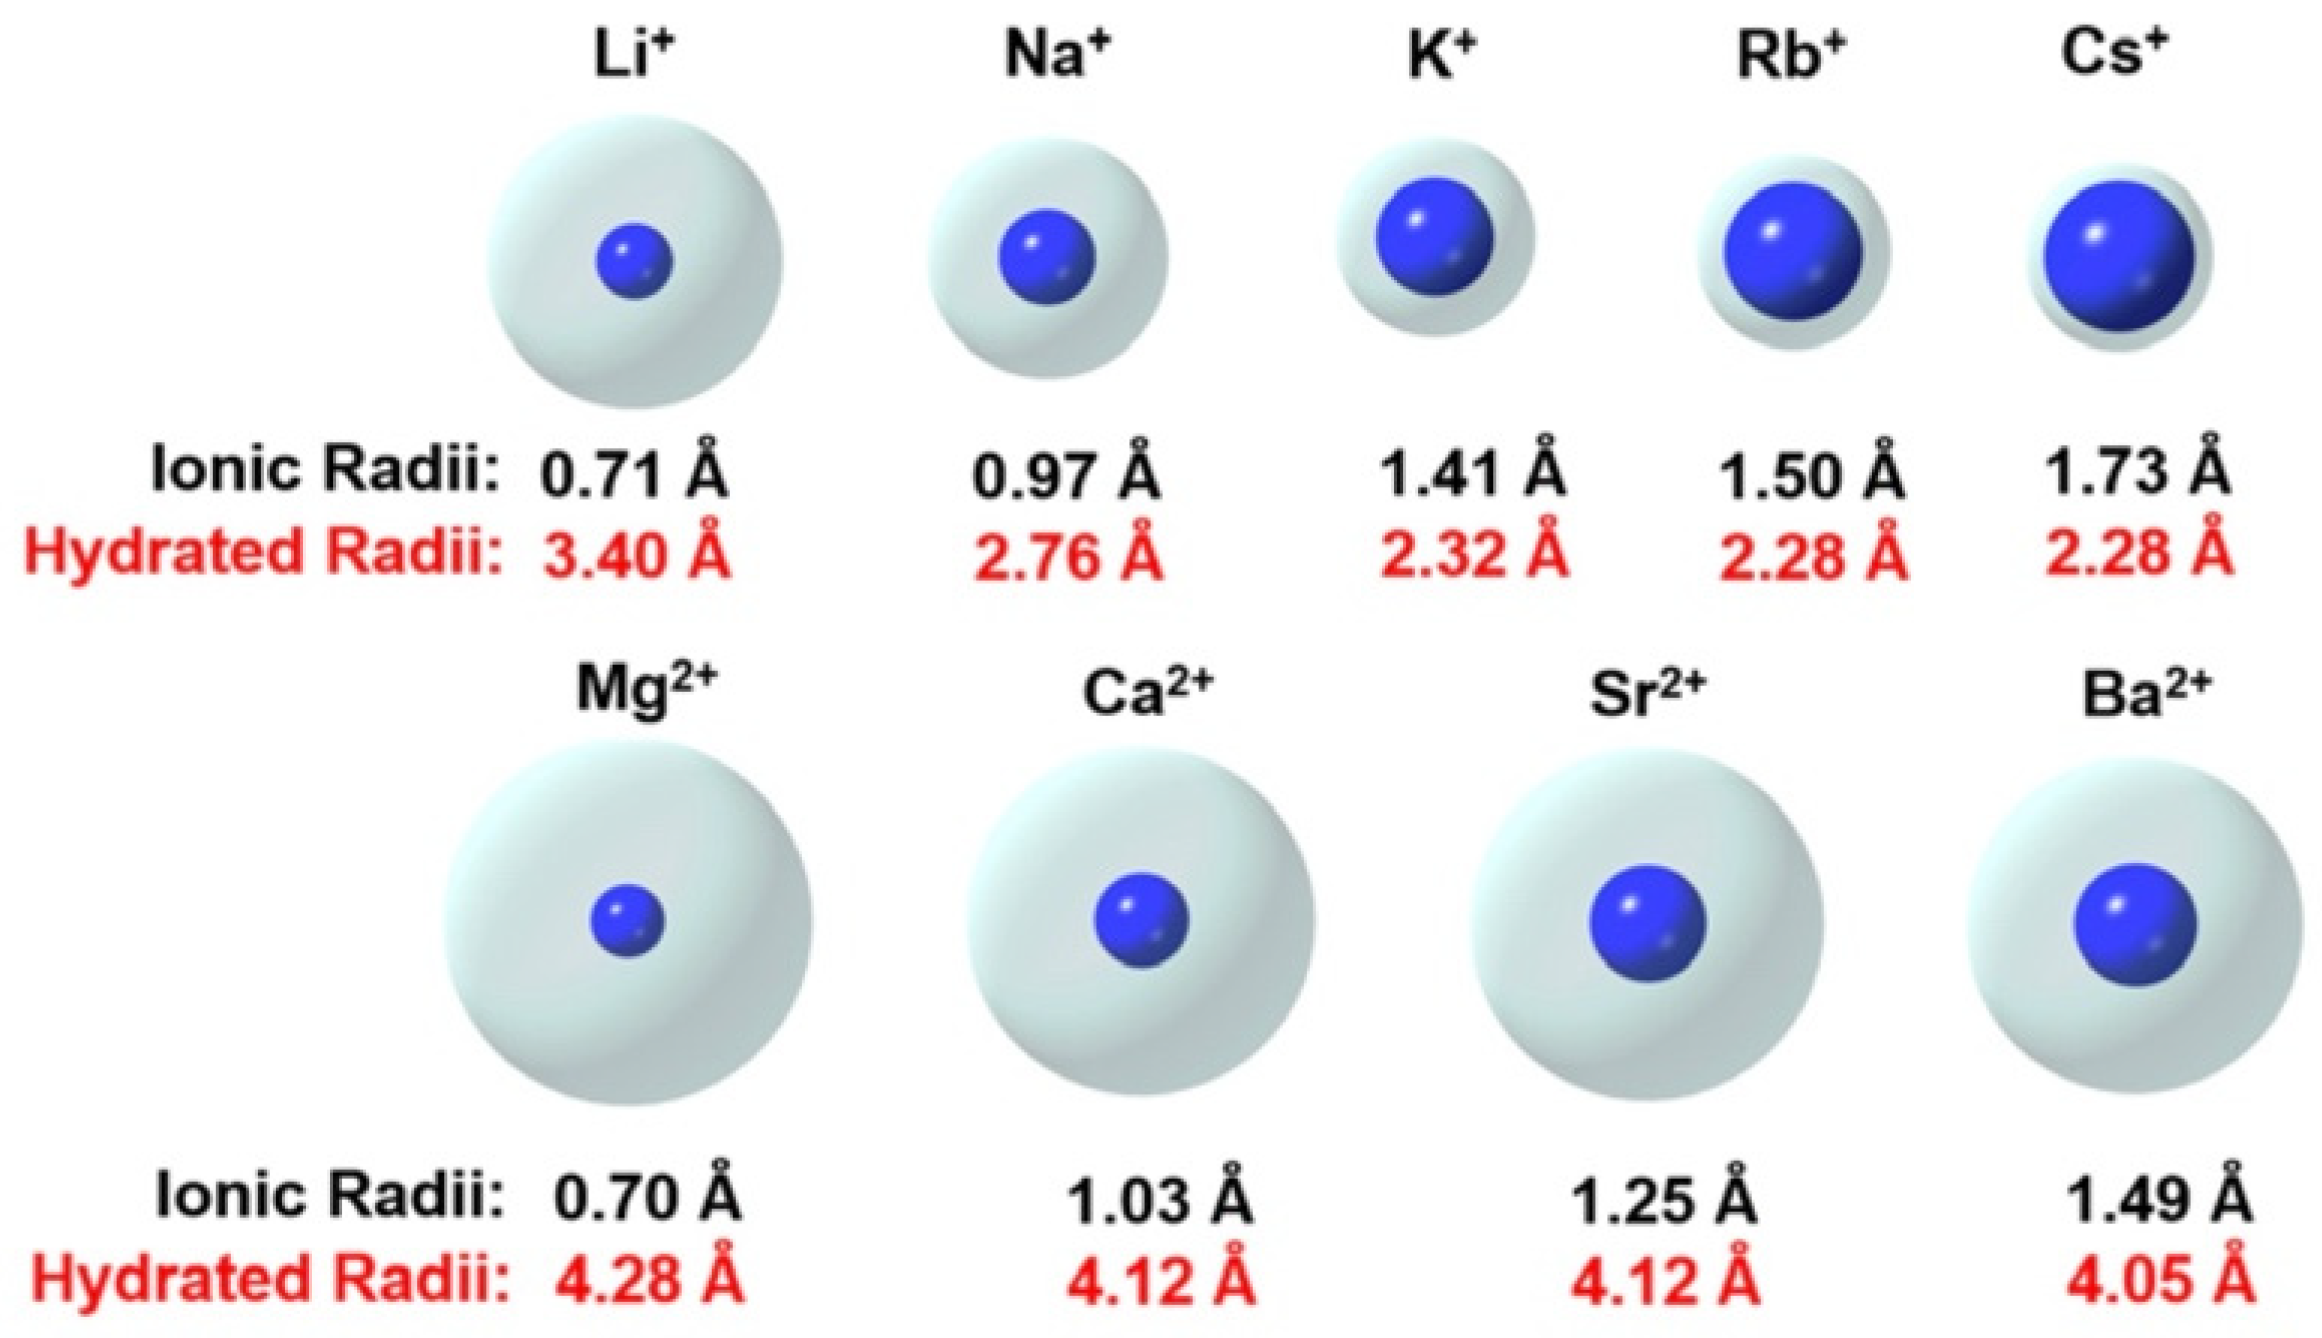
1.3. Hydrated Ions
1.4. Using Soil Sensors for EC Measurement
2. Materials and Methods
2.1. The Goal of Measurement
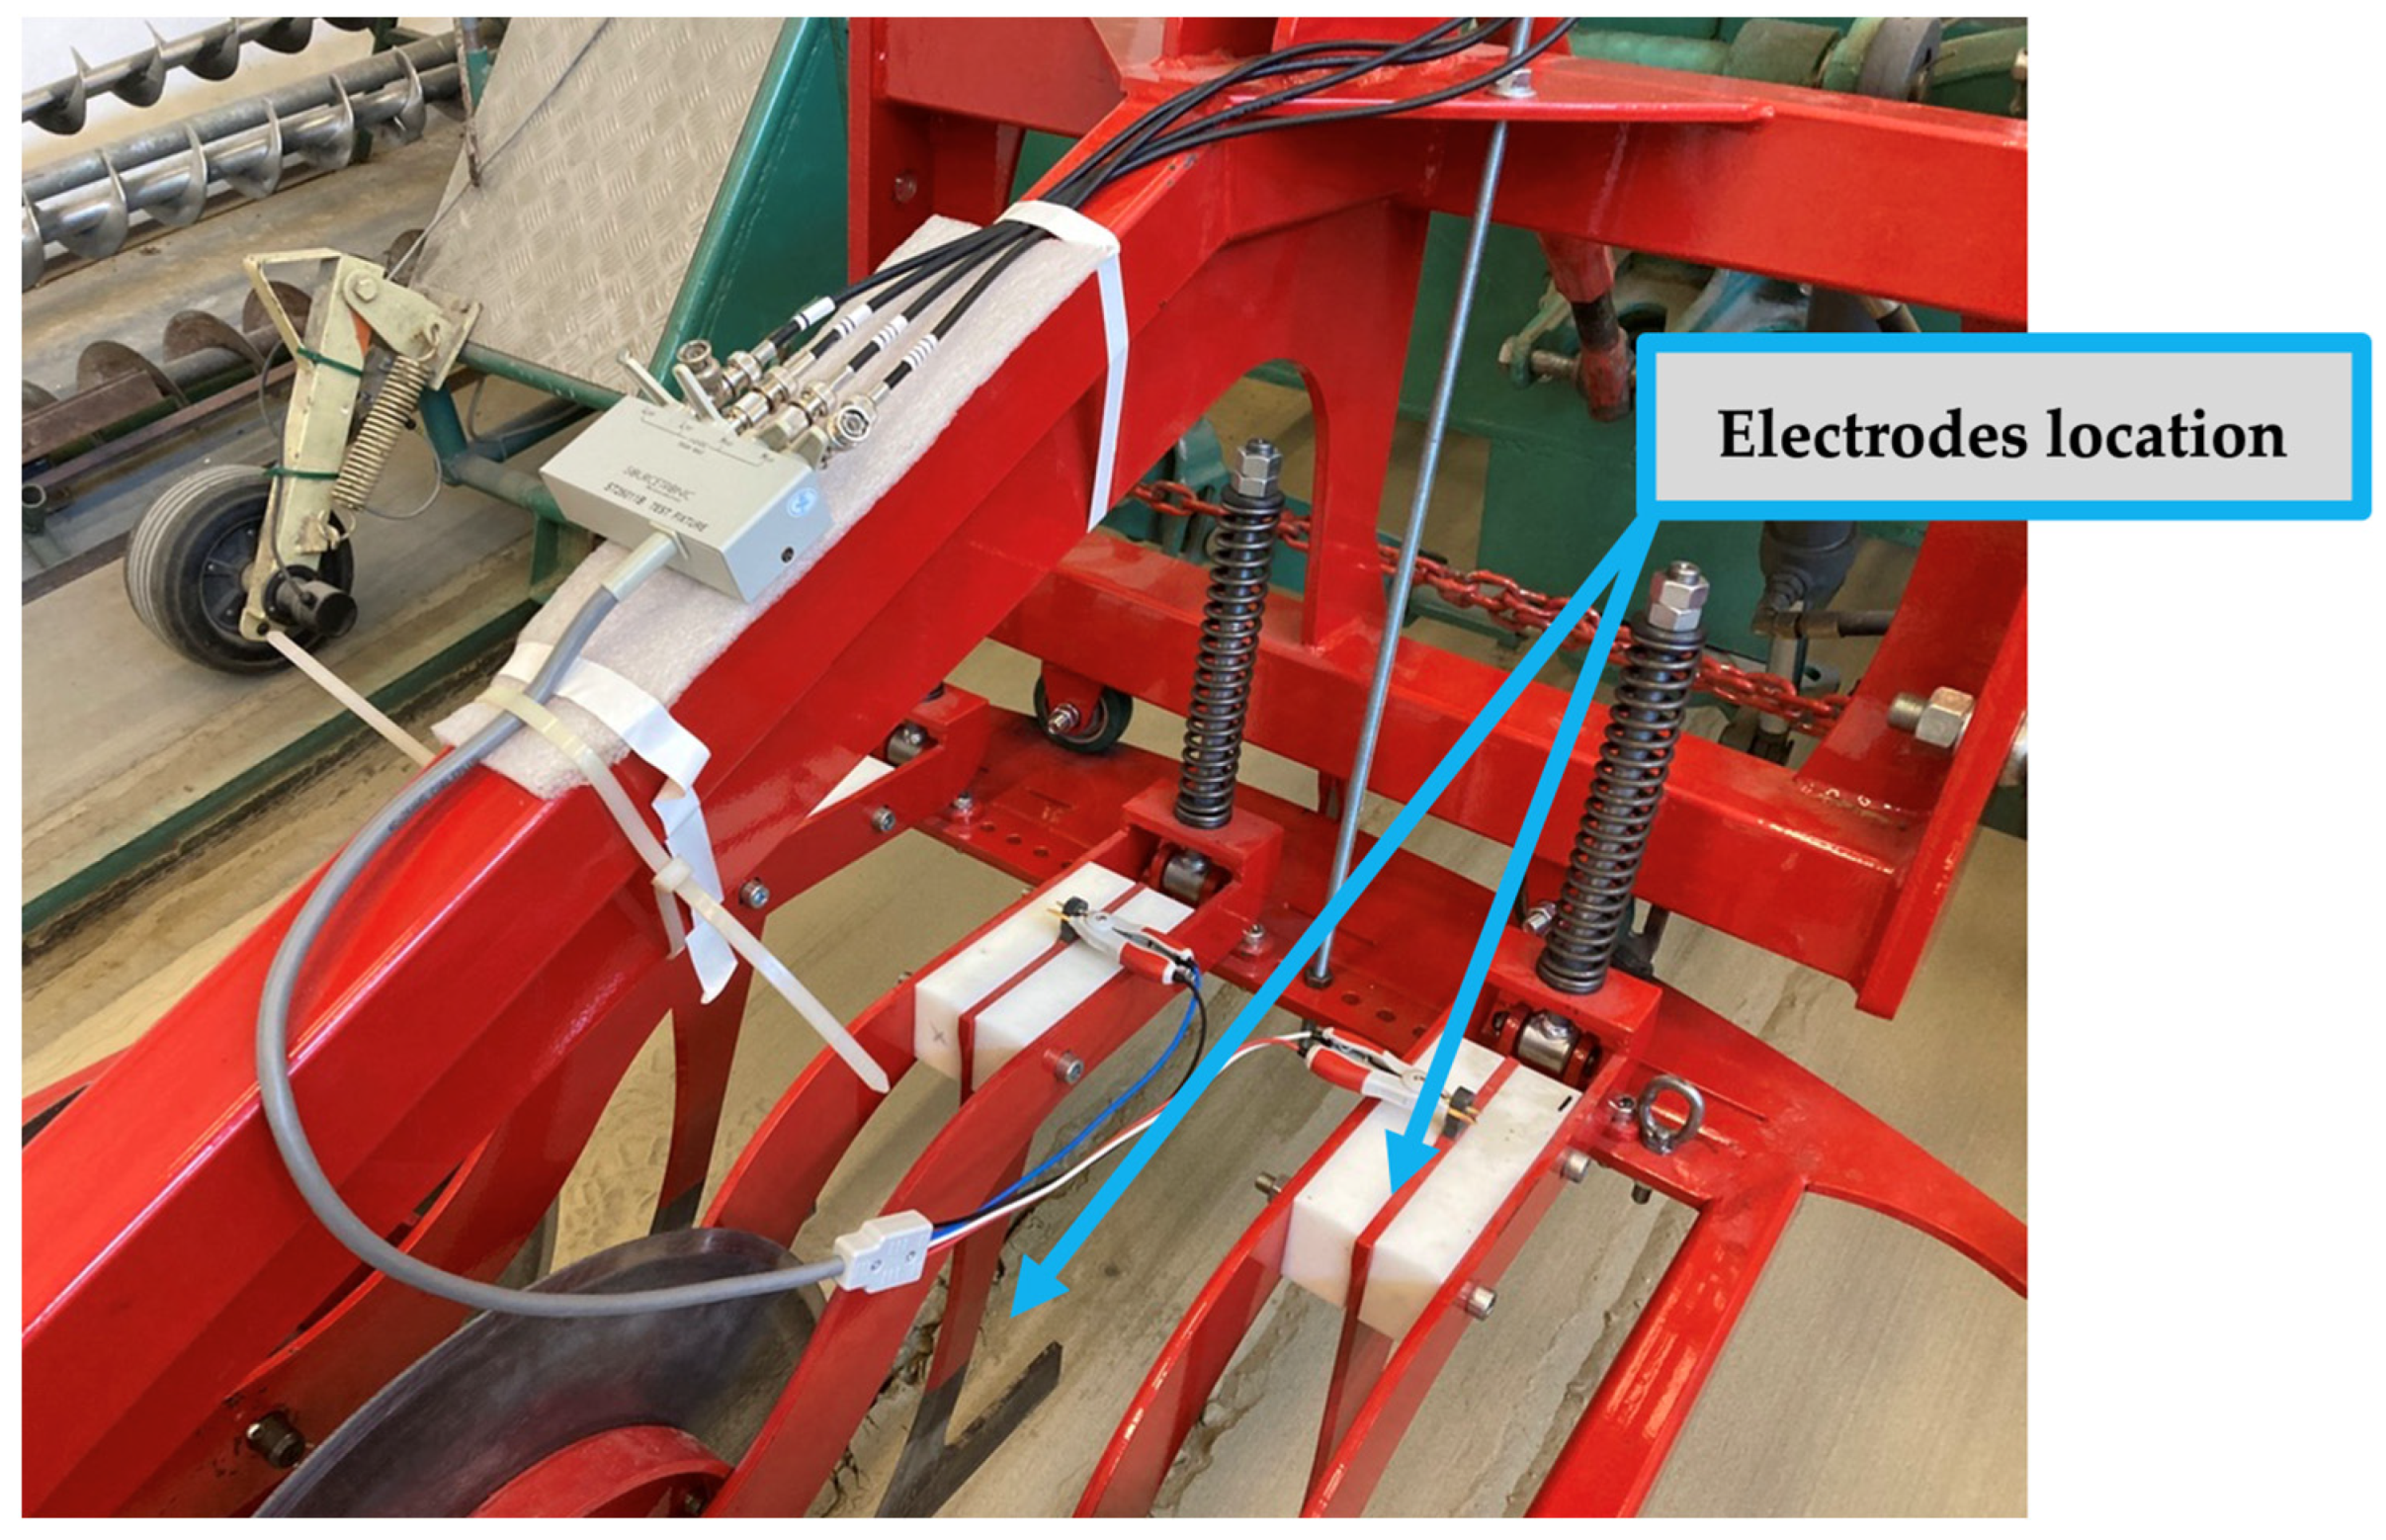
2.2. The Subject of Measurement
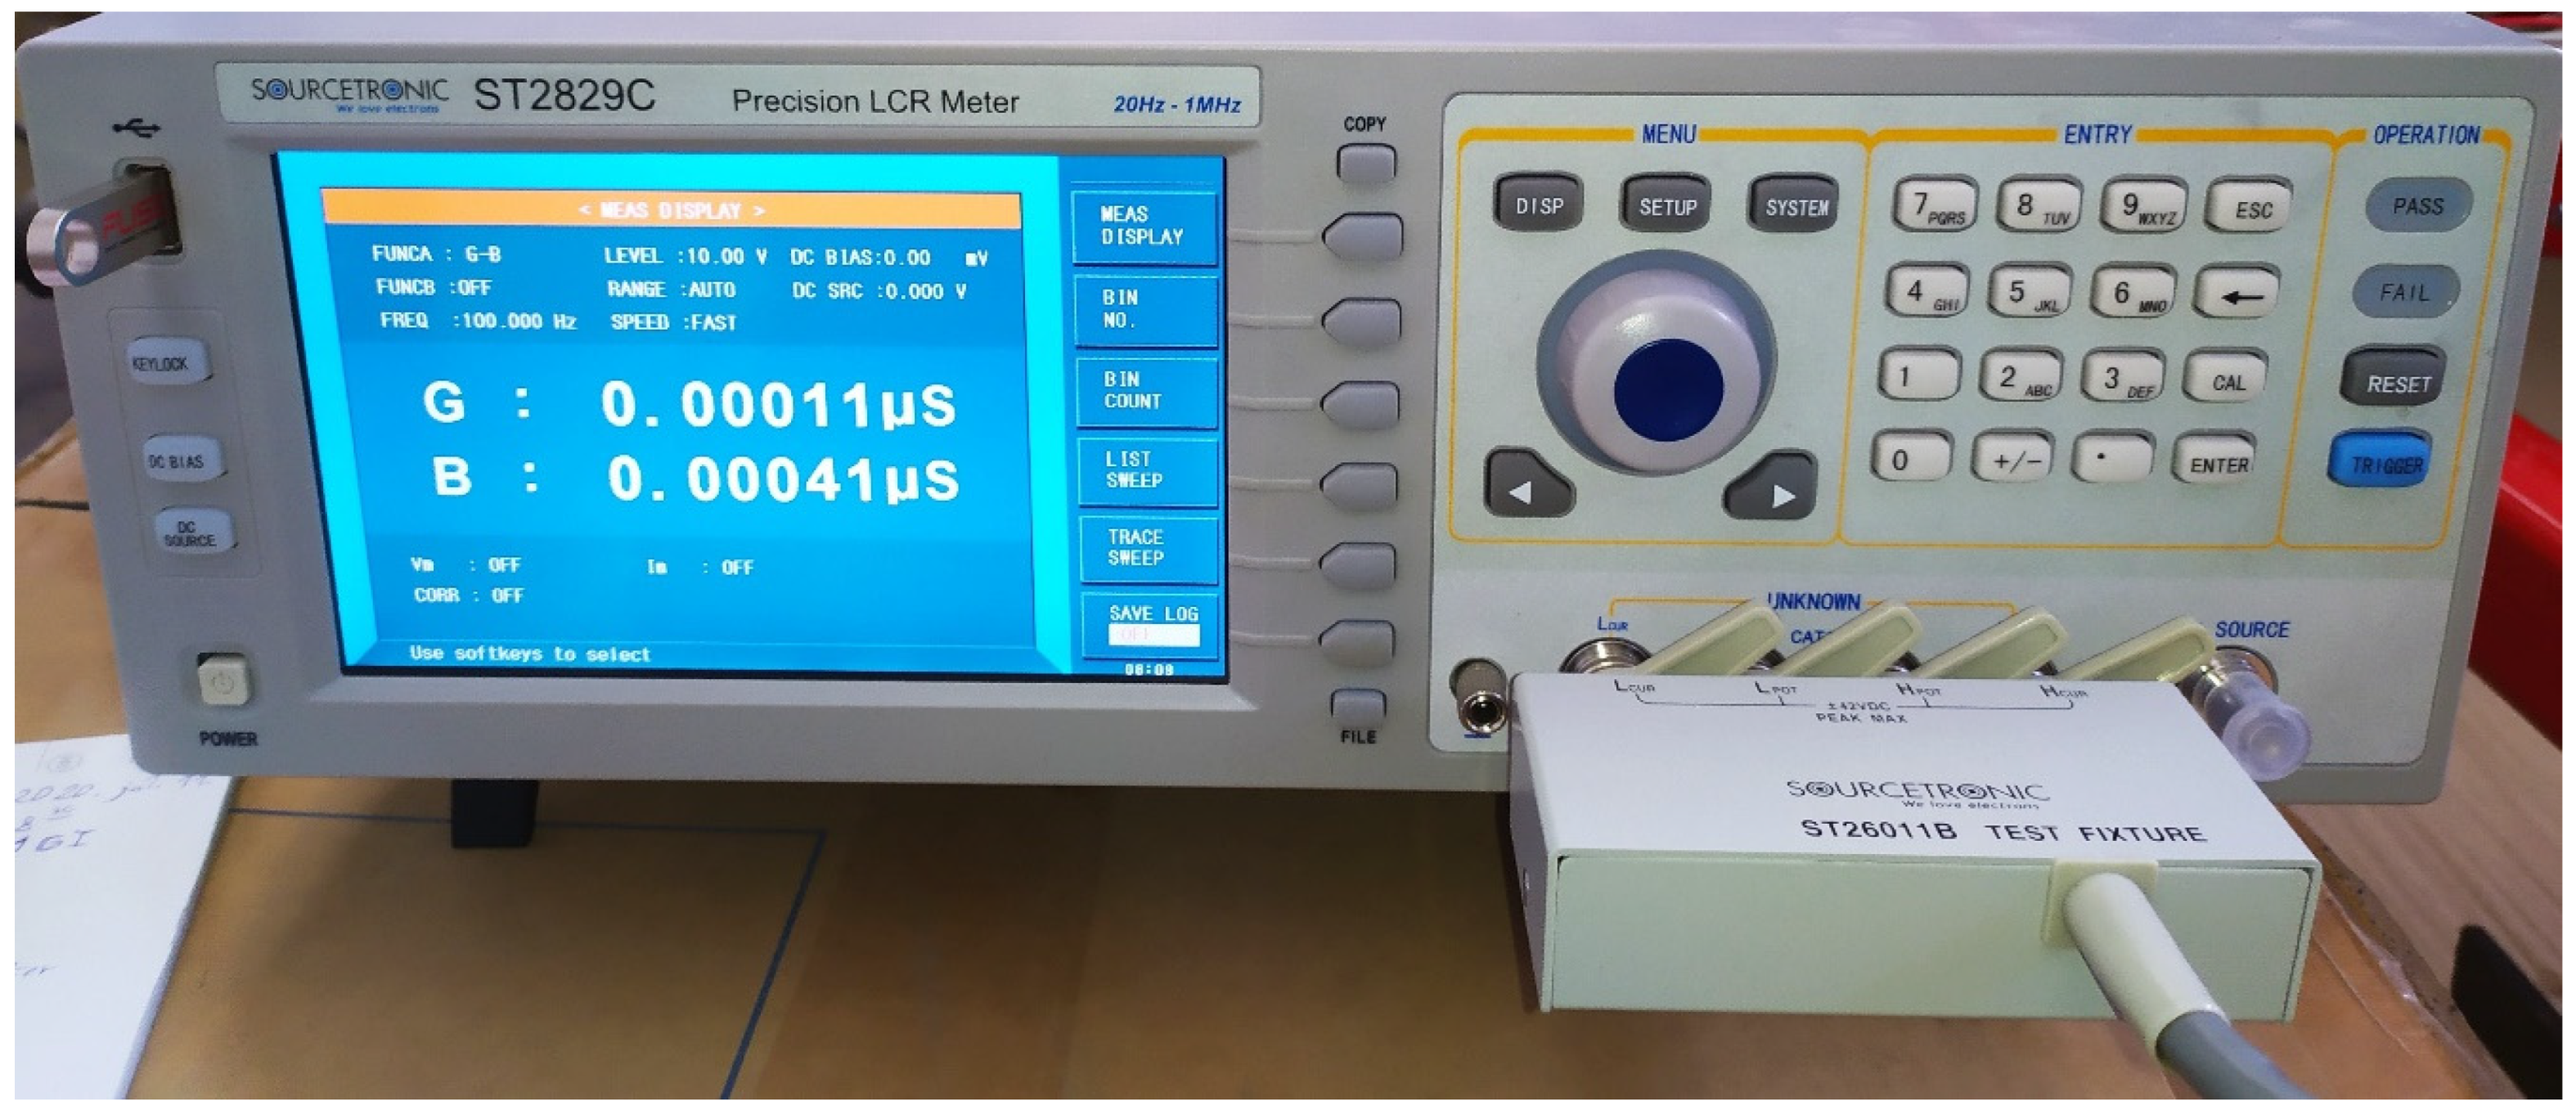
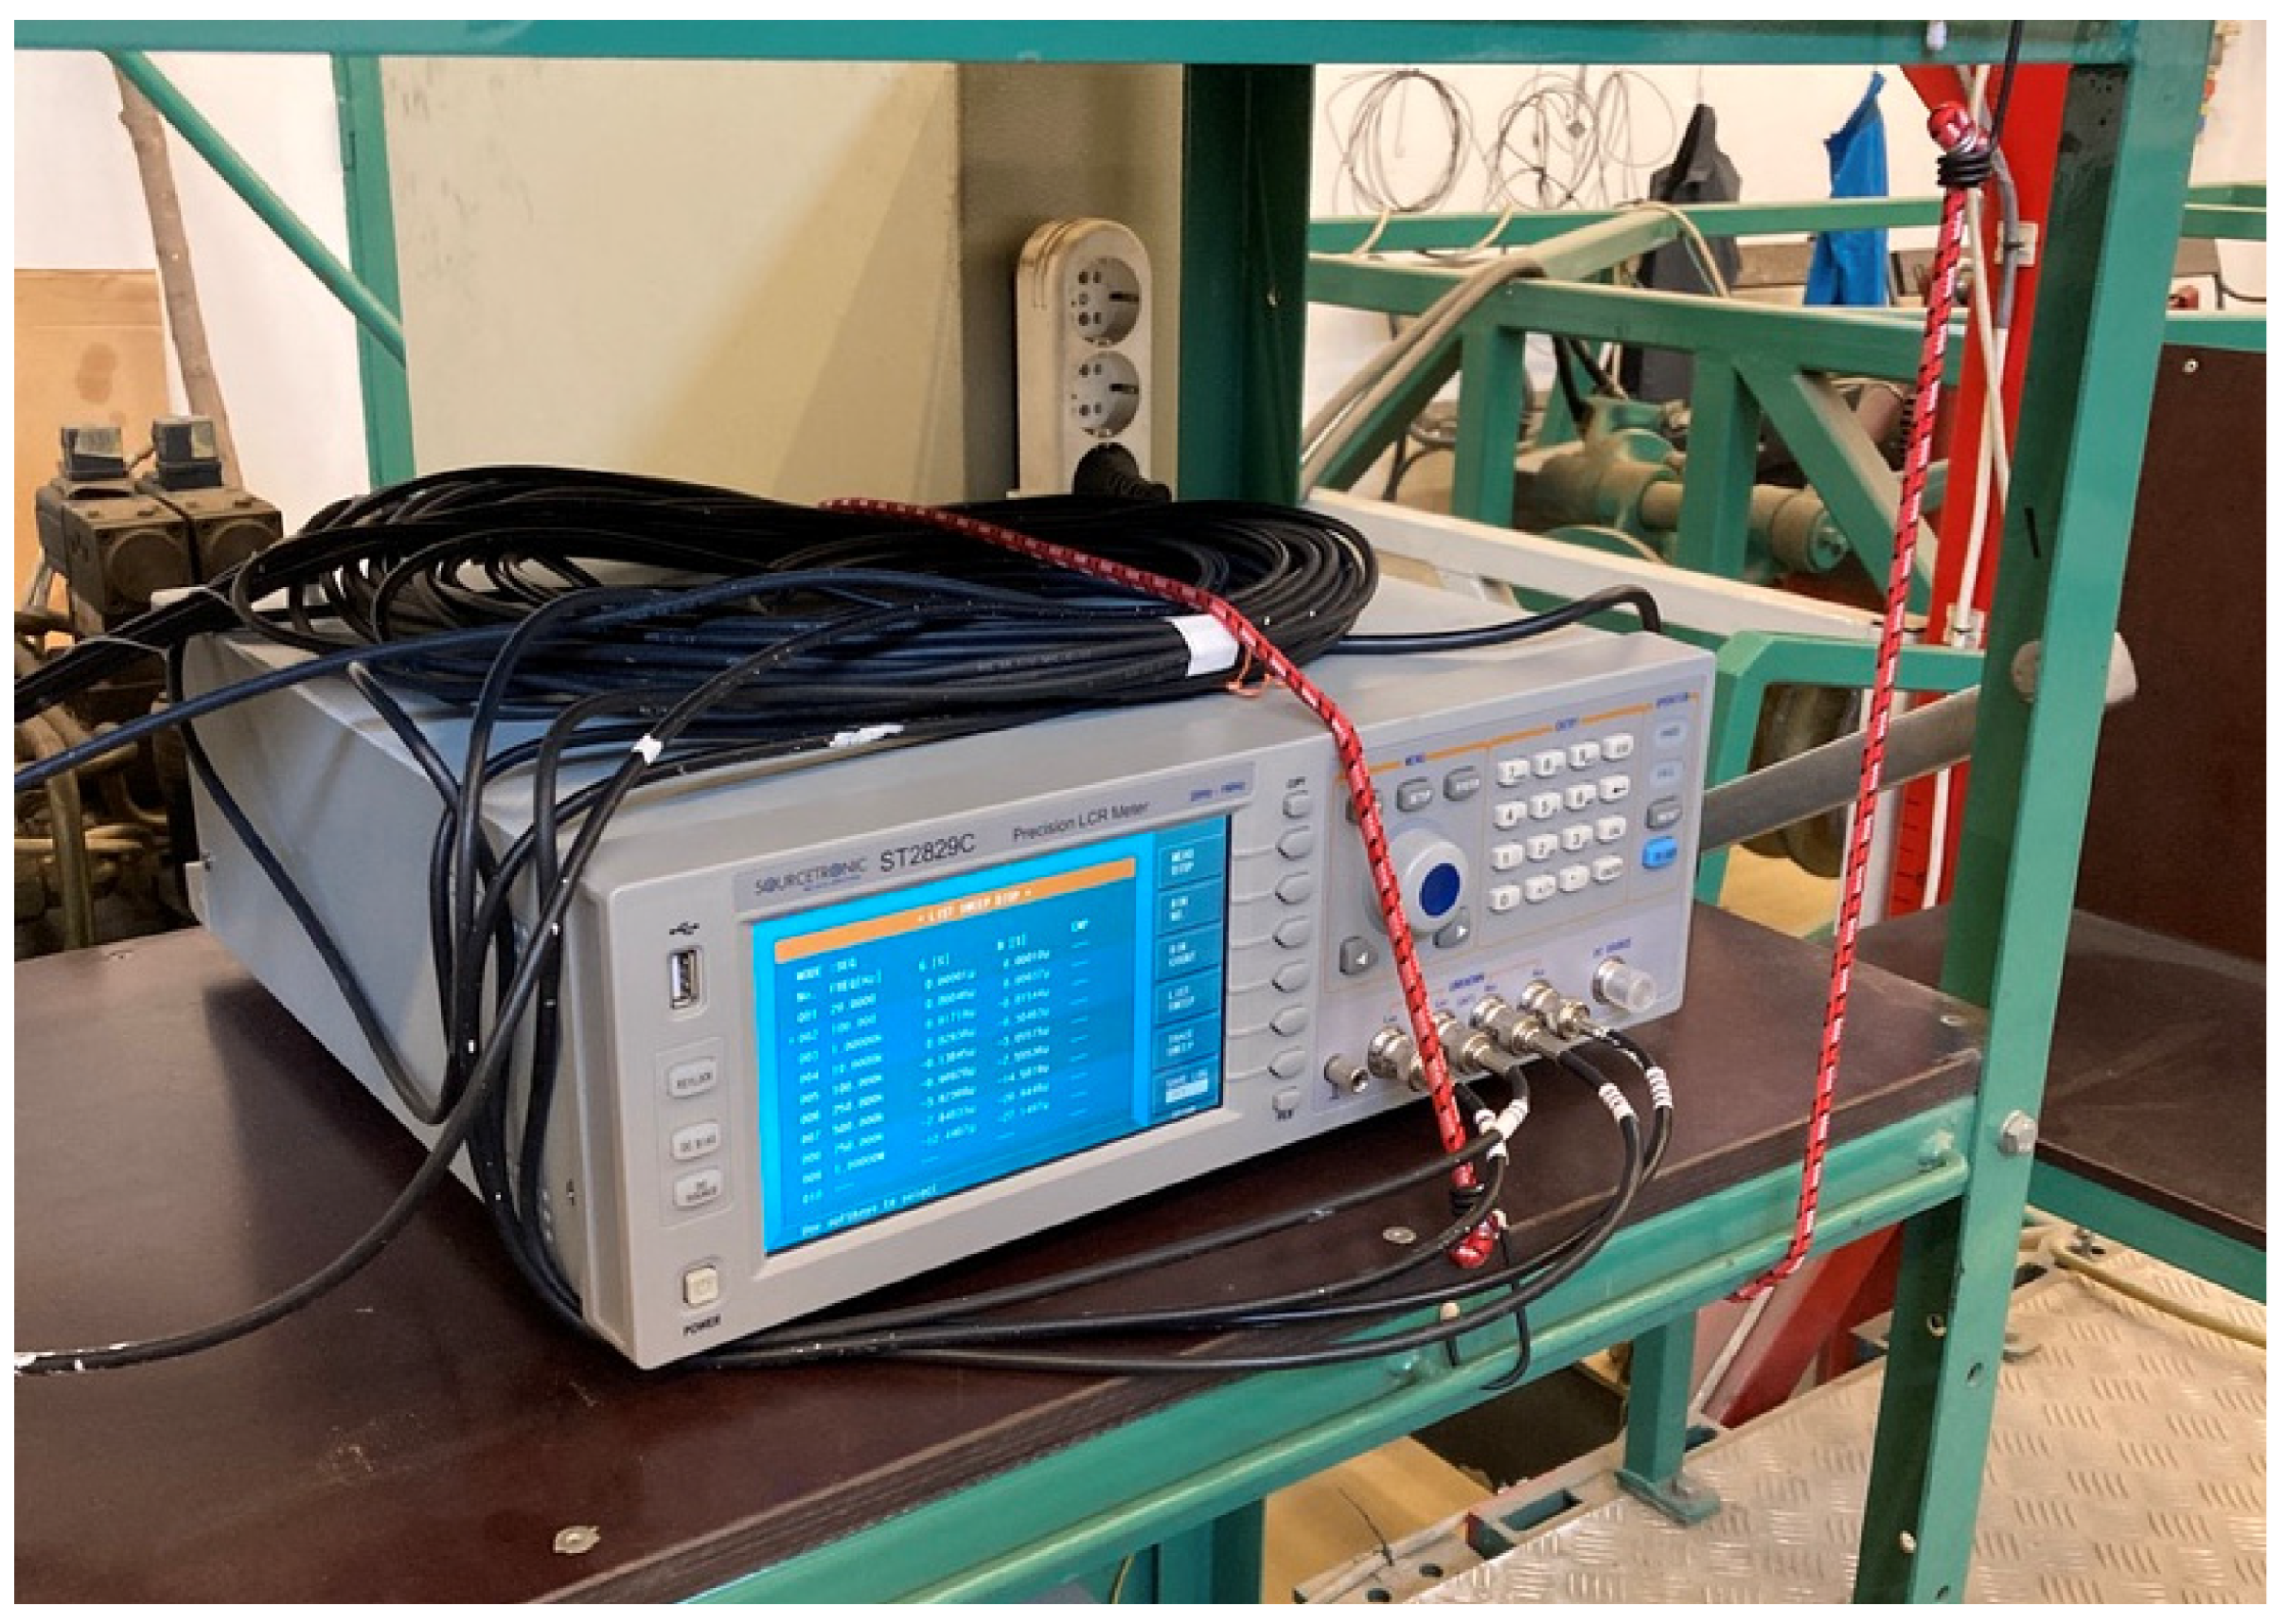
2.3. The Soil Sensor and the LCR Meter
2.4. The Measurement and Data Processing Process
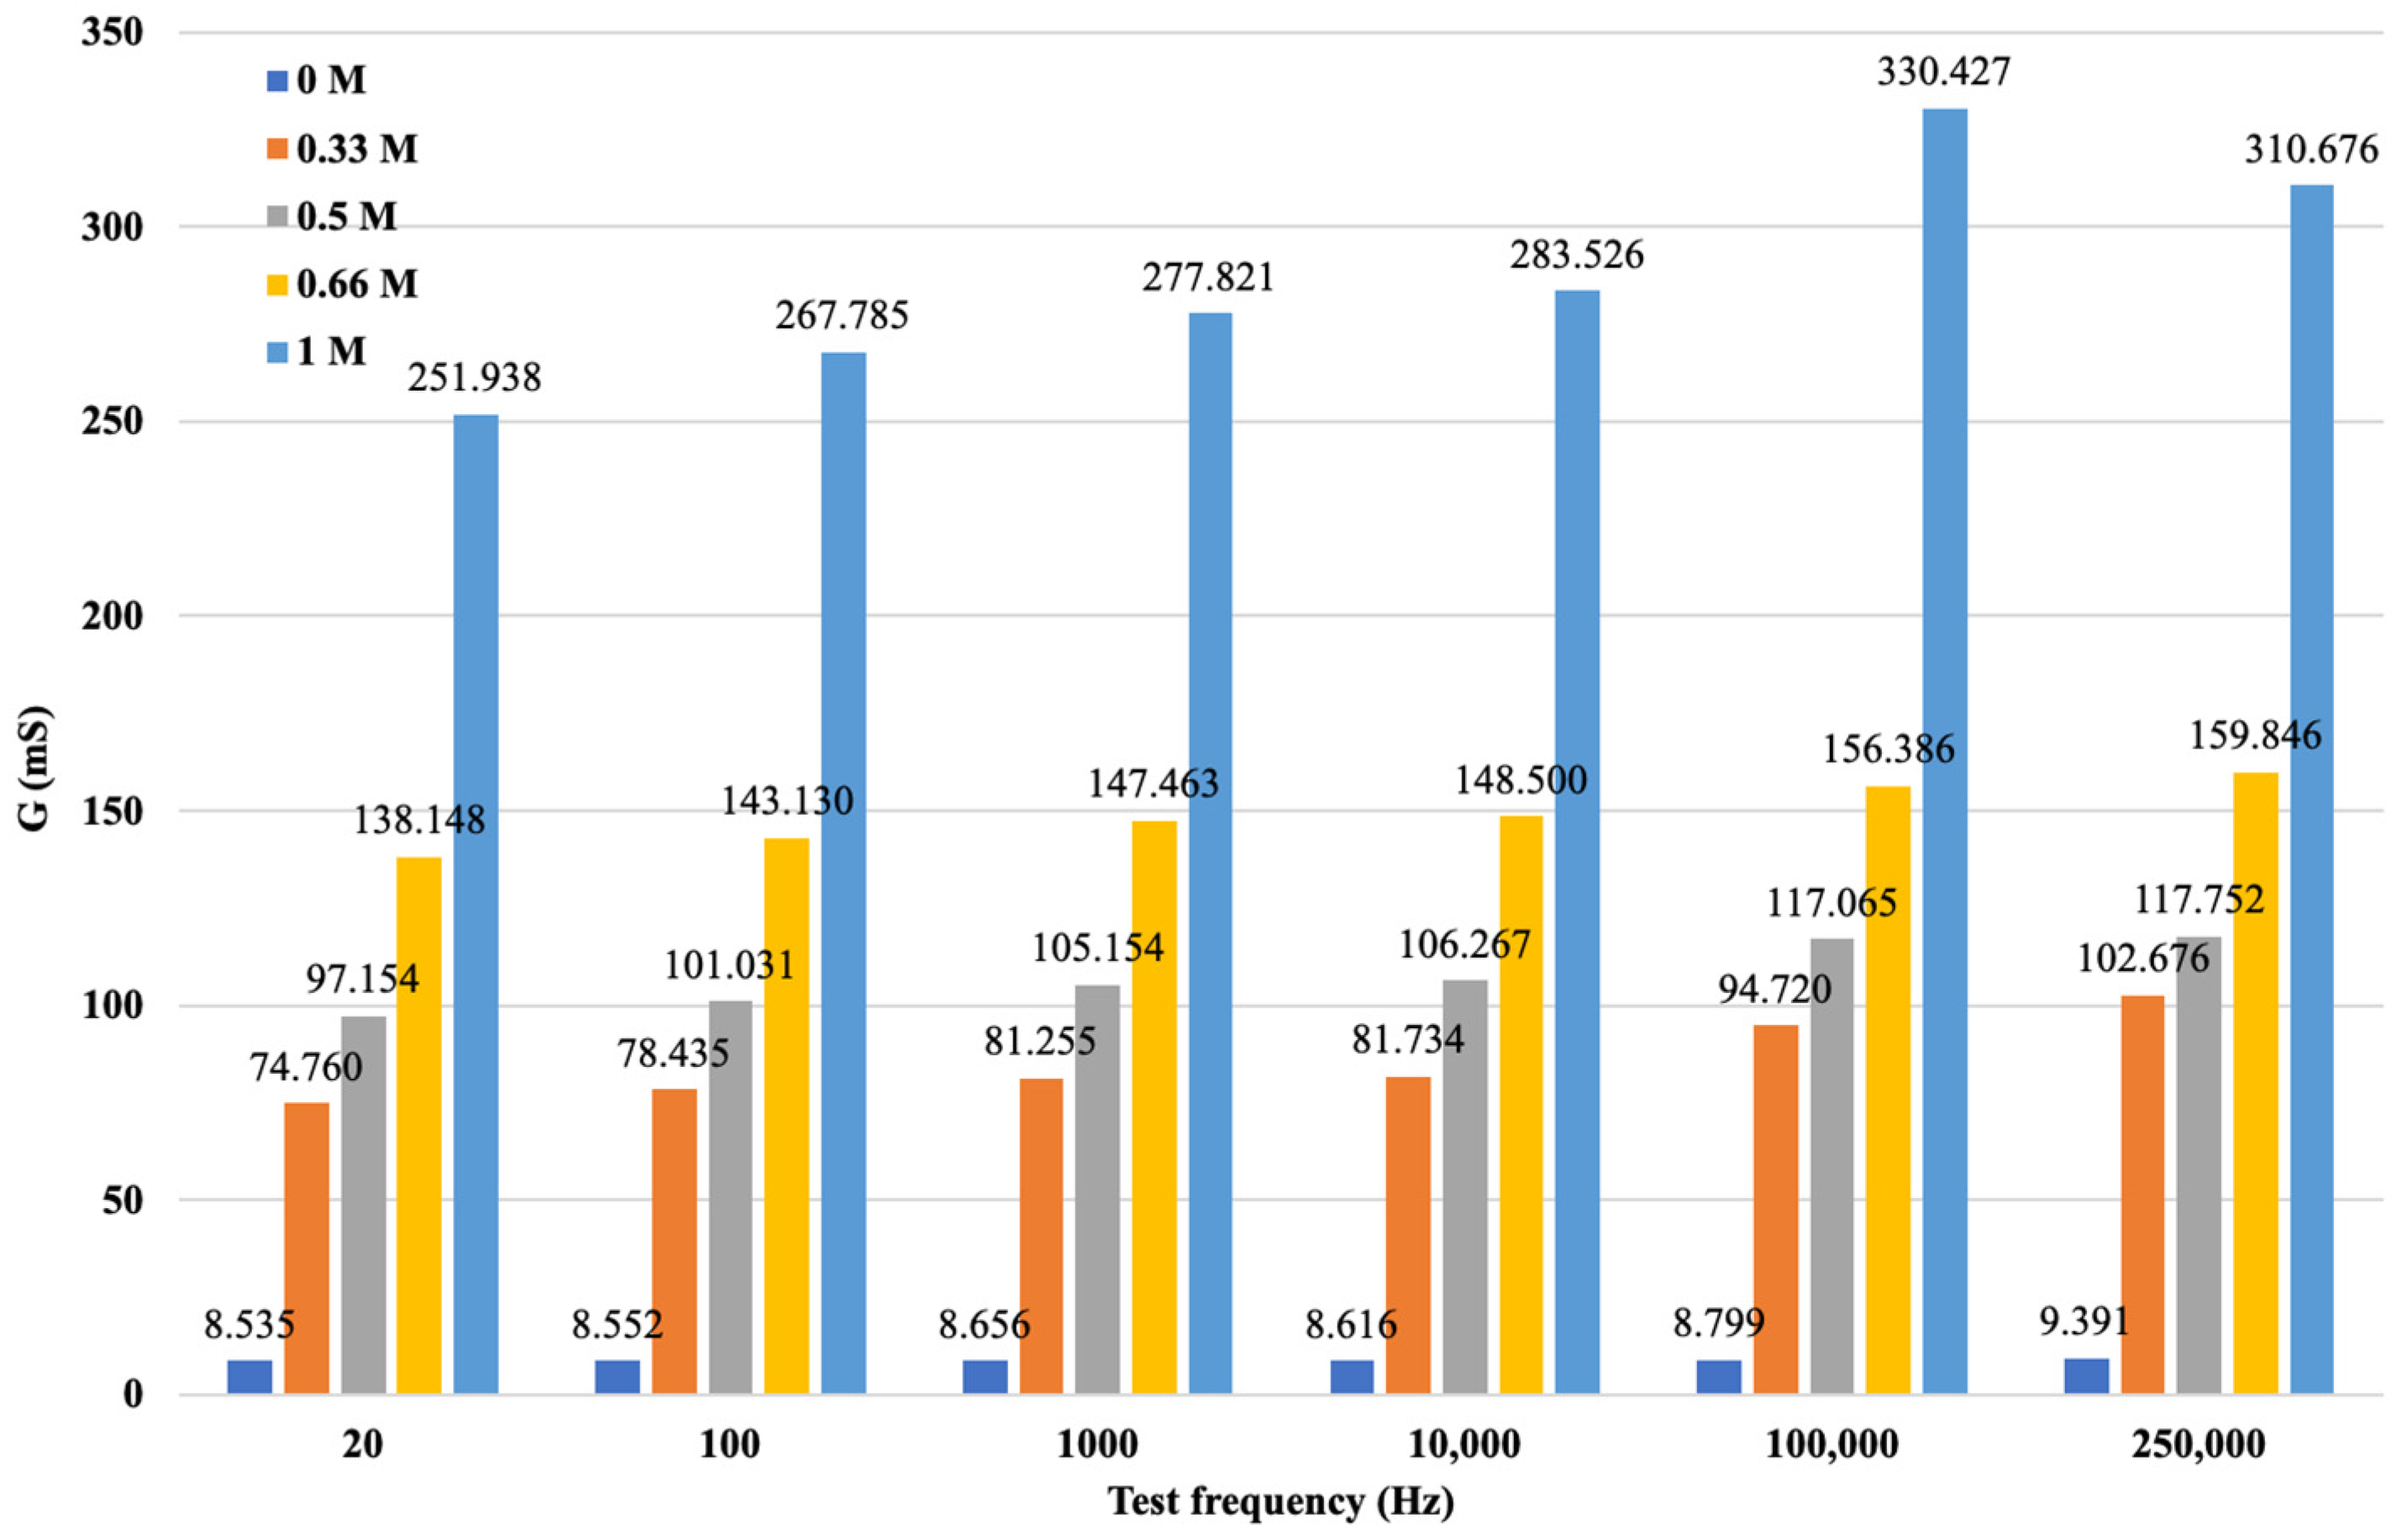
3. Results and Discussion
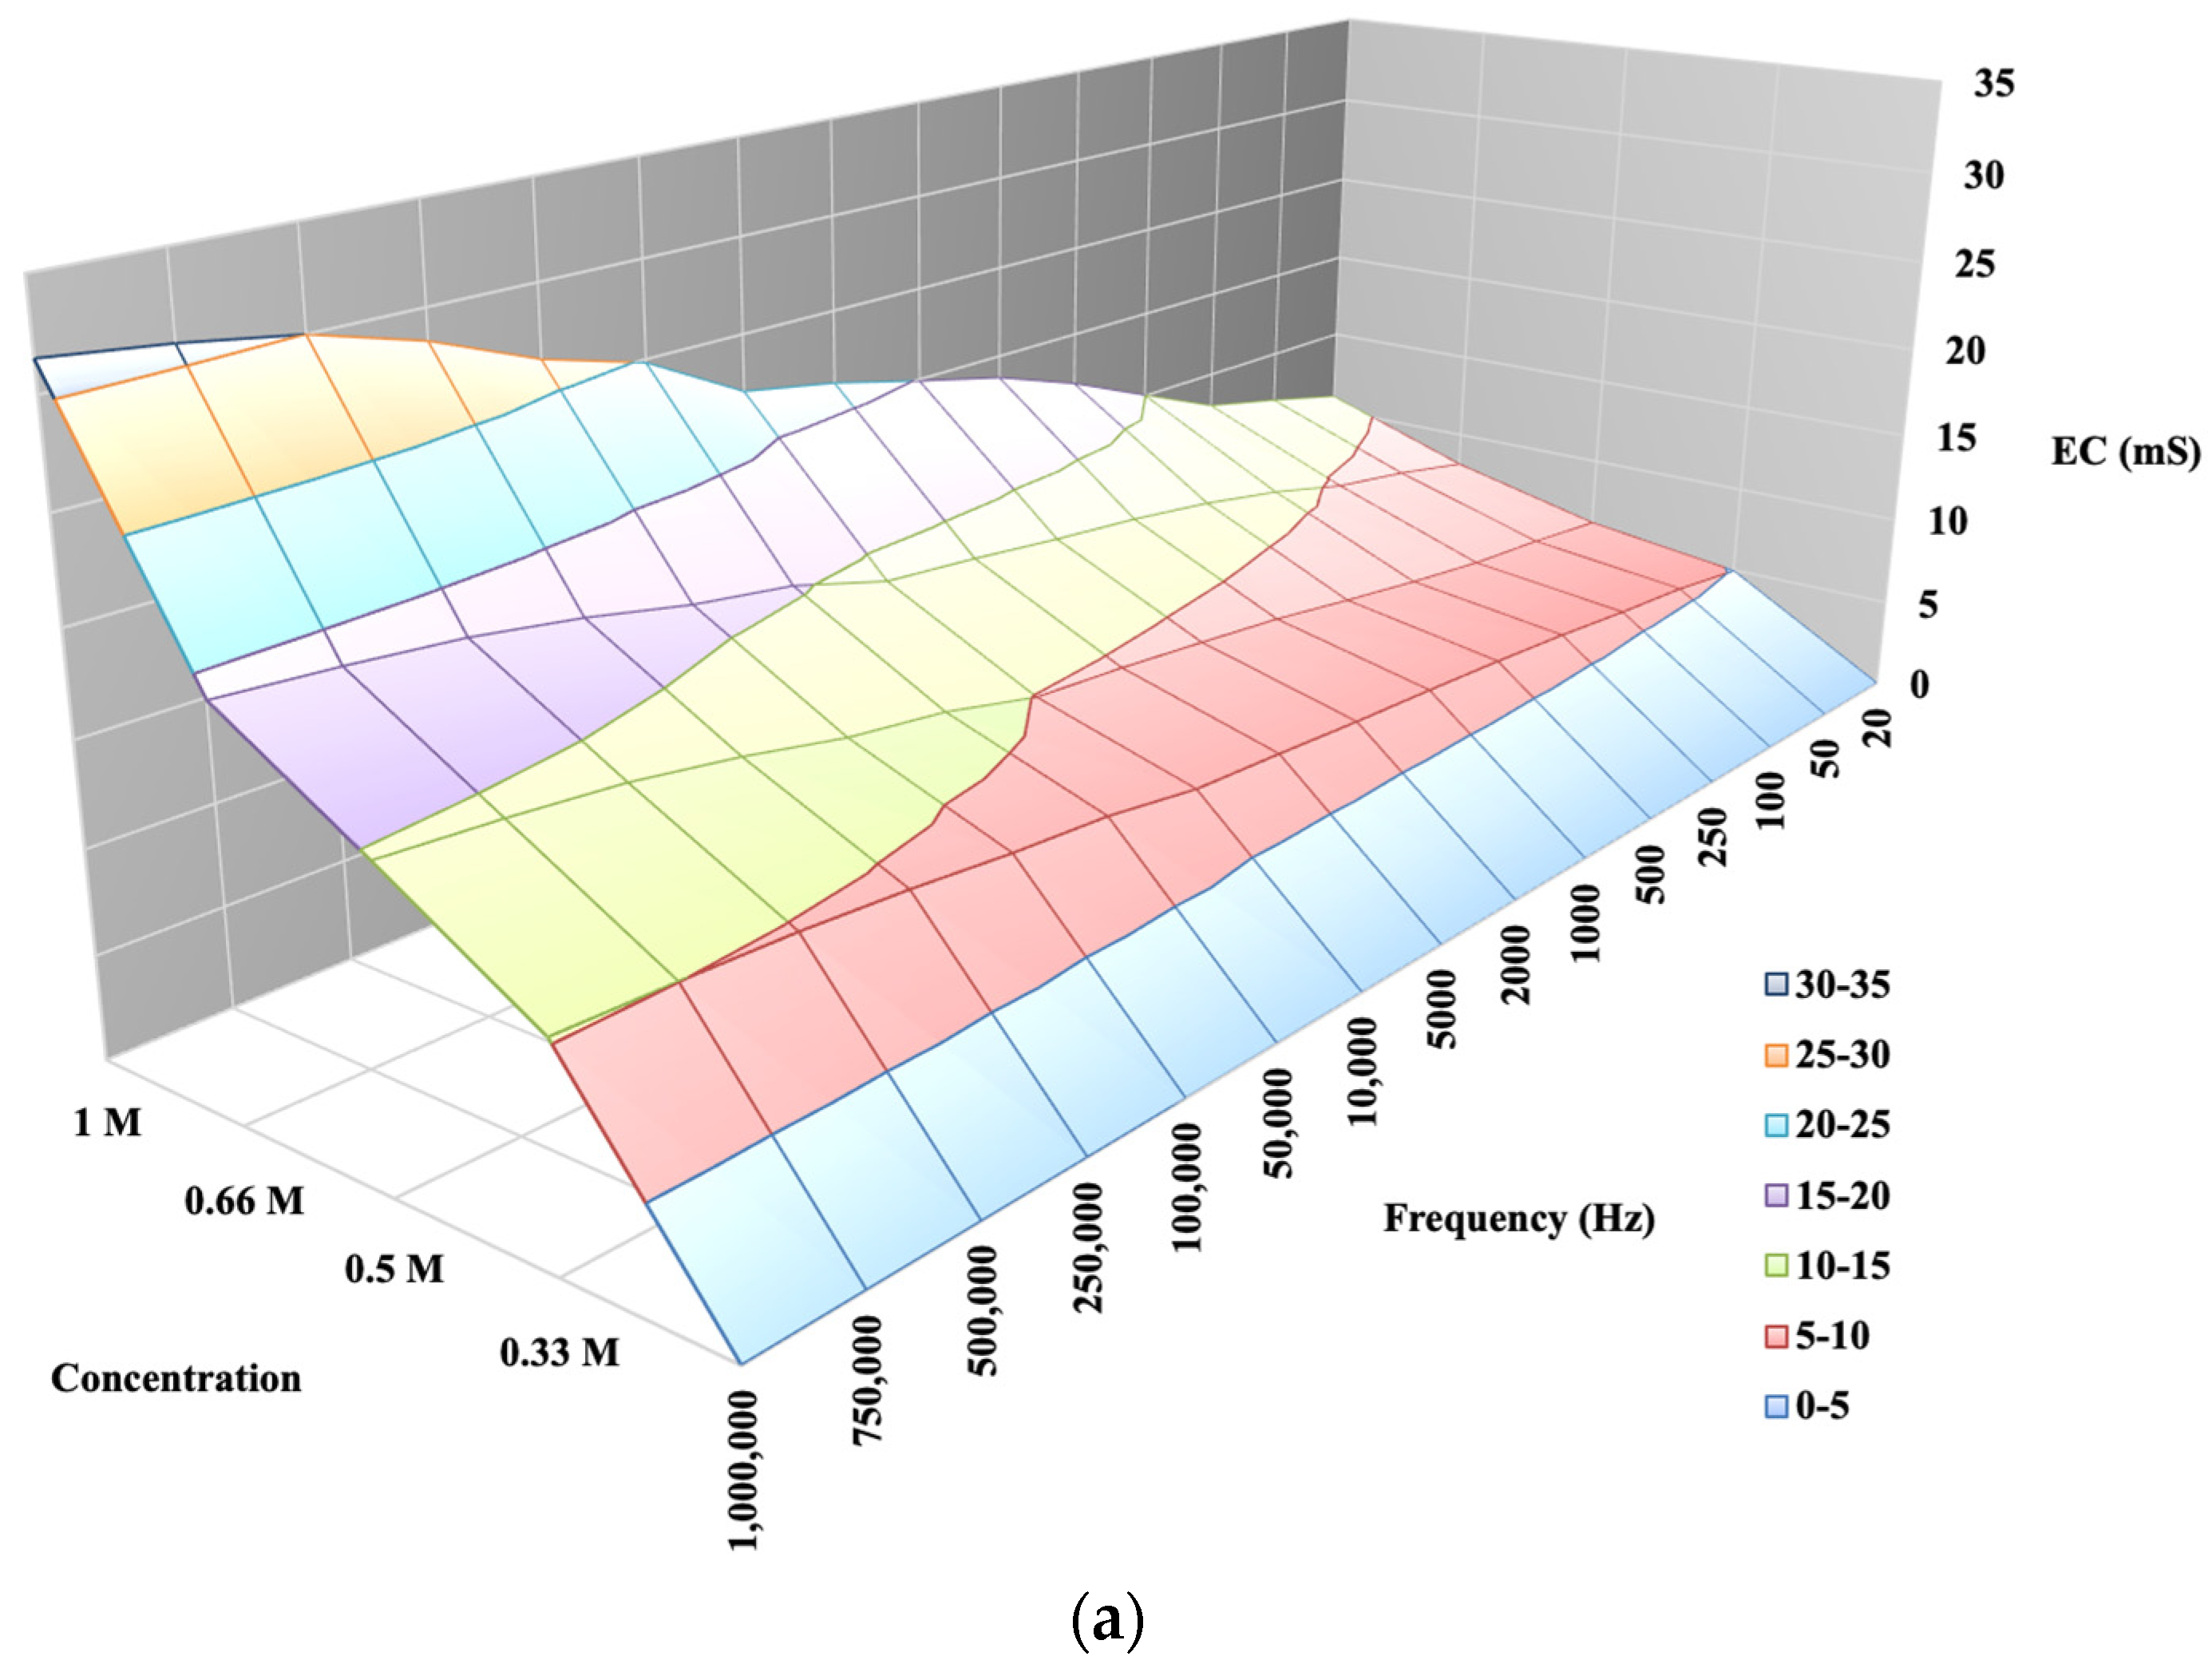
3.1. Determination of Response Functions for Soil Solutions Containing Potassium Cations
3.2. Determination of Response Functions for Calcium Cation Soil Solutions
3.3. Comparison of Potassium and Calcium Reference Functions
4. Conclusions
Author Contributions
Funding
Institutional Review Board Statement
Informed Consent Statement
Data Availability Statement
Conflicts of Interest
References
- Corwin, D.L.; Lesch, S.M. Apparent soil electrical conductivity measurements in agriculture. Comput. Electron. Agric. 2005, 46, 11–43. [Google Scholar] [CrossRef]
- Rhoades, J.D.; Manteghi, N.A.; Shouse, P.J.; Alves, W.J. Soil electrical conductivity and soil salinity: New formulations and calibrations. Soil Sci. Soc. Am. J. 1989, 53, 433–439. [Google Scholar] [CrossRef]
- Stefanovits, P.; Filep, G.; Füleky, G. Soil Science (Talajtan); Mezőgazdasági Kiadó: Budapest, Hungary, 1999; p. 470. (In Hungarian) [Google Scholar]
- Waluyo, I.; Huang, C.; Nordlund, D.; Bergmann, U.; Weiss, T.M.; Pettersson, L.G.; Nilsson, A. The structure of water in the hydration shell of cations from X-ray Raman and small angle x-ray scattering measurements. J. Chem. Phys. 2011, 134, 064513. [Google Scholar] [CrossRef] [PubMed]
- Ohtaki, H.; Radnai, T. Structure and dynamics of hydrated ions. Chem. Rev. 1993, 93, 1157–1204. [Google Scholar] [CrossRef]
- Marcus, Y. Effect of Ions on the Structure of Water: Structure Making and Breaking. Chem. Rev. 2009, 109, 1346–1370. [Google Scholar] [CrossRef] [PubMed]
- Jungwirth, P.; Tobias, D.J. Specific Ion Effects at the Air/Water Interface. Chem. Rev. 2006, 106, 1259–1281. [Google Scholar] [CrossRef]
- Ghosal, S.; Hemminger, J.C.; Bluhm, H.; Mun, B.S.; Hebenstreit, E.L.; Ketteler, G.; Ogletree, D.F.; Requejo, F.G.; Salmeron, M. Electron spectroscopy of aqueous solution interfaces reveals surface enhancement of halides. Science 2005, 307, 563–566. [Google Scholar] [CrossRef]
- Craig, V.S.J.; Henry, C.L. Specific Ion Effects at the Air–Water Interface: Experimental Studies. Specif. Ion Eff. 2009, 191–214. [Google Scholar] [CrossRef]
- Dayo-Olagbende, G.O.; Ewulo, B.S. Ionic Mobility of Cations as Affected by Redox Status of Two Different Soil Textures. Bulg. J. Soil Sci. 2021, 6, 18–32. [Google Scholar]
- Rengasamy, P.; Sumner, M.E. Processes Involved in Sodic Behaviour. In Sodic Soils: Distribution, Properties, Management, and Environmental Consequences; Sumner, M.E., Naidu, R., Eds.; Oxford University Press: New York, NY, USA, 1998; pp. 35–50. [Google Scholar]
- Rengasamy, P. Soil Chemistry Factors Confounding Crop Salinity Tolerance—A Review. Agronomy 2016, 6, 53. [Google Scholar] [CrossRef]
- Luo, J.; Ye, S.; Li, T.; Sarnello, E.; Li, H.; Liu, T. Distinctive Trend of Metal Binding Affinity via Hydration Shell Breakage in Nanoconfined Cavity. J. Phys. Chem. C 2019, 123, 14825–14833. [Google Scholar] [CrossRef]
- Hossain, M.S. Present Scenario of Global Salt Affected Soils, its Management and Importance of Salinity Research. Int. Res. J. Biol. Sci. 2019, 1, 1–3. [Google Scholar]
- Wicke, B.; Smeets, E.; Dornburg, V.; Vashev, B.; Gaiser, T.; Turkenburg, W.; Faaij, A. The global technical and economic potential of bioenergy from salt-affected soils. Energy Environ. Sci. 2011, 4, 2669–2681. [Google Scholar] [CrossRef]
- Massoud, F.I. Salt Affected Soils at a Global Scale and Concepts for Control. In FAO Land and Water Development Division, Technical Paper; Food and Agriculture Organization of the United Nations, FAO: Rome, Italy, 1981; p. 21. [Google Scholar]
- Lasia, A. Definition of Impedance and Impedance of Electrical Circuits. In Electrochemical Impedance Spectroscopy and Its Applications; Lasia, A., Ed.; Springer: New York, NY, USA, 2014; pp. 7–66. [Google Scholar]
- Li, M.; Wang, M.; Wang, Q. Development andperformance test of a portable soil EC detector. Appl. Eng. Agric. 2006, 22, 301–307. [Google Scholar] [CrossRef]
- Seifi, M.R.; Alimardani, R.; Sharifi, A. Design and development of a portable soil electrical conductivity detector. Asian J. Agric. Sci. 2010, 2, 168–173. [Google Scholar]
- Pei, X.; Zheng, L.; Zhao, Y.; Zhang, M.; Li, M. Development and Performance Test for a New Type of Portable Soil EC Detector. In Proceedings of the 6th Computer and Computing Technologies in Agriculture (CCTA), Zhangjiajie, China, 19–21 October 2012; pp. 418–424. [Google Scholar]
- Scandurra, A.; Ruffino, F.; Censabella, M.; Terrasi, A.; Grimaldi, M.G. Dewetted Gold Nanostructures onto Exfoliated Graphene Paper as High Efficient Glucose Sensor. Nanomaterials 2019, 9, 1794. [Google Scholar] [CrossRef]
- Khan, M.S.I.; Rahman, A.; Islam, S.; Nasir, M.K.; Band, S.S.; Mosavi, A. IoT and Wireless Sensor Networking-based Effluent Treatment Plant Monitoring System. Acta Polytech. Hung. 2021, 18, 205–224. [Google Scholar] [CrossRef]
- Friedman, S.P. Soil properties influencing apparent electrical conductivity: A review. Comput. Electron. Agric. 2005, 46, 45–70. [Google Scholar] [CrossRef]
- Johnson, P.M.S.C. The Design of an Integrated Soil Moisture Sensor for Agriculture; Griffith University: Brisbane, Australia, 2007. [Google Scholar]
- Groom, D. Common misconceptions about capacitively coupled resistivity (CCR) what it is and how it works. In Proceedings of the 21st EEGS Symposium on the Application of Geophysics to Engineering and Environmental Problems, Philadelphia, PA, USA, 6–10 April 2008. [Google Scholar]
- Visconti, F.; De Paz, J.M. Electrical Conductivity Measurements in Agriculture: The Assessment of Soil Salinity. In New Trends and Developments in Metrology; IntechOpen: London, UK, 2016. [Google Scholar] [CrossRef]
- Špikić, D.; Švraka, M.; Vasić, D. Effectiveness of Electrostatic Shielding in High-Frequency Electromagnetic Induction Soil Sensing. Sensors 2022, 22, 3000. [Google Scholar] [CrossRef]
- Stewart, D.C.; Anderson, W.L.; Grover, T.P.; Labson, V.F. Shallow subsurface mapping by electromagnetic sounding in the 300 kHz to 30 MHz range; model studies and prototype systems assessment. Geophysics 1994, 59, 1201–1210. [Google Scholar] [CrossRef]
- Horváth, J.; Kátai, L.; Szabó, I. Analysis of the Soil Selective Potassium Content, using Multifrequency EC Sensors. Acta Polytech. Hung. 2023, 20, 231–248. [Google Scholar] [CrossRef]
- Horváth, J.; Kátai, L.; Szabó, I. Compatibility analysis of the soil calcium content by multifrequency ec sensors. Int. J. Res. Granthaalayah 2023, 11, 175–187. [Google Scholar] [CrossRef]
- Horváth, J.; Kátai, L.; Czinkota, I.; Szabó, I. Using multi-frequency electrical conductivity measurement to determine the selective salinity in a two-component salt solution. Agron. Res. 2023, 21, 1228–1142. [Google Scholar]
- Horváth, J.; Korzenszky, P.; Kátai, L.; Szabó, I. On the go soil sensor development in AGIT FIEK Programme. Mech. Eng. Lett. R D Res. Dev. 2022, 23, 33–48. [Google Scholar]


| Concentration | KCl (g) | CaCl2 (g) |
|---|---|---|
| 1 M | 521.85 | 776.86 |
| 0.66 M | 344.42 | 512.72 |
| 0.5 M | 260.92 | 388.43 |
| 0.33 M | 172.21 | 256.36 |
| 0 M | 0 | 0 |
| Concentration | K+ | Ca2+ |
|---|---|---|
| 1 M | = 64.95x0.0282 | = 235.05x0.0246 |
| 0.66 M | = 52.885x0.0118 | = 132.98x0.0141 |
| 0.5 M | = 48.714x0.0123 | = 91.338x0.0201 |
| 0.33 M | = 20.173x0.017 | = 67.027x0.03 |
Disclaimer/Publisher’s Note: The statements, opinions and data contained in all publications are solely those of the individual author(s) and contributor(s) and not of MDPI and/or the editor(s). MDPI and/or the editor(s) disclaim responsibility for any injury to people or property resulting from any ideas, methods, instructions or products referred to in the content. |
© 2024 by the authors. Licensee MDPI, Basel, Switzerland. This article is an open access article distributed under the terms and conditions of the Creative Commons Attribution (CC BY) license (https://creativecommons.org/licenses/by/4.0/).
Share and Cite
Horváth, J.; Kátai, L.; Szabó, I.; Korzenszky, P. An Electrical Conductivity Sensor for the Selective Determination of Soil Salinity. Sensors 2024, 24, 3296. https://doi.org/10.3390/s24113296
Horváth J, Kátai L, Szabó I, Korzenszky P. An Electrical Conductivity Sensor for the Selective Determination of Soil Salinity. Sensors. 2024; 24(11):3296. https://doi.org/10.3390/s24113296
Chicago/Turabian StyleHorváth, János, László Kátai, István Szabó, and Péter Korzenszky. 2024. "An Electrical Conductivity Sensor for the Selective Determination of Soil Salinity" Sensors 24, no. 11: 3296. https://doi.org/10.3390/s24113296
APA StyleHorváth, J., Kátai, L., Szabó, I., & Korzenszky, P. (2024). An Electrical Conductivity Sensor for the Selective Determination of Soil Salinity. Sensors, 24(11), 3296. https://doi.org/10.3390/s24113296