
Willingness of Participation in an Application-Based Digital Data Collection among Different Social Groups and Smartphone User Clusters

 , ,
, ,
Abstract
1. Introduction
Factors Determining Willingness to Participate
2. Materials and Methods
3. Results
4. Discussion
Author Contributions
Funding
Institutional Review Board Statement
Informed Consent Statement
Data Availability Statement
Acknowledgments
Conflicts of Interest
Appendix A

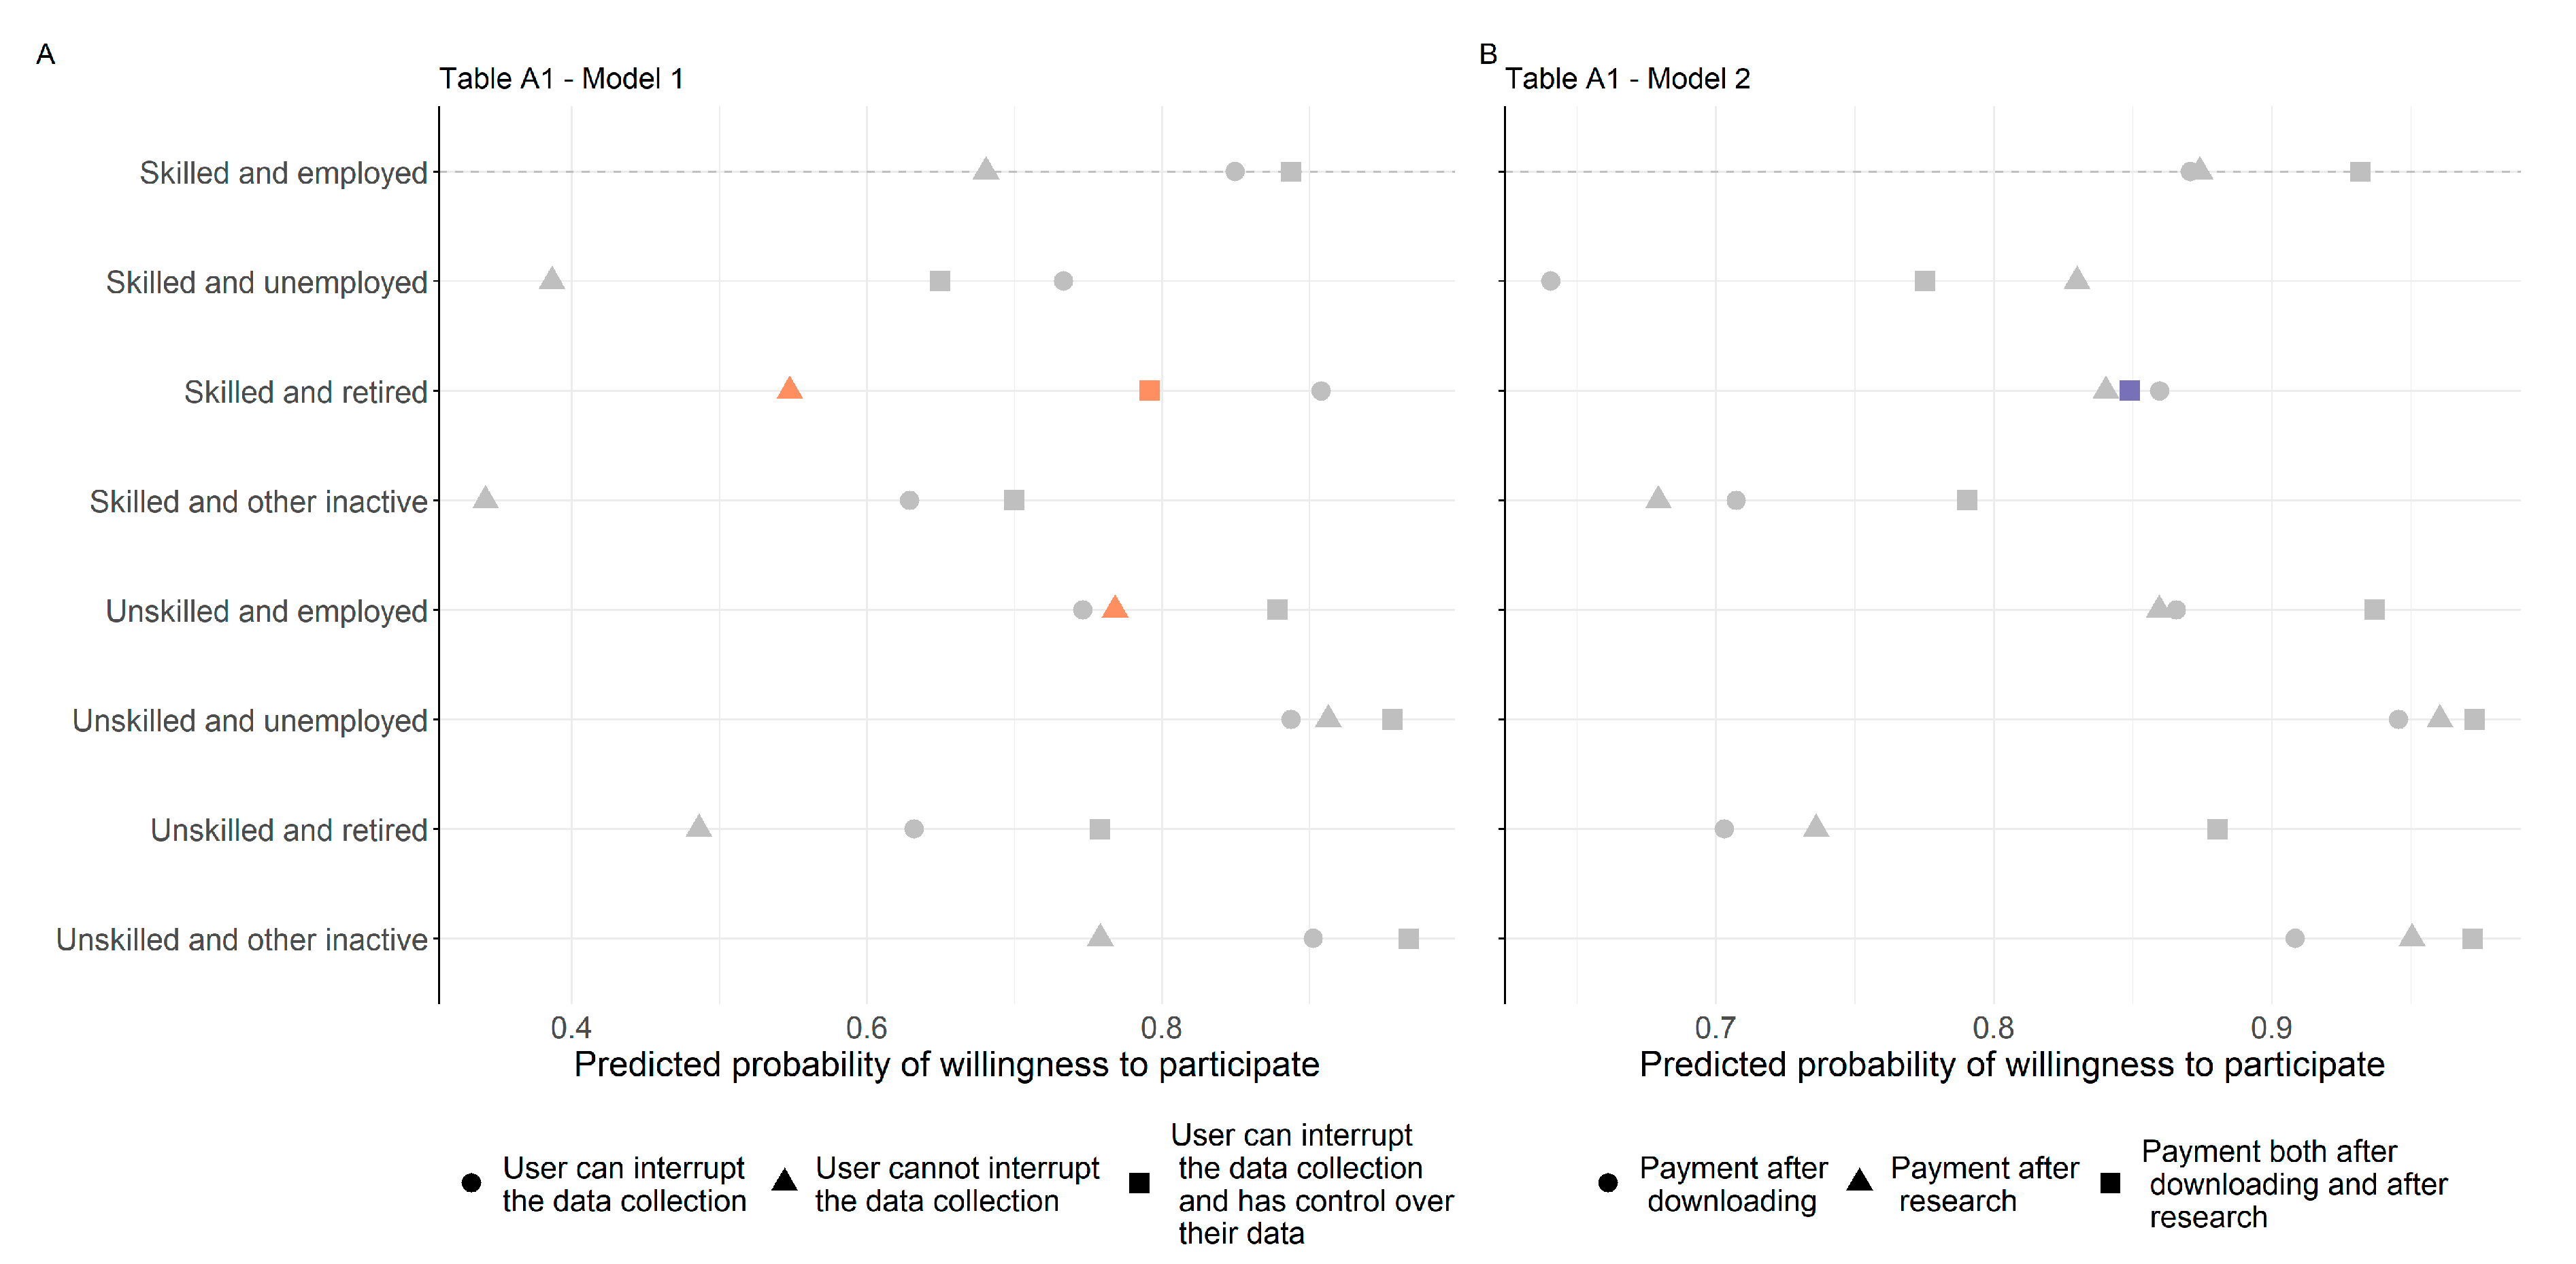
| DV: Willingness to Participate | |||||
|---|---|---|---|---|---|
| Model 1 | Model 2 | Model 3 | Model 4 | Model 5 | |
| Vignette-level variables | |||||
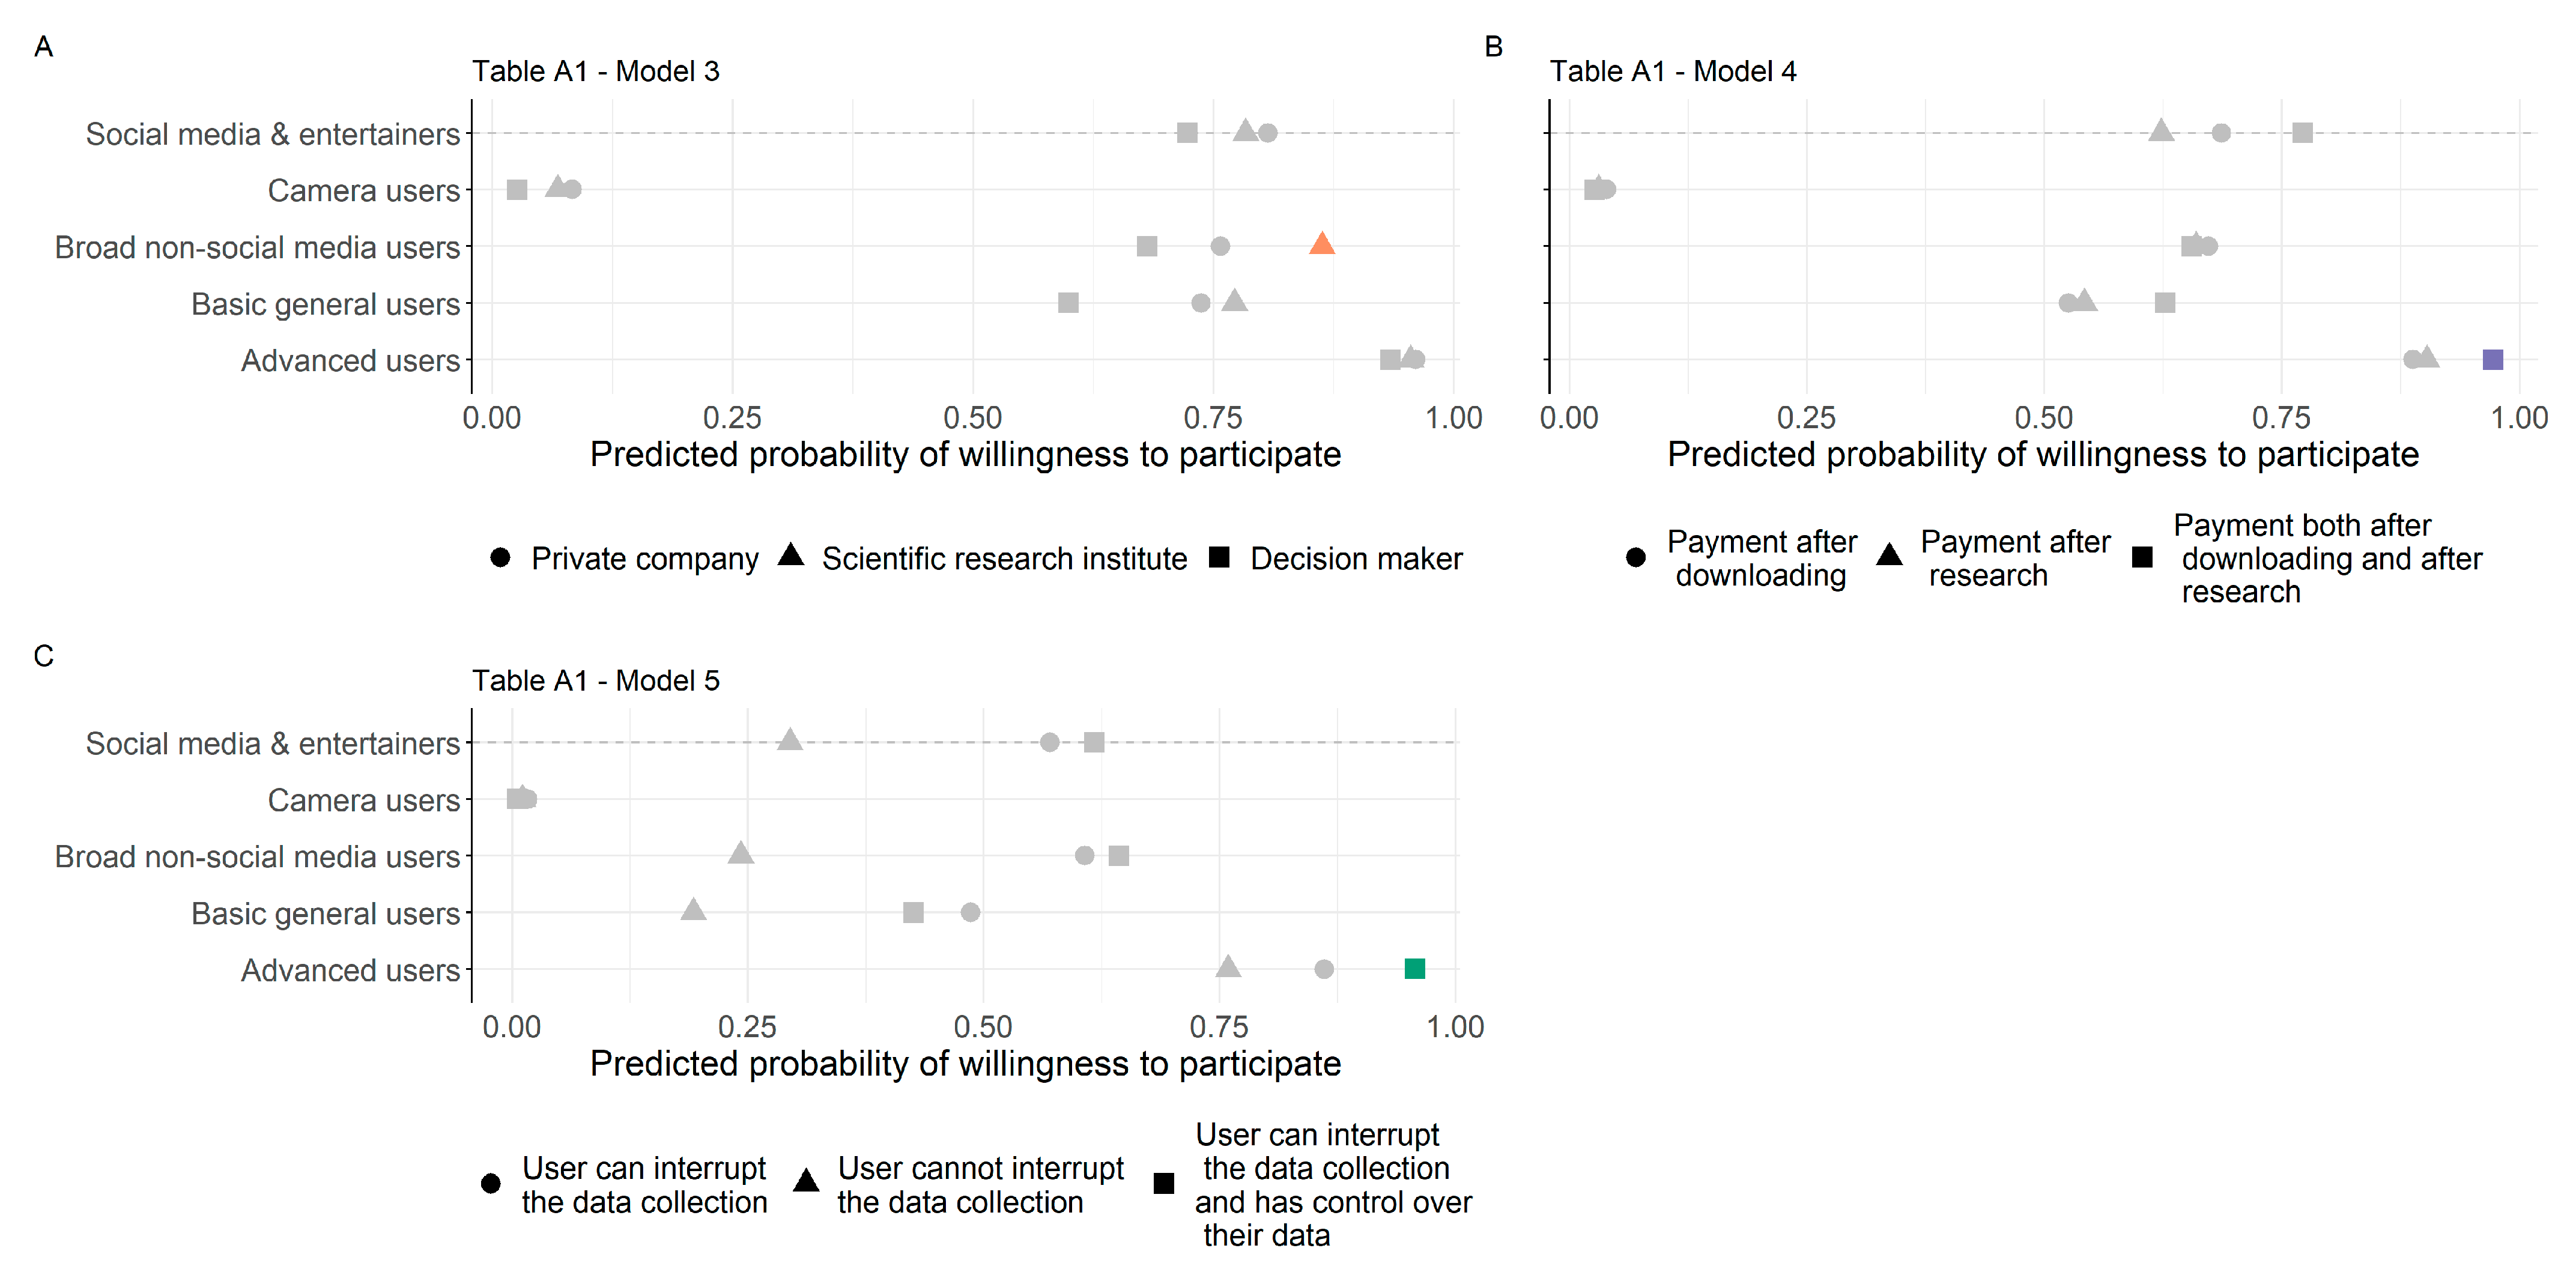
| Organiser of the research (ref: private company) | |||||
| Scientific research institute | 0.07 (−0.11) | 0.08 (−0.1) | −0.14 (−0.22) | 0.04 (−0.12) | −0.02 (−0.13) |
| Decision-maker | −0.42 *** (−0.11) | −0.41 *** (−0.1) | −0.47 (−0.24) | −0.55 *** (−0.12) | −0.58 *** (−0.12) |
| Data collected (ref: spatial movement) | |||||
| Mobile usage | −0.28 (−0.17) | −0.18 (−0.16) | −0.15 (−0.19) | −0.06 (−0.18) | −0.23 (−0.19) |
| Communication habits | −0.37 * (−0.18) | −0.26 (−0.17) | −0.2 (−0.2) | −0.19 (−0.19) | −0.36 (−0.2) |
| Movement and usage | −0.23 (−0.16) | −0.18 (−0.15) | −0.15 (−0.18) | −0.08 (−0.17) | −0.17 (−0.18) |
| Movement and comm. habits | 0.04 (−0.18) | 0.08 (−0.17) | 0.15 (−0.2) | 0.18 (−0.19) | 0.07 (−0.21) |
| Mobile usage and comm. habits | −0.18 (−0.17) | −0.1 (−0.16) | 0.03 (−0.19) | 0.04 (−0.18) | −0.07 (−0.19) |
| Movement, usage and comm. habits | −0.1 (−0.18) | −0.07 (−0.17) | −0.12 (−0.2) | −0.09 (−0.19) | −0.1 (−0.21) |
| Length of the research (Ref: one month) | |||||
| Six-month duration | −1.29 *** (−0.09) | −1.19 *** (−0.09) | −1.39 *** (−0.1) | −1.33 *** (−0.1) | −1.48 *** (−0.11) |
| Incentive (ref: after downloading the app) | |||||
| After the end of the research EUR 15 | 0.09 (−0.11) | 0.03 (−0.15) | −0.01 (−0.13) | −0.28 (−0.21) | −0.01 (−0.13) |
| Both after downloading the app and at the end of the research EUR 15-EUR15 | 0.68 *** (−0.11) | 0.71 *** (−0.16) | 0.66 *** (−0.13) | 0.44 (−0.25) | 0.73 *** (−0.13) |
| Interruption and control (ref: user can interrupt the data collection) | |||||
| User cannot interrupt the data collection | −0.98 *** (−0.16) | −1.01 *** (−0.11) | −1.13 *** (−0.13) | −1.09 *** (−0.12) | −1.16 *** (−0.23) |
| User can interrupt the data collection and has control over their data | 0.33 (−0.18) | 0.21 * (−0.1) | 0.31 * (−0.12) | 0.32 ** (−0.12) | 0.19 (−0.31) |
| Respondent level socio-demographic variables | |||||
| Age 40–59 (ref: 18–39) | −1.42 ** (−0.49) | −1.37 ** (−0.48) | −0.89 (−0.62) | 0.01 (−0.51) | −0.16 (−0.52) |
| Age 60+ | −2.52 ** (−0.82) | 1.9491 | −0.83 (−0.9) | 0.17 (−0.79) | −0.18 (−0.81) |
| Gender (ref: men) | −0.44 (−0.45) | −0.57 (−0.46) | −0.39 (−0.51) | −0.35 (−0.45) | 0.22 (−0.45) |
| Town (ref: capital) | 1.13 * (−0.52) | 0.77 (−0.52) | 0.77 (−0.63) | 0.78 (−0.54) | 1.12 * (−0.55) |
| Village | 1.22 * (−0.6) | 0.85 (−0.6) | 0.67 (−0.75) | 0.51 (−0.62) | 1.11 (−0.63) |
| Skilled–retired (ref: skilled–employed) | 0.56 (−0.92) | −0.1 (−0.86) | −2.15 (−1.49) | −0.43 (−1.26) | −0.3 (−1.43) |
| Skilled–unemployed | −0.72 (−1.08) | −1.33 (−0.98) | −0.68 (−0.98) | −0.02 (−0.83) | 0.24 (−0.9) |
| Skilled–other inactive | −1.2 (−0.77) | −1.02 (−0.7) | −1.93 * (−0.84) | −0.53 (−0.77) | −1.29 (−0.82) |
| Unskilled–employed | −0.65(−0.67) | −0.04 (−0.59) | −0.37 (−0.79) | −0.64 (−0.66) | −0.45 (−0.79) |
| Unskilled–unemployed | 0.34 (−1.52) | 0.95 (−1.33) | −0.11 (−1.73) | −0.69 (−1.49) | 0.03 (−1.59) |
| Unskilled–retired | −1.19 (−1.18) | −1.04 (−1.06) | −1.35 (−1.3) | −1.36 (−1.11) | −1.52 (−1.12) |
| Unskilled–other inactive | 0.49 (−1.17) | 0.39 (−1.05) | −0.84 (−1.42) | −0.37 (−1.21) | −1.44 (−1.21) |
| Typology of smartphone use (ref: social media and entertainment) | |||||
| Broad non-social-media users | −0.29 (−0.9) | −0.06 (−0.75) | 0.15 (−0.81) | ||
| Basic general users | −0.4 (−0.79) | −0.68 (−0.65) | −0.34 (−0.71) | ||
| Camera users | −3.83 *** (−1.13) | −3.99 *** (−0.95) | −4.37 *** (−0.99) | ||
| Advanced users | 1.75 * (−0.7) | 1.29 * (−0.57) | 1.54 * (−0.63) | ||
| Cross-level interaction terms | |||||
| Skilled–unemployed * User cannot interrupt the data collection | −0.5 (−0.54) | ||||
| Skilled–retired * User cannot interrupt the data collection | −1.13 ** (−0.43) | ||||
| Skilled–other inactive * User cannot interrupt the data collection | −0.21 (−0.37) | ||||
| Unskilled–employed * User cannot interrupt the data collection | 1.09 ** (−0.36) | ||||
| Unskilled–unemployed * User cannot interrupt the data collection | 1.26 (−0.83) | ||||
| Unskilled–retired * User cannot interrupt the data collection | 0.38 (−0.62) | ||||
| Unskilled–other inactive * User cannot interrupt the data collection | −0.11 (−0.61) | ||||
| Skilled–unemployed * User can interrupt the data collection and has control over their data | −0.73 (−0.59) | ||||
| Skilled–retired * User can interrupt the data collection and has control over their data | −1.29 ** (−0.44) | ||||
| Skilled–other inactive * User can interrupt the data collection and has control over their data | −0.02 (−0.41) | ||||
| Unskilled–employed * User can interrupt the data collection and has control over their data | 0.56 (−0.4) | ||||
| Unskilled–unemployed * User can interrupt the data collection and has control over their data | 0.69 (−0.98) | ||||
| Unskilled–retired * User can interrupt the data collection and has control over their data | 0.27 (−0.64) | ||||
| Unskilled–other inactive * User can interrupt the data collection and has control over their data | 0.84 (−0.7) | ||||
| Skilled–unemployed * After the end of the research | 0.98 (−0.51) | ||||
| Skilled–retired * After the end of the research | −0.18 (−0.37) | ||||
| Skilled–other inactive * After the end of the research | −0.16 (−0.33) | ||||
| Unskilled–employed * After the end of the research | −0.08 (−0.33) | ||||
| Unskilled–unemployed * After the end of the research | 0.3 (−0.84) | ||||
| Unskilled–retired * After the end of the research | 0.13 (−0.54) | ||||
| Unskilled–other inactive * After the end of the research | 0.63 (−0.53) | ||||
| Skilled–unemployed * Both after downloading the app and at the end of the research | −0.05 (−0.52) | ||||
| Skilled–retired * Both after downloading the app and at the end of the research | 0.3002 | ||||
| Skilled–other inactive * Both after downloading the app and at the end of the research | −0.26 (−0.36) | ||||
| Unskilled–employed * Both after downloading the app and at the end of the research | 0.13 (−0.35) | ||||
| Unskilled–unemployed * Both after downloading the app and at the end of the research | 0.02 (−0.74) | ||||
| Unskilled–retired * Both after downloading the app and at the end of the research | 0.43 (−0.63) | ||||
| Unskilled–other inactive * Both after downloading the app and at the end of the research | 0.55 (−0.59) | ||||
| Scientific research institute * Broad non-social-media users | 0.85 * (−0.4) | ||||
| Decision-maker * Broad non-social-media users | 0.09 (−0.45) | ||||
| Scientific research institute * Basic general users | 0.33 (−0.36) | ||||
| Decision-maker * Basic general users | −0.16 (−0.41) | ||||
| Scientific research institute * Camera users | −0.08 (−0.61) | ||||
| Decision-maker * Camera users | −0.78 (−0.69) | ||||
| Scientific research institute * Advanced users | 0.02 (−0.35) | ||||
| Decision-maker * Advanced users | −0.06 (−0.38) | ||||
| Broad non-social-media users * After the end of the research | 0.22 (−0.39) | ||||
| Basic general users * After the end of the research | 0.35 (−0.34) | ||||
| Camera users * After the end of the research | 0.04 (−0.6) | ||||
| Advanced users * After the end of the research | 0.43 (−0.32) | ||||
| Broad non-social-media users * Both after downloading the app and at the end of the research | −0.52 (−0.47) | ||||
| Basic general users * Both after downloading the app and at the end of the research | −0.02 (−0.44) | ||||
| Camera users * Both after downloading the app and at the end of the research | −0.83 (−0.71) | ||||
| Advanced users * Both after downloading the app and at the end of the research | 1.05 * (−0.41) | ||||
| Broad non-social-media users * User cannot interrupt the data collection | −0.42 (−0.45) | ||||
| Basic general users * User cannot interrupt the data collection | −0.23 (−0.39) | ||||
| Camera users * User cannot interrupt the data collection | 0.73 (−0.69) | ||||
| Advanced users * User cannot interrupt the data collection | 0.48 (−0.37) | ||||
| Broad non-social-media users * User can interrupt the data collection and has control over their data | −0.04 (−0.59) | ||||
| Basic general users * User can interrupt the data collection and has control over their data | −0.44 (−0.53) | ||||
| Camera users * User can interrupt the data collection and has control over their data | −1.38 (−0.83) | ||||
| Advanced users * User can interrupt the data collection and has control over their data | 1.10 * (−0.5) | ||||
| AIC | 6720.69 | 6792.82 | 5236.79 | 5253.7 | 5198.44 |
| BIC | 7052.36 | 7124.49 | 5543.22 | 5560.14 | 5504.88 |
| Observations | 10,000 | 10,000 | 7820 | 7820 | 7820 |
| Groups (respondents) | 1000 | 1000 | 782 | 782 | 782 |
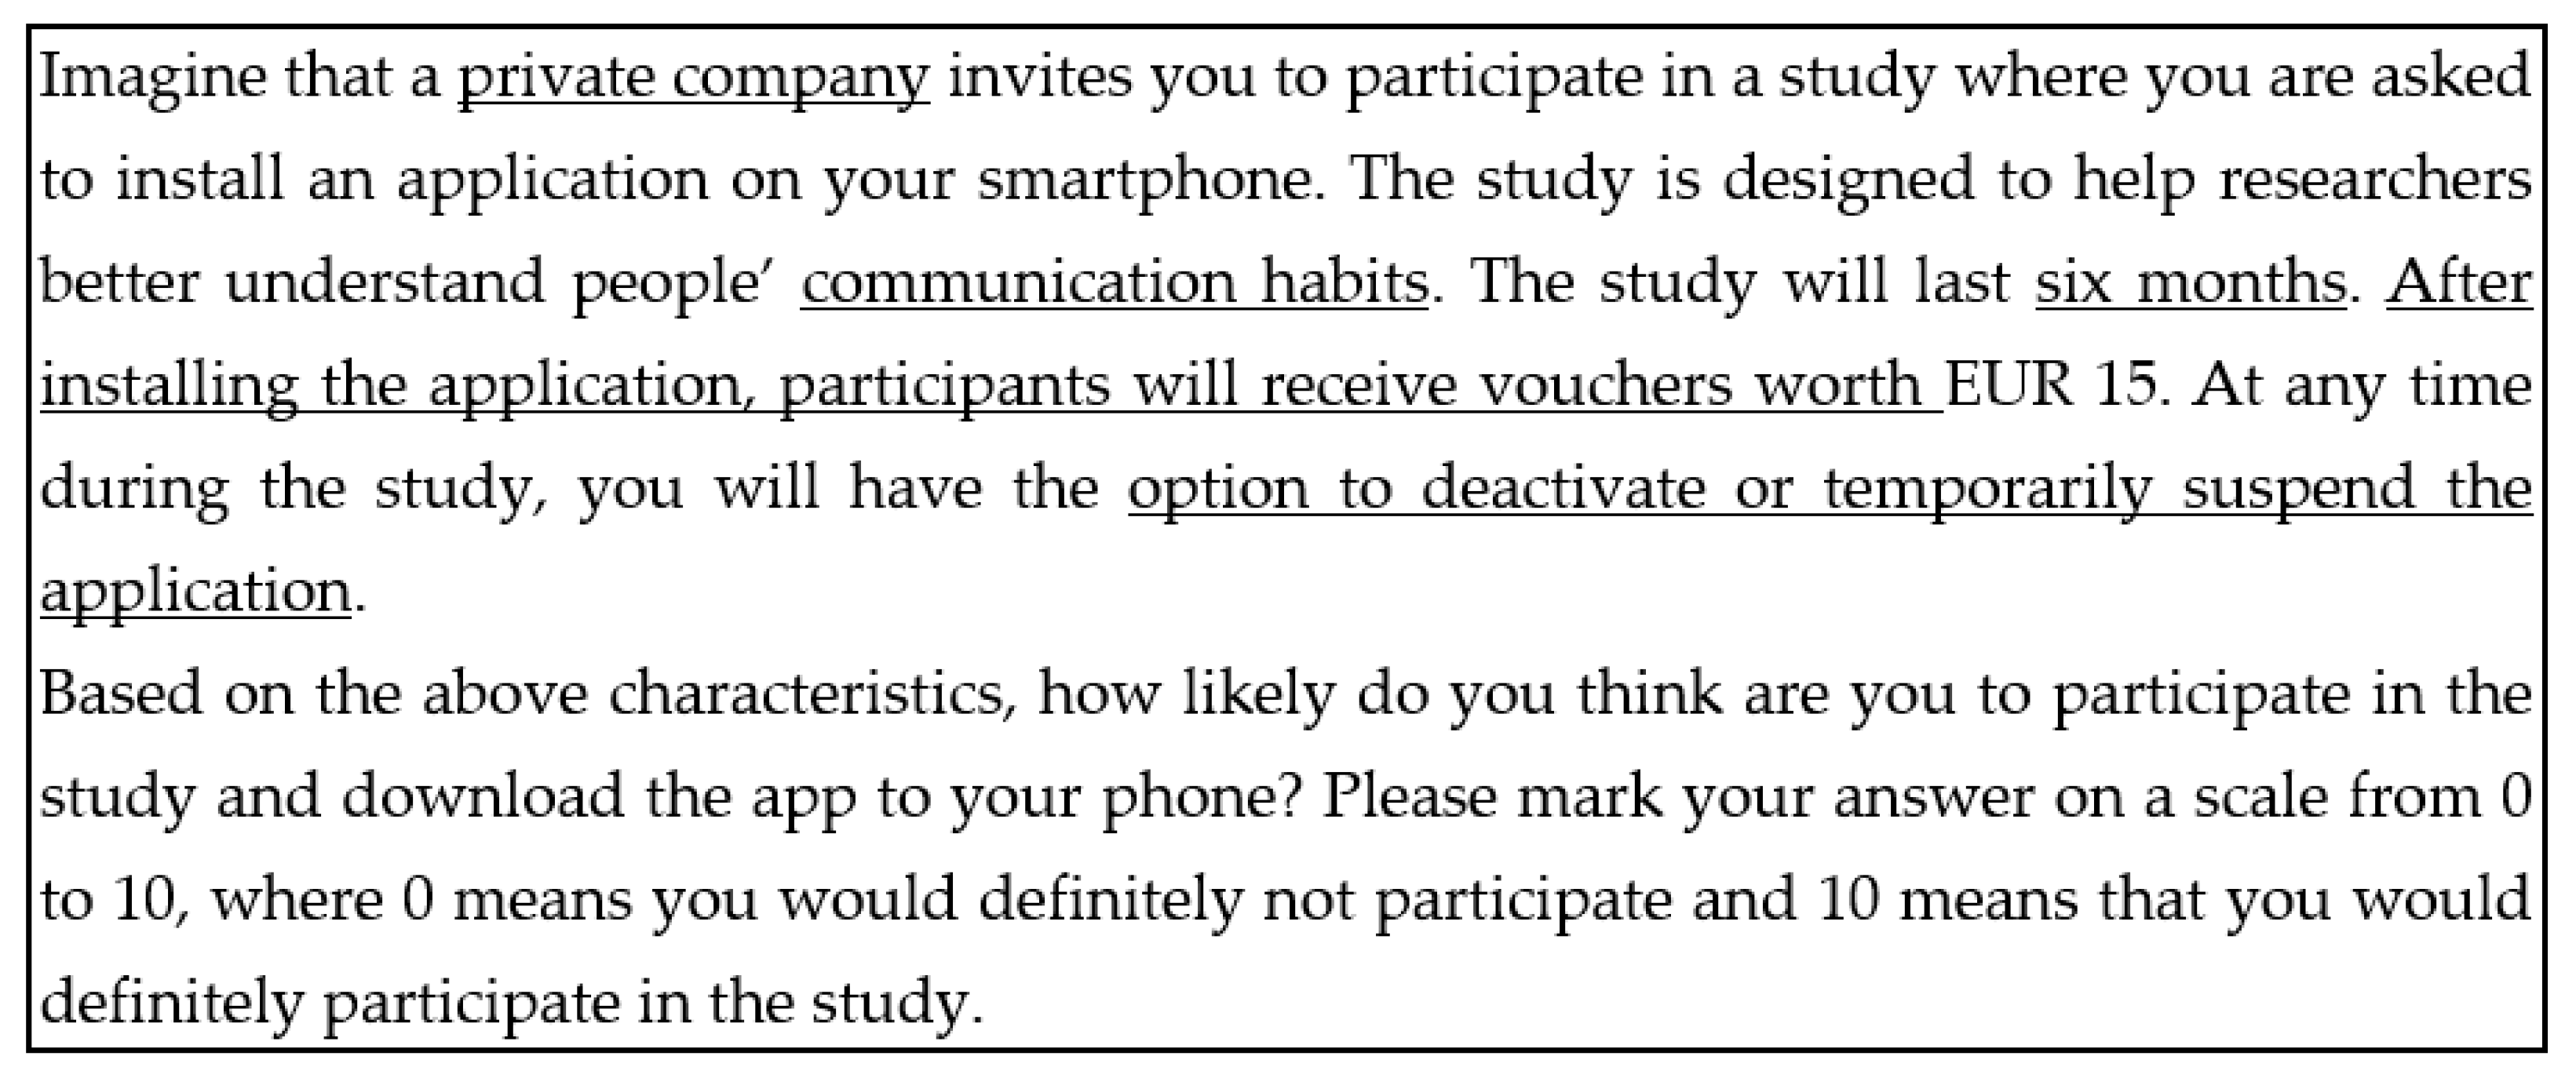
- (1)
- The 15 different activities for which one can use a smartphone.
| Yes | No | DK | |
|---|---|---|---|
| 1 | 2 | 8 |
| 1 | 2 | 8 |
| 1 | 2 | 8 |
| 1 | 2 | 8 |
| 1 | 2 | 8 |
| 1 | 2 | 8 |
| 1 | 2 | 8 |
| 1 | 2 | 8 |
| 1 | 2 | 8 |
| 1 | 2 | 8 |
| 1 | 2 | 8 |
| 1 | 2 | 8 |
| 1 | 2 | 8 |
| 1 | 2 | 8 |
| 1 | 2 | 8 |
- (2)
- The average self-estimated daily duration of smartphone screen time.
| Very Bad | Excellent | DK | Refusal | |||
| 1 | 2 | 3 | 4 | 5 | 8 | 9 |
- (3)
- Self-reported smartphone use skills.
References
- Couper, M.P. New Developments in Survey Data Collection. Annu. Rev. Sociol. 2017, 43, 121–145. [Google Scholar] [CrossRef]
- Szeitl, B. Revisiting the ESS R8 Sample a Year after—Lessons from a Re-Contact Survey to Test Patterns of Unit Non-Response in Hungary. Surv. Methods Insights Field 2021, 1–17. [Google Scholar] [CrossRef]
- Bethlehem, J. Selection Bias in Web Surveys: Selection Bias in Web Surveys. Int. Stat. Rev. 2010, 78, 161–188. [Google Scholar] [CrossRef]
- Scherpenzeel, A. Mixing Online Panel Data Collection with Innovative Methods. In Methodische Probleme von Mixed-Mode-Ansätzen in der Umfrageforschung; Springer VS Wiesbaden: Wiesbaden, Germany, 2017; pp. 27–49. [Google Scholar]
- Ságvári, B.; Gulyás, A.; Koltai, J. Attitudes towards Participation in a Passive Data Collection Experiment. Sensors 2021, 21, 6085. [Google Scholar] [CrossRef]
- De Bruijne, M.; Wijnant, A. Comparing Survey Results Obtained via Mobile Devices and Computers: An Experiment with a Mobile Web Survey on a Heterogeneous Group of Mobile Devices versus a Computer-Assisted Web Survey. Soc. Sci. Comput. Rev. 2013, 31, 482–504. [Google Scholar] [CrossRef]
- De Bruijne, M.; Wijnant, A. Mobile Response in Web Panels. Soc. Sci. Comput. Rev. 2014, 32, 728–742. [Google Scholar] [CrossRef]
- Link, M.W.; Murphy, J.; Schober, M.F.; Buskirk, T.D.; Hunter Childs, J.; Langer Tesfaye, C. Mobile Technologies for Conducting, Augmenting and Potentially Replacing Surveys: Executive Summary of the AAPOR Task Force on Emerging Technologies in Public Opinion Research. Public Opin. Q. 2014, 78, 779–787. [Google Scholar] [CrossRef]
- Kreuter, F.; Haas, G.-C.; Keusch, F.; Bähr, S.; Trappmann, M. Collecting Survey and Smartphone Sensor Data with an App: Opportunities and Challenges around Privacy and Informed Consent. Soc. Sci. Comput. Rev. 2020, 38, 533–549. [Google Scholar] [CrossRef]
- Kreuter, F.; Presser, S.; Tourangeau, R. Social Desirability Bias in Cati, Ivr, and Web Surveysthe Effects of Mode and Question Sensitivity. Public Opin. Q. 2008, 72, 847–865. [Google Scholar] [CrossRef]
- Younis, E.M.; Kanjo, E.; Chamberlain, A. Designing and Evaluating Mobile Self-Reporting Techniques: Crowdsourcing for Citizen Science. Pers. Ubiquitous Comput. 2019, 23, 329–338. [Google Scholar] [CrossRef]
- Christner, C.; Urman, A.; Adam, S.; Maier, M. Automated Tracking Approaches for Studying Online Media Use: A Critical Review and Recommendations. Commun. Methods Meas. 2021, 16, 79–95. [Google Scholar] [CrossRef]
- Revilla, M.; Ochoa, C.; Loewe, G. Using Passive Data from a Meter to Complement Survey Data in Order to Study Online Behavior. Soc. Sci. Comput. Rev. 2017, 35, 521–536. [Google Scholar] [CrossRef]
- Bourdieu, P. Public Opinion Does Not Exist. Commun. Cl. Struggl. 1979, 1, 124–130. [Google Scholar]
- Tourangeau, R.; Rips, L.J.; Rasinski, K. The Psychology of Survey Response; Cambridge University Press: Cambridge, UK, 2000. [Google Scholar]
- Palczyńska, M.; Rynko, M. ICT Skills Measurement in Social Surveys: Can We Trust Self-Reports? Qual. Quant. 2021, 55, 917–943. [Google Scholar] [CrossRef]
- Palmer, J.R.; Espenshade, T.J.; Bartumeus, F.; Chung, C.Y.; Ozgencil, N.E.; Li, K. New Approaches to Human Mobility: Using Mobile Phones for Demographic Research. Demography 2013, 50, 1105–1128. [Google Scholar] [CrossRef] [PubMed]
- Philip, B.J.; Abdelrazek, M.; Bonti, A.; Barnett, S.; Grundy, J. Data Collection Mechanisms in Health and Wellness Apps: Review and Analysis. JMIR Mhealth Uhealth. 2022, 10, e30468. [Google Scholar] [CrossRef] [PubMed]
- Kolakowska, A.; Szwoch, W.; Szwoch, M. A Review of Emotion Recognition Methods Based on Data Acquired via Smartphone Sensors. Sensors 2020, 20, 6367. [Google Scholar] [CrossRef] [PubMed]
- Struminskaya, B.; Toepoel, V.; Lugtig, P.; Haan, M.; Luiten, A.; Schouten, B. Understanding Willingness to Share Smartphone-Sensor Data. Public Opin. Q. 2020, 84, 725–759. [Google Scholar] [CrossRef]
- Keusch, F.; Struminskaya, B.; Antoun, C.; Couper, M.P.; Kreuter, F. Willingness to Participate in Passive Mobile Data Collection. Public Opin. Q. 2019, 83, 210–235. [Google Scholar] [CrossRef] [PubMed]
- Cabalquinto, E.; Hutchins, B. “It Should Allow Me to Opt in or Opt out”: Investigating Smartphone Use and the Contending Attitudes of Commuters towards Geolocation Data Collection. Telemat. Inform. 2020, 51, 101403. [Google Scholar] [CrossRef]
- Struminskaya, B.; Lugtig, P.; Toepoel, V.; Schouten, B.; Giesen, D.; Dolmans, R. Sharing Data Collected with Smartphone Sensors: Willingness, Participation, and Nonparticipation Bias. Public Opin. Q. 2021, 85, 423–462. [Google Scholar] [CrossRef] [PubMed]
- Bricka, S.; Zmud, J.; Wolf, J.; Freedman, J. Household Travel Surveys with GPS: An Experiment. Transp. Res. Rec. 2009, 2105, 51–56. [Google Scholar] [CrossRef]
- Biler, S.; Šenk, P.; Winklerová, L. Willingness of Individuals to Participate in a Travel Behavior Survey Using GPS Devices. In Proceedings of the Conference on New Techniques and Technologies for Statistics, Brussels, Belgium, 5–7 March 2013. [Google Scholar]
- Toepoel, V.; Lugtig, P. What Happens If You Offer a Mobile Option to Your Web Panel? Evidence from a Probability-Based Panel of Internet Users. Soc. Sci. Comput. Rev. 2014, 32, 544–560. [Google Scholar] [CrossRef]
- Pinter, R. Willingness of Online Access Panel Members to Participate in Smartphone Application-Based Research. In Mobile Research Methods: Opportunities and Challenges of Mobile Research Methodologies; Ubiquity Press: London, UK, 2015; pp. 141–156. [Google Scholar]
- Revilla, M.; Toninelli, D.; Ochoa, C.; Loewe, G. Do Online Access Panels Need to Adapt Surveys for Mobile Devices? Internet Res. 2016, 26, 1209–1227. [Google Scholar] [CrossRef]
- Wenz, A.; Jäckle, A.; Couper, M.P. Willingness to Use Mobile Technologies for Data Collection in a Probability Household Panel. Surv. Res. Methods 2019, 13, 1–22. [Google Scholar]
- Pfiffner, N.; Friemel, T.N. Leveraging Data Donations for Communication Research: Exploring Drivers Behind the Willingness to Donate. Commun. Methods Meas. 2023; 1–23, online first. [Google Scholar] [CrossRef]
- Hillebrand, K.; Hornuf, L.; Müller, B.; Vrankar, D. The Social Dilemma of Big Data: Donating Personal Data to Promote Social Welfare. Inf. Organ. 2023, 33, 100452. [Google Scholar] [CrossRef]
- Ohme, J.; Araujo, T.; de Vreese, C.H.; Piotrowski, J.T. Mobile Data Donations: Assessing Self-Report Accuracy and Sample Biases with the IOS Screen Time Function. Mob. Media Commun. 2021, 9, 293–313. [Google Scholar] [CrossRef]
- Keusch, F.; Struminskaya, B.; Kreuter, F.; Weichbold, M. Combining Active and Passive Mobile Data Collection: A Survey of Concerns. In Big Data Meets Survey Science: A Collection of Innovative Methods; John Wiley & Sons: Hoboken, NJ, USA, 2020; pp. 657–682. [Google Scholar]
- Silber, H.; Breuer, J.; Beuthner, C.; Gummer, T.; Keusch, F.; Siegers, P.; Stier, S.; Weiß, B. Linking Surveys and Digital Trace Data: Insights from Two Studies on Determinants of Data Sharing Behaviour. J. R. Stat. Soc. Ser. A Stat. Soc. 2022, 185, S387–S407. [Google Scholar] [CrossRef]
- Van Dijck, J. Datafication, Dataism and Dataveillance: Big Data between Scientific Paradigm and Ideology. Surveill. Soc. 2014, 12, 197–208. [Google Scholar] [CrossRef]
- Boeschoten, L.; Ausloos, J.; Möller, J.E.; Araujo, T.; Oberski, D.L. A Framework for Privacy Preserving Digital Trace Data Collection through Data Donation. Comput. Commun. Res. 2022, 4, 388–423. [Google Scholar] [CrossRef]
- White, P.; Selwyn, N. Moving On-Line? An Analysis of Patterns of Adult Internet Use in the UK, 2002–2010. Inf. Commun. Soc. 2013, 16, 1–27. [Google Scholar] [CrossRef]
- Yates, S.; Kirby, J.; Lockley, E. Digital Media Use: Differences and Inequalities in Relation to Class and Age. Sociol. Res. Online 2015, 20, 71–91. [Google Scholar] [CrossRef]
- Yates, S.; Lockley, E. Social Media and Social Class. Am. Behav. Sci. 2018, 62, 1291–1316. [Google Scholar] [CrossRef]
- Schradie, J. The Great Equalizer Reproduces Inequality: How the Digital Divide Is a Class Power Divide. In Rethinking Class and Social Difference; Emerald Publishing Limited: Bingley, UK, 2020. [Google Scholar]
- Jasso, G. Factorial Survey Methods for Studying Beliefs and Judgments. Sociol. Methods Res. 2006, 34, 334–423. [Google Scholar] [CrossRef]
- Hagenaars, J.A.; McCutcheon, A.L. Applied Latent Class Analysis; Cambridge University Press: Cambridge, UK, 2002. [Google Scholar]
- Linzer, D.A.; Lewis, J.B. PoLCA: An R Package for Polytomous Variable Latent Class Analysis. J. Stat. Softw. 2011, 42, 1–29. [Google Scholar] [CrossRef]
- Wenz, A.; Keusch, F. The Second-Level Smartphone Divide: A Typology of Smartphone Use Based on Frequency of Use, Skills, and Types of Activities. Mob. Media Commun. 2022; online first. [Google Scholar] [CrossRef]
- Wallander, L. 25 Years of Factorial Surveys in Sociology: A Review. Soc. Sci. Res. 2009, 38, 505–520. [Google Scholar] [CrossRef]
- Auspurg, K.; Hinz, T. Multifactorial Experiments in Surveys. In Experimente in den Sozialwissenschaften; Nomos Verlagsgesellschaft mbH & Co. KG: Baden-Baden, Germany, 2015; pp. 294–320. [Google Scholar]
- Bates, D.; Mächler, M.; Bolker, B.; Walker, S. Fitting Linear Mixed-Effects Models Using Lme4. J. Stat. Soft. 2015, 67, 1–48. [Google Scholar] [CrossRef]
- Lüdecke, D. Ggeffects: Tidy Data Frames of Marginal Effects from Regression Models. J. Open Source Softw. 2018, 3, 772. [Google Scholar] [CrossRef]
- Jäckle, A.; Burton, J.; Couper, M.P.; Lessof, C. Participation in a Mobile App Survey to Collect Expenditure Data as Part of A Large-Scale Probability Household Panel: Response Rates and Response Biases Understanding Society Working Paper Series Participation in A Mobile App Survey to Collect Expenditure Data as Part of a Large-Scale Probability Household Panel: Response Rates and Response Biases. 2017. Available online: https://www.researchgate.net/publication/323249839_Participation_in_a_Mobile_App_survey_to_collect_expenditure_data_as_part_of_a_large-scale_probability_household_panel_response_rates_and_response_biases_Understanding_Society_Working_Paper_Series_Part (accessed on 27 February 2023).
- Kmetty, Z.; Stefkovics, Á.; Szamely, J.; Dongning, D.; Kellner, A.; Omodei, E.; Edit, P.; Koltai, J. Determinants of Willingness to Donate Data from Social Media Platforms. OSF Prepr. 2023, pp. 1–32. Available online: https://osf.io/ncwkt/download (accessed on 5 January 2023).


| Age | |||||||
| 18–39 | 40–59 | 60+ | |||||
| 42.9 | 39.4 | 17.7 | |||||
| Gender | |||||||
| Male | Female | ||||||
| 48.2 | 51.8 | ||||||
| Settlement | |||||||
| Capital | City | Village | |||||
| 21.2 | 52.1 | 26.7 | |||||
| Education and Labour Market Activity | |||||||
| Skilled and employed | Skilled and unemployed | Skilled and retired | Skilled and other | Unskilled and employed | Unskilled and unemployed | Unskilled and retired | Unskilled and other |
| 42.9 | 3.4 | 9.5 | 8.6 | 20.2 | 3.5 | 6.5 | 5.4 |
| Smartphone User Clusters | |||||||
| Social media and entertainment users | Broad non-social-media users | Basic general users | Camera users | Advanced users | |||
| 31.2 | 12.0 | 18.7 | 9.1 | 29.0 | |||
| Willingness to Participate | |||||||
| No | Yes | ||||||
| 47.2 | 52.8 | ||||||
| Smartphone User Cluster | |||||
|---|---|---|---|---|---|
| Age | Social Media and Entertainment Users | Broad Non-Social-Media Users | Basic General Users | Camera Users | Advanced Users |
| 18–39 | 34.4 | 8.0 | 8.0 | 2.0 | 47.5 |
| 40–59 | 32.6 | 14.3 | 21.6 | 9.1 | 22.3 |
| 60+ | 21.9 | 14.8 | 32.9 | 22.6 | 7.7 |
| Smartphone User Cluster | |||||
| Education and Labour Market Activity | Social Media and Entertainment Users | Broad Non-Social-Media Users | Basic General Users | Camera Users | Advanced Users |
| Skilled and employed | 30.3 | 13.8 | 15.5 | 6.3 | 34.0 |
| Skilled and unemployed | 14.3 | 33.3 | 23.8 | 9.5 | 19.0 |
| Skilled and retired | 21.9 | 15.6 | 33.3 | 19.8 | 9.4 |
| Skilled and other inactive | 41.2 | 2.5 | 6.2 | 0.0 | 50.0 |
| Unskilled and employed | 40.4 | 9.1 | 18.2 | 11.1 | 21.2 |
| Unskilled and unemployed | 46.7 | 13.3 | 13.3 | 0.0 | 26.7 |
| Unskilled and retired | 19.4 | 2.8 | 47.2 | 27.8 | 2.8 |
| Unskilled and other inactive | 34.8 | 4.3 | 13.0 | 13.0 | 34.8 |
| DV: Willingness to Participate | |||
|---|---|---|---|
| Model 1 | Model 2 | Model 3 | |
| Vignette-level variables | |||
| Organiser of the research (ref: private company) | |||
| Scientific research institute | 0.07 (−0.09) | 0.07 (−0.1) | 0.02 (−0.12) |
| Decision-maker | −0.39 *** (−0.09) | −0.39 *** (−0.1) | −0.52 *** (−0.11) |
| Data collected (ref: spatial movement) | |||
| Mobile usage | −0.19 (−0.14) | −0.19 (−0.16) | −0.11 (−0.18) |
| Communication habits | −0.26 (−0.14) | −0.27 (−0.16) | −0.21 (−0.19) |
| Movement and usage | −0.19 (−0.13) | −0.19 (−0.15) | −0.12 (−0.17) |
| Movement and comm. habits | 0.08 (−0.15) | 0.08 (−0.17) | 0.15 (−0.19) |
| Mobile usage and comm. habits | −0.08 (−0.14) | −0.08 (−0.16) | 0.04 (−0.18) |
| Movement, usage and comm. habits | −0.07 (−0.14) | −0.07 (−0.16) | −0.09 (−0.19) |
| Length of the research (Ref: one month) | |||
| Six-month duration | −1.15 *** (−0.07) | −1.16 *** (−0.08) | −1.31 *** (−0.1) |
| Incentive (ref: after downloading the app) | |||
| After the end of the research EUR 15 | 0.08 (−0.09) | 0.08 (−0.1) | 0.01 (−0.12) |
| Both after downloading the app and at the end of the research EUR 15-EUR 15 | 0.61 *** (−0.09) | 0.61 *** (−0.1) | 0.63 *** (−0.12) |
| Interruption and control (ref: user can interrupt the data collection) | |||
| User cannot interrupt the data collection | −0.98 *** (−0.09) | −0.99 *** (−0.1) | −1.08 *** (−0.12) |
| User can interrupt the data collection and has control over their data | 0.20 * (−0.09) | 0.2 (−0.1) | 0.29 * (−0.12) |
| Respondent level socio-demographic variables | |||
| Age 40–59 (ref: 18–39) | −1.52 *** (−0.46) | −0.44 (−0.56) | |
| Age 60+ | −2.76 *** (−0.76) | −0.77 (−0.89) | |
| Gender (ref: men) | 0.3321 | −0.4 (−0.48) | |
| Town (ref: capital) | 0.85 (−0.51) | 0.96 (−0.59) | |
| Village | 1.02 (−0.6) | 0.97 (−0.69) | |
| Skilled–retired (ref: skilled–employed) | −0.01 (−0.84) | −1.17 (−1.41) | |
| Skilled–unemployed | −0.98 (−0.99) | −0.35 (−0.95) | |
| Skilled–other inactive | −1.18 (−0.7) | −1.47 (−0.82) | |
| Unskilled–employed | −0.05 (−0.6) | −0.18 (−0.73) | |
| Unskilled–unemployed | 1.14 (−1.33) | 0.27 (−1.65) | |
| Unskilled–retired | −0.63 (−1.06) | −0.5 (−1.25) | |
| Unskilled–other inactive | 0.71 (−1.07) | −0.57 (−1.35) | |
| Typology of smartphone use (ref: Social media and entertainment) | |||
| Broad non-social-media users | 0.02 (−0.79) | ||
| Basic general users | −0.42 (−0.69) | ||
| Camera users | −3.69 *** (−0.94) | ||
| Advanced users | 1.66 ** (−0.6) | ||
| AIC | 6783.87 | 6773.36 | 5247.53 |
| BIC | 6892.03 | 6968.04 | 5463.43 |
| Observations | 10,000 | 10,000 | 7820 |
| Groups (respondents) | 1000 | 1000 | 782 |
Disclaimer/Publisher’s Note: The statements, opinions and data contained in all publications are solely those of the individual author(s) and contributor(s) and not of MDPI and/or the editor(s). MDPI and/or the editor(s) disclaim responsibility for any injury to people or property resulting from any ideas, methods, instructions or products referred to in the content. |
© 2023 by the authors. Licensee MDPI, Basel, Switzerland. This article is an open access article distributed under the terms and conditions of the Creative Commons Attribution (CC BY) license (https://creativecommons.org/licenses/by/4.0/).
Share and Cite
Máté, Á.; Rakovics, Z.; Rudas, S.; Wallis, L.; Ságvári, B.; Huszár, Á.; Koltai, J. Willingness of Participation in an Application-Based Digital Data Collection among Different Social Groups and Smartphone User Clusters. Sensors 2023, 23, 4571. https://doi.org/10.3390/s23094571
Máté Á, Rakovics Z, Rudas S, Wallis L, Ságvári B, Huszár Á, Koltai J. Willingness of Participation in an Application-Based Digital Data Collection among Different Social Groups and Smartphone User Clusters. Sensors. 2023; 23(9):4571. https://doi.org/10.3390/s23094571
Chicago/Turabian StyleMáté, Ákos, Zsófia Rakovics, Szilvia Rudas, Levente Wallis, Bence Ságvári, Ákos Huszár, and Júlia Koltai. 2023. "Willingness of Participation in an Application-Based Digital Data Collection among Different Social Groups and Smartphone User Clusters" Sensors 23, no. 9: 4571. https://doi.org/10.3390/s23094571
APA StyleMáté, Á., Rakovics, Z., Rudas, S., Wallis, L., Ságvári, B., Huszár, Á., & Koltai, J. (2023). Willingness of Participation in an Application-Based Digital Data Collection among Different Social Groups and Smartphone User Clusters. Sensors, 23(9), 4571. https://doi.org/10.3390/s23094571