
Road Feature Detection for Advance Driver Assistance System Using Deep Learning

 ,
, 
 ,
,  , and
, and 
Abstract
1. Introduction
2. Literature Review
3. Methodology
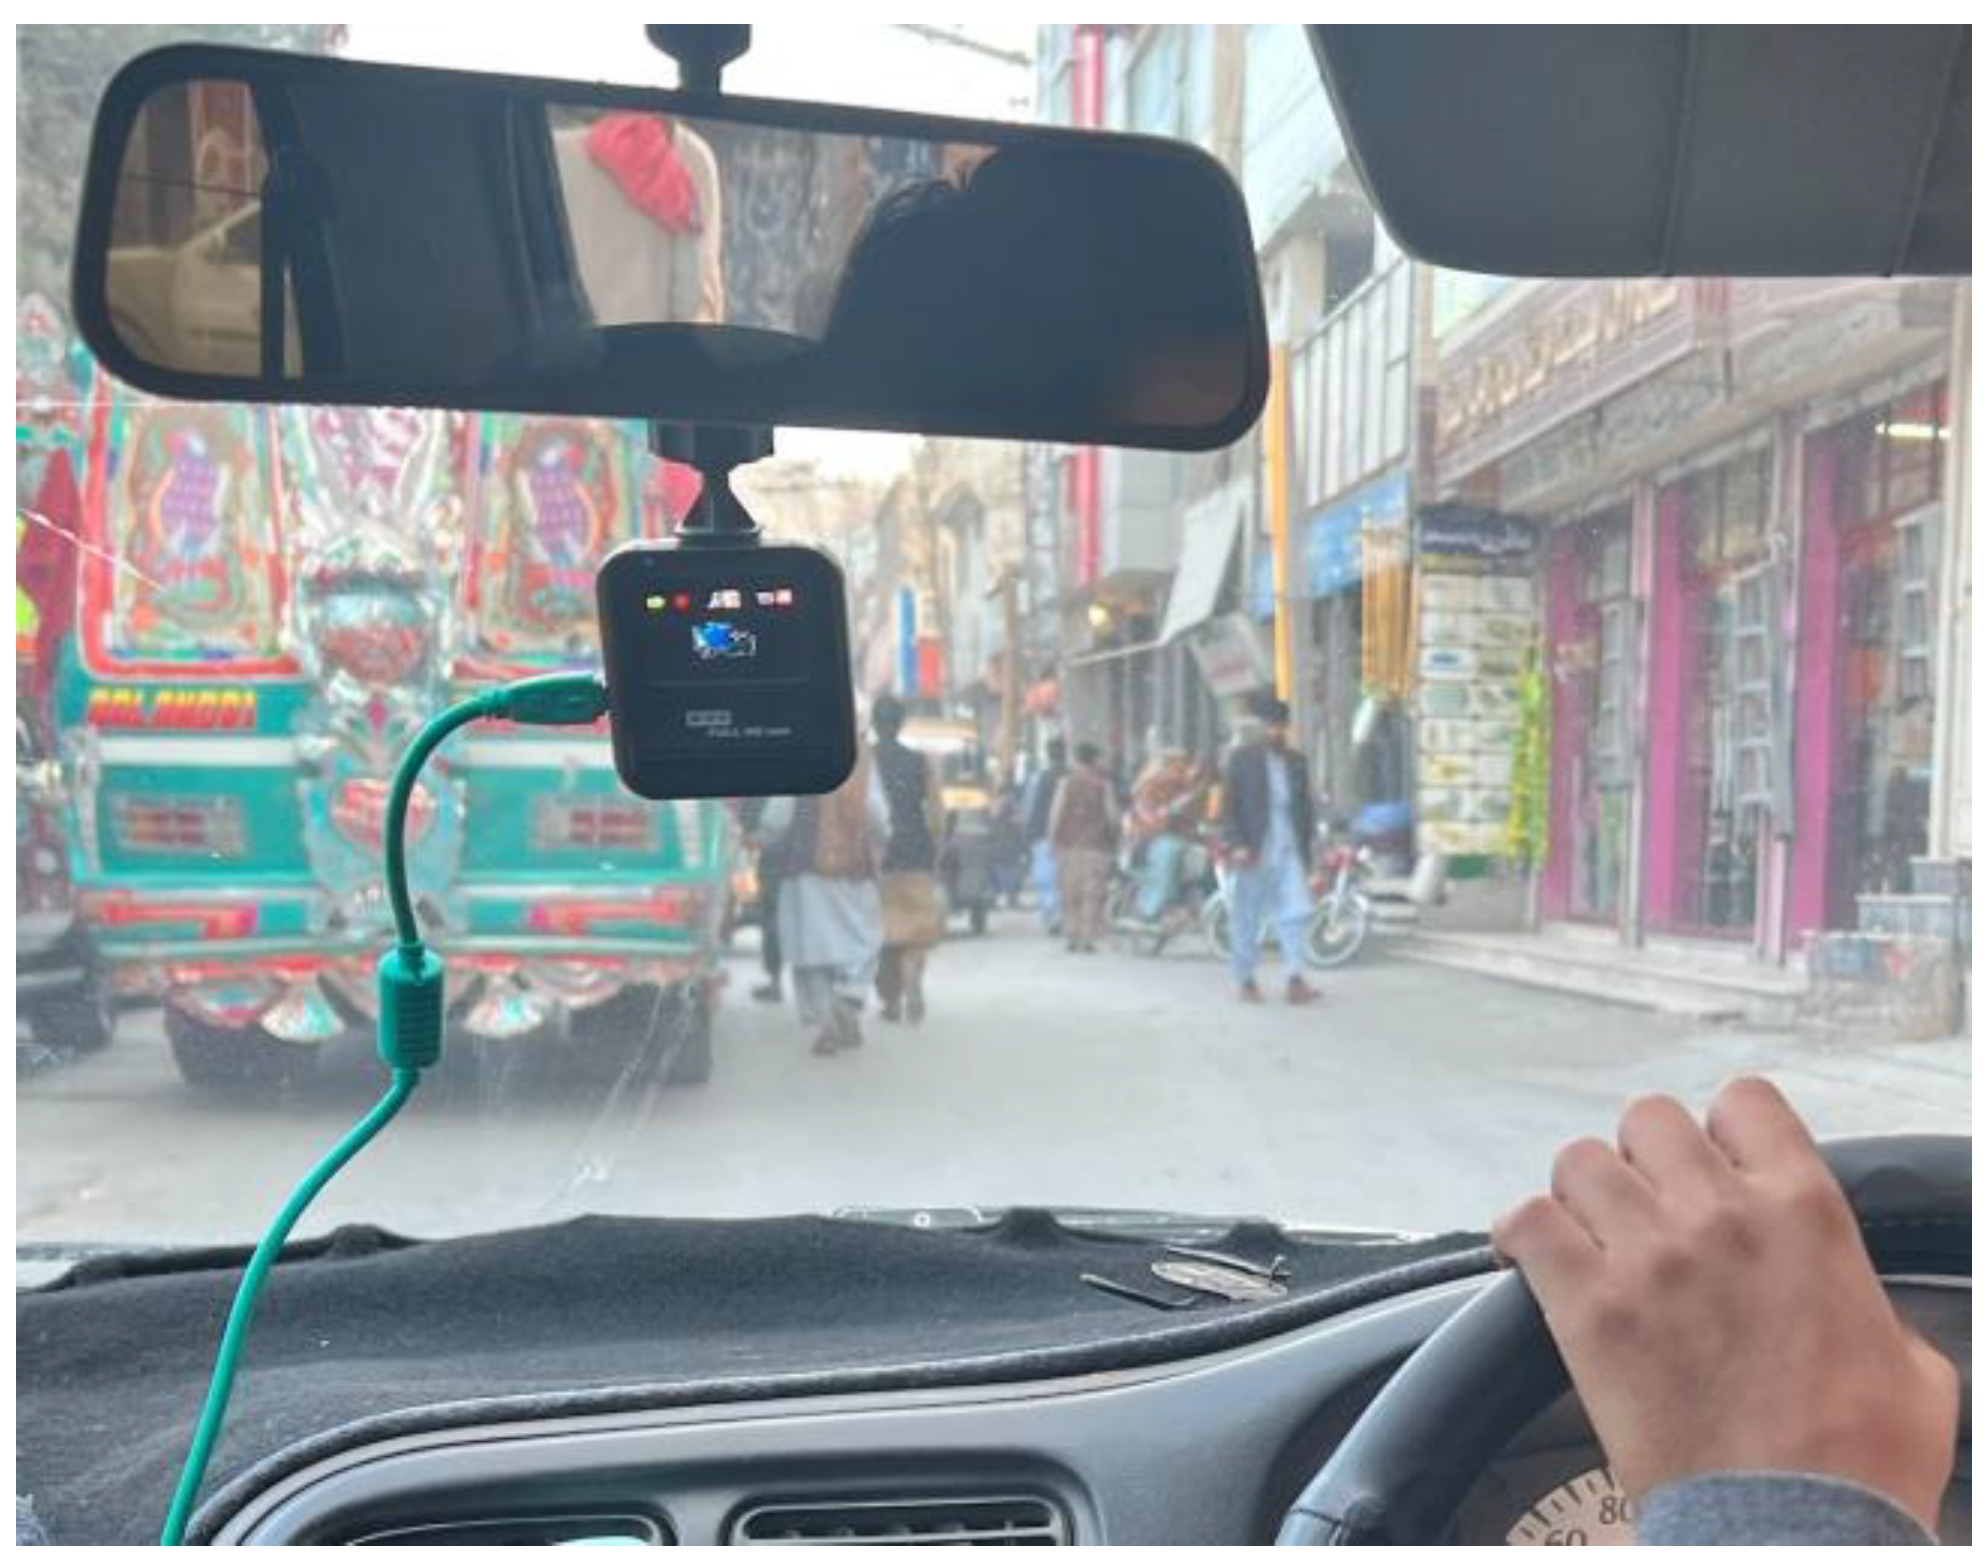
3.1. Simulation Setup
3.2. Data Collection
3.3. Preprocessing
3.4. Data Annotation
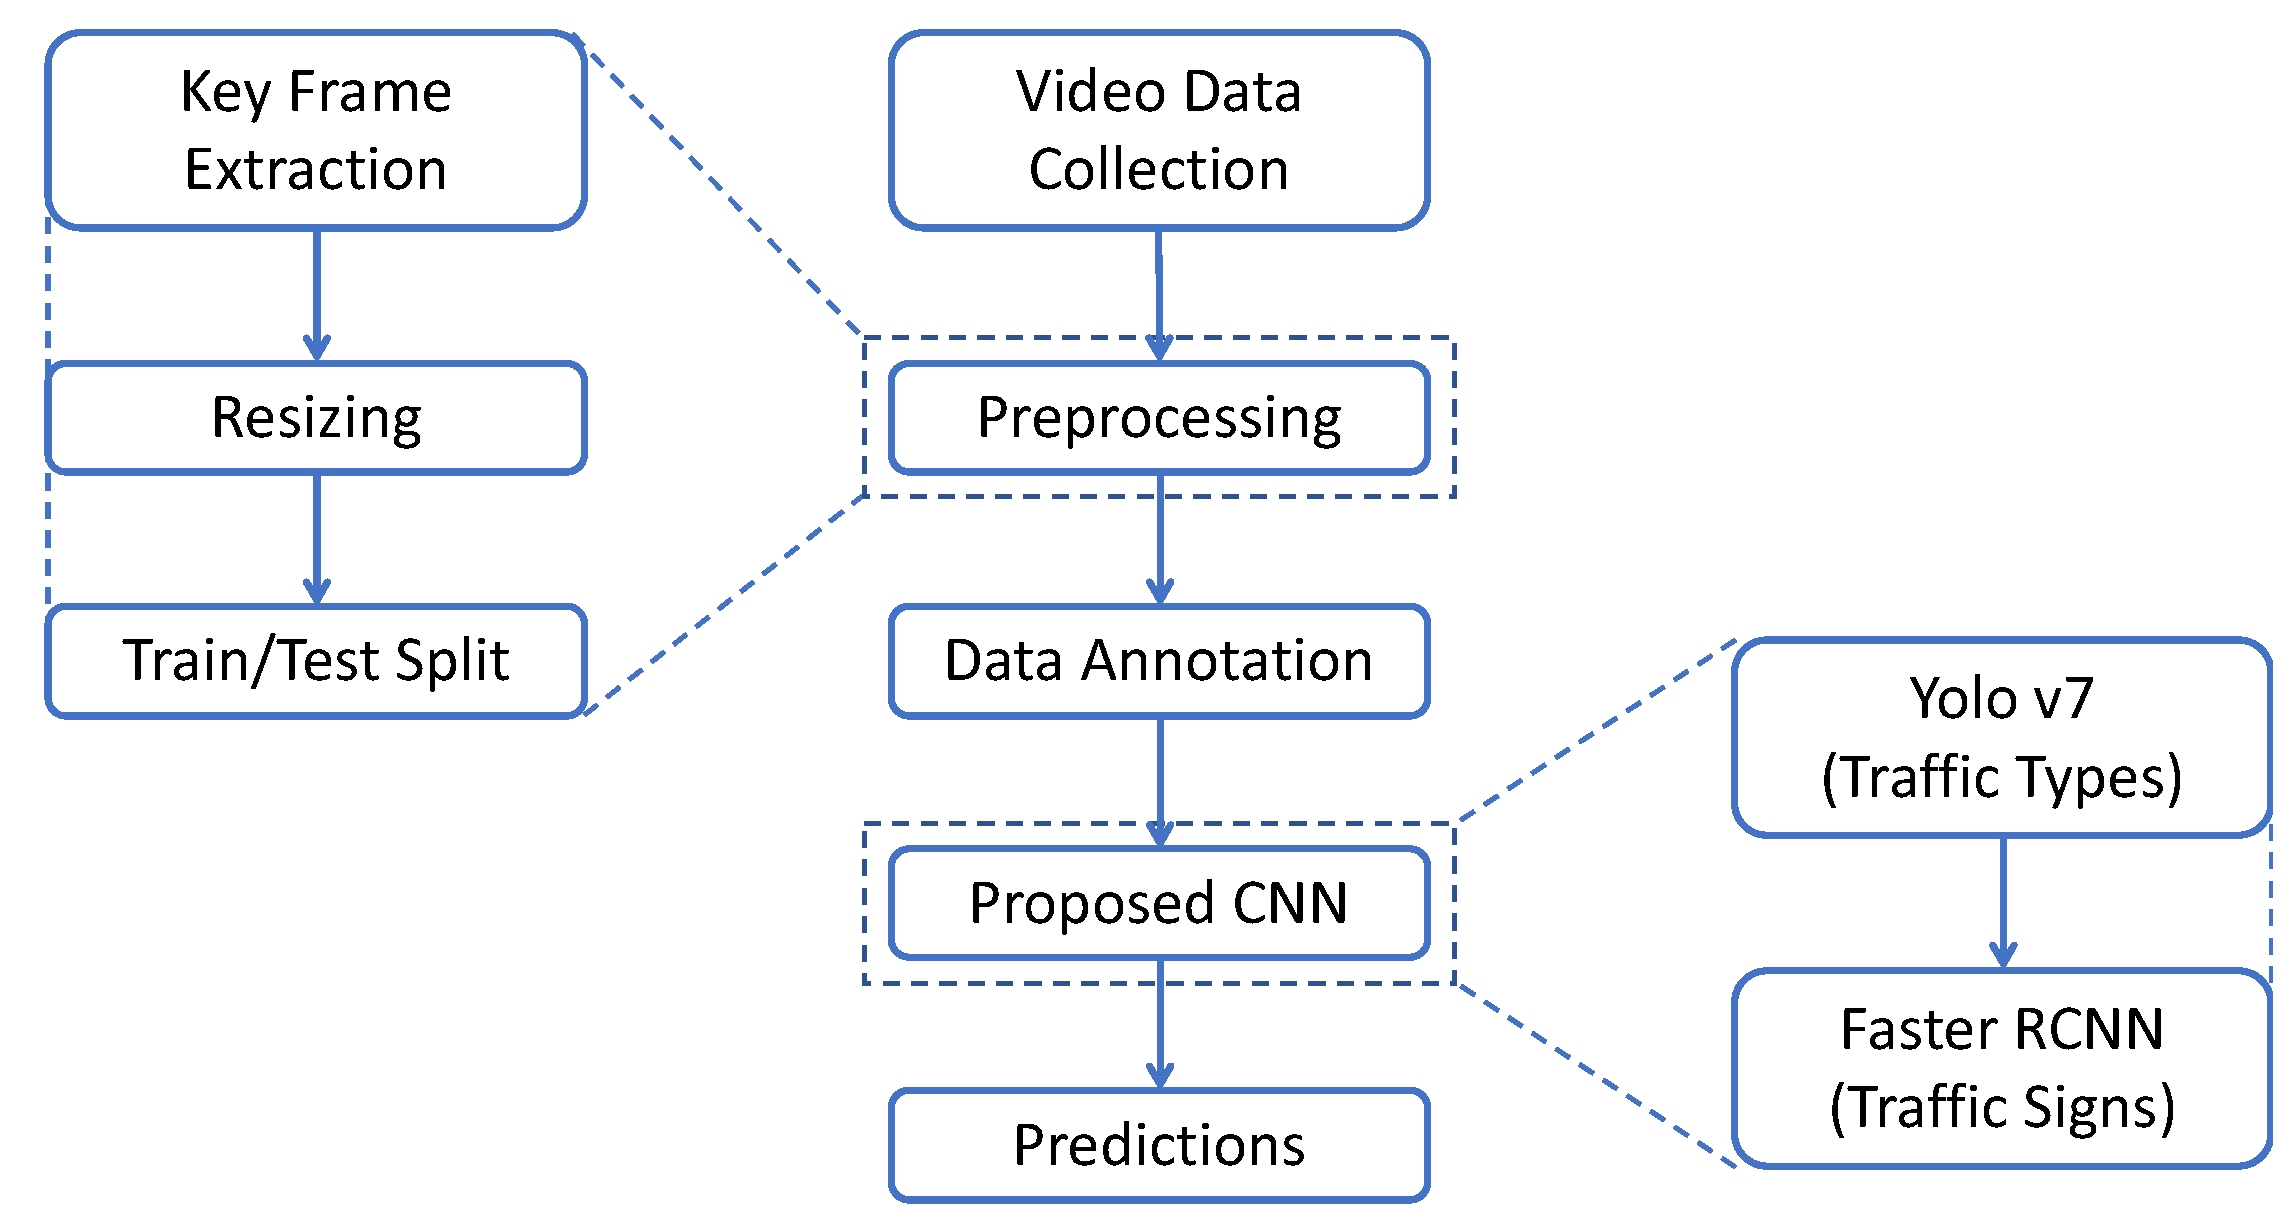
3.5. Flow Diagram
3.6. Model Architecture
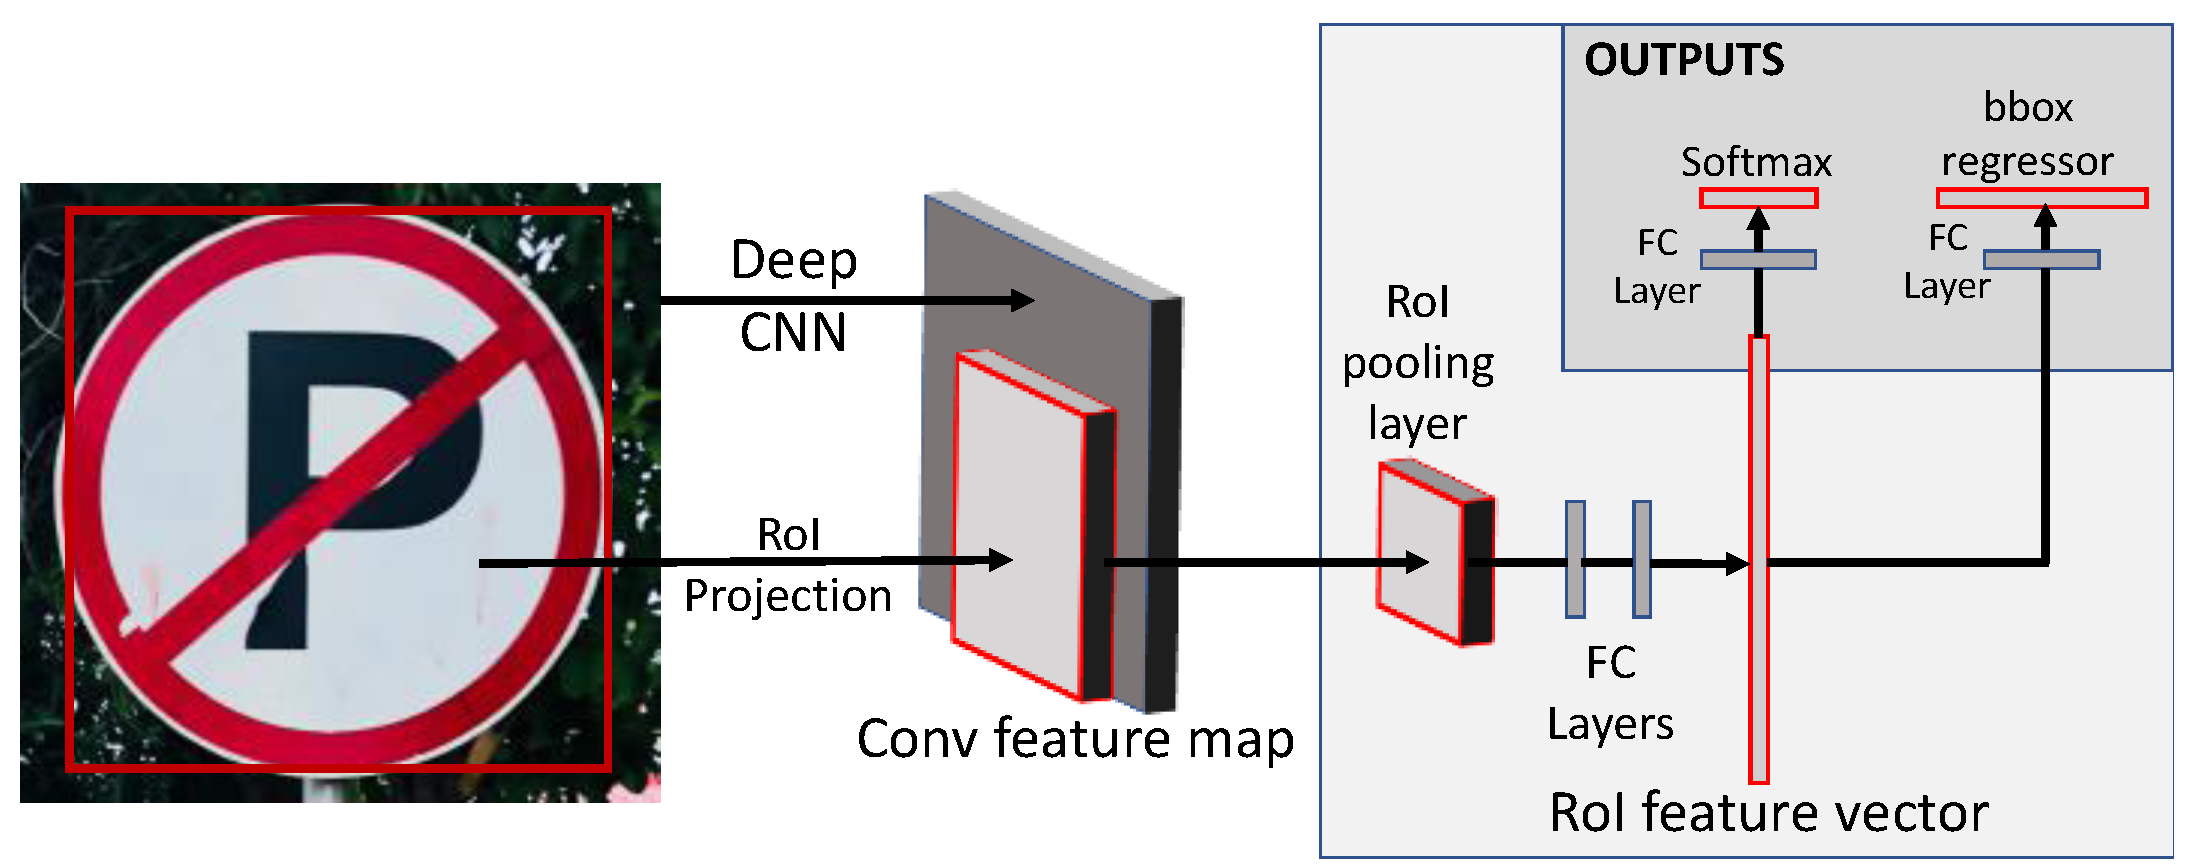
3.6.1. Faster-RCNN
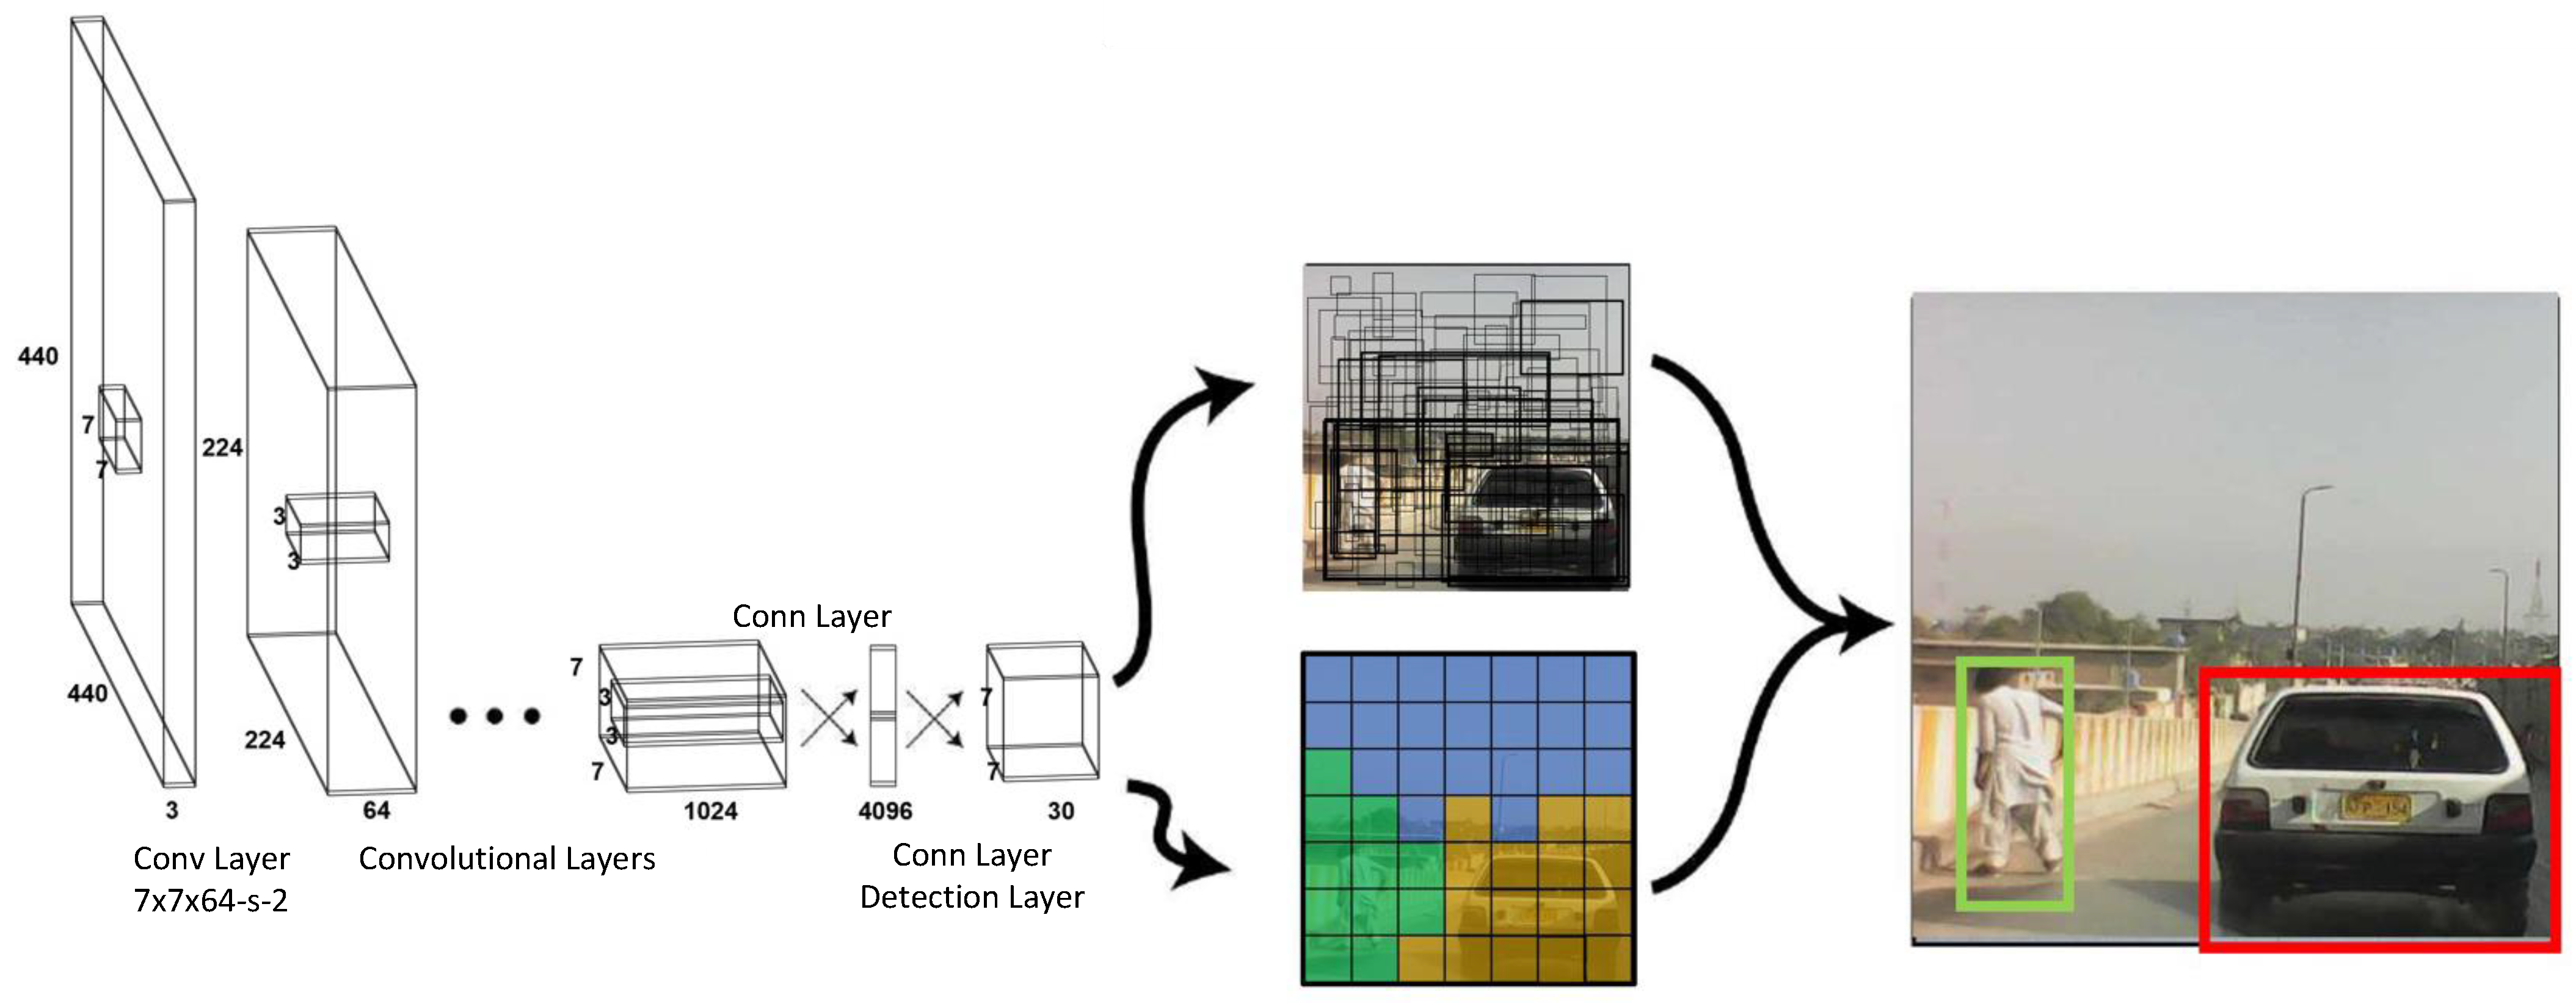
3.6.2. YOLOv7
- Residual block: The first module considers the input image and divides it into various grid cells; typically, the size is 19 × 19. Each grid cell is responsible for detecting objects that may appear within it based on the location of the center of the object.
- Bounding Box Regression: The second module uses single bounding box regression on any detected object. This provides the probability that an object will appear in the bounding box, that is, the outline or boundary that highlights the location of the object in the input image. For each bounding box, there are four attributes to predict: center (x, y), width, height, and class.
- Intersection over Union (IoU): The third module, using the concept of IoU, describes how the bounding boxes overlap and provides an output box in which the objects are perfectly surrounded. Every grid cell is tasked with predicting the bounding boxes and their probability or confidence score. If the prediction for the bounding box is the same as that for the real bounding box, the IoU value equals one; consequently, any predicted bounding box that is not equal to the real bounding box is eliminated.
3.7. Advanced Driver Assistance System
- Lane-keeping;
- Overtaking vehicles;
- Jaywalking pedestrians;
- Potential blind spots;
- Negligent/distracted drivers.
4. Results
4.1. Performance Metrics
4.2. Numerical and Graphical Results
4.2.1. Traffic Type Recognition
4.2.2. Traffic Sign Recognition
5. Discussion
6. Conclusions
Author Contributions
Funding
Institutional Review Board Statement
Informed Consent Statement
Data Availability Statement
Conflicts of Interest
References
- Alarming Figures of Traffic Accidents Need Attention. Available online: https://www.thenews.com.pk/print/910436-alarming-figures-of-traffic-accidents-need-attention (accessed on 29 July 2022).
- Jochem, T.; Pomerleau, D.; Kumar, B.; Armstrong, J. PANS: A portable navigation platform. In Proceedings of the Intelligent Vehicles’ 95. Symposium, Detroit, MI, USA, 25–26 September 1995; pp. 107–112. [Google Scholar]
- Kukkala, V.K.; Tunnell, J.; Pasricha, S.; Bradley, T. Advanced driver-assistance systems: A path toward autonomous vehicles. IEEE Consum. Electron. Mag. 2018, 7, 18–25. [Google Scholar] [CrossRef]
- Galvani, M. History and future of driver assistance. IEEE Instrum. Meas. Mag. 2019, 22, 11–16. [Google Scholar] [CrossRef]
- PSermanet, P.; LeCun, Y. Traffic sign recognition with multi-scale convolutional networks. In Proceedings of the 2011 International Joint Conference on Neural Networks, San Jose, CA, USA, 31 July–5 August 2011; pp. 2809–2813. [Google Scholar]
- Malik, Z.; Siddiqi, I. Detection and recognition of traffic signs from road scene images. In Proceedings of the 2014 12th International Conference on Frontiers of Information Technology, Islamabad, Pakistan, 17–19 December 2014; pp. 330–335. [Google Scholar]
- Islam, K.T.; Raj, R.G.; Mujtaba, G. Recognition of traffic sign based on bag-of-words and artificial neural network. Symmetry 2017, 9, 138. [Google Scholar] [CrossRef]
- Malik, R.; Khurshid, J.; Ahmad, S.N. Road sign detection and recognition using colour segmentation, shape analysis and template matching. In Proceedings of the 2007 International Conference on Machine Learning and Cybernetics, Hong Kong, China, 19–22 August 2007; Volume 6, pp. 3556–3560. [Google Scholar]
- Kim, J.; Lee, S.; Oh, T.-H.; Kweon, I.S. Co-domain embedding using deep quadruplet networks for unseen traffic sign recognition. In Proceedings of the AAAI Conference on Artificial Intelligence, New Orleans, LA, USA, 2–7 February 2018. [Google Scholar]
- Lin, H.-Y.; Dai, J.-M.; Wu, L.-T.; Chen, L.-Q. A vision-based driver assistance system with forward collision and overtaking detection. Sensors 2020, 20, 5139. [Google Scholar] [CrossRef]
- Lu, S.; Lu, H.; Dong, J.; Wu, S. Object Detection for UAV Aerial Scenarios Based on Vectorized IOU. Sensors 2023, 23, 3061. [Google Scholar] [CrossRef]
- Wu, J.; Shen, T.; Wang, Q.; Tao, Z.; Zeng, K.; Song, J. Local Adaptive Illumination-Driven Input-Level Fusion for Infrared and Visible Object Detection. Remote Sens. 2023, 15, 660. [Google Scholar] [CrossRef]
- Liu, Z.; Gu, X.; Chen, J.; Wang, D.; Chen, Y.; Wang, L. Automatic recognition of pavement cracks from combined GPR B-scan and C-scan images using multiscale feature fusion deep neural networks. Autom. Constr. 2023, 146, 104698. [Google Scholar] [CrossRef]
- Stark, J.A. Adaptive image contrast enhancement using generalizations of histogram equalization. IEEE Trans. Image Process. 2000, 9, 889–896. [Google Scholar] [CrossRef]
- Greenhalgh, J.; Mirmehdi, M. Real-time detection and recognition of road traffic signs. IEEE Trans. Intell. Transp. Syst. 2012, 13, 1498–1506. [Google Scholar] [CrossRef]
- Zhu, X.J. Semi-Supervised Learning Literature Survey. CS Technical Reports, TR 1530; Department of Computer Sciences, University of Wisconsin-Madison: Madison, WI, USA, 2005. [Google Scholar]
- Nigam, K.; McCallum, A.K.; Thrun, S.; Mitchell, T. Text classification from labeled and unlabeled documents using EM. Mach. Learn. 2000, 39, 103–134. [Google Scholar] [CrossRef]
- Riding Shotgun in Tesla’s Fastest Car Ever. Available online: https://www.engadget.com/2014-10-09-tesla-d-awd-driver-assist.html (accessed on 28 July 2022).
- LeCun, Y.; Bottou, L.; Bengio, Y.; Haffner, P. Gradient-based learning applied to document recognition. Proc. IEEE 1998, 86, 2278–2324. [Google Scholar] [CrossRef]
- Yin, X.; Han, J.; Yang, J.; Yu, P.S. Crossmine: Efficient classification across multiple database relations. In Constraint-Based Mining and Inductive Databases; Springer: Berlin/Heidelberg, Germany, 2006; pp. 172–195. [Google Scholar]
- Asgarian Dehkordi, R.; Khosravi, H. Vehicle type recognition based on dimension estimation and bag of word classification. J. AI Data Min. 2020, 8, 427–438. [Google Scholar]
- Fernández Llorca, D.; Hernández Martínez, A.; García Daza, I. Vision-based vehicle speed estimation: A survey. IET Intell. Transp. Syst. 2021, 15, 987–1005. [Google Scholar] [CrossRef]
- Bayoudh, K.; Hamdaoui, F.; Mtibaa, A. Transfer learning based hybrid 2D-3D CNN for traffic sign recognition and semantic road detection applied in advanced driver assistance systems. Appl. Intell. 2021, 51, 124–142. [Google Scholar] [CrossRef]
- Nugraha, B.T.; Su, S.-F. Towards self-driving car using convolutional neural network and road lane detector. In Proceedings of the 2017 2nd International Conference on Automation, Cognitive Science, Optics, Micro Electro-Mechanical System, and Information Technology (ICACOMIT), Jakarta, Indonesia, 23–24 October 2017; pp. 65–69. [Google Scholar]
- Arabi, S.; Haghighat, A.; Sharma, A. A deep-learning-based computer vision solution for construction vehicle detection. Comput.-Aided Civ. Infrastruct. Eng. 2020, 35, 753–767. [Google Scholar] [CrossRef]
- Wu, Y.-Y.; Tsai, C.-M. Pedestrian, bike, motorcycle, and vehicle classification via deep learning: Deep belief network and small training set. In Proceedings of the 2016 International Conference on Applied System Innovation (ICASI), Okinawa, Japan, 26–30 May 2016; pp. 1–4. [Google Scholar]
- Carvalho Barbosa, R.; Shoaib Ayub, M.; Lopes Rosa, R.; Zegarra Rodríguez, D.; Wuttisittikulkij, L. Lightweight PVIDNet: A priority vehicles detection network model based on deep learning for intelligent traffic lights. Sensors 2020, 20, 6218. [Google Scholar] [CrossRef]
- Joachims, T. Transductive inference for text classification using support vector machines. In Proceedings of the Icml, Bled, Slovenia, 27–30 June 1999; Volume 99, pp. 200–209. [Google Scholar]
- Zhu, X.; Wu, X. Class noise handling for effective cost-sensitive learning by cost-guided iterative classification filtering. IEEE Trans. Knowl. Data Eng. 2006, 18, 1435–1440. [Google Scholar]
- Turney, P.D. Cost-sensitive classification: Empirical evaluation of a hybrid genetic decision tree induction algorithm. J. Artif. Intell. Res. 1994, 2, 369–409. [Google Scholar] [CrossRef]
- Zeller, C. Cuda C/C++ Basics; NVIDIA Coporation: Santa Clara, CA, USA, 2011. [Google Scholar]
- Borenstein, J.; Koren, Y. The vector field histogram-fast obstacle avoidance for mobile robots. IEEE Trans. Robot. Autom. 1991, 7, 278–288. [Google Scholar] [CrossRef]
- Stallkamp, J.; Schlipsing, M.; Salmen, J.; Igel, C. The German traffic sign recognition benchmark: A multi-class classification competition. In Proceedings of the 2011 International Joint Conference on Neural Networks, San Jose, CA, USA, 31 July–5 August 2011; pp. 1453–1460. [Google Scholar]
- LISA Traffic Light Dataset. Available online: https://www.kaggle.com/datasets/mbornoe/lisa-traffic-light-dataset (accessed on 28 July 2022).
- Timofte, R.; Zimmermann, K.; Van Gool, L. Multi-view traffic sign detection, recognition, and 3D localisation. Mach. Vis. Appl. 2014, 25, 633–647. [Google Scholar] [CrossRef]
- Zhu, Z.; Liang, D.; Zhang, S.; Huang, X.; Li, B.; Hu, S. Traffic-sign detection and classification in the wild. In Proceedings of the IEEE Conference on Computer Vision and Pattern Recognition, Las Vegas, NV, USA, 26 June–1 July 2016; pp. 2110–2118. [Google Scholar]
- Lin, C.; Li, L.; Luo, W.; Wang, K.C.; Guo, J. Transfer learning based traffic sign recognition using inception-v3 model. Period. Polytech. Transp. Eng. 2019, 47, 242–250. [Google Scholar] [CrossRef]
- Sokipriala, J.; Orike, S. Traffic sign classification comparison between various convolution neural network models. Int. J. Sci. Eng. Res. 2021, 12, 165–171. [Google Scholar] [CrossRef]
- Wahab, A.; Khan, A.; Rabbi, I.; Khan, K.; Gul, N. Audio Augmentation for Traffic Signs: A Case Study of Pakistani Traffic Signs. Int. J. Adv. Comput. Sci. Appl. 2018, 9. [Google Scholar] [CrossRef]
- Nadeem, Z.; Samad, A.; Abbas, Z.; Massod, J. A Transfer Learning based approach for Pakistani Traffic-sign Recognition; using ConvNets. In Proceedings of the 2018 International Conference on Computing, Electronic and Electrical Engineering (ICE Cube), Quetta, Pakistan, 12–13 November 2018; pp. 1–6. [Google Scholar]
- Sikander, A.A.; Ali, H. Image Classification using CNN for Traffic Signs in Pakistan. arXiv 2021, arXiv:2102.10130. [Google Scholar]
- Hussain, M.; Ali, N.; Eui-Hong, J. DeepGuard: A Framework for Safeguarding Autonomous Driving Systems from Inconsistent Behaviours. Autom. Softw. Eng. 2022, 29, 1. [Google Scholar] [CrossRef]
- Naqvi, R.A.; Arsalan, M.; Rehman, A.; Rehman, A.U.; Loh, W.-K.; Paul, A. Deep Learning-Based Drivers Emotion Classification System in Time Series Data for Remote Applications. Remote Sens. 2020, 12, 587. [Google Scholar] [CrossRef]
- Naqvi, R.A.; Arsalan, M.; Batchuluun, G.; Yoon, H.S.; Park, K.R. Deep Learning-Based Gaze Detection System for Automobile Drivers Using a NIR Camera Sensor. Sensors 2018, 18, 456. [Google Scholar] [CrossRef]
- Tauqeer, M.; Rubab, S.; Khan, M.A.; Naqvi, R.A.; Javed, K.; Alqahtani, A.; Alsubai, S.; Binbusayyis, A. Driver’s emotion and behavior classification system based on Internet of Things and deep learning for Advanced Driver Assistance System (ADAS). Comput. Commun. 2022, 194, 258–267. [Google Scholar] [CrossRef]
- Nadeem, Z.; Khan, Z.; Mir, U.; Mir, U.I.; Khan, S.; Nadeem, H.; Sultan, J. Pakistani traffic-sign recognition using transfer learning. Multimed. Tools Appl. 2022, 81, 8429–8449. [Google Scholar] [CrossRef]
- Ren, S.; He, K.; Girshick, R.B.; Sun, J. Faster R-CNN: Towards Real-Time Object Detection with Region Proposal Networks. IEEE Trans. Pattern Anal. Mach. Intell. 2015, 39, 1137–1149. [Google Scholar] [CrossRef]
- Wang, C.-Y.; Bochkovskiy, A.; Liao, H.-Y.M. YOLOv7: Trainable bag-of-freebies sets new state-of-the-art for real-time object detectors. arXiv 2022, arXiv:2207.02696. [Google Scholar]
- Long, X.; Deng, K.; Wang, G.; Zhang, Y.; Dang, Q.; Gao, Y.; Shen, H.; Ren, J.; Han, S.; Ding, E.; et al. PP-YOLO: An Effective and Efficient Implementation of Object Detector. arXiv 2020, arXiv:2007.12099. [Google Scholar]


| Aspect | Detail |
|---|---|
| Operating system | Ubuntu 18.04.5 LTS |
| GPU | Tesla P100—PCIe—16 GB |
| RAM | 26 GB |
| Programming language | Python 3.7.10 |
| CUDA | Version 10.2.228 |
| PyTorch | 1.10.0 |
| S. No. | Traffic-Sign Name |
|---|---|
| 1 | Bridge Ahead |
| 2 | Crossroads |
| 3 | Give Way |
| 4 | Left Bend |
| 5 | No Horns |
| 6 | No Left Turn |
| 7 | No Mobile Allowed |
| 8 | No Overtaking |
| 9 | No Parking |
| 10 | No right turn |
| 11 | No U-Turn |
| 12 | Parking |
| 13 | Pedestrians |
| 14 | Railway Crossing |
| 15 | Right Bend |
| 16 | Road Divides |
| 17 | Roundabout Ahead |
| 18 | Sharp Right Turn |
| 19 | Slow |
| 20 | Speed Breaker Ahead |
| 21 | Speed Limit (20 kmph) |
| 22 | Speed Limit (25 kmph) |
| 23 | Speed Limit (30 kmph) |
| 24 | Speed Limit (40 kmph) |
| 25 | Speed Limit (45 kmph) |
| 26 | Speed Limit (50 kmph) |
| 27 | Speed Limit (60 kmph) |
| 28 | Speed Limit (65 kmph) |
| 29 | Speed Limit (70 kmph) |
| 30 | Speed Limit (80 kmph) |
| 31 | Steep Descent |
| 32 | Stop 1 |
| 33 | Stop 2 |
| 34 | U-Turn |
| 35 | Zigzag Road Ahead |
| # | ADAS Instructions |
|---|---|
| 1 | No traffic detected; assistance not required |
| 2 | Pedestrian right in front of you, stop immediately |
| 3 | Bike right in front of you, slow down immediately |
| 4 | LTV right in front of you, slow down immediately |
| 5 | HTV right in front of you, slow down immediately |
| 6 | Pedestrian in front of you, slow down immediately |
| 7 | Bicycle in front of you, slow down slightly |
| 8 | LTV in front of you, stay cautious |
| 9 | HTV in front of you, slow down slightly |
| 10 | Pedestrian near your left side, watch out |
| 11 | Pedestrian near your right side, watch out |
| 12 | Bike overtaking from your left side, stay cautious |
| 13 | Bike overtaking from your right side, stay cautious |
| 14 | LTV overtaking from your left side, stay cautious |
| 15 | LTV overtaking from your right side, stay cautious |
| 16 | HTV overtaking from your left side, stay cautious |
| 17 | HTV overtaking from your right side, stay cautious |
| 18 | Pedestrian on your far-left side, watch out |
| 19 | Pedestrian on your far-right side, watch out |
| 20 | Bike on your far-left side, be careful while overtaking |
| 21 | Bike on your far-right side, be careful while overtaking |
| 22 | LTV on your far-left side, be careful while overtaking |
| 23 | LTV on your far-right side, be careful while overtaking |
| 24 | HTV on your far-left side, be careful while overtaking |
| 25 | HTV on your far-right side, be careful while overtaking |
| Performance Metric | Description |
|---|---|
| True positive | It is when a model makes a prediction and correctly identifies the object |
| False positive | It is when a model makes a prediction even though no object was present |
| True negative | It is when a model does not make a prediction when there is no object |
| False negative | It is when a model does not make a prediction even though an object was present |
| Architecture | P | R | mAP@0.5 | mAP@0.5:0.95 |
|---|---|---|---|---|
| YOLOv5 | 87.70% | 62.31% | 74.64% | 43.01% |
| YOLOv7 | 87.61% | 73.03% | 87.21% | 57.94% |
| YOLOv7 | ||||
|---|---|---|---|---|
| Class | P | R | mAP@0.5 | mAP@0.5:0.95 |
| All | 87.61% | 73.03% | 87.21% | 57.94% |
| Pedestrian | 92.53% | 69.12% | 84.11% | 54.82% |
| Bike | 93.02% | 78.41% | 89.94% | 56.44% |
| HTV | 81.83% | 50.00% | 83.41% | 45.21% |
| LTV | 95.90% | 67.42% | 87.32% | 56.04% |
| Model | mAP | AP | 50 | AP | 75 | AP | s | AP | m | AP | l |
|---|---|---|---|---|---|---|
| Faster-RCNN (R50-FPN) | 70.27 | 98.36 | 84.60 | 53.83 | 72.58 | 84.55 |
| ResNet-50 (Dilated Convolutions) | 73.21 | 96.69 | 87.37 | 49.59 | 77.04 | 85.51 |
| Xception-101 | 72.29 | 72.29 | 72.29 | 72.29 | 72.29 | 72.29 |
| Faster RCNN (R101-FPN) | train | 75.64 | 99.09 | 92.62 | 65.67 | 77.64 | 84.65 |
| Faster-RCNN (R50-FPN) | val | 49.70 | 64.61 | 59.15 | 46.95 | 40.18 | 69.61 |
| Faster-RCNN (R50-FPN) | test | 43.45 | 58.24 | 52.69 | 15.00 | 44.76 | 38.12 |
Disclaimer/Publisher’s Note: The statements, opinions and data contained in all publications are solely those of the individual author(s) and contributor(s) and not of MDPI and/or the editor(s). MDPI and/or the editor(s) disclaim responsibility for any injury to people or property resulting from any ideas, methods, instructions or products referred to in the content. |
© 2023 by the authors. Licensee MDPI, Basel, Switzerland. This article is an open access article distributed under the terms and conditions of the Creative Commons Attribution (CC BY) license (https://creativecommons.org/licenses/by/4.0/).
Share and Cite
Nadeem, H.; Javed, K.; Nadeem, Z.; Khan, M.J.; Rubab, S.; Yon, D.K.; Naqvi, R.A. Road Feature Detection for Advance Driver Assistance System Using Deep Learning. Sensors 2023, 23, 4466. https://doi.org/10.3390/s23094466
Nadeem H, Javed K, Nadeem Z, Khan MJ, Rubab S, Yon DK, Naqvi RA. Road Feature Detection for Advance Driver Assistance System Using Deep Learning. Sensors. 2023; 23(9):4466. https://doi.org/10.3390/s23094466
Chicago/Turabian StyleNadeem, Hamza, Kashif Javed, Zain Nadeem, Muhammad Jawad Khan, Saddaf Rubab, Dong Keon Yon, and Rizwan Ali Naqvi. 2023. "Road Feature Detection for Advance Driver Assistance System Using Deep Learning" Sensors 23, no. 9: 4466. https://doi.org/10.3390/s23094466
APA StyleNadeem, H., Javed, K., Nadeem, Z., Khan, M. J., Rubab, S., Yon, D. K., & Naqvi, R. A. (2023). Road Feature Detection for Advance Driver Assistance System Using Deep Learning. Sensors, 23(9), 4466. https://doi.org/10.3390/s23094466