
Monitoring Internal Load in Women’s Basketball via Subjective and Device-Based Methods: A Systematic Review

 , , and
Abstract
1. Introduction
2. Materials and Methods
2.1. Search Strategy
2.2. Inclusion and Exclusion Criteria
2.3. Study Selection
2.4. Data Extraction
2.5. Quality Assessment and Risk of Bias
3. Results
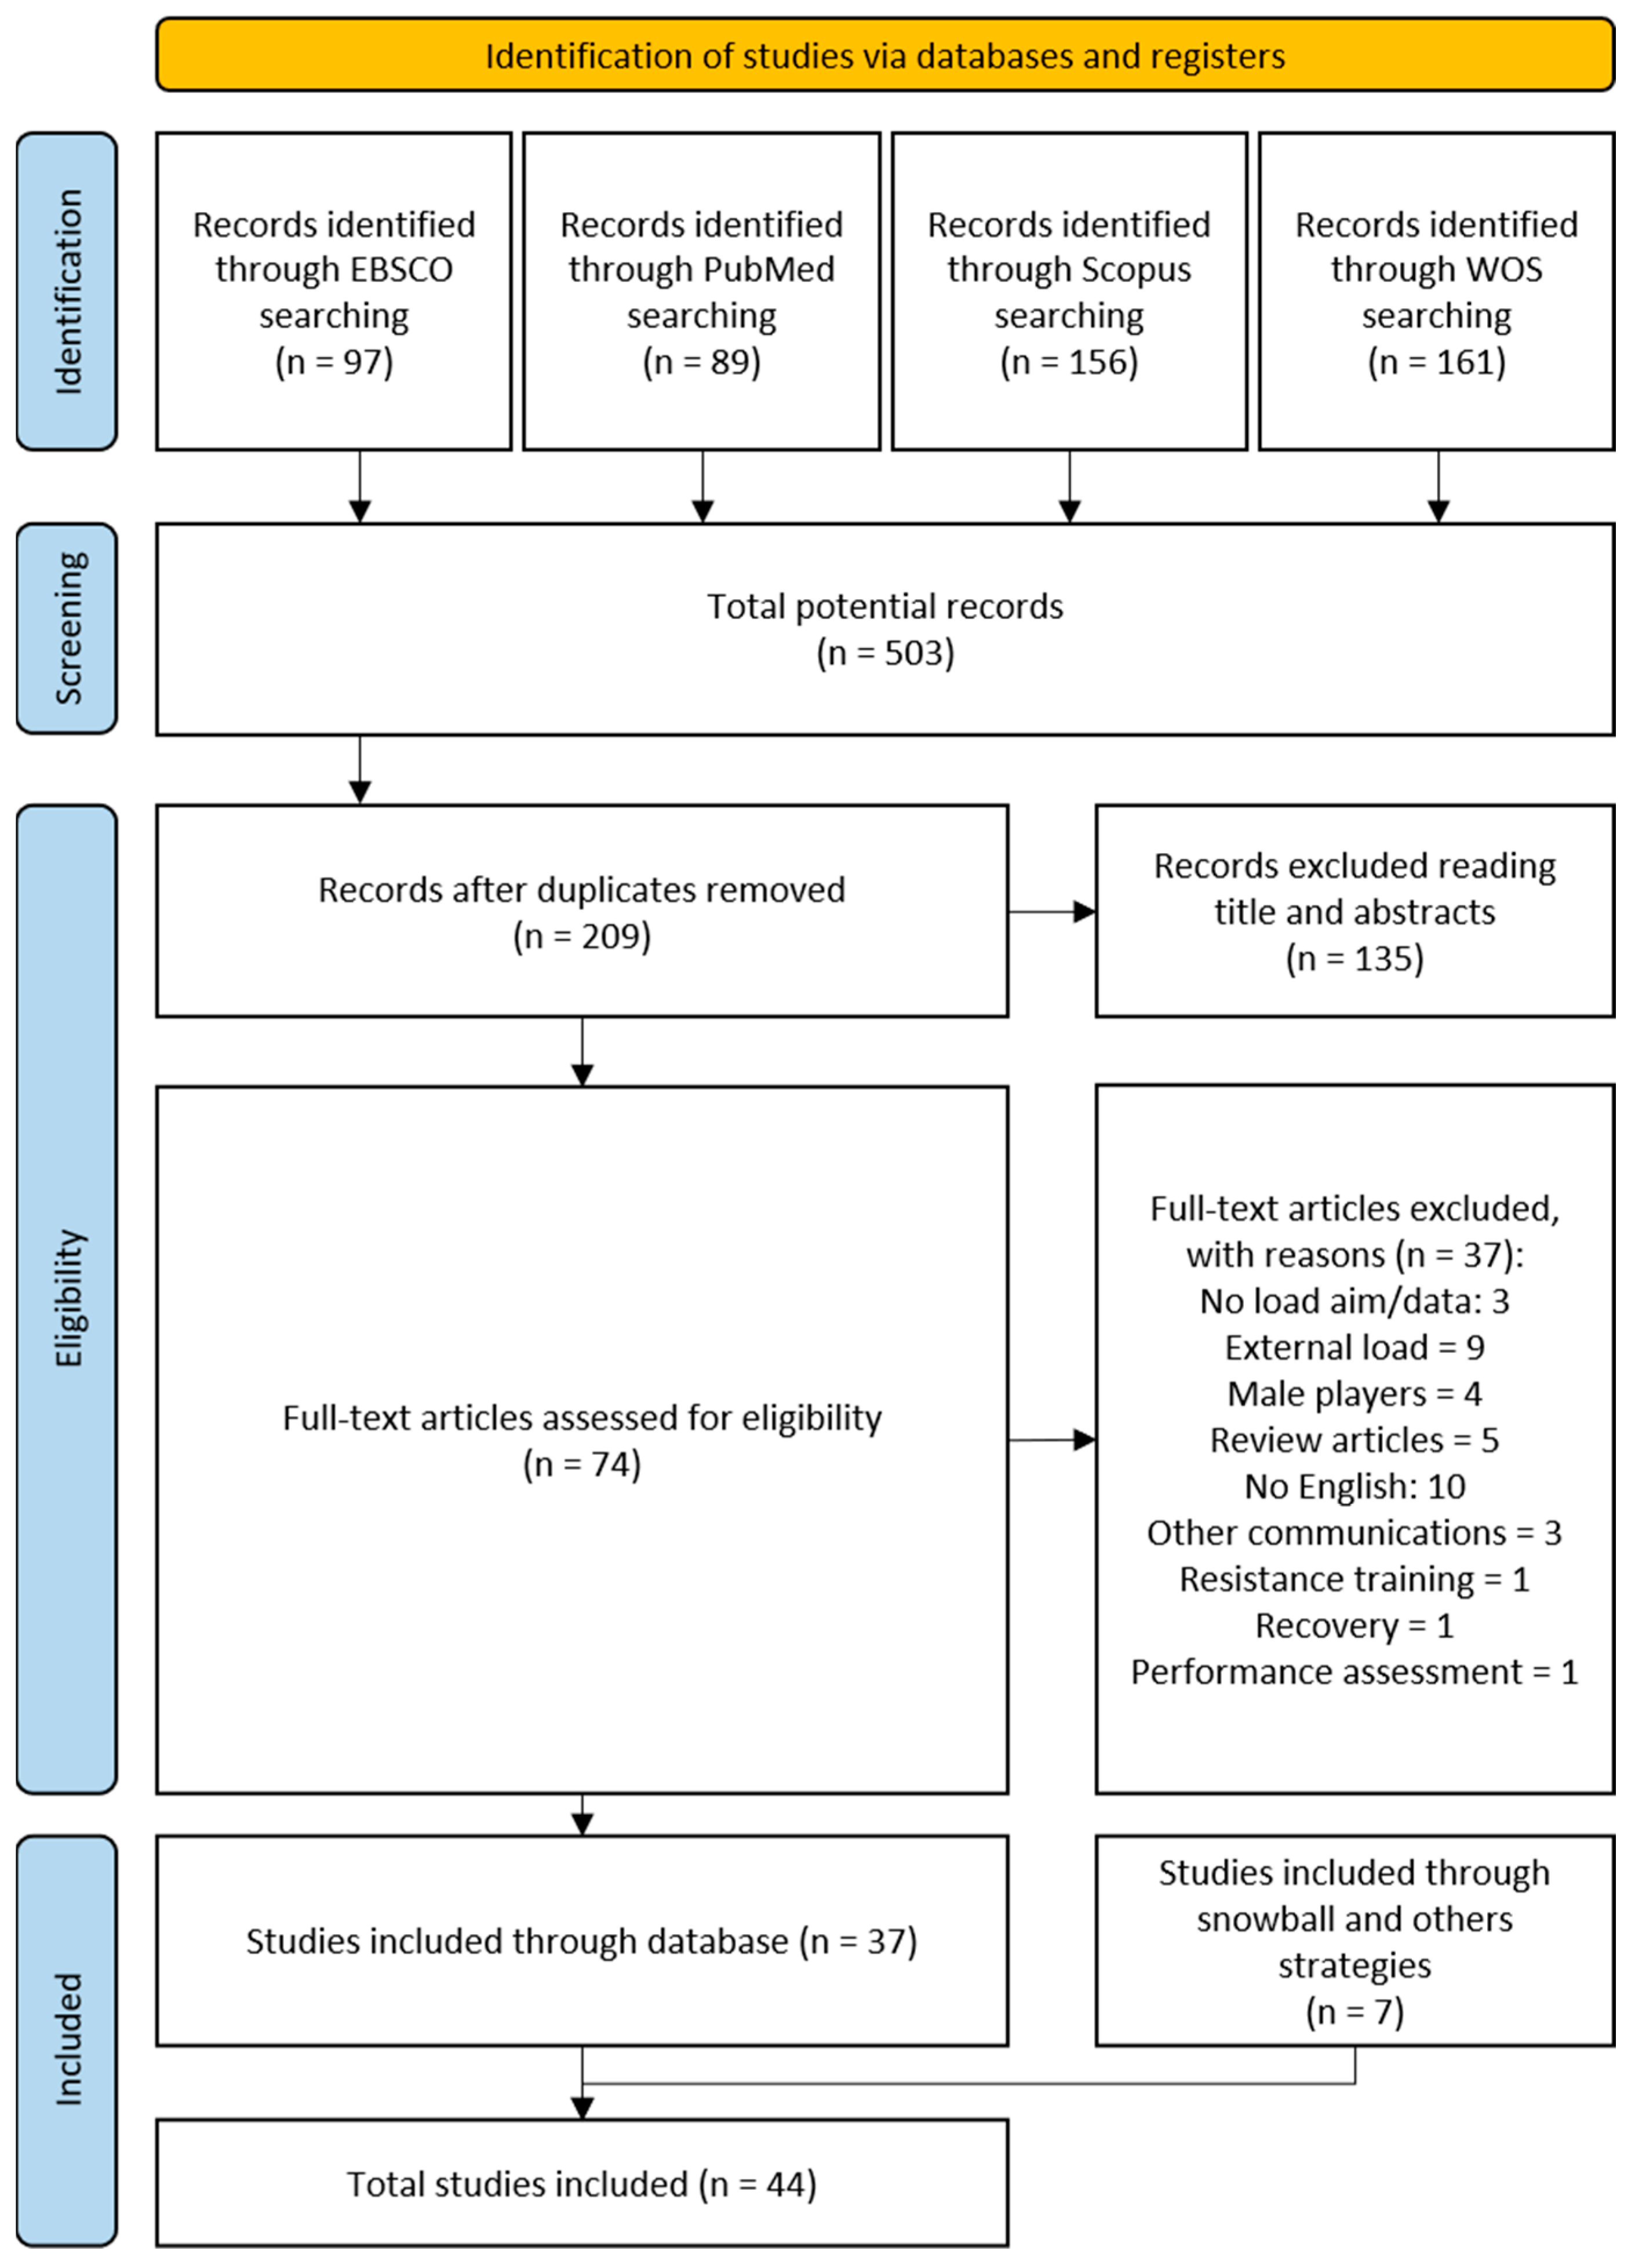
3.1. Search Strategy
3.2. Populations and Events Studied
3.3. Subjective Monitoring Load Methods
3.4. Sensor-Based Monitoring Load Methods
3.5. Quality Assessment and Risk of Bias

| Publication | n | Level | Age | Event Registered | Method | Study Quality (Rate) |
|---|---|---|---|---|---|---|
| Anderson et al. (2003) [16] | 12 | Y | 18–22 | P | S | Good (15) |
| Matthew et al. (2009) [52] | 9 | A | 25.8 ± 2.5 | G | DB | Fair (14) |
| Narazaki et al. (2009) [19] | 6 | E | 20.0 ± 1.3 | P | S; DB | Fair (14) |
| Delextrat et al. (2012) [39] | 9 | P | 24.3 ± 4.1 | P; G | S | Fair (14) |
| Klusemann et al. (2012) [23] | 8 | Y | 17.4 ± 0.7 | P | S; DB | Good (16) |
| Scanlan et al. (2012) [17] | 12 | A | 22.0 ± 3.7 | G | DB | Good (15) |
| Atli et al. (2013) [20] | 12 | Y | 15.5 ± 0.5 | P | DB | Good (15) |
| Azpiroz et al. (2013) [22] | 87 | Y | U12 | G | S | Fair (13) |
| Nunes et al. (2014) [58] | 19 | E | 26.0 ± 5.0 | P | S; DB | Good (16) |
| Abad et al. (2016) [24] | 15 | Y | 16.9 ± 1.1 | P | DB | Fair (12) |
| Vencúrik et al. (2016) [45] | 10 | Pro | 20.4 ± 2.8 | G | DB | Fair (10) |
| Legg et al. (2017) [21] | 10 | Y | 18 ± 2 | P | S | Fair (14) |
| Messias et al. (2017) [57] | 8 | NR | 20 ± 1 | P | S | Fair (12) |
| Vallés Ortega (2017) [40] | 12 | P | 21.9 ± 4.8 | P | S | Fair (13) |
| Vallés Ortega et al. (2017) [54] | 12 | A | 17.1 ± 0.7 | G | S | Fair (13) |
| Batalla et al. (2018) [55] | 10 | A | 21.3 ± 2.7 | G | DB | Fair (14) |
| Cruz et al. (2018) [41] | 10 | P | 17.2 ± 0.4 | P | S | Good (15) |
| Montgomery et al. (2018) [31] | 208 | E; Y | 22.9 ± 5.6 | G | S; DB | Good (16) |
| Sánchez et al. (2018) [59] | 6 | A | 14.3 ± 0.5 | P | S; DB | Fair (13) |
| Sanders et al. (2018) [35] | 10 | E | 19.8 ± 1.3 | G | DB | Good (16) |
| Coyne et al. (2019) [18] | 12 | E | 27.8 ± 3.6 | P | S | Good (17) |
| Lupo et al. (2019) [34] | 15 | E | 16.7 ± 0.5 | P | S | Good (15) |
| Paulauskas et al. (2019) [42] | 29 | Pro | 21.0 ± 5.0 | P; G | S | Good (17) |
| Reina et al. (2019) [49] | 10 | A | 21.7 ± 3.7 | P; G | DB | Good (18) |
| Reina et al. (2019) [30] | 12 | Y | U13 | P; G | DB | Good (15) |
| Sanders et al. (2019) [35] | 13 | E | 19.6 ± 1.3 | P; G | DB | Good (15) |
| Vala et al. (2019) [46] | 17 | Pro | 23.4 ± 2.1 | G | DB | Fair (12) |
| Kraft et al. (2020) [50] | - | A | - | P | S | Fair (14) |
| Lastella et al. (2020) [25] | 11 | Y | 17.3 ± 0.9 | P | S | Good (16) |
| Lukonaitene et al. (2020) [26] | 24 | E; Y | 18.8 ± 0.7 | P; G | S; DB | Good (15) |
| Otaegi et al. (2020) [27] | 19 | Y | 16.1 ± 0.7 | P; G | S | Good (15) |
| Sansone et al. (2020) [51] | 11 | A | 22.0 ± 3.0 | P; G | S | Good (17) |
| Stauton et al. (2020) [43] | 9 | Pro | 26 ± 3 | P | S | Good (15) |
| Suárez-Iglesias et al. (2020) [28] | 10 | Pro; Y | 18.6 ± 3.5 | P | DB | Good (15) |
| Adrianova et al. (2021) [61] | 10 | Pro | 183.9 ± 8.7 | G | DB | Fair (10) |
| Brini et al. (2021) [44] | 12 | Pro | 24.8 ± 1.8 | P | S; DB | Good (16) |
| Coyne et al. (2021) [36] | 13 | E | 29.0 ± 3.7 | P; G | S | Good (18) |
| Espasa-Labrador et al. (2021) [4] | 13 | E; Y | 16.3 ± 1 | P | S; DB | Good (16) |
| Piñar et al. (2021) [47] | 13 | Pro | 25.2 ± 7.3 | G | S; DB | Good (17) |
| Senbel et al. (2021) [29] | NR | Y | NR | P; G | S | Fair (11) |
| Vencúrik et al. (2021) [32] | 18 | Pro; Y | 18.8 ± 1.9 | G | DB | Good (19) |
| Batalla-Gavalda et al. (2022) [56] | 10 | A | 21.3 ± 2.7 | G | S; DB | Good (18) |
| Gutiérrez-Vargas et al. (2022) [33] | 32 | Y | 16.2 ± 1 | G | DB | Good (15) |
| Willberg et al. (2022) [39] | 37 | E | 23.5 ± 4.1 | G | S; DB | Good (15) |
| Publication (n; Level; Age) | Event | Observation | Method | Metrics | Tool(s) and Methodology | Outcome | ||
|---|---|---|---|---|---|---|---|---|
| Practice Game | Study-Defined Mode(s) | Obs. by Player | Statistical Units | |||||
| Anderson et al. (2003) [16] (12; Y; A; 18–22) | P | NR | NR | NR | RPE (1–10) | sRPE | NR | NR |
| Narazaki et al. (2009) [19] (6; E; 20.0 ± 1.3) | G | 5v5 OG | 6 | 36 | RPE (6–20) | RPE | NR | Player’s average: 14.3 ± 1.9 |
| Delextrat et al. (2012) [39] (9; Pro; 24.3 ± 4.1) | P | FCS, SSG, DT, TT | 5 | 45 | RPE (1–10) | sRPE | NR | NR |
| Klusemann et al. (2012) [23] (8; Y; 17.4 ± 0.7) | P | SSG (2v2; 4v4) | 19 | 152 | RPE (1–10) | RPE | NR | Player’s average by task format: 4v4; 2v2; Half court; Full court; 2 × 5 min; 4 × 2.5 min 6 ± 2; 8 ± 2; 6 ± 2; 7 ± 2; 7 ± 2; 7 ± 2 |
| Azpiroz et al. (2013) [22] (87; Y; U12; 16.9 ± 1.1) | G | 5v5 OG | NR | NR | RPE (1–10) | RPE | NR | Player’s average: 4.48 ± 1.65 |
| Nunes et al. (2014) [58] (19; E; 26 ± 5) | P | FCS | NR | NR | RPE (1–10) | RPE; sRPE | NR | Player’s average: RPE: 3.9 ± 1.5 sRPE: 321 ± 127 |
| Legg et al. (2017) [21] (10; Y; 18 ± 2) | P | NR | NR | NR | RPE (1–10) | sRPE | NR | Player’s average values by moment of season: Pre-season: 3195 ± 1083 Mid-season: 4344 ± 1376 |
| Messias et al. (2017) [57] (8; A; 20 ± 1) | P | TaT; TeT | 42 | 336 | RPE (1–10) | RPE; sRPE | NR | Weekly team’s average: RPE: 3.9 ± 0.9 sRPE: 413 ± 163.8 |
| Vallés Ortega (2017) [40] (12; Pro; 21.91 ± 4.81) | P | FCS | NR | NR | RPE (1–10) | RPE | NR | Team’s average: 3.12 ± 0.54 |
| Vallés Ortega et al. (2017) [54] (12; A; 17.08 ± 0.67) | G | 5v5 OG | 6 | 50 | RPE (1–10) | RPE | NR | Team’s average: 4.16 ± 1.05 |
| Cruz et al. (2018) [41] (10; Pro; 17.2 ± 0.4) | P | FCS | NR | NR | RPE (1–10) | sRPE | NR | Weekly team’s sum: 1584.3 ± 237.4 |
| Montgomery et al. (2018) [31] (208; E, Y; 22.9 ± 5.6) | G | 3v3 OG | NR | 635 | RPE (1–10) | RPE | NR | Player’s average by competition: Wch; ECh; U18 RPE: 5.3 ± 0.3; 5.8 ± 0.6; 5.9 ± 0.6 |
| Sánchez et al. (2018) [59] (6; A; 14.3 ± 0.5) | P | SSG | 2 | 12 | RPE (1–10) | RPE | NR | Player’s average: 5.80 ± 1.23 |
| Coyne et al. (2019) [18] (13; E; 29.0 ± 3.7) | P; G | P: NR G: 5v5 OG | 126.3 | 1642 | RPE (1–10) | RPE; sRPE | NR | RPE average: 5.53 ± 1.67 RPE average in practice: 5.37 ± 1.62 Weekly load: 4588 ± 1587 Games data: RPE average 5.53 ± 1.67 RPE average in competition: 7.11 ± 1.22 Weekly load: 4588 ± 1587 |
| Lupo et al. (2019) [34] (15; E; 16.7 ± 0.5) | P | FCS | 19 | 268 | RPE (1–10) | sRPE | NR | Player’s average by session: strength; conditioning; technique sRPE: 521 ± 25.6; 555 ± 34.8; 514 ± 20.5 |
| Paulauskas et al. (2019) [42] (29; Pro; 21 ± 5) | P; G | P: FCS G: 5v5 OG | 96–144 | 2784–4176 | RPE (1–10) | sRPE | Personal mobile device using Cloud-based software (Google Forms, Menlo Park, CA, USA) | Weekly sRPE player’s average: 1722 ± 715 Weekly sRPE player’s average during game clustered: Low playing time group: 720.3 ± 200.9 High playing time group: 903.1 ± 208.9 |
| Kraft et al. (2020) [50] (NR; NR; NR) | P | NR | NR | 124 | RPE (1–10) | RPE; sRPE | NR | Player’s average: RPE: 5.1 ± 1.8 SRPE: 711 ± 282 |
| Lastella et al. (2020) [25] (11; Y; 17.3 ± 0.9) | P | FCS | 111 | 1221 | RPE (1–10) | sRPE | Paper and pencil | Session’s average clustered by type: LTLS: 274 ± 136 MTLS: 576 ± 221 HTLS: 1186 ± 309 |
| Lukonaitene et al. (2020) [26] (24; E, Y; 18.8 ± 0.7) | P; G | P: FCS G: 5v5 FG | 33 | 792 | RPE (1–10) | sRPE | Personal mobile device using Cloud-based software (Google Forms, Menlo Park, CA, USA) | Data include practice and game average Team’s average: U20; U18 sRPE: 617.29 ± 328.24; 942.82 ± 436.51 |
| Otaegi et al. (2020) [27] (19; Y; 15 ± 0.7) | P; G | P: FCS G: 5v5 OG | 50 | 478 | RPE (1–10) | RPE; sRPE | Ask personally by coach | Team’s average by teams: U15; U16 Daily RPE: 2.9 ± 0.3; 3.1 ± 0.6 Daily sRPE: 253 ± 27; 259 ± 50 Week sum sRPE: 10.9 ± 1.9; 13.9 ± 3.0 Week sum sRPE: 879 ± 140; 1073 ± 260 Games data: RPE (U15; U16): 3.6 ± 1.2; 4.5 ± 1.0 sRPE (U15; U16): 316 ± 115; 378 ± 96 |
| Sansone et al. (2020) [51] (11; A; 22.0 ± 3.0) | P; G | P: FCS G: 5v5 OG | 40 | 40 | RPE (1–10) | sRPE | Registered individually with laptop | Player’s average during practice: 428 ± 114 Weekly sRPE player’s average: 1561 ± 177 NR data during games |
| Stauton et al. (2020) [43] (9; Pro; 26 ± 3) | P | WU; SD; OD; DD; MS | NR | NR | RPE (1–10) | RPE | NR | Player’s average by type of task: WU; SD; OD; DD; MS 4.8 ± 0.1; 6.5 ± 0.2; 6.0 ± 0.1; 7.4 ± 0.0; 7.4 ± 0.0 Player’s average by session: 6.42 ± 0.1 |
| Brini et al. (2021) [44] (12; Pro; 24.8 ± 1.8) | P | SSG | NR | NR | RPE (1–10) | RPE | RPE: after each SSG and 30 after practice, NR tool | Player’s average: 7.0 ± 0.8 |
| Coyne et al. (2021) [36] (13; E; 29.0 ± 3.7) | P; G | FCS G: 5v5 OG | NR | NR | RPE (1–10) | sRPE | RPE: 30′ after event; NR | Daily average: 648 ± 496 Weekly average (including practice and game): 4588 ± 1597 |
| Espasa-Labrador et al. (2021) [4] (13; E, Y; 16.3 ± 1) | P [39] | FCS | 35 | 164 | RPE (1–10) | sRPE | Quanter Mobile App (Kvantia, Helsinki, Finland) | Average per session: sRPE: 765.3 ± 174.9; SHRZ: 276.1 ± 61.9; TRIMPB: 61.7 ± 10.1 |
| Piñar et al. (2021) [37] 13; Pro; 25.2 ± 7.3 | P; G | P: NR G: 5v5 OG | 28 | NR | RPE (1–10) | sRPE | Quanter Mobile App (Kvantia, Helsinki, Finland) | Weekly load sRPE (including practice events) Pre-season: 2168 ± 911 First round: 1612 ± 881 Second round: 1750 ± 729 |
| Senbel et al. (2021) [29] (NR; NR; NR) | P; G | FCS, RT, CT | NR | NR | RPE (1–10) | RPE; sRPE | NR | NR |
| Batalla-Gavalda et al. (2022) [56] (10; A; 21.3 ± 2.71) | P; G | P: FCS G: 5v5 OG | NR | P: NR G: 68 | RPE (6–20) | RPE | RPE: 30′ after game and 10′ after practice. Reported individually in an isolated area | Data of 10 games (min; average; max) RPE: 15.2 ± 2.4; 16.8 ± 1.8; 18 ± 1.1 |
| Willberg et al. (2022) [37] (37; Pro; 23.5 ± 4.1) | G | 5v5 OG 3v3 OG | NR | NR | RPE (1–10) | RPE | RPE: 15–30′ after game | Team’s average: 5v5 OG: 6 ± 2 3v3 OG: NR |
| Publication (n; Level; Age) | Event | Observation | Method | Metrics | Tool(s); SF; Body Place Worn | Outcome | ||
|---|---|---|---|---|---|---|---|---|
| Practice Game | Study-Defined Practice Mode(s) | Obs. by Player | Total Statistical Units | |||||
| Matthew et al. (2009) [52] (9; A; 25.8 ± 2.5) | G | 5v5 OG | 9 | 81 | HR | % of time spent >85% HRMax; HRAvg | Polar S810 (Polar Electro Oy, Kempele, Finland); 15-s SF; NR | Mean 80.4% time at HR greater than 85% of HRMax (relative to total time) Mean 93.1% time at HR greater than 85% of HRMax (relative to live time) Mean 166.3 ± 9.4 HRAvg in 1st half and 163.3 ± 9.0 in 2nd half. |
| Narazaki et al. (2009) [19] (6; E; 20.0 ± 1.3) | G | 5v5 OG | 6 | 36 | HR | HRPlay; HRRest | Polar watch (Polar Electro Oy, Kempele, Finland); NR SF; wrist | HRPlay (bpm): 168.7 ± 11.0 HRRest (bpm): 152.5 ± 11.5 |
| Klusemann et al. (2012) [23] (8; Y; 17.4 ± 0.7) | P | SSG (2v2; 4v4) | 19 | 152 | HR | %HRMax, %HRAvg, % time spent in two different HR zones | Suunto Heart Rate sensor (Suunto™, Vantaa, Finland); NR; NR | Player’s average by task format: 4v4; 2v2; HC; FC; 2 × 5 min; 4 × 2.5 min % HRMax: 92 ± 3; 92 ± 3; 92 ± 3; 92 ± 3; 92 ± 3; 92 ± 2 % HRAvg: 83 ± 5; 86 ± 4; 84 ± 5; 85 ± 4; 86 ± 4; 83 ± 3 % time in Z4: 51 ± 20; 55 ± 24; 46 ± 27; 56 ± 19; 53 ± 26; 58 ± 9 % time in Z5: 22 ± 25; 30 ± 31; 20 ± 27; 25 ± 27; 33 ± 32; 14 ± 13 |
| Scanlan et al. (2012) [17] (10; A; 21.7 ± 3.65) | G | 5v5 OG | 8 | NR | HR | HRAvg; %HRMax | Polar Team System (Polar Electro, Oy, Kempele, Finland); 5-s SF; NR | Team’s average by quarters: HRAvg; %HRMax Q1: 165 ± 4; 83.2 ± 2.6 Q2: 163 ± 5; 84 ± 2.6 Q3: 161 ± 4; 81.3 ± 1.9 Q4: 162 ± 6; 81.5 ± 2.9 1st Half: 163 ± 3; 82.4 2nd Half: 161 ± 4; 81.2 ± 1.9 Match: 162 ± 3; 82.4 ± 1.3 |
| Atli et al. (2013) [20] (12; Y; 15.5 ± 0.5) | P | HC, FCS | NR | NR | HR | HRAvg, %HRMax | Polar S810 HR (Polar Electro, Oy, Kempele, Finland); 5-s SF; NR | Player’s average values by type of task: HC; FC HRAvg: 161.8 ± 6.2; 180.9 ± 5.7 %HRMax: 76.3 ± 2.5; 85.6 ± 3.1 |
| Nunes et al. (2014) [58] (19; E; 26 ± 5) | P | FCS | NR | NR | HR | SHRZ | NR | Player’s average: 255 ± 62 |
| Abad et al. (2016) [24] (15; Y; 16.9 ± 1.1) | P; G | P: 5v5 SG G: 5v5 OG | 1 | 15 | HR | HRMax | Polar Team Pro (Polar, Kempele, Finland); NR; NR | Practice and game: HRmax: 195.27 ± 8.40 |
| Vencúrik et al. (2016) [45] (10; Pro; 20.4 ± 2.8) | G | 5v5 OG | 1 | 10 | HR | %HRMax, time spent in five different HR zones | Suunto Team Pack (Suunto Oy, Vantaa, Finland); 2-s SF; NR | Player’s average by position (point guards; forwards; centers): %HRmax: 88.2 ± 3.5; 87.8 ± 3.1; 88.9 ± 3.4 Z3 (<85%): 24.0 ± 19.4; 24.3 ± 12.5; 19.8 ± 13 Z4 (85–95%): 63.7 ± 17.6; 67.9 ± 10.7; 65.9 ± 15.8 Z5 (>95%): 12.3 ± 13.9; 7.9 ± 10.8; 14.2 ± 16.2 |
| Batalla et al. (2018) [55] (10; A; 21.3 ± 2.71) | G | 5v5 OG | 10 | 100 | HR | %HRMax | Suunto Team Pack (Suunto Oy, Vantaa, Finland); NR; NR | %HRMax by quarters: Q1: 90.2 ± 4.4; Q2: 90.3 ± 4.2 Q3: 89.6 ± 3.4; Q4: 90.4 ± 2.5 |
| Montgomery et al. (2018) [31] (208; E, Y; 22.9 ± 5.6) | G | 3v3 OG | NR | 635 | HR | HRMax; HRAvg | Polar T34 (Polar, Kemple, Finland); NR; NR | HRMax: 198 ± 9 HRAvg: 165 ± 18 |
| Sanders et al. (2018) [35] (10; E; 19.8 ± 1.3) | G | 5v5 OG | 31 | 310 | HR | HRMax; HRAvg; time spent in six different HR zones; SHRZ | Polar Team Pro (Polar, Kempele, Finland); NR; NR | Average by position (guards; forwards; centers): HRmax: 195.7 ± 6.7; 187.3 ± 8.8; 194.2 ± 8.8 HRavg: 146.0 ± 15.1; 149.9 ± 14.5; 151.1 ± 14.0 Z1 (50–60%): 4.3 ± 2.8; 3.0 ± 3.5; 3.6 ± 3.9 Z2 (60–70%): 3.2 ± 2.0; 3.4 ± 2.1; 4.7 ± 3.1 Z3 (70–76%): 1.4 ± 0.8; 2.1 ± 1.4; 2.6 ± 2.0 Z4 (77–84%): 1.9 ± 1.1; 3.5 ± 2.0; 2.5 ± 1.5 Z5 (85–100%): 9.2 ± 3.8; 10.0 ± 4.3; 8.4 ± 3.5 85% HRmax: 61.1; 69.2; 66.3 SHRZ: 68.3 ± 15.1; 80.1 ± 23.1; 72.9 ± 21.2 |
| Lupo et al. (2019) [34] (15; E; 16.7 ± 0.5) | P | FCS | 19 | 268 | HR | SHRZ | Polar H7 (Polar Electro Oy, Kepele, Finland); 1-s SF; chest | Player’s average by type of session: Strength: 229 ± 14.4 Conditioning: 229 ± 19 Technique: 162 ± 12.1 |
| Reina et al. (2019) [49] (10; A; 21.7 ± 3.65) | P; G | P: SG G: 5v5 OG | 47 | 155 | HR | HRMax, HRAvg, %HRMax, time spent in six different HR zones | Garmin™; NR; NR | Team’s average: HRMax: 175.18; HRAvg: 145.91; %HRMax: 72.95; Z1 (50–60%): 17.78; Z2 (60–70%): 19.32; Z3 (70–80%): 23.28; Z4 (80–90%): 27.38; Z5 (90–95%): 9.19; Z6 (>95%): 1.27 Average in games: Average team values HRMax: 192.33; HRAvg: 169.18; %HRMax: 84.59; Z1 (50–60%): 3.66; Z2 (60–70%): 6.30; Z3 (70–80%): 12.35; Z4 (80–90%): 37.14; Z5 (90–95%): 31.84; Z6 (>95%): 8.09 |
| Reina et al. (2019) [30] (12; Y; U13) | P; G | P: NR G: 5v5 OG | 35 | 420 | HR | %HRAvg, %HRMax | Garmin™; NR; NR | NR |
| Sanders et al. (2019) [35] (13; E, Y; 19.6 ± 1.3) | P; G | P: NR G: 5v5 OG | NR | NR | HR | HR, SHRZ | Polar Team Pro (Polar, Kempele, Finland); 1-s SF; chest | Showed data including practice and game average Average values for groups (large; moderate; minimal): HRmax: 196.5 ± 1.4; 195.5 ± 1.8; 193.2 ± 1.6 HRavg: 132.6 ± 1.1; 130.8 ± 1.0; 127.9 ± 1.6 SHRZ: 352.2 ± 11.6; 314.5 ± 13.4; 276.5 ± 13.2 Time >85% HRmax (min): 21.6 ± 1.2; 20.0 ± 1.4; 16.4 ± 1.6 |
| Vala et al. (2019) [46] (17; Pro; 23.4 ± 2.1) | G | 5v5 OG | NR | 16 | HR | HRAvg, %HRMax; time spent in five different HR zones | Polar Team System 2 (Polar, Kemple, Finland); NR; NR | HRAvg by league and position: 1st league; 2nd league Guards: 174.8 ± 9.2; 183.3 ± 6.7 Forwards: 182.9 ± 12.3; 169.7 ± 6.7 Centers: 190.6 ± 11.3; 174.4 ± 9.1 Total: 183.2 ± 12.8; 176.1 ± 10.3 Average % HRmax by league and position: 1st league; 2nd league Guards: 91.1 ± 5.6; 90.1 ± 4.4 Forwards: 92.3 ± 5.6; 85.7 ± 3.4 Centers: 92.2 ± 4.8; 90.3 ± 2.9 Total: 91.9 ± 5.3; 88.8 ± 4.2 % time spent by positions: guards; forwards; centers Z1 (<80%): 0.64; 0.00; 0.00 Z2 (80–85%): 7.40; 3.67; 3.90 Z3 (85–90%): 42.41; 27.34; 17.36 Z4 (90–95%): 40.42; 45.5; 57.82 Z5 (>95%): 9.13; 23.49; 20.93 |
| Kraft et al. (2020) [50] (NR; NR; NR) | P | NR | NR | 124 | HR | HR | Polar H7 sensor and Polar Team System (Polar, Kemple, Finland); NR; NR | Player’s average values: SHRZ: 313 ± 112 |
| Lukonaitene et al. (2020) [26] (24; E, Y; 18.8 ± 0.7) | P; G | P: FCS G: 5v5 FG | 33 | 792 | HR | TRIMPB | H10 Polar Sensor (Polar, Kemple, Finland); NR; NR | Team’s average U20: 214.60 ± 109.42 U18: 304.95 ± 171.83 Showed data including practice and game |
| Suárez-Iglesias et al. (2020) [28] (10; Pro; 18.6 ± 3.5) | P | 1v1; DT | 12 | 120 | HR | %HRMax; %HRAvg; %Time spent 80–89% HRMax; %Time spent 90–100% HRMax; SHRZ | Suunto Team Pack (Suunto Oy, Vantaa, Finland); 5-s SF; NR | Team’s average by tasks (1v1; defense): %HRMax: 93.3 ± 4.9; 94.1 ± 5.6 %HRAvg: 83.6 ± 6.3; 85.1 ± 6.5 %Time spent at 80–89% HRMax: 43.7 ± 20.2; 40. ± 23.8 %Time spent at 90–100% HRMax: 25.7 ± 29.3; 45.2 ± 31.7 SHRZ: 3.8 ± 0.6; 4.3 ± 0.5 |
| Adrianova et al. (2021) [61] (10; Pro; 23 ± 3) | G | 5v5 OG | 89 | NR | HR | HRMax, HRAvg, number of kcal | Polar Team System HR sensors H10 (Polar, Kemple, Finland); NR; NR | Player’s average by season: season 2018/19; season 2019/20 HRMax: 197; 187 HRAvg: 137.7; 140.3 Total kcal: 875.7; 972.6 Kcal/min: 41.6; 46.9 |
| Brini et al. (2021) [44] (12; Pro; 24.8 ± 1.8) | P | SSG | NR | NR | HR | HRAvg | Polar Team System (Polar, Kemple, Finland); 5-s SF; NR | HRAvg: 187.1.7 |
| Espasa-Labrador et al. (2021) [4] (13; E, Y; 16.3 ± 1) | P | FCS | 35 | 164 | HR | SHRZ; TRIMP; | Polar Team Pro System (Polar, Kemple, Finland); 200Hz SF; chest | Player’s average during session: SHRZ: 276.1 ± 61.9 TRIMPB: 61.7 ± 10.1 |
| Piñar et al. (2021) [47] (13; Pro; 25.2 ± 7.3) | P; G | P: NR G: 5v5 OG | 28 | NR | HR | NR | M400 Polar (Polar, Kemple, Finland); NR; NR | NR |
| Vencúrik et al. (2021) [32] (18; Y, Pro; 18.8 ± 1.9) | P; G | P: NR G: 5v5 OG | 14 | 122 | HR | % of time spend in three different HR zones | Suunto Team; Pack telemetry system (Suunto Oy, Vantaa, Finland); 2-s; NR | NR |
| Batalla-Gavalda et al. (2022) [56] (10; A; 21.3 ± 2.71) | P; G | P: FCS G: 5v5 OG | NR | P: NR G: 68 | HR | HRAvg | Suunto Team Pack (Suunto Oy, Vantaa, Finland); NR; NR | Player’s average during 10 games: HRMin: 125.2 ± 10.9 HRAvg: 140.4 ± 11.1 HRMax: 147.3 ± 10.6 |
| Gutiérrez-Vargas et al. (2022) [33] (32; E, Y; 16.2 ± 1) | G | 5v5 OG | NR | NR | HR | HRMax, % time spent in five different HR zones | Garmin™; NR; NR | Average values by position: team; guards; forwards; centers Winning game: HRMax: 188.3 ± 17.3; 188 ± 23.6; 188 ± 17.7; 189 ± 10.6 50–60% HR: 6.7 ± 14.1; 6 ± 16; ±7 ± 13.8 60–70% HR: 9.1 ± 11.3; 12.8 ± 13.2; 6.4 ± 7.5; 8.1 ± 13.1 70–80% HR: 15.8 ± 13.6; 21 ± 17.9; 16.5 ± 14.2; 10 ± 8.7 80–90% HR: 30.9 ± 17.8; 32 ± 21.2; 31.5 ± 15.9; 21.1 ± 16.4 >90% HR: 21.2 ± 15.9; 16.4 ± 17.4; 24.2 ± 15.5; 28.9 ± 14.9 Losing game: HRMax: 189.2 ± 16.2; 189.5 ± 20.7; 188.7 ± 14; 189.6 ± 16.1; 50–60% HR: 8.4 ± 19.2; 12.2 ± 22.6; 7.5 ± 19.0; 5.6 ± 16.1; 60–70% HR: 8.25 ± 12.4; 8.2 ± 10.6; 7.4 ± 9.2; 9.1 ± 17.2; 70–80% HR: 11.9 ± 10.5; 12.1 ± 10.7; 13.9 ± 11.9; 9.8 ± 9; 80–90% HR: 29.9 ± 17.8; 29.3 ± 17.3; 32.1 ± 17.7; 28.1 ± 18.5 >90% HR: 24.4 ± 16; 22.4 ± 15.5; 23.7 ± 16.2; 27 ± 16.3 |
| Willberg et al. (2022) [37] (37; Pro; 23.5 ± 4.1) | G | 5v5 OG 3v3 OG | NR | NR | HR | HRMax, HRAvg, time spent in eight different HR zones | Vector Elite Vest (Catapult Sports, Melbourne, Australia); 10 Hz; Upper body | Team’s average by type of competition: HRAvg; Dominant HR Zone 5v5 OG: 6 ± 2; 151.4 ± 22.7; 160–180 (zone 7) 3v3 OG: NR; 160.8 ± 16.1; 160–180 (zone 7) |
| Publication (n; Level; Age) | Event | Observation | Method | Metrics | Tool(s); Characteristics | Outcome | ||
|---|---|---|---|---|---|---|---|---|
| Practice Game | Study-Defined Practice Mode(s) | Obs. by Player | Total Statistical Units | |||||
| Matthew et al. (2009) [52] (9; A; 25.8 ± 2.5) | G | 5v5 OG | 9 | 81 | BLC | mmol·L−1 | Analox LM5 (Analox Instruments Ltd., London, UK) | Player’s average: 1st Half: 5.4 ± 1.5; 2nd Half: 5.0 ± 1.4 Game: 5.2 ± 2.7 (55.9% of maximum) |
| Narazaki et al. (2009) [19] (6; E; 20.0 ± 1.3) | G | 5v5 OG | 6 | 36 | BLC; VO2 | mmol·L−1; ml/Kg/min, %VO2Max | NR, Portable VO2000 (Medical Graphics Corp., St. Paul, MN, USA); VO2: 0.05 Hz | Player’s average: BLCPlay: 3.2 ± 0.9 VO2Play (ml/Kg/min): 33.4 ± 4.0 VO2Play (%VO2Max): 66.7 ± 7.5 VO2Rest (ml/Kg/min): 21.3 ± 2.1 VO2Rest (%VO2Max): 42.7 ± 6.1 |
| Scanlan et al. (2012) [17] (10; A; 21.7 ± 3.65) | G | 5v5 OG | 8 | NR | BLC | mmol·L−1 | Accusport Lactate Analyser (Boehringer, Mannheim, Germany) | Team’s average by different periods: Q1: 3.6 ± 0.7; Q2: 4.6 ± 2.4; Q3: 3.4 ± 0.6; Q4: 3.5 ± 1.2 1st Half: 4.1 ± 1.7; 2nd Half: 3.4 ± 1.0 Game: 3.7 ± 1.4 |
| Montgomery et al. (2018) [31] (208; E, Y; 22.9 ± 5.6) | G | 3v3 OG | NR | 635 | BLC | mmol·L−1 | Lactate Scout+ (SensLab GmbH, Germany) | Player’s average by competition: WCh: 5.98 ± 0.98 ECh: 5.55 ± 0.50 U18: 5.69 ± 0.62 |
| Brini et al. (2021) [44] (12; Pro; 24.8 ± 1.8) | P | SSG | NR | NR | BLC | mmol·L−1 | 3 min after practice. Lactate Pro, Arkray, Japan | NR |
4. Discussion
4.1. Subjective Methods for Internal Load Monitoring
4.2. Device-Based Methods for Internal Load Monitoring
4.3. Other Device-Based Methods Used for Internal Load Monitoring
4.4. Limitations
5. Conclusions
Author Contributions
Funding
Institutional Review Board Statement
Informed Consent Statement
Data Availability Statement
Conflicts of Interest
References
- Huyghe, T.; Alcaraz, P.E.; Calleja-González, J.; Bird, S.P. The Underpinning Factors of NBA Game-Play Performance: A Systematic Review (2001–2020). Phys. Sportsmed. 2022, 50, 94–122. [Google Scholar] [CrossRef] [PubMed]
- Weiss, K.J.; Allen, S.V.; McGuigan, M.R.; Whatman, C.S. The Relationship Between Training Load and Injury in Men’s Professional Basketball. Int. J. Sports Physiol. Perform. 2017, 12, 1238–1242. [Google Scholar] [CrossRef] [PubMed]
- Helwig, J.; Diels, J.; Röll, M.; Mahler, H.; Gollhofer, A.; Roecker, K.; Willwacher, S. Relationships between External, Wearable Sensor-Based, and Internal Parameters: A Systematic Review. Sensors 2023, 23, 827. [Google Scholar] [CrossRef]
- Espasa Labrador, J.; Peña, J.; Caparrós Pons, T.; Cook, M.; Fort Vanmeerhaeghe, A. Relationship between Internal and External Load in Elite Female Youth Basketball Players. Apunts Sports Med. 2021, 56, 100357. [Google Scholar] [CrossRef]
- Bourdon, P.C.; Cardinale, M.; Murray, A.; Gastin, P.; Kellmann, M.; Varley, M.C.; Gabbett, T.J.; Coutts, A.J.; Burgess, D.J.; Gregson, W.; et al. Monitoring Athlete Training Loads: Consensus Statement. Int. J. Sports Physiol. Perform. 2017, 12, S2161–S2170. [Google Scholar] [CrossRef] [PubMed]
- Vanrenterghem, J.; Nedergaard, N.J.; Robinson, M.A.; Drust, B. Training Load Monitoring in Team Sports: A Novel Framework Separating Physiological and Biomechanical Load-Adaptation Pathways. Sports Med. 2017, 47, 2135–2142. [Google Scholar] [CrossRef]
- Russell, J.L.; McLean, B.D.; Impellizzeri, F.M.; Strack, D.S.; Coutts, A.J. Measuring Physical Demands in Basketball: An Explorative Systematic Review of Practices. Sports Med. 2021, 51, 81–112. [Google Scholar] [CrossRef] [PubMed]
- Elliott-Sale, K.J.; Minahan, C.L.; de Jonge, X.A.K.J.; Ackerman, K.E.; Sipilä, S.; Constantini, N.W.; Lebrun, C.M.; Hackney, A.C. Methodological Considerations for Studies in Sport and Exercise Science with Women as Participants: A Working Guide for Standards of Practice for Research on Women. Sports Med. 2021, 51, 843–861. [Google Scholar] [CrossRef]
- McLaren, S.J.; Macpherson, T.W.; Coutts, A.J.; Hurst, C.; Spears, I.R.; Weston, M. The Relationships Between Internal and External Measures of Training Load and Intensity in Team Sports: A Meta-Analysis. Sports Med. 2018, 48, 641–658. [Google Scholar] [CrossRef] [PubMed]
- Reina, M.; García-Rubio, J.; Ibáñez, S.J. Training and Competition Load in Female Basketball: A Systematic Review. Int. J. Environ. Res. Public Health 2020, 17, 2639. [Google Scholar] [CrossRef]
- Stojanović, E.; Stojiljković, N.; Scanlan, A.; Dalbo, V.; Berkelmans, D.; Milanović, Z. The Activity Demands and Physiological Responses Encountered During Basketball Match-Play: A Systematic Review. Sports Med. 2018, 48, 111–135. [Google Scholar] [CrossRef]
- Page, M.J.; McKenzie, J.E.; Bossuyt, P.M.; Boutron, I.; Hoffmann, T.C.; Mulrow, C.D.; Shamseer, L.; Tetzlaff, J.M.; Akl, E.A.; Brennan, S.E.; et al. The PRISMA 2020 Statement: An Updated Guideline for Reporting Systematic Reviews. BMJ 2021, 372, n71. [Google Scholar] [CrossRef] [PubMed]
- Linder, S.K.; Kamath, G.R.; Pratt, G.F.; Saraykar, S.S.; Volk, R.J. Citation Searches Are More Sensitive than Keyword Searches to Identify Studies Using Specific Measurement Instruments. Physiol. Behav. 2015, 68, 412–417. [Google Scholar] [CrossRef]
- Petway, A.J.; Freitas, T.T.; Calleja-González, J.; Medina Leal, D.; Alcaraz, P.E. Training Load and Match-Play Demands in Basketball Based on Competition Level: A Systematic Review. PLoS ONE 2020, 15, e0229212. [Google Scholar] [CrossRef]
- von Elm, E.; Altman, D.G.; Egger, M.; Pocock, S.J.; Gøtzsche, P.C.; Vandenbroucke, J.P. The Strengthening the Reporting of Observational Studies in Epidemiology (STROBE) Statement: Guidelines for Reporting Observational Studies. PLoS Med. 2007, 4, e296. [Google Scholar] [CrossRef] [PubMed]
- Anderson, L.; Triplett-McBride, T.; Foster, C.; Doberstein, S.; Brice, G. Impact of Training Patterns on Incidence of Illness and Injury During a Women’s Collegiate Basketball Season. J. Strength Cond. Res. 2003, 17, 734–738. [Google Scholar] [CrossRef]
- Scanlan, A.T.; Dascombe, B.J.; Reaburn, P.; Dalbo, V.J. The Physiological and Activity Demands Experienced by Australian Female Basketball Players during Competition. J. Sci. Med. Sport 2012, 15, 341–347. [Google Scholar] [CrossRef] [PubMed]
- Coyne, J.O.C.; Nimphius, S.; Newton, R.U.; Gregory Haff, G. Does Mathematical Coupling Matter to the Acute to Chronic Workload Ratio? A Case Study from Elite Sport. Int. J. Sports Physiol. Perform. 2019, 14, 1447–1454. [Google Scholar] [CrossRef]
- Narazaki, K.; Berg, K.; Stergiou, N.; Chen, B. Physiological Demands of Competitive Basketball. Scand. J. Med. Sci. Sports 2009, 19, 425–432. [Google Scholar] [CrossRef]
- Atl, H.; Köklü, Y.; Alemdaroğlu, U.; Koçak, F.Ü. A Comparison of Heart Rate Response and Frequencies of Technical Actions Between Half-Court and Full-Court 3-A-Side Games in High School Female Basketball Players. J. Strength Cond. Res. 2013, 27, 352–356. [Google Scholar] [CrossRef]
- Legg, J.; Pyne, D.; Semple, S.; Ball, N. Variability of Jump Kinetics Related to Training Load in Elite Female Basketball. Sports 2017, 5, 85. [Google Scholar] [CrossRef] [PubMed]
- Azpiroz, M.F.; Feu, S.; Jiménez, C.; Calleja-GonzÁlez, J. Perceived Exertion Effort in Mini Basketball Players and Its Relationship with Training Volume. Rev. Psicol. Deporte 2013, 22, 205–208. [Google Scholar]
- Klusemann, M.J.; Pyne, D.B.; Foster, C.; Drinkwater, E.J. Optimising Technical Skills and Physical Loading in Small-Sided Basketball Games. J. Sports Sci. 2012, 30, 1463–1471. [Google Scholar] [CrossRef] [PubMed]
- Abad, C.C.C.; Pereira, L.A.; Kobal, R.; Kitamura, K.; Cruz, I.F.; Loturco, I.; Nakamura, F.Y. Heart Rate and Heart Rate Variability of Yo-Yo IR1 and Simulated Match in Young Female Basketball Athletes: A Comparative Study. Int. J. Perform. Anal. Sport 2016, 16, 776–791. [Google Scholar] [CrossRef]
- Lastella, M.; Roach, G.D.; Vincent, G.E.; Scanlan, A.T.; Halson, S.L.; Sargent, C. The Impact of Training Load on Sleep During a 14-Day Training Camp in Elite, Adolescent, Female Basketball Players. Int. J. Sports Physiol. Perform. 2020, 15, 724–730. [Google Scholar] [CrossRef]
- Lukonaitienė, I.; Kamandulis, S.; Paulauskas, H.; Domeika, A.; Pliauga, V.; Kreivytė, R.; Stanislovaitienė, J.; Conte, D. Investigating the Workload, Readiness and Physical Performance Changes during Intensified 3-Week Preparation Periods in Female National Under18 and Under20 Basketball Teams. J. Sports Sci. 2020, 38, 1018–1025. [Google Scholar] [CrossRef]
- Otaegi, A.; Los Arcos, A. Quantification of the Perceived Training Load in Young Female Basketball Players. J. Strength Cond. Res. 2020, 34, 559–565. [Google Scholar] [CrossRef]
- Suárez Iglesias, D.; Dehesa, R.; Scanlan, A.; Rodríguez-Marroyo, J.; Vaquera, A. Defensive Strategy and Player Sex Impact Heart Rate Responses during Games-Based Drills in Professional Basketball. Int. J. Sport. Physiol. Perform. 2020, 16, 360–366. [Google Scholar] [CrossRef]
- Senbel, S.; Sharma, S.; Raval, M.S.; Taber, C.; Nolan, J.; Artan, N.S.; Ezzeddine, D.; Kaya, T. Impact of Sleep and Training on Game Performance and Injury in Division-1 Women’s Basketball Amidst the Pandemic. IEEE Access 2022, 10, 15516–15527. [Google Scholar] [CrossRef]
- Reina, M.; García-Rubio, J.; Antúnez, A.; Courel-Ibáñez, J.; Ibáñez, S.J. Load Variability of Training Sessions and Competition in Female Basketball. Rev. Psicol. Deporte 2019, 28, 93–99. [Google Scholar]
- Montgomery, P.G.; Maloney, B.D. Three-by-Three Basketball: Inertial Movement and Physiological Demands During Elite Games. Int. J. Sports Physiol. Perform. 2018, 13, 1169–1174. [Google Scholar] [CrossRef] [PubMed]
- Vencúrik, T.; Nykodým, J.; Bokůvka, D.; Rupčić, T.; Knjaz, D.; Dukarić, V.; Struhár, I. Determinants of Dribbling and Passing Skills in Competitive Games of Women’s Basketball. Int. J. Environ. Res. Public Health 2021, 18, 1165. [Google Scholar] [CrossRef] [PubMed]
- Gutiérrez-Vargas, R.; Pino-Ortega, J.; Ugalde-Ramírez, A.; Sánchez-Ureña, B.; Blanco-Romero, L.; Trejos-Montoya, J.; Gutiérrez-Vargas, J.C.; Rojas-Valverde, D. Physical and Physiological Demands According to Gender, Playing Positions, and Match Outcomes in Youth Basketball Players. RICYDE Rev. Int. Cienc. Deporte 2022, 18, 15–28. [Google Scholar] [CrossRef]
- Lupo, C.; Ungureanu, A.N.; Frati, R.; Panichi, M.; Grillo, S.; Brustio, P.R. Player Session Rating of Perceived Exertion: A More Valid Tool Than Coaches’ Ratings to Monitor Internal Training Load in Elite Youth Female Basketball. Int. J. Sports Physiol. Perform. 2020, 15, 548–553. [Google Scholar] [CrossRef] [PubMed]
- Sanders, G.J.; Boos, B.; Rhodes, J.; Kollock, R.O.; Peacock, C.A.; Scheadler, C.M. Factors Associated with Minimal Changes in Countermovement Jump Performance throughout a Competitive Division I Collegiate Basketball Season. J. Sports Sci. 2019, 37, 2236–2242. [Google Scholar] [CrossRef]
- Coyne, J.O.C.; Coutts, A.J.; Newton, R.U.; Gregory Haff, G. Relationships Between Different Internal and External Training Load Variables and Elite International Women’s Basketball Performance. Int. J. Sports Physiol. Perform. 2021, 16, 871–880. [Google Scholar] [CrossRef]
- Willberg, C.; Wellm, D.; Behringer, M.; Zentgraf, K. Analyzing Acute and Daily Load Parameters in Match Situations–a Comparison of Classic and 3 × 3 Basketball. Int. J. Sports Sci. Coach. 2023, 18, 207–219. [Google Scholar] [CrossRef]
- Sanders, G.J.; Boos, B.; Rhodes, J.; Kollock, R.O.; Peacock, C.A. Competition-Based Heart Rate, Training Load, and Time Played Above 85% Peak Heart Rate in NCAA Division I Women’s Basketball. J. Strength Cond. Res. 2021, 35, 1095–1102. [Google Scholar] [CrossRef]
- Delextrat, A.; Trochym, E.; Calleja-González, J. Effect of a Typical In-Season Week on Strength Jump and Sprint Performances in National-Level Female Basketball Players. J. Sports Med. Phys. Fit. 2012, 52, 128–136. [Google Scholar]
- Ortega, V.; Suero, E.J.F. Relationship between Technical-Tactical Complexity in the Training Session and Internal Load in Female Basketball. Sport TK-Rev. Euroam. Cienc. Deporte 2017, 6, 163–168. [Google Scholar]
- Cruz, I.d.F.; Pereira, L.A.; Kobal, R.; Kitamura, K.; Cedra, C.; Loturco, I.; Cal Abad, C.C. Perceived Training Load and Jumping Responses Following Nine Weeks of a Competitive Period in Young Female Basketball Players. PeerJ 2018, 6, e5225. [Google Scholar] [CrossRef] [PubMed]
- Paulauskas, H.; Kreivyte, R.; Scanlan, A.T.; Moreira, A.; Siupsinskas, L.; Conte, D. Monitoring Workload in Elite Female Basketball Players During the In-Season Phase: Weekly Fluctuations and Effect of Playing Time. Int. J. Sports Physiol. Perform. 2019, 14, 941–948. [Google Scholar] [CrossRef]
- Staunton, C.; Wundersitz, D.; Gordon, B.; Kingsley, M. Discrepancies Exist between Exercise Prescription and Dose in Elite Women’s Basketball Pre-Season. Sports 2020, 8, 70. [Google Scholar] [CrossRef]
- Brini, S.; Abderrahman, A.B.; Clark, C.C.T.; Zouita, S.; Hackney, A.C.; Govindasamy, K.; Granacher, U.; Zouhal, H. Sex-Specific Effects of Small-Sided Games in Basketball on Psychometric and Physiological Markers during Ramadan Intermittent Fasting: A Pilot Study. BMC Sports Sci. Med. Rehabil. 2021, 13, 56. [Google Scholar] [CrossRef] [PubMed]
- Vencúrik, T.; Nykodým, J.; Vacenovský, P. Heart Rate Analysis of Semi-Elite Female Basketball Players during Competitive Games. Stud. Sport 2016, 10, 55–60. [Google Scholar] [CrossRef]
- Vala, R.; Valová, M.; Pacut, M. Heart Rate Response Differs between Elite and Non-Elite Czech Female Basketball Matches. J. Phys. Educ. Sport 2019, 19, 329–334. [Google Scholar] [CrossRef]
- Piñar, M.I.; García, D.; Mancha-Triguero, D.; Ibáñez, S.J. Effect of Situational and Individual Factors on Training Load and Game Performance in Liga Femenina 2 Basketball Female Players. Appl. Sci. 2022, 12, 7752. [Google Scholar] [CrossRef]
- Bastida Castillo, A.; Gómez Carmona, C.D.; De la cruz sánchez, E.; Pino Ortega, J. Accuracy, Intra- and Inter-Unit Reliability, and Comparison between GPS and UWB-Based Position-Tracking Systems Used for Time–Motion Analyses in Soccer. Eur. J. Sport Sci. 2018, 18, 450–457. [Google Scholar] [CrossRef]
- Reina Román, M.; García-Rubio, J.; Feu, S.; Ibáñez, S.J. Training and Competition Load Monitoring and Analysis of Women’s Amateur Basketball by Playing Position: Approach Study. Front. Psychol. 2019, 9, 2689. [Google Scholar] [CrossRef]
- Kraft, J.A.; Laurent, M.C.; Green, J.M.; Helm, J.; Roberts, C.; Holt, S. Examination of Coach and Player Perceptions of Recovery and Exertion. J. Strength Cond. Res. 2020, 34, 1383–1391. [Google Scholar] [CrossRef]
- Sansone, P.; Tschan, H.; Foster, C.; Tessitore, A. Monitoring Training Load and Perceived Recovery in Female Basketball: Implications for Training Design. J. Strength Cond. Res. 2020, 34, 2929–2936. [Google Scholar] [CrossRef]
- Matthew, D.; Delextrat, A. Heart Rate, Blood Lactate Concentration, and Time–Motion Analysis of Female Basketball Players during Competition. J. Sports Sci. 2009, 27, 813–821. [Google Scholar] [CrossRef] [PubMed]
- Reina, M.; Mancha, D.; Feu, S.; Ibáñez, S.J. Is Training Carried out the Same as Competition? Analysis of Load in Women’s Basketball. Rev. Psicol. Deporte 2017, 26, 9–13. [Google Scholar]
- Vallés Ortega, C.; Fernández-Ozcorta, E.J.; Fierro Suero, S. Fatigue-Recovery Pattern in a Competition Competitive High Density Junior Women’s Basketbal, Patrón Fatiga-Recuperación En Una Competición de Alta Densidad Competitiva En Baloncesto Femenino Juniors. Cuad. Psicol. Deporte 2017, 17, 183–187. [Google Scholar]
- Batalla Gavaldà, A.; Bofill Ródenas, A.M.; Montoliu Colás, R.; Corbi Soler, F. Relationship between Heart Rate and the Scoreboard during a Relegation Playoff. Apunts Educ. Física Deport. 2018, 132, 110–122. [Google Scholar] [CrossRef]
- Batalla-Gavalda, A.; Beltran-Garrido, J.V.; Garrosa-Martín, G.; Cecilia-Gallego, P.; Montoliu-Colás, R.; Corbi, F. Long-Term Analyses of the Rate of Perceived Exertion as an Indicator of Intensity in Women’s Basketball during a Relegation Play-Off. Biology 2022, 11, 1592. [Google Scholar] [CrossRef] [PubMed]
- Messias, L.H.D.; Camargo, B.F.; Ferrari, H.G.; Cardoso, J.P.P.; Manchado-Gobatto, F.B. Effect of Mathematical Modelling on Determining Lactate Minimum Test Parameters before and after Seven Weeks of Monitored Training. Sci. Sports 2017, 32, e127–e136. [Google Scholar] [CrossRef]
- Nunes, J.A.; Moreira, A.; Crewther, B.T.; Nosaka, K.; Viveiros, L.; Aoki, M.S. Monitoring Training Load, Recovery-Stress State, Immune-Endocrine Responses, and Physical Performance in Elite Female Basketball Players During a Periodized Training Program. J. Strength Cond. Res. 2014, 28, 2973–2980. [Google Scholar] [CrossRef]
- Sanchez-Sanchez, J.; Carretero, M.; Valiente, J.; Gonzalo-Skok, O.; Sampaio, J.; Casamichana, D. Heart Rate Response and Technical Demands of Different Small-Sided Game Formats in Young Female Basketballers. [Respuesta de La Frecuencia Cardíaca y Demanda Técnica En Diferentes Formatos de Juegos Reducidos Realizados Por Jugadoras Jóvenes de Baloncesto]. RICYDE Rev. Int. Cienc. Deporte 2018, 14, 55–70. [Google Scholar] [CrossRef]
- Reina, M.; Mancha-Triguero, D.; García-Santos, D.; García-Rubio, J.; Ibáñez, S.J. Comparación de Tres Métodos de Cuantificación de La Carga de Entrenamiento En Baloncesto./Comparison of Three Methods of Quantifying the Training Load in Basketball. RICYDE Rev. Int. Cienc. Deporte 2019, 15, 368–382. [Google Scholar] [CrossRef]
- Andrianova, R.I.; Fedoseev, D.V.; Chicherin, V.P.; Lubyshev, E.A.; Krasilnikov, A.A. Adaptation of the Training Process of Highly Qualified Women’s Basketball Teams Based on Indicators of Competitive Intensity and Calorie Consumption during Official Games. J. Phys. Educ. Sport 2021, 21, 1897–1903. [Google Scholar] [CrossRef]
- Reina, M.; García Rubio, J.; Antúnez, A.; José Ibáñez, S. Comparison of Internal and External Load in Official 3 vs. 3 and 5 vs. 5 Female Basketball Competitions. Retos Nuevas Perspect. Educ. Física Deporte Recreación 2020, 37, 400–405. [Google Scholar]
- Borg, G. Perceived Exertion as an Indicator of Somatic Stress. Scand. J. Rehabil. Med. 1970, 2, 92–98. [Google Scholar]
- Halperin, I.; Emanuel, A. Rating of Perceived Effort: Methodological Concerns and Future Directions. Sports Med. 2020, 50, 679–687. [Google Scholar] [CrossRef]
- Paludo, A.C.; Paravlic, A.; Dvořáková, K.; Gimunová, M. The Effect of Menstrual Cycle on Perceptual Responses in Athletes: A Systematic Review With Meta-Analysis. Front. Psychol. 2022, 13, 4068. [Google Scholar] [CrossRef] [PubMed]
- Foster, C.; Florhaug, J.A.; Franklin, J.; Gottschall, L.; Hrovatin, L.A.; Parker, S.; Doleshal, P.; Dodge, C. A New Approach to Monitoring Exercise Training. J. Strength Cond. Res. 2001, 15, 109–115. [Google Scholar] [PubMed]
- Scanlan, A.T.; Wen, N.; Tucker, P.S.; Dalbo, V.J. The Relationships between Internal and External Training Load Models during Basketball Training. J. Strength Cond. Res. 2014, 28, 2397–2405. [Google Scholar] [CrossRef]
- Schneider, C.; Hanakam, F.; Wiewelhove, T.; Döweling, A.; Kellmann, M.; Meyer, T.; Pfeiffer, M.; Ferrauti, A. Heart Rate Monitoring in Team Sports-A Conceptual Framework for Contextualizing Heart Rate Measures for Training and Recovery Prescription. Front. Physiol. 2018, 9, 639. [Google Scholar] [CrossRef] [PubMed]
- Portes, R.; Jiménez, S.L.; Navarro, R.M.; Scanlan, A.T.; Gómez, M.-Á. Comparing the External Loads Encountered during Competition between Elite, Junior Male and Female Basketball Players. Int. J. Environ. Res. Public Health 2020, 17, 1456. [Google Scholar] [CrossRef]
- Tehrani, F.; Teymourian, H.; Wuerstle, B.; Kavner, J.; Patel, R.; Furmidge, A.; Aghavali, R.; Hosseini-Toudeshki, H.; Brown, C.; Zhang, F.; et al. An Integrated Wearable Microneedle Array for the Continuous Monitoring of Multiple Biomarkers in Interstitial Fluid. Nat. Biomed. Eng. 2022, 6, 1214–1224. [Google Scholar] [CrossRef]

Disclaimer/Publisher’s Note: The statements, opinions and data contained in all publications are solely those of the individual author(s) and contributor(s) and not of MDPI and/or the editor(s). MDPI and/or the editor(s) disclaim responsibility for any injury to people or property resulting from any ideas, methods, instructions or products referred to in the content. |
© 2023 by the authors. Licensee MDPI, Basel, Switzerland. This article is an open access article distributed under the terms and conditions of the Creative Commons Attribution (CC BY) license (https://creativecommons.org/licenses/by/4.0/).
Share and Cite
Espasa-Labrador, J.; Fort-Vanmeerhaeghe, A.; Montalvo, A.M.; Carrasco-Marginet, M.; Irurtia, A.; Calleja-González, J. Monitoring Internal Load in Women’s Basketball via Subjective and Device-Based Methods: A Systematic Review. Sensors 2023, 23, 4447. https://doi.org/10.3390/s23094447
Espasa-Labrador J, Fort-Vanmeerhaeghe A, Montalvo AM, Carrasco-Marginet M, Irurtia A, Calleja-González J. Monitoring Internal Load in Women’s Basketball via Subjective and Device-Based Methods: A Systematic Review. Sensors. 2023; 23(9):4447. https://doi.org/10.3390/s23094447
Chicago/Turabian StyleEspasa-Labrador, Javier, Azahara Fort-Vanmeerhaeghe, Alicia M. Montalvo, Marta Carrasco-Marginet, Alfredo Irurtia, and Julio Calleja-González. 2023. "Monitoring Internal Load in Women’s Basketball via Subjective and Device-Based Methods: A Systematic Review" Sensors 23, no. 9: 4447. https://doi.org/10.3390/s23094447
APA StyleEspasa-Labrador, J., Fort-Vanmeerhaeghe, A., Montalvo, A. M., Carrasco-Marginet, M., Irurtia, A., & Calleja-González, J. (2023). Monitoring Internal Load in Women’s Basketball via Subjective and Device-Based Methods: A Systematic Review. Sensors, 23(9), 4447. https://doi.org/10.3390/s23094447