

Electrical Bioimpedance Analysis for Evaluating the Effect of Pelotherapy on the Human Skin: Methodology and Experiments
 , , , , and
Abstract
1. Introduction
2. Background
2.1. Basics of EBI
2.2. Effect of Curative Mud on the Skin
3. Materials and Methods
3.1. Choice and Data of Subjects
- Adult;
- Absence of chronic diseases of the circulatory system, skin disorders, and acute illnesses.
3.2. Materials
3.3. Measurement Procedure
- EBI measurement of the skin on the left forearm (A);
- EBI measurement of the skin on the right forearm (B);
- Application of the mud compress on the left forearm and the subsequent EBI measurement of the skin (C);
- Application of the water compress on the left forearm and the subsequent EBI measurement of the skin (D).
- The volunteer was sitting on the chair with the hand lying on the armrest at the height of about the last rib in the case of a horizontally bent arm (with the inner side of the forearm slightly exposed upwards);
- The area under the electrode on the surface of the skin was slightly moistened with a wet paper towel;
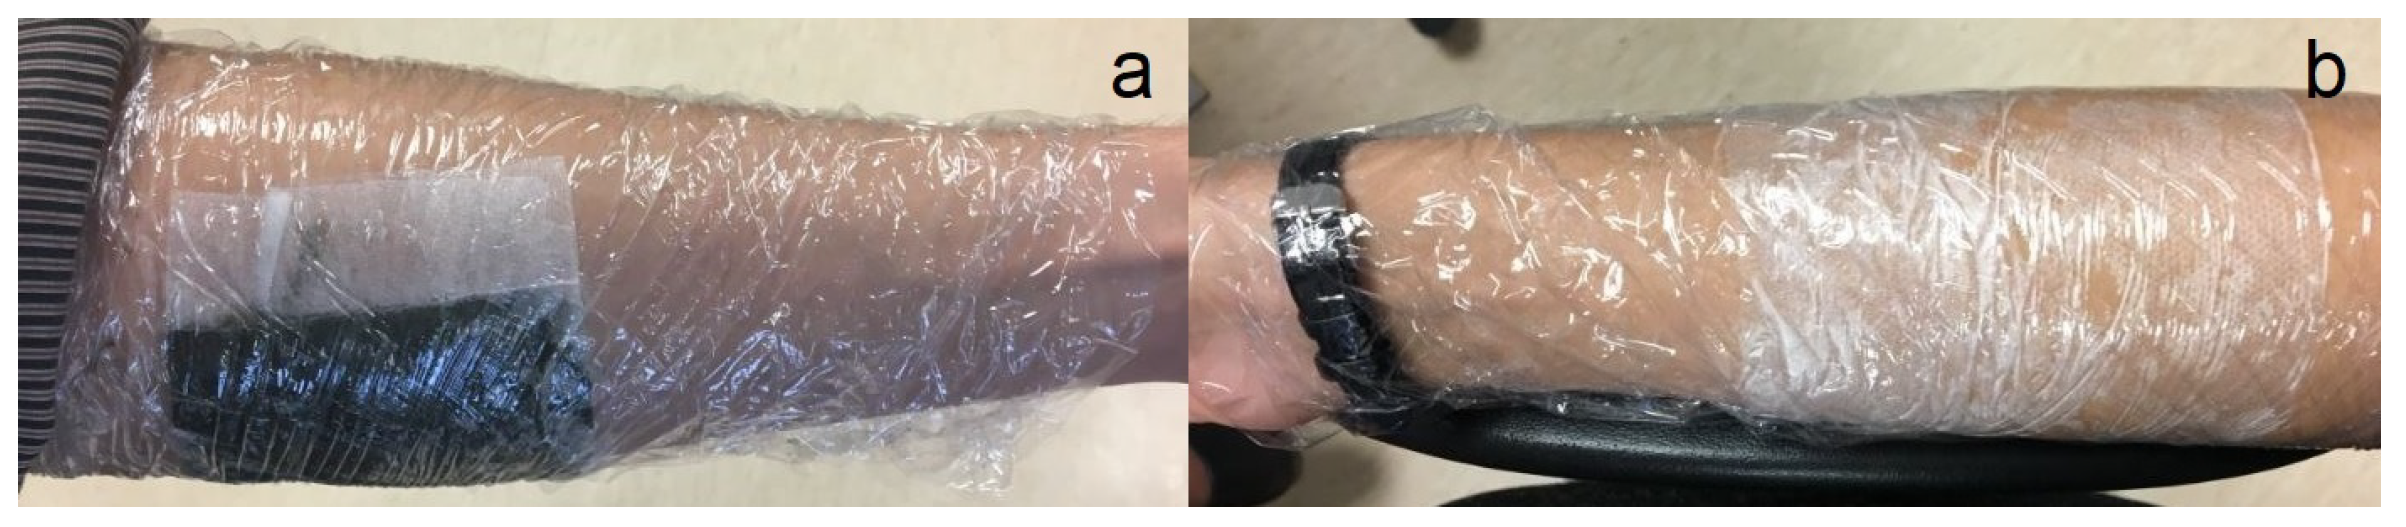
- The electrode was placed on about the area of the centerline of the middle side of the forearm and fixed by using a gentle medical tape (Figure 1);
- EBI measurement was performed 3 min after the electrode was attached to the skin surface;
- The tape with the electrode was removed.
- The PVC film and compress were removed after 30 min.
- Step 1 in the case of Measurement Cycles A-B.
- Loose water and mud were removed from the surface of the skin by using a paper towel.
- Step 3 in the case of Measurement Cycles A-B.
- Step 4 in the case of Measurement Cycles A-B.
- Step 5 in the case of Measurement Cycles A-B.
3.4. Measurement Method
3.5. Used Devices
3.6. Skin Impedance Models, i.e., the Method
- Z and ;
- R and X;
- G and B.
4. Measurement Results
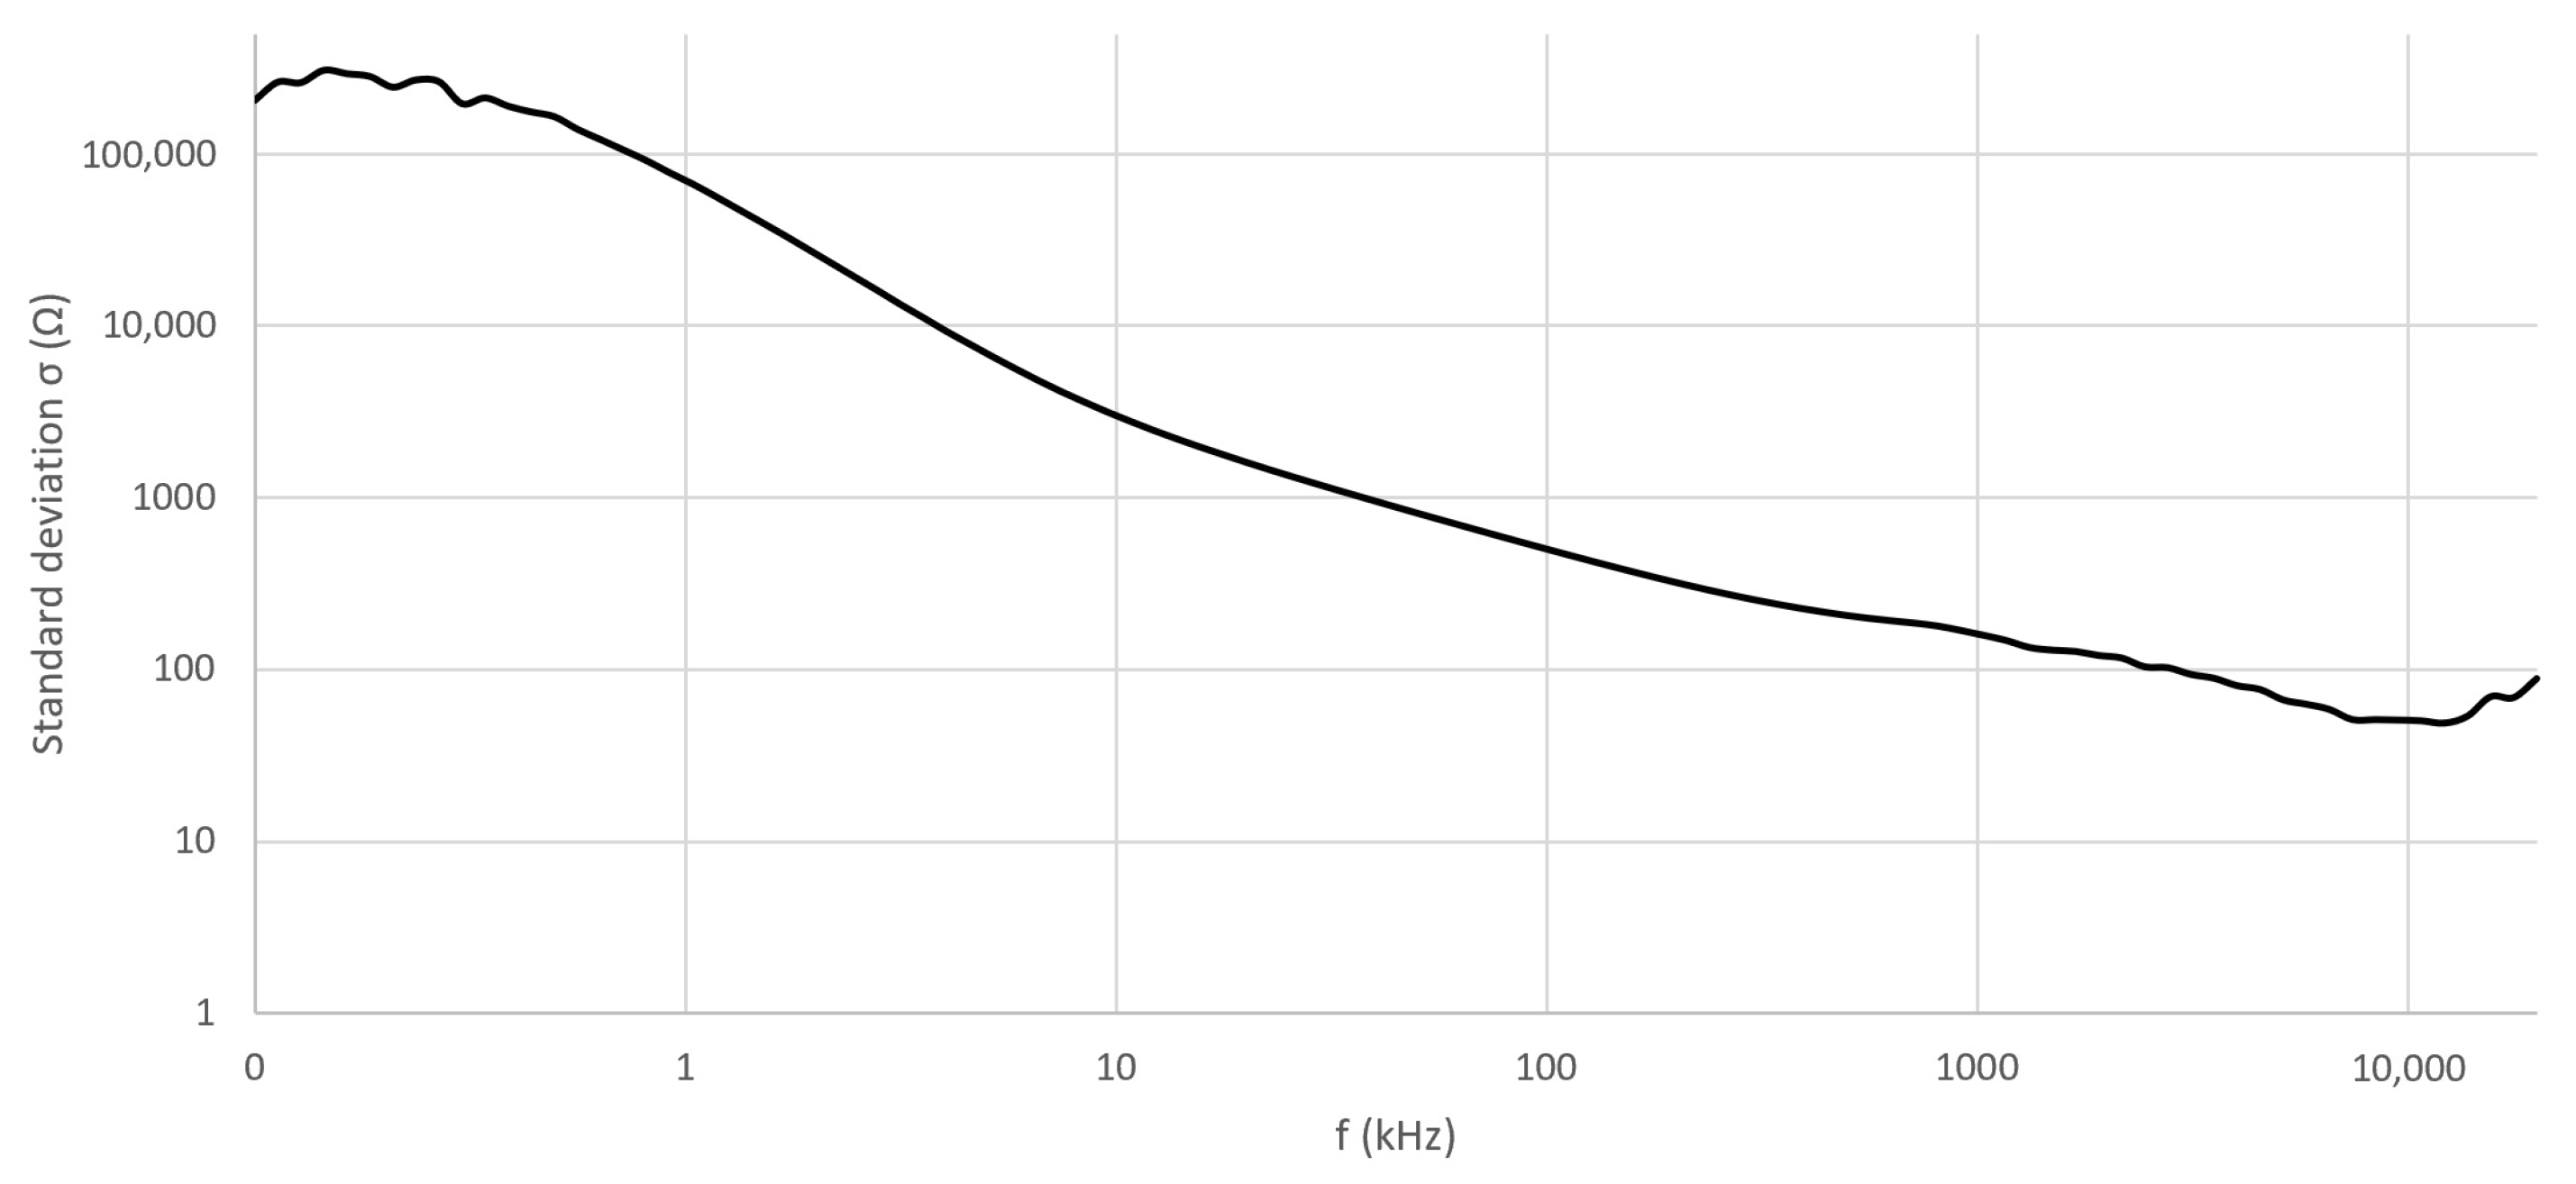
4.1. Verification of the Measurement Setup
4.2. Immittance Measurements of the Skin
4.2.1. The Magnitude and Phase Angle of the Measured Impedance of Skin
- 100 Hz …10 kHz;
- 10 kHz …1 MHz;
- 1 MHz …20 MHz.
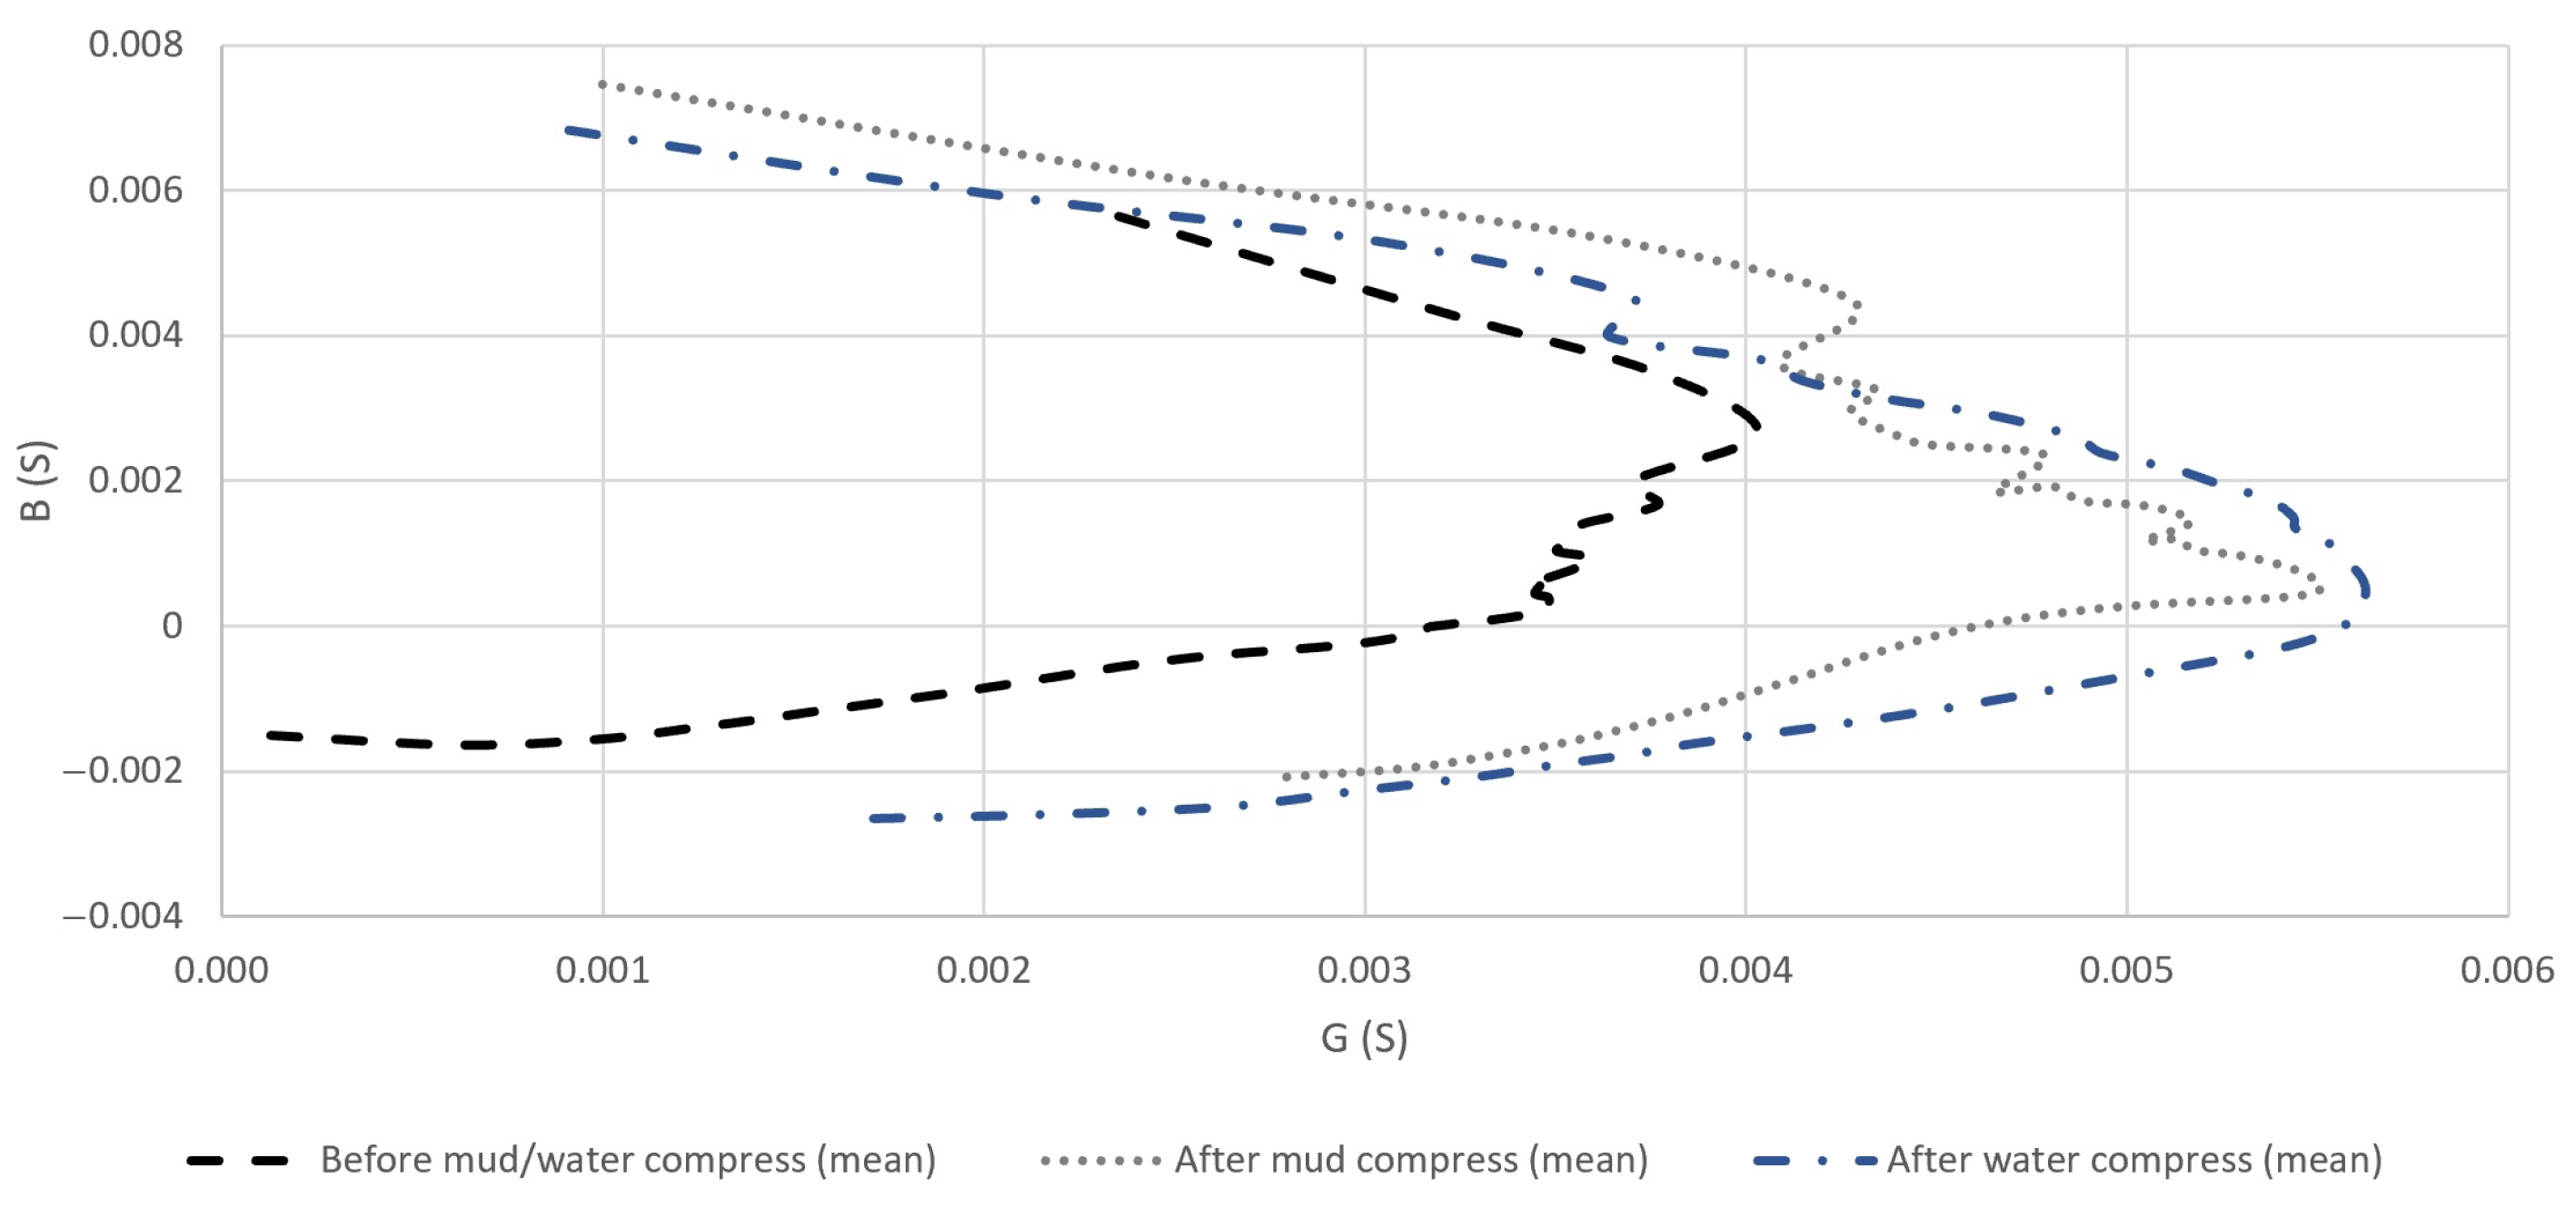
4.2.2. The Conductance and Susceptance of the Measured Admittance of Skin
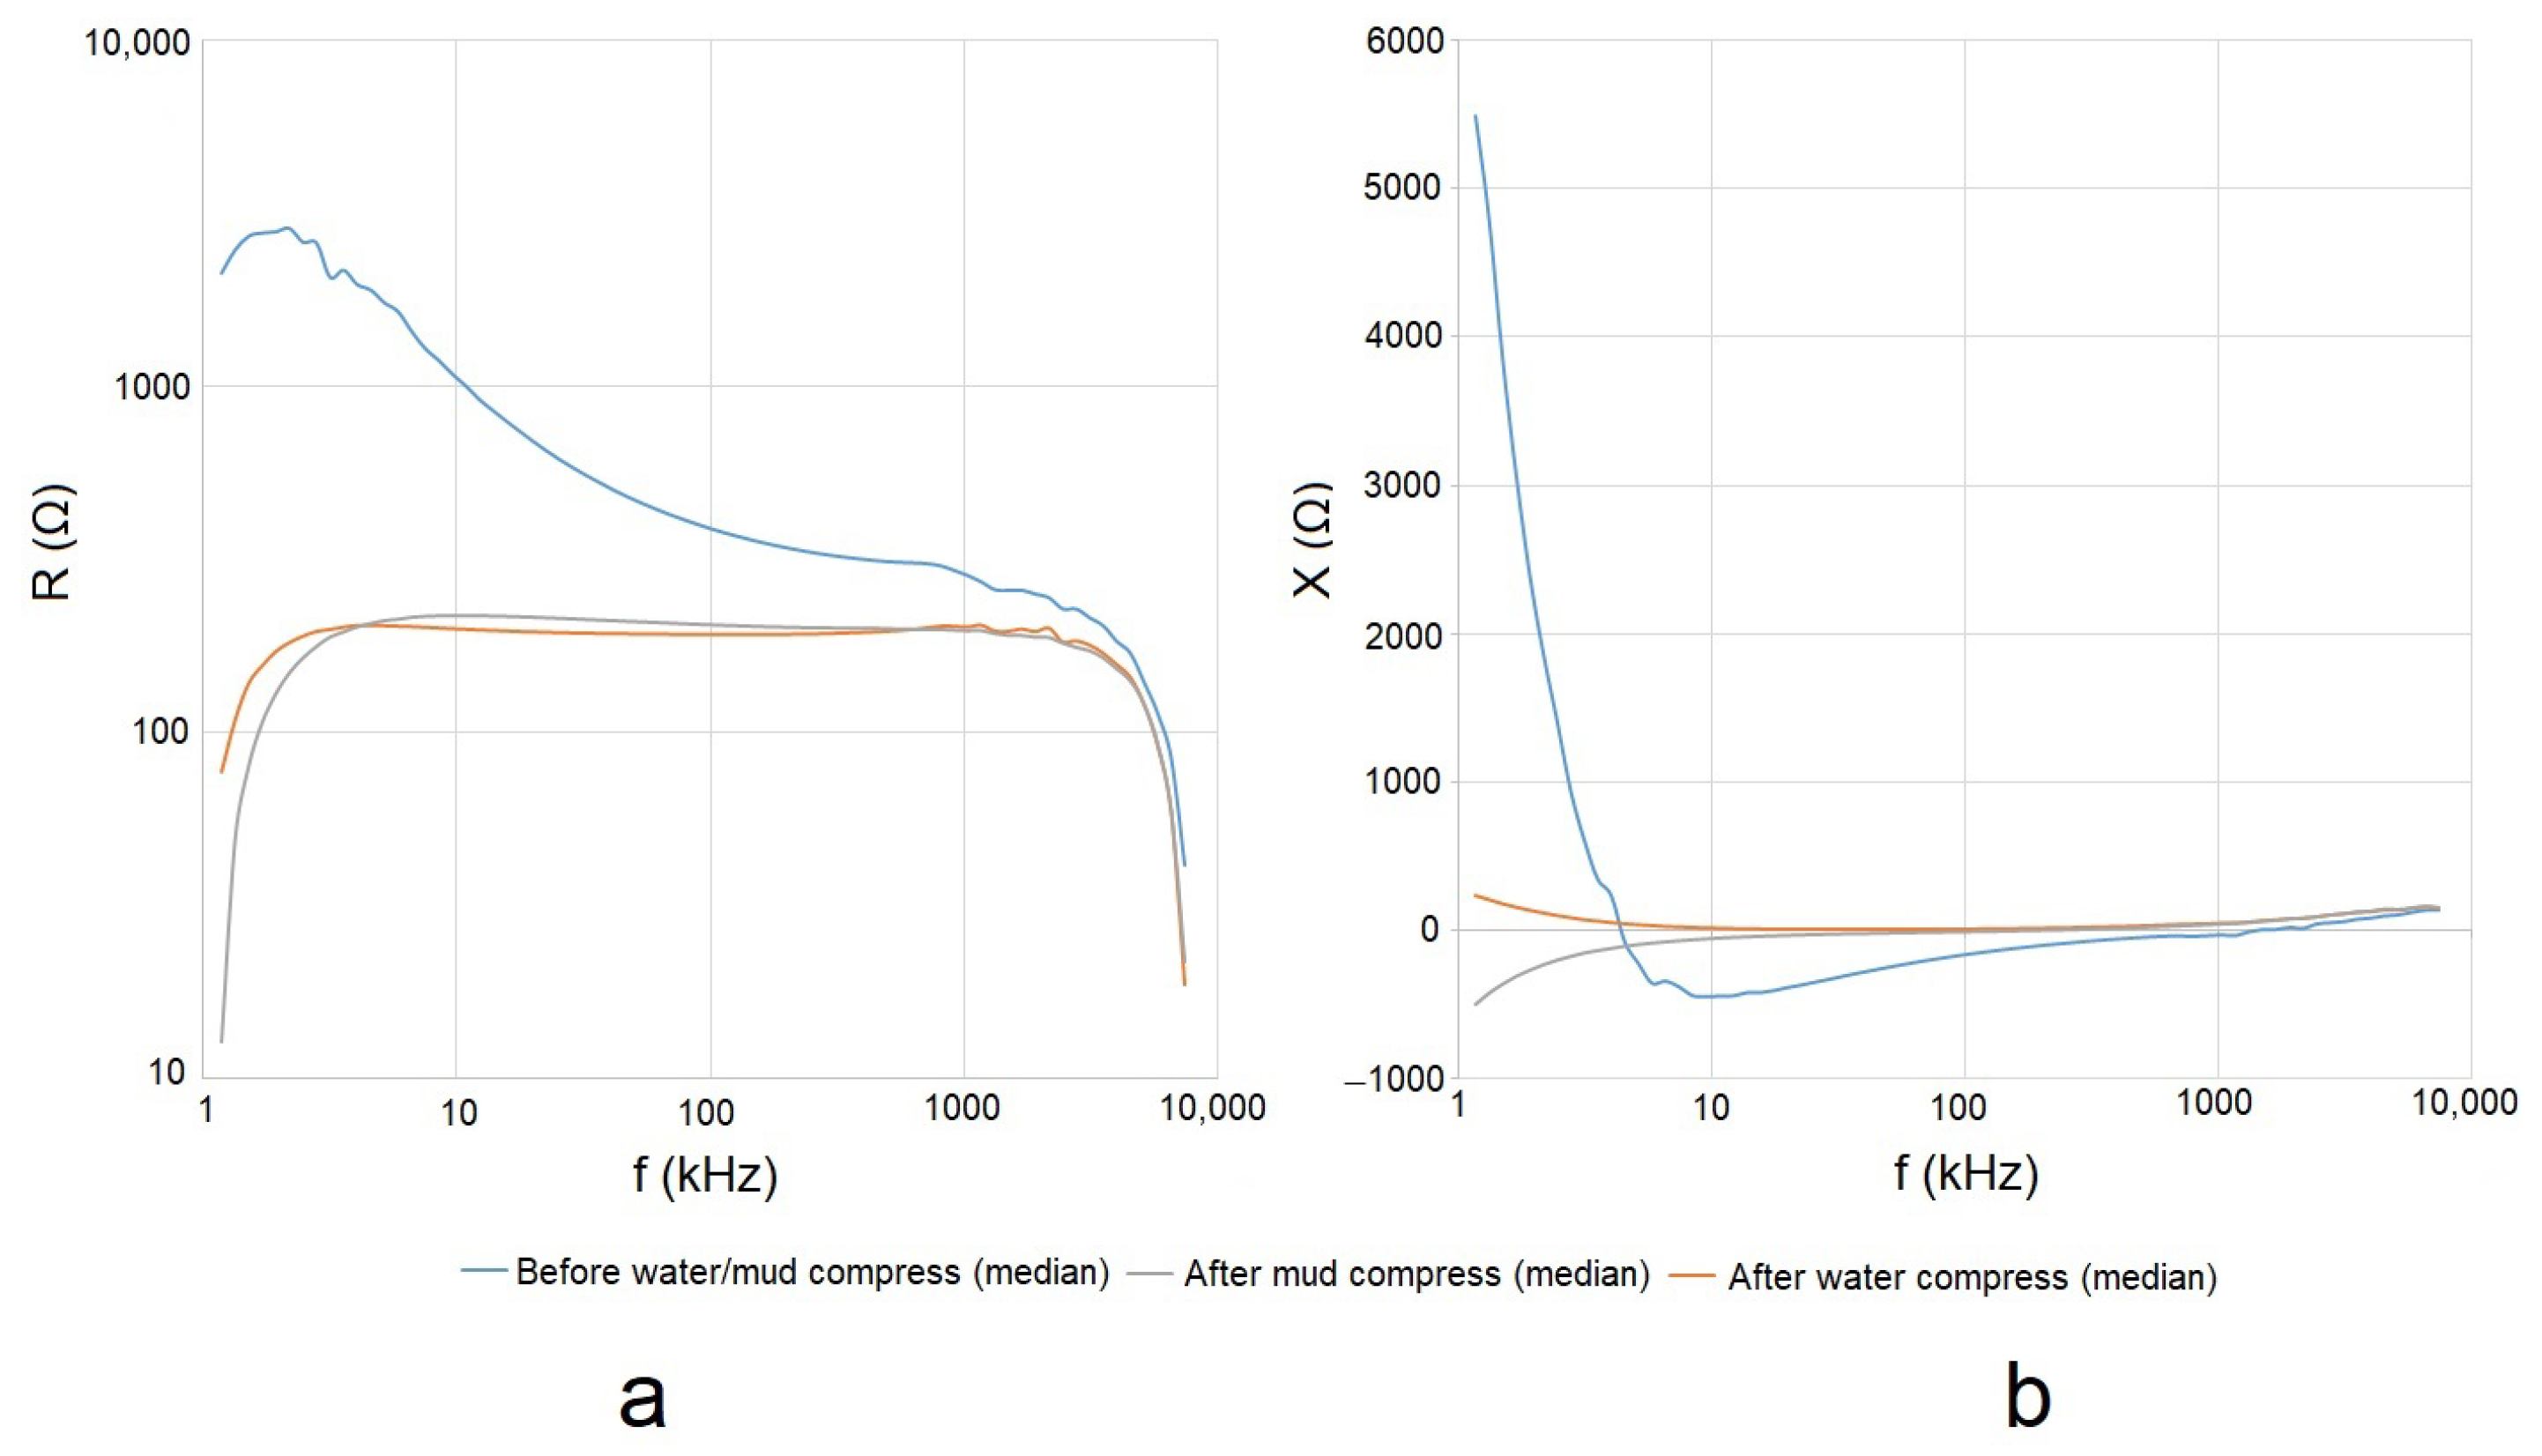
4.2.3. The Resistance and Reactance of the Measured Impedance of Skin
5. Discussion
5.1. Evaluation of the Effect of Pelotherapy on the Skin through the Analysis of Magnitude and Phase Angle of the Measured Impedance
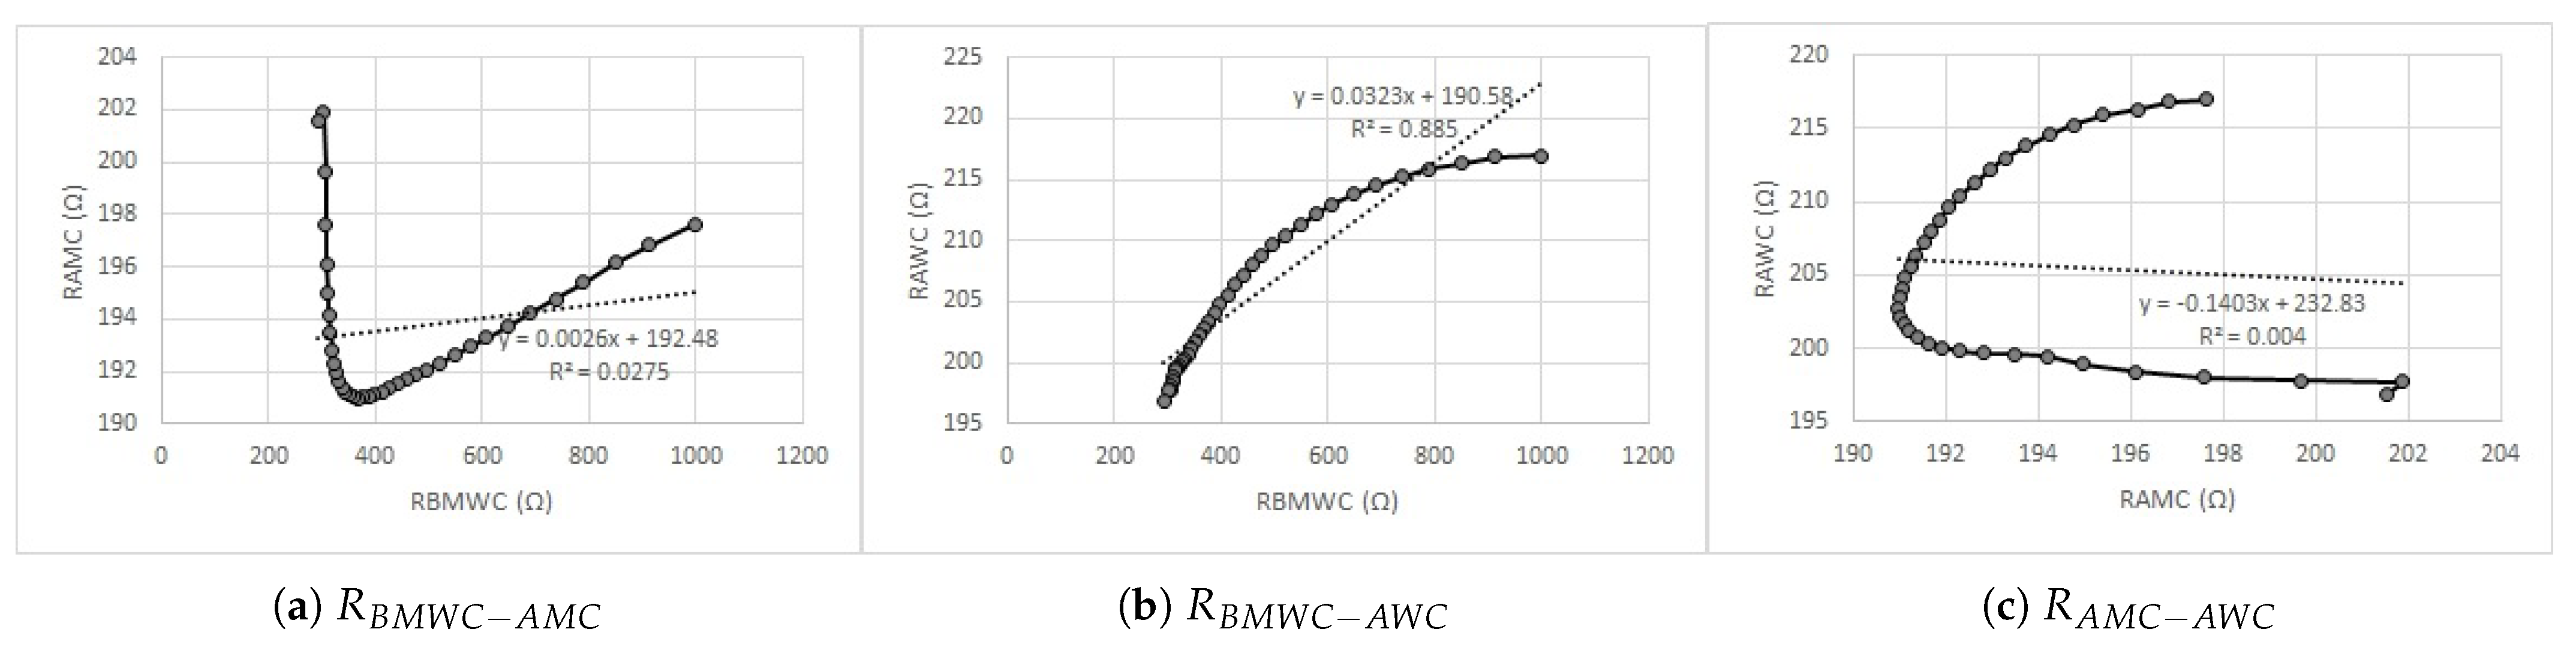
5.2. Evaluation of the Effect of Pelotherapy on the Skin through the Analysis of Real and Imaginary Parts of Measured Impedance and Admittance
5.3. Presence of Effect of Pelotherapy through EBI Analysis
6. Limitations of the Work
7. Conclusions
Author Contributions
Funding
Institutional Review Board Statement
Informed Consent Statement
Data Availability Statement
Acknowledgments
Conflicts of Interest
Abbreviations
| EBI | Electrical bioimpedance |
| SC | Stratum corneum |
| BMI | Body Mass Index |
| CC | Current carrying |
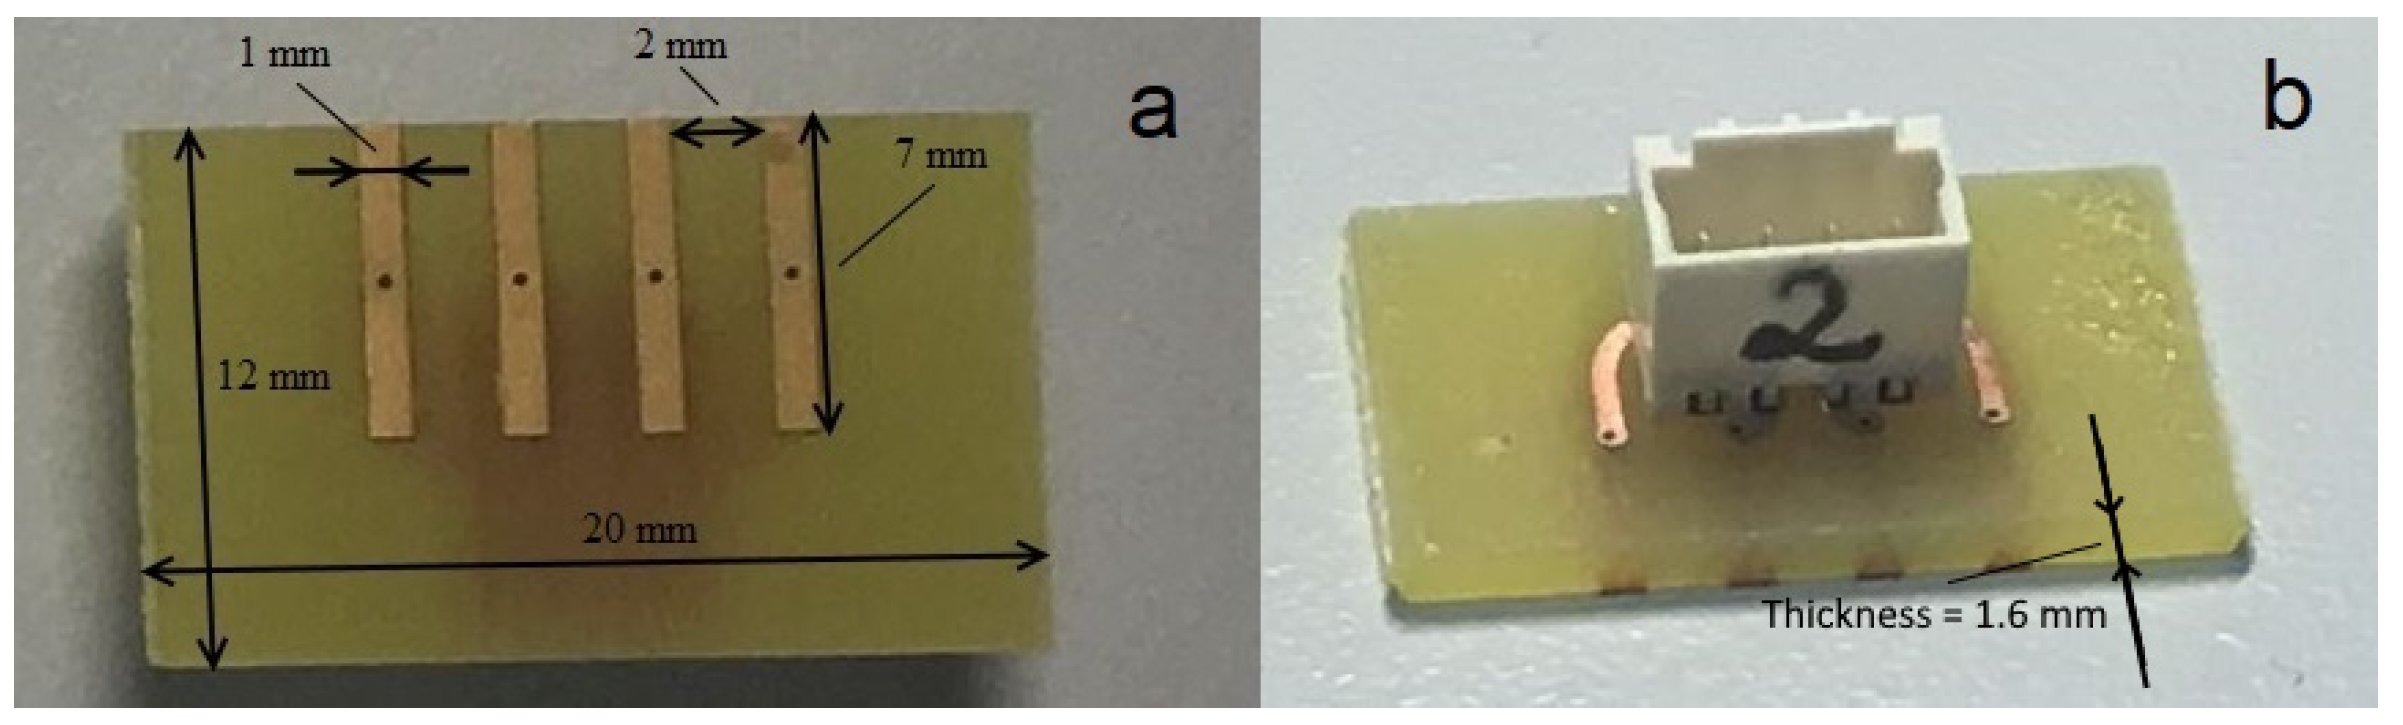
| PCB | Printed circuit board |
| CPE | Constant phase element |
References
- Chadzopulu, A.; Adraniotis, J.; Theodosopoulou, E. The therapeutic effects of mud. Prog. Health Sci. 2011, 1, 132–136. [Google Scholar]
- Gomes, C.; Carretero, M.I.; Pozo, M.; Maraver, F.; Cantista, P.; Armijo, F.; Legido, J.L.; Teixeira, F.; Rautureau, M.; Delgado, R. Peloids and pelotherapy: Historical evolution, classification and glossary. Appl. Clay Sci. 2013, 75–76, 28–38. [Google Scholar] [CrossRef]
- Schlossmann, K. Estonian Curative Sea-Muds and Seaside Health Resorts; Boreas Publishing Co., Ltd.: London, UK, 1939. [Google Scholar]
- Porowski, A.; Rman, N.; Forizs, I.; LaMoreaux, J. Introductory Editorial Thematic Issue: “Mineral and thermal waters”. Envrion. Earth Sci. 2019, 78, 526–527. [Google Scholar] [CrossRef]
- Poensin, D.; Carpentier, P.H.; Féchoz, C.; Gasparini, S. Effects of mud pack treatment on skin microcirculation. Jt. Bone Spine 2003, 70, 367–370. [Google Scholar] [CrossRef]
- Espejo, L.; Cardero, M.A.; Garrido, E.M.; Caro, B.; Torres, S. Effects of mud pack therapy on patients with knee osteoarthritis. A randomized controlled clinical trial. An. Hidrol. Médica 2012, 5, 109–121. [Google Scholar] [CrossRef]
- Huang, A.; Seité, S.; Adar, T. The use of balneotherapy in dermatology. Clin. Dermatol. 2018, 36, 363–368. [Google Scholar] [CrossRef]
- Gálvez, I.; Torres-Piles, S.; Ortega-Rincón, E. Balneotherapy, Immune System, and Stress Response: A Hormetic Strategy? Int. J. Mol. Sci. 2018, 19, 1687. [Google Scholar] [CrossRef]
- Komar, D.; Dolenec, T.; Dolenec, M.; Vrhovnik, P.; Lojen, S.; Belak, Z.L.; Kniewald, G.; Smuc, N.R. Physico-chemical and geochemical characterization of Makirina Bay peloid mud and its evaluation for potential use in balneotherapy (N Dalmatia, Republic of Croatia). Indian J. Tradit. Knowl. 2015, 1, 5–12. [Google Scholar]
- Codish, S.; Abu-Shakra, M.; Flusser, D.; Friger, M.; Sukenik, S. Mud compress therapy for the hands of patients with rheumatoid arthritis. Rheumatol. Int. 2005, 25, 49–54. [Google Scholar] [CrossRef] [PubMed]
- Artymuk, N.V.; Kira, E.F.; Kondratieva, T.A. Intravaginal gel prepared from Dead Sea peloid for treating luteal-phase defect. Int. J. Gynecol. Obstet. 2010, 108, 72–73. [Google Scholar] [CrossRef] [PubMed]
- Shani, J.; Barak, S.; Levi, D.; Ram, M.; Schachner, E.; Schlesinger, T.; Robberecht, H.; Van Grieken, R.; Avrach, W. Skin penetration of minerals in psoriatics and guinea-pigs bathing in hypertonic salt solutions. Pharmacol. Res. Commun. 1985, 17, 501–512. [Google Scholar] [CrossRef]
- Fioravanti, A.; Cantarini, L.; Guidelli, G.M.; Galeazzi, M. Mechanisms of action of spa therapies in rheumatic diseases: What scientific evidence is there? Rheumatol. Int. 2011, 31, 1–8. [Google Scholar] [CrossRef] [PubMed]
- Potpara, Z.; Duborija-Kovacevic, N. Effects of the peloid cream from the Montenegrian Adriatic coast on skin humidity, transepidermal water loss and erythema index, examined with skin bioengineering in vivo methods. Farmacia 2012, 60, 524–534. [Google Scholar]
- Qassem, M.; Kyriacou, P. Review of Modern Techniques for the Assessment of Skin Hydration. Cosmetics 2019, 6, 19. [Google Scholar] [CrossRef]
- Ng, K.W.; Lau, W.M. Skin Deep: The Basics of Human Skin Structure and Drug Penetration. In Percutaneous Penetration Enhancers Chemical Methods in Penetration Enhancement: Drug Manipulation Strategies and Vehicle Effects; Dragicevic, N., Maibach, H.I., Eds.; Springer: Berlin/ Heidelberg, Germany, 2015; pp. 3–11. [Google Scholar] [CrossRef]
- Agache, P. Measurements of the Human Skin: Why and How? In Agache’s Measuring the Skin: Non-Invasive Investigations, Physiology, Normal Constants; Humbert, P., Fanian, F., Maibach, H.I., Agache, P., Eds.; Springer International Publishing: Cham, Switzerland, 2017; pp. 5–14. [Google Scholar] [CrossRef]
- Therkildsen, P.; Haedersdal, M.; Lock-Andersen, J.; de Fine Olivarius, F.; Poulsen, T.; Wulf, H.C. Epidermal thickness measured by light microscopy: A methodological study. Skin Res. Technol. 1998, 4, 174–179. [Google Scholar] [CrossRef] [PubMed]
- Elias, P.M. Epidermal Lipids, Barrier Function, and Desquamation. J. Investig. Dermatol. 1983, 80, S44–S49. [Google Scholar] [CrossRef]
- Martinsen, O.G.; Grimnes, S. Bioimpedance and Bioelectricity Basics, 3rd ed.; Academic Press: Cambridge, MA, USA, 2014. [Google Scholar]
- Rousselle, P.; Gentilhomme, E.; Neveux, Y. Epidermal Physiology. In Agache’s Measuring the Skin: Non-Invasive Investigations, Physiology, Normal Constants; Humbert, P., Fanian, F., Maibach, H.I., Agache, P., Eds.; Springer International Publishing: Cham, Switzerland, 2017; pp. 397–405. [Google Scholar] [CrossRef]
- Van Mulder, T.; de Koeijer, M.; Theeten, H.; Willems, D.; Van Damme, P.; Demolder, M.; De Meyer, G.; Beyers, K.; Vankerckhoven, V. High frequency ultrasound to assess skin thickness in healthy adults. Vaccine 2017, 35, 1810–1815. [Google Scholar] [CrossRef] [PubMed]
- Wake, K.; Sasaki, K.; Watanabe, S. Conductivities of epidermis, dermis, and subcutaneous tissue at intermediate frequencies. Phys. Med. Biol. 2016, 61, 4376. [Google Scholar] [CrossRef]
- Martinsen, O.G.; Grimnes, S.; Haug, E. Measuring depth depends on frequency in electrical skin impedance measurements. Skin Res. Technol. 1999, 5, 179–181. [Google Scholar] [CrossRef]
- Kink, A.; Salo, R.W.; Min, M.; Parve, T.; Ratsep, I. Intracardiac Electrical Bioimpedance as a Basis for Controlling of Pacing Rate Limits. In Proceedings of the 2006 International Conference of the IEEE Engineering in Medicine and Biology Society, New York, NY, USA, 30 August–3 September 2006; pp. 6308–6311. [Google Scholar] [CrossRef]
- Min, M.; Annus, P.; Kõiv, H.; Krivošei, A.; Uuetoa, T.; Lamp, J. Bioimpedance sensing—A viable alternative for tonometry in non-invasive assessment of central aortic pressure. In Proceedings of the 2017 IEEE International Symposium on Medical Measurements and Applications (MeMeA), Rochester, MN, USA, 7–10 May 2017; pp. 373–378. [Google Scholar] [CrossRef]
- Aberg, P.; Nicander, I.; Hansson, J.; Geladi, P.; Holmgren, U.; Ollmar, S. Skin cancer identification using multifrequency electrical impedance-a potential screening tool. IEEE Trans. Biomed. Eng. 2004, 51, 2097–2102. [Google Scholar] [CrossRef]
- Kekonen, A.; Bergelin, M.; Eriksson, J.E.; Vaalasti, A.; Ylänen, H.; Viik, J. Bioimpedance measurement based evaluation of wound healing. Physiol. Meas. 2017, 38, 1373. [Google Scholar] [CrossRef] [PubMed]
- Arpaia, P.; Cesaro, U.; Moccaldi, N. Noninvasive measurement of transdermal drug delivery by impedance spectroscopy. Sci. Rep. 2017, 7, 44647. [Google Scholar] [CrossRef] [PubMed]
- Clemente, F.; Arpaia, P.; Manna, C. Characterization of human skin impedance after electrical treatment for transdermal drug delivery. Measurement 2013, 46, 3494–3501. [Google Scholar] [CrossRef]
- Tuulik, V.R.; Pille, V.; Tamm, M.; Tuulik, V.; Tint, P.; Tilk, M.; Saarik, S.; Vare, T. The effect of outpatient mud and spa-therapies on the tissue perfusion measured with laser Doppler in work related upper extremities overuse syndromes. Bol. Soc. Esp. Hidrol. Med. 2015, 30, 193–204. [Google Scholar] [CrossRef]
- Kumm, M. Termoneutraalsete muda ja turba segude mõju naha funktsionaalsele seisundile tervetel täiskasvanutel. In Terviseedenduse ja Rehabilitatsiooni Kompententsikeskuse Ravimuda Valdkonna Toimetised II; Tallinna Ülikool: Tallinn, Estonia, 2019; pp. 39–50. [Google Scholar]
- Schwan, H.P. Electrical Properties of Body Tissues and Impedance Plethysmography. IRE Trans. Med Electron. 1955, PGME-3, 32–46. [Google Scholar] [CrossRef]
- Vadi, V. Eesti Tervismuda: Balneoloogiline Uurimus; Teaduslik Kirjandus: Harjumaa, Eesti, 1947. [Google Scholar]
- Tuulik, V. Mudaraviuuringutest eile, täna ja homme. In Terviseedenduse ja Rehabilitatsiooni Kompententsikeskuse Ravimuda Valdkonna Toimetised; Tallinna Ülikool: Tallinn, Estonia, 2015; pp. 17–20. [Google Scholar]
- Darlenski, R.; Sassning, S.; Tsankov, N.; Fluhr, J. Non-invasive in vivo methods for investigation of the skin barrier physical properties. Eur. J. Pharm. Biopharm. 2009, 72, 295–303. [Google Scholar] [CrossRef]
- Harding, C.R. The stratum corneum: Structure and function in health and disease. Dermatol. Ther. 2004, 17, 6–15. [Google Scholar] [CrossRef]
- Chizmadzhev, Y.A.; Indenbom, A.V.; Kuzmin, P.I.; Galichenko, S.V.; Weaver, J.C.; Potts, R.O. Electrical Properties of Skin at Moderate Voltages: Contribution of Appendageal Macropores. Biophys. J. 1998, 74, 843–856. [Google Scholar] [CrossRef]
- Yamamoto, T.; Yamamoto, Y. Electrical properties of the epidermal stratum corneum. Med. Biol. Eng. 1976, 14, 151–158. [Google Scholar] [CrossRef] [PubMed]
- Keurentjes, A.J.; Jakasa, I.; Kezic, S. Research Techniques Made Simple: Stratum Corneum Tape Stripping. J. Investig. Dermatol. 2021, 141, 1129–1133.e1. [Google Scholar] [CrossRef]
- Prausnitz, M.; Langer, R. Transdermal drug delivery. Nat. Biotechnol. 2008, 26, 1261–1268. [Google Scholar] [CrossRef] [PubMed]
- Cima, L.F.; Mir, L.M. Macroscopic characterization of cell electroporation in biological tissue based on electrical measurements. Appl. Phys. Lett. 2004, 85, 4520–4522. [Google Scholar] [CrossRef]
- Curdy, C.; Naik, A.; Kalia, Y.N.; Alberti, I.; Guy, R.H. Non-invasive assessment of the effect of formulation excipients on stratum corneum barrier function in vivo. Int. J. Pharm. 2004, 271, 251–256. [Google Scholar] [CrossRef] [PubMed]
- Licht, T.S.; Stern, M.; Shwachman, H. Measurement of the Electrical Conductivity of Sweat: Its Application to the Study of Cystic Fibrosis of the Pancreas. Clin. Chem. 1957, 3, 37–48. [Google Scholar] [CrossRef] [PubMed]
- Martinsen, O.G.; Grimnes, S.; Lütken, C.A.; Johnsen, G.K. Memristance in human skin. J. Phys. Conf. Ser. 2010, 224, 012071. [Google Scholar] [CrossRef]
- Tronstad, C.; Johnsen, G.K.; Grimnes, S.; Martinsen, O.G. A study on electrode gels for skin conductance measurements. Physiol. Meas. 2010, 31, 1395. [Google Scholar] [CrossRef]
- Heinrich, U.; Koop, U.; Leneveu-Duchemin, M.C.; Osterrieder, K.; Bielfeldt, S.; Chkarnat, C.; Degwert, J.; Häntschel, D.; Jaspers, S.; Nissen, H.P.; et al. Multicentre comparison of skin hydration in terms of physical-, physiological- and product-dependent parameters by the capacitive method (Corneometer CM 825). Int. J. Cosmet. Sci. 2003, 25, 45–53. [Google Scholar] [CrossRef]
- Constantin, M.M.; Poenaru, E.; Poenaru, C.; Constantin, T. Skin Hydration Assessment through Modern Non-Invasive Bioengineering Technologies. Maedica 2014, 9, 33–38. [Google Scholar]
- Pierard-Franchimont, C.; Pierard, G.E. Sweat Gland Awakening on Physical Training: A Skin Capacitance Mapping Observation. Clin. Res. Dermatol. Open Access 2015, 2, 1–4. [Google Scholar] [CrossRef]
- Lackermeier, A.H.; McAdams, E.T.; Moss, G.P.; Woolfson, A.D. In Vivo ac Impedance Spectroscopy of Human Skin: Theory and Problems in Monitoring of Passive Percutaneous Drug Delivery. Ann. N. Y. Acad. Sci. 1999, 873, 197–213. [Google Scholar] [CrossRef]
- Gómez-Aguilar, F.; Bernal-Alvarado, J.; Rosales-García, J.; Guía-Calderón, M.; Córdova-Fraga, T.; Sosa-Aquino, M. Frequency response of an electric equivalent circuit for a skin type system. Rev. Mex. Ing. Bioméd. 2011, 32, 93–99. [Google Scholar]
- Hirschorn, B.; Orazem, M.E.; Tribollet, B.; Vivier, V.; Frateur, I.; Musiani, M. Determination of effective capacitance and film thickness from constant-phase-element parameters. Electrochim. Acta 2010, 55, 6218–6227. [Google Scholar] [CrossRef]
- Martinsen, O.G.; Grimnes, S. On using single frequency electrical measurements for skin hydration assessment. Innov. Tech. Biol. Med. 1998, 19, 395–399. [Google Scholar] [CrossRef]
- Terasmaa, J.; Kapanen, G.; Marzecova, A.; Rautam, S. Eesti ravimuda seisund ja koostis. In Terviseedenduse ja Rehabilitatsiooni Kompententsikeskuse Ravimuda Valdkonna Toimetised; Tallinna Ülikool: Tallinn, Estonia, 2015; pp. 22–35. [Google Scholar]
- Robertson, K.; Rees, L.J. Variation in Epidermal Morphology in Human Skin at Different Body Sites as Measured by Reflectance Confocal Microscopy. Acta Derm.-Venereol. 2010, 90, 368–373. [Google Scholar] [CrossRef] [PubMed]
- Kuang, W.; Nelson, S.O. Low-frequency dielectric properties of biological tissues: A review with some new insights. Trans. ASAE 1998, 41, 173–184. [Google Scholar] [CrossRef]
- McAdams, E. Bioelectrodes. In Encyclopedia of Medical Devices and Instrumentation; John Wiley & Sons, Ltd.: Hoboken, NJ, USA, 2006. [Google Scholar] [CrossRef]
- Ivanic, R.; Novotny, I.; Rehacek, V.; Tvarozek, V.; Weis, M. Thin film non-symmetric microelectrode array for impedance monitoring of human skin. Thin Solid Film. 2003, 433, 332–336. [Google Scholar] [CrossRef]
- Kekonen, A.; Bergelin, M.; Johansson, M.; Kumar Joon, N.; Bobacka, J.; Viik, J. Bioimpedance Sensor Array for Long-Term Monitoring of Wound Healing from Beneath the Primary Dressings and Controlled Formation of H2O2 Using Low-Intensity Direct Current. Sensors 2019, 19, 2505. [Google Scholar] [CrossRef]
- Zurich Instruments. HF2 User Manual—ziControl Edition; Zurich Instruments: Zurich, Switzerland, 2019. [Google Scholar]
- Metshein, M.; Annus, P.; Land, R.; Min, M.; Aabloo, A. Availability and variations of cardiac activity in the case of measuring the bioimpedance of wrist. In Proceedings of the 2018 IEEE International Instrumentation and Measurement Technology Conference (I2MTC), Houston, TX, USA, 14–17 May 2018; pp. 1–5. [Google Scholar] [CrossRef]
- Lu, F.; Wang, C.; Zhao, R.; Du, L.; Fang, Z.; Guo, X.; Zhao, Z. Review of Stratum Corneum Impedance Measurement in Non-Invasive Penetration Application. Biosensors 2018, 8, 31. [Google Scholar] [CrossRef]
- McCormick, C.; Heath, D.; Connolly, P. Minimally Invasive Sensing. In Biosensors; Serra, P.A., Ed.; IntechOpen: Rijeka, Croatia, 2011; Chapter 18. [Google Scholar] [CrossRef]
- Gabriel, S.; Lau, R.W.; Gabriel, C. The dielectric properties of biological tissues: II. Measurements in the frequency range 10 Hz to 20 GHz. Phys. Med. Biol. 1996, 41, 2251. [Google Scholar] [CrossRef]
- Martinsen, O.G.; Grimnes, S. Long-Term Effect of Some Skin Moisturizers. Open Dermatol. J. 2008, 2, 87–89. [Google Scholar] [CrossRef]
- Chan, Y.H. Biostatistics 104: Correlational analysis. Singap. Med. J. 2003, 44, 614–619. [Google Scholar]
- Li, S.; Suh, W.; Parikh, H.H.; Ghanem, A.H.; Mehta, S.C.; Peck, K.D.; Higuchi, W.I. Lag time data for characterizing the pore pathway of intact and chemically pretreated human epidermal membrane. Int. J. Pharm. 1998, 170, 93–108. [Google Scholar] [CrossRef]
- Dąbrowska, A.K.; Spano, F.; Derler, S.; Adlhart, C.; Spencer, N.D.; Rossi, R.M. The relationship between skin function, barrier properties, and body-dependent factors. Skin Res. Tech. 2018, 24, 165–174. [Google Scholar] [CrossRef]
- Morimoto, Y.; Hatanaka, T.; Sugibayashi, K.; Omiya, H. Prediction of Skin Permeability of Drugs: Comparison of Human and Hairless Rat Skin. J. Pharm. Pharmacol. 1992, 44, 634–639. [Google Scholar] [CrossRef] [PubMed]
- Karande, P.; Jain, A.; Mitragotri, S. Relationships between skin’s electrical impedance and permeability in the presence of chemical enhancers. J. Control. Release 2006, 110, 307–313. [Google Scholar] [CrossRef]
- Yamamoto, Y.; Yamamoto, T. Characteristics of skin admittance for dry electrodes and the measurement of skin moisturisation. Med. Biol. Eng. Comput. 1986, 24, 71–77. [Google Scholar] [CrossRef] [PubMed]


| Age ± σ | Weight ± σ (kg) | Height ± σ (cm) | BMI ± σ |
|---|---|---|---|
| 32.5 ± 3.1 | 75.5 ± 15.6 | 1.76 ± 0.07 | 24.19 ± 3.87 |
| Frequency Interval | ||||||
|---|---|---|---|---|---|---|
| 100 Hz–0 kHz | 0.914 | 0.578 | 0.912 | 0.668 | 0.999 | 0.986 |
| 10 kHz–1 MHz | 0.954 | 0.976 | 0.993 | 0.998 | 0.943 | 0.975 |
| 1 MHz–20 MHz | 0.795 | 0.999 | 0.671 | 0.999 | 0.978 | 0.999 |
| Full | 0.926 | 0.968 | 0.92 | 0.962 | 0.999 | 0.996 |
| Frequency Interval | ||||||
|---|---|---|---|---|---|---|
| 100 Hz–10 kHz | 0.867 | 0.765 | 0.965 | 0.931 | 0.962 | 0.934 |
| 10 kHz–1 MHz | 0.928 | 0.996 | 0.98 | 0.983 | 0.97 | 0.979 |
| 1 MHz–20 MHz | 0.967 | 0.942 | 0.953 | 0.92 | 0.997 | 0.997 |
| Full | 0.939 | 0.932 | 0.938 | 0.926 | 0.991 | 0.984 |
| Frequency Interval | ||||||
|---|---|---|---|---|---|---|
| 100 Hz–10 kHz | 0.927 | 0.816 | 0.827 | 0.771 | 0.88 | 0.839 |
| 10 kHz–1 MHz | 0.166 | 0.681 | 0.941 | 0.956 | -0.064 | 0.83 |
| 1 MHz–20 MHz | 0.941 | 0.942 | 0.945 | 0.92 | 0.999 | 0.999 |
| Full | 0.939 | 0.795 | 0.856 | 0.648 | 0.9 | 0.801 |
| Frequency Interval | G | B | R | X |
|---|---|---|---|---|
| 100 Hz–10 kHz | water | water | mud | mud |
| 10 kHz–1 MHz | water | mud | water | water |
| 1 MHz–20 MHz | mud | mud | converged | mud |
Disclaimer/Publisher’s Note: The statements, opinions and data contained in all publications are solely those of the individual author(s) and contributor(s) and not of MDPI and/or the editor(s). MDPI and/or the editor(s) disclaim responsibility for any injury to people or property resulting from any ideas, methods, instructions or products referred to in the content. |
© 2023 by the authors. Licensee MDPI, Basel, Switzerland. This article is an open access article distributed under the terms and conditions of the Creative Commons Attribution (CC BY) license (https://creativecommons.org/licenses/by/4.0/).
Share and Cite
Metshein, M.; Tuulik, V.-R.; Tuulik, V.; Kumm, M.; Min, M.; Annus, P. Electrical Bioimpedance Analysis for Evaluating the Effect of Pelotherapy on the Human Skin: Methodology and Experiments. Sensors 2023, 23, 4251. https://doi.org/10.3390/s23094251
Metshein M, Tuulik V-R, Tuulik V, Kumm M, Min M, Annus P. Electrical Bioimpedance Analysis for Evaluating the Effect of Pelotherapy on the Human Skin: Methodology and Experiments. Sensors. 2023; 23(9):4251. https://doi.org/10.3390/s23094251
Chicago/Turabian StyleMetshein, Margus, Varje-Riin Tuulik, Viiu Tuulik, Monika Kumm, Mart Min, and Paul Annus. 2023. "Electrical Bioimpedance Analysis for Evaluating the Effect of Pelotherapy on the Human Skin: Methodology and Experiments" Sensors 23, no. 9: 4251. https://doi.org/10.3390/s23094251
APA StyleMetshein, M., Tuulik, V.-R., Tuulik, V., Kumm, M., Min, M., & Annus, P. (2023). Electrical Bioimpedance Analysis for Evaluating the Effect of Pelotherapy on the Human Skin: Methodology and Experiments. Sensors, 23(9), 4251. https://doi.org/10.3390/s23094251